 Md. Mahbubur Rahman1
 Ved Prakash1Sunil Chandel1*D. G. Thakur1Robert Čep2Nitin Khedkar3
 Sachin Salunkhe4
 Emad S. Abouel Nasr5
- 1Department of Mechanical Engineering, Defence Institute of Advanced Technology (DU), Pune, India
- 2Department of Machining, Assembly and Engineering Metrology, Faculty of Mechanical Engineering, VSB-Technical University of Ostrava, Ostrava, Czechia
- 3Department of Mechanical Engineering, Symbiosis International University, Pune, Maharashtra, India
- 4Department of Mechanical Engineering, Vel Tech Rangarajan Dr. Sagunthala R&D Institute of Science and Technology, Chennai, India
- 5Department of Industrial Engineering, College of Engineering, King Saud University, Riyadh, Saudi Arabia
In the present work, an investigation of the aerodynamic characteristics of an ejection seat occupant is carried out using the commercially available computational fluid dynamics software ANSYS Fluent. 3D Reynolds-averaged Navier–Stokes equations are solved to obtain the aerodynamic coefficients of the ejection seat system. For this analysis, an unstructured grid is generated for the ejection seat occupant using ANSYS meshing. Validation is carried out and the performance of three different turbulence models is analyzed at Mach 0.6. Based on the most suitable turbulence model, further analysis of the aerodynamic coefficients of the ejection seat occupant is calculated at Mach numbers of 0.35, 0.45, 0.55, 0.65, and 0.75. For all values of Mach, the angle of attack is varied from −15° to 15° in 5° increments and the yaw angle is varied from 0° to 60° in 10° increments. Based on the results, it is observed that the magnitude of the axial force decreases with increasing angle of attack and yaw angle. Similarly, the normal force coefficient and pitching moment coefficient decrease with increasing angle of attack. Finally, the side force coefficient, yawing moment, and rolling moment coefficients increase with increasing yaw angle.
1 Introduction
The ejection seat system is one of the crucial components of an aircraft, required during catastrophic conditions. The requirement for an ejection seat system mainly pertains to military aircraft. Investigation of ejection seat systems was initiated before World War II by Germany and Sweden. Before World War II, ejection seat systems were designed specifically for aircraft running at subsonic and transonic speeds. However, the need for an improved ejection seat system was raised in 1947 after the inauguration of the Bell X-1, as this aircraft can fly at Mach number (Ma) 1.0 (Hallion, 1972).
A complete ejection seat system is primarily divided into two main segments. The canopy of the aircraft is jettisoned in the first segment, and later, in the second segment, the pilot (along with the ejection seat) escapes to a safe environment. Many factors are responsible for a successful ejection process, including pulling of the ejection handle, initiation of the canopy jettison rocket motors, and triggering of the explosive charge inside the ejection seat catapult. The full process of the ejection seat system is usually complete within a very small number of seconds. As a result, it is crucial to analyze the aerodynamic characteristics of the ejection seat system in relation to the pilot’s safety, as a number of incidents have occurred in previous decades (Epstein et al., 2020). This seat ejection analysis can be conducted either experimentally or numerically.
A wind tunnel investigation of an encapsulated ejection seat occupant attached to a rigid wing recovery system was performed by Burk (Burk, 1970) at subsonic speed to measure the static longitudinal and lateral aerodynamic characteristics. For all ejection seat configurations, the lift coefficient varied greatly, and these configurations were longitudinally unstable. A comparison showed that the scale effects of the wings were substantial in terms of the maximum lift–drag ratio. Reichenau (Reichenau, 1972) performed an experimental analysis of an ejection seat system with different bridle assemblies for parachute attachment, along with a drogue parachute, to determine the aerodynamic stability of the escape seat during its separation from the aircraft. Performance was recorded with and without the rocket jet plume. At Ma = 0.3, the effect of jet exhaust on stability was significant, while at higher Mach numbers, its effect was insignificant. Variation in yaw angle, from 0° to 15°, had little impact on longitudinal stability. The drag coefficient of the parachute increased with use of the jet.
The effects of rocket exhaust, crew member’s hand position, altitude, and Mach number on the aerodynamic characteristics of the ejection seat were analyzed by White (1974). The effects of different altitudes (including sea level and 10,000, 20,000, 30,000, and 40,000 ft) on the aerodynamic coefficients, with and without a rocket catapult, were simulated. There was a negligible effect of altitude on the aerodynamic coefficients at rocket-off condition, whereas significant variation was observed at the rocket on simulation. Hawker and Payne (1979) investigated the effect of asymmetric configurations of the pilot’s position on the aerodynamic forces and moments on the entire seat system. Their results indicated that the orientations of the seat, the pilot’s arms and legs, the pilot’s position on the seat, etc., have a significant impact on the stability of the seat during the ejection process. Additionally, stability with respect to orientationsincreases drastically at high Ma. Dehua et al. (2006) conducted an aerodynamic performance analysis using wind tunnel tests with the help of a patented wall support system known as SWSRA. Their results indicated that the testing method developed by the authors is a promising one for analysis of ejection seat systems. Reichenau (1987); Reichenau (1988) experimentally investigated a full-scale ejection seat with a female and a male pilot to observe the aerodynamic coefficients with variation in Ma. They also performed an aerodynamic analysis of a half-scale CREST ejection seat at different Ma values. It became clear from the wind tunnel tests that the ejection seat’s orientation has a major effect on the forces acting on the pilot. However, these experiments are very costly and time-consuming, as well as imposing limitations on the parameters that can be considered.
Due to the development in computational fluid dynamics (CFD) that has occurred over the past few decades, this method is used conveniently in various applications of fluid mechanics (Rahman and Islam, 2019; Guerrero et al., 2022; Chen et al., 2023). Compared to experimental analysis, CFD analysis is less costly, requires less time, and can be conducted with variations in different parameters. In the past 30 years, many researchers have analyzed the aerodynamic characteristics of ejection seat systems by varying different parameters. Caruso and Mendenhall (1992) studied the aerodynamic coefficients of an ejection seat system using structured and unstructured grids. The analysis was performed for two different seat configurations, considering flow to be laminar. However, they also compared their 2D simulated results with 3D experimental data. In 1992, Habchi et al. (1992) investigated the aerodynamic coefficients of an ejection seat using the k-ε turbulence model. The effectiveness of yaw fins with a 3D navy ejection seat was also analyzed. A 3D time-dependent analysis of the ejection seat occupant of F-16 aircraft was performed by Baum and Loehner (1993). They measured the aerodynamic characteristics for a compressible inviscid flow, in an analysis in which the moving reference frames were handled using the Arbitrary Lagrangian Eulerian (ALE) formulation.
Simple blunt body problems were first analyzed and validated with experimental data prior to an analysis of the ejection seat system by Hufford and Habchi (1994), as experimental data for all the seat configurations were limited. Initially, 2D analysis was performed on a cylinder and a half cylinder; 3D analysis was subsequently conducted on a sphere, as the ejection seat is a 3D problem. In 1995, Habchi and Hufford, (1995) performed another analysis based on transient simulation for a 2D and 3D ejection seat. The unsteady simulated results were compared to the steady state results as well as experimental results. Initially, the analysis was performed on a cylinder; the authors then moved to 2D and 3D analysis of the ejection seat system. A detailed analysis was conducted in the case of a 2D ejection seat compared to a 3D ejection seat.
Marquette et al. (1997) investigated the aerodynamic coefficients of an ejection seat along with the rocket plume. A rocket plume is an essential device used with the ejection seat system for providing extra thrust to safely eject the pilot from the cockpit without any collision with the tail of the aircraft. For this analysis, the standard k-ε turbulent model with wall function was used. The effectiveness of using thrust vector control plumes on the ejection seat occupant was analyzed by Kenzakowski et al. (1997). Validation of this CFD methodology was carried out using an axisymmetric half-cylinder. Subsequently, analysis of the 2D and 3D ejection seat occupant was performed.
The aerodynamic characteristics of an ejection seat were measured experimentally as well as numerically by Chen et al. (2007). The experimental analysis was conducted in a transonic/supersonic wind tunnel in which a scaled-down model was held using a patented wall support system known as SWSRA. Unstructured grids were used for the numerical analysis to resolve the 3D compressible Navier–Stokes equations. The detached Eddy Simulation model, based on the Spalart–Allmaras turbulence model, was used by Zhang and Wei (2009) to investigate the aerodynamic characteristics of ejection seats using an unstructured grid. The aerodynamic characteristics of the ejection seats of A-10 and F-16 aircraft were analyzed by Tyler and Burkinshaw (2010). They measured aerodynamic loads on the pilot to identify the less hazardous aircraft. A chimera grid methodology was employed by Zh et al. (2011) to determine the aerodynamic coefficients of an ejection seat occupant. The analysis was performed in CFD-FASTRAN using a density-based solver with the k-ε turbulent model. A full-scale ACES-II ejection seat was used for validation of the experimental results. After validation, a transient simulation was performed to observe the dynamic separation of the seat and the aircraft. The effect of the use of protective devices on the aerodynamic coefficients of the ejection seat occupant was investigated by Tian and Chen (2012)). Two models were analyzed, one with the protective device and another without the protective device, to observe the effects on the aerodynamic coefficients. Finally, Guan et al. (2013) investigated the aerodynamic characteristics of an ejection seat (TY-5) using the k-ε turbulent model. Two different models were analyzed: one with arm-holders and another without arm-holders.
Although numerous investigations have been conducted on ejection seat systems for different Ma values, such analyses have not previously been performed for Ma = 0.35, 0.45, 0.55, 0.65, and 0.75 with varying angle of attack (α) and yaw angle (β). During the ejection process, the orientation of the ejection seat system is unpredictable; therefore, in order to understand the aerodynamic behavior of the ejection seat at different Ma under varying α and β, generation of a dataset is required. This was the motivation for the present study, which constitutes a 3D numerical analysis of an ejection seat system, with its occupant, for variable Ma (0.35, 0.45, 0.55, 0.65, and 0.75) using an ANSYS Fluent solver. The analysis is performed by varying the angle of attack (α) and the yaw angle (β) from −15° to 15° and from 0° to 60°, respectively. Three different turbulence models are also compared to identify a suitable turbulence model at Ma = 0.6. The results show that the values of the aerodynamic coefficients increase with increasing Ma.
2 Methodology
2.1 Computational model
A 3D model of the ejection seat with the occupant was prepared using the commercially available CAD software SolidWorks. A simplified model of the ejection seat occupant was prepared, as the actual system is highly complicated. To validate the experimental results, the projected frontal surface area of the model was kept as same as that of the full-scale F-101 ejection seat. The 3D computational domain of this analysis, as shown in Figure 1, was extended 20 m in the upstream direction and 25 m in the downstream direction. The radial distance of the domain from the Seat Reference Point (SRP) of the model was 10 m.
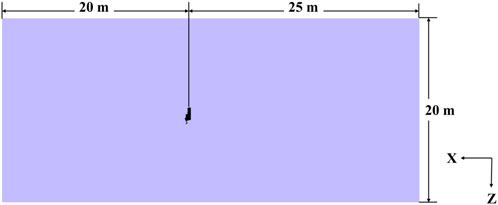
FIGURE 1. Details of the 3D computational domain.
The coordinate system of the ejection seat occupant is displayed in Figure 2, where the origin is situated at the SRP of the model. The X-axis of the model is positive in the direction of pilot faces, while the Y-axis is positive in the rightward direction of the model, and the Z-axis is positive from the direction from the head to the feet.
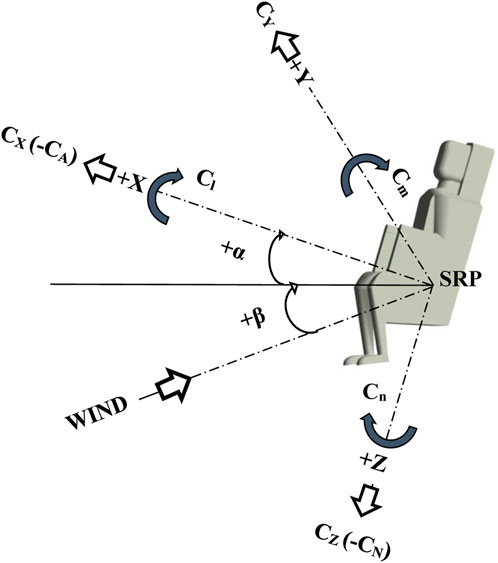
FIGURE 2. Body coordinate system with aerodynamic coefficients and angles.
The value of α is determined by the rotation of the model about the Y-axis, and the value is positive in the clockwise direction. In contrast, rotation about the Z-axis determines the value of β, and this is positive when the model rotates in the left-to-right direction.
Air is considered as the working fluid during this investigation. The flow becomes compressible when Ma increases above 0.3. Hence, variation in density is considered during this analysis and calculated using the ideal gas law. The Sutherland equation is used to determine the viscosity of the air.
2.2 Governing equations
A 3D compressible Navier–Stokes equation was employed to analyze the aerodynamic characteristics of the ejection seat using an ANSYS Fluent solver (Fluent ANSYS, 2016). To obtain the fully converged solution for the flow, the three governing equations of the compressible flow must be conserved. These three governing equations are conservation of mass, momentum, and energy.
The conservation of mass, also known as the continuity equation, is given in Equation 1:
The conservation of momentum in the x, y, and z directions is represented by Equations 2–4, respectively:
X-component:
Y-component:
Z-component:
Finally, the conservation of energy is represented by Equation 5:
Based on the frontal reference area and frontal reference length of the model, the aerodynamic coefficients were computed. The reference length was the diameter of a circle with equal area to the reference area of the model, and the frontal reference area was the projected frontal area of the model at α = 0° and β = 0°. The aerodynamic coefficients were calculated using Equations 6, 7.
2.3 Boundary conditions
For this analysis, a cylindrical domain was used, in which the pressure far-field boundary was considered at the inlet and the pressure outlet at the outlet of the domain, while the cylindrical surface was under symmetric conditions. The surface of the model was assumed to be a stationary wall with the no-slip condition. The boundary conditions of the 3D computational domain are shown in Figure 3. The operating pressure was 0 Pa for this analysis. The CFD results at Ma 0.6 were validated using the experimental results. Further analysis of the aerodynamic coefficients was performed at Ma = 0.35, 0.45, 0.55, 0.65, and 0.75 by changing the values of α and β.
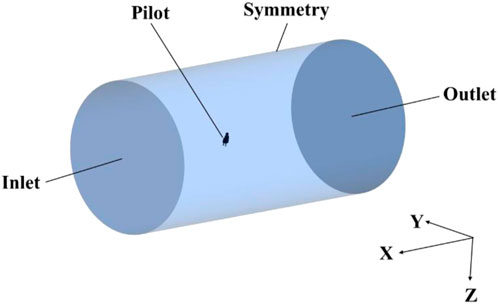
FIGURE 3. Boundary conditions of the computational domain.
2.4 Numerical computations
The complete computational domain was meshed using ANSYS meshing software. As the model is complicated, initially an unstructured grid of the tetrahedron elements was generated. Later, the tetrahedron grid was transformed into a polyhedral grid using ANSYS Fluent to decrease the number of elements and obtain a high-quality grid. To capture the boundary layer accurately, the wall y+ value was kept around 32. The grid near the model was kept fine, with adequate prism cells to capture the flow details accurately, while the remainder of the domain used a coarser mesh where the flow features were insignificant. The overall mesh quality was kept above the acceptable level. The detailed computational grid is displayed in Figure 4.
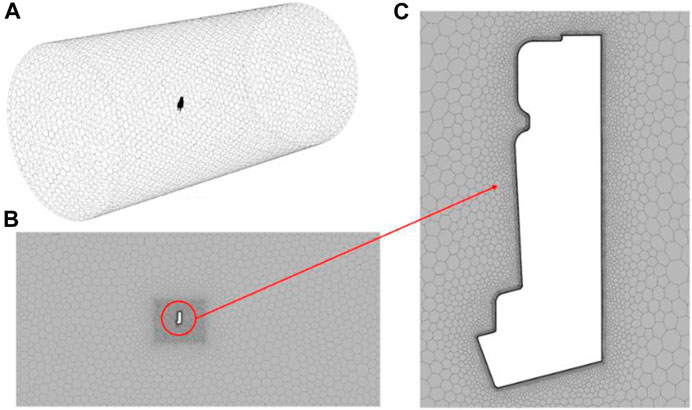
FIGURE 4. 3D mesh model: (A) 3D volume grid; (B) grid around the model on the symmetry plane; (C) zoomed-in view of the grid near the surface of the pilot.
A mesh convergence study, shown in Table 1, was carried out for four different mesh sizes at Ma = 0.6. Of these four mesh configurations, the Mesh 3 and Mesh 4 configurations gave close values to those obtained in the experimental results. As the number of elements in the Mesh 3 configuration was lower than that in the Mesh 4 configuration, the former was used for further analysis.
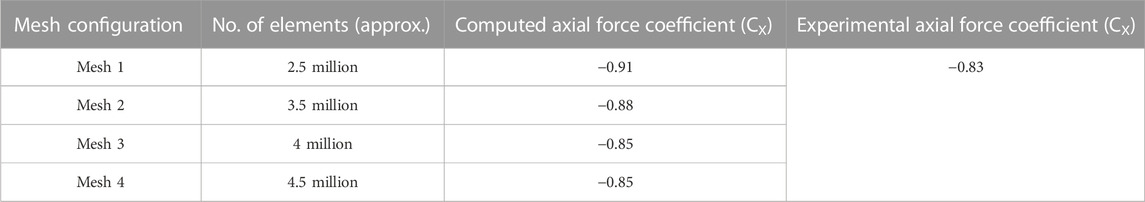
TABLE 1. Mesh independence test.
2.5 Comparison of different turbulence models
To identify an appropriate turbulence model, Spalart–Allmaras, k-ε, and k-ω SST turbulence models were compared with one another; these models predictedresults close to the experimental results of White (1974) at Ma = 0.6. The comparison was performed at α = −15°, −10°, −5°, 0°, 5°, 10°, and 15°. Figure 5 displays a comparison of the various turbulence models: as illustrated, the predictions of the k-ε turbulence model were close to the experimental results. Therefore, further analysis at different Ma was performed based on the k-ε turbulence model.
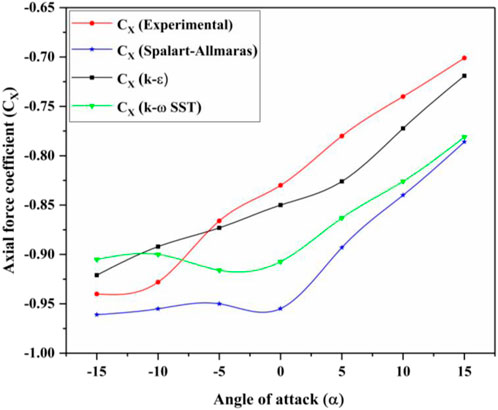
FIGURE 5. Comparison of the computed values for CX using various turbulence models and experimental results.
2.6 Validation of the numerical method
The analysis was performed using a density-based solver with steady-state conditions. An implicit Roe FDS algorithm with second-order spatial discretization was used to obtain more accurate results. For this analysis, the standard k-ε turbulence model with wall function was used. Convergence was considered to be achieved when all the aerodynamic coefficients were steady and the residual values were less than 10–4 for all variables. Validation of the model with the experimental results of White (1974) was performed at Ma = 0.6. Free-stream inlet velocity, pressure, and temperature were considered to be 204.72 m/s, 47,500 Pa, and 290 K, respectively. The free-stream turbulence quantities used were k = 0.1 J/kg and ε = 7.114 m2/s3. A similar boundary condition was used for validation by Zh et al. (2011). At 0.6 Ma, validation was performed at α = −15°, −10°, −5°, 0°, 5°, 10°, and 15°. For all values of α, similar boundary conditions were used. Figures 6, 7 present a comparison of the aerodynamic coefficients predicted with the experimental results at 0.6 Ma. From the figures, it can be observed that the computed aerodynamic coefficients represented quite similar results and followed the same trends as the experimental results.
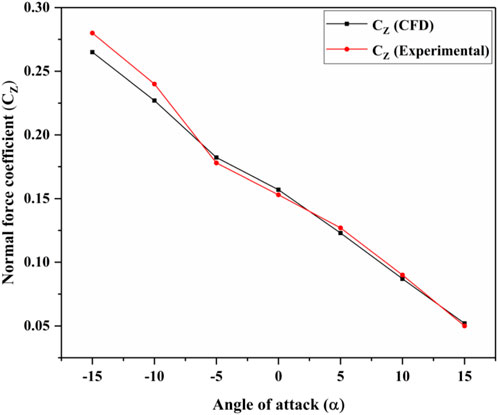
FIGURE 6. Comparison of the computed and experimental results for the normal force coefficient (CZ).
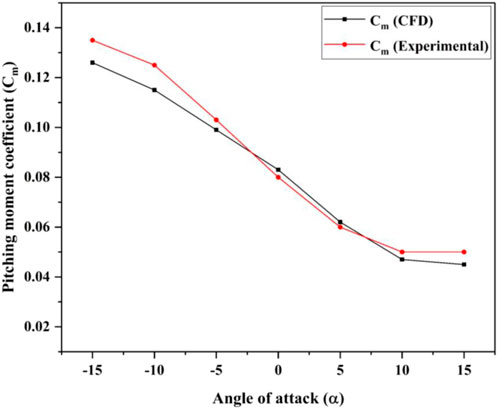
FIGURE 7. Comparison of the computed and experimental results for the pitching moment coefficient (Cm).
3 Results and discussion
3.1 Effects of angle of attack on the ejection seat system
3.1.1 Flow characteristics and pressure distribution on the ejection seat system
The static pressure contours on the mid-plane of the model for α = −15° to 15° at Ma = 0.75 are shown in Figure 8. Based on the contours, it can be observed that the front surface of the model is subjected to high pressure, whereas the back surface is subjected to low pressure. The high-pressure region develops as a result of the upcoming freestream, whereas the low-pressure region is created because of the presence of vortices near the back of the model. The flow separation at the sharp edges creates two vortices with clockwise (CW) and counterclockwise (CCW) rotation at the top and bottom of the model, respectively, as illustrated in Figure 9. Variation in α alters the pressure difference between the front and back of the model. At α = −15°, the pressure on the front surface of the model is relatively high; this decreases with an increase in α. Additionally, the higher-pressure region shifts toward the legs of the pilot with an increase in α. The variation in the low-pressure region with an increase in α is insignificant, as illustrated in Figure 8. A similar pressure distribution has also been observed by Guan et al. (2013), in which the pressure on the surface of the pilot surface was found to increase with increasing α.
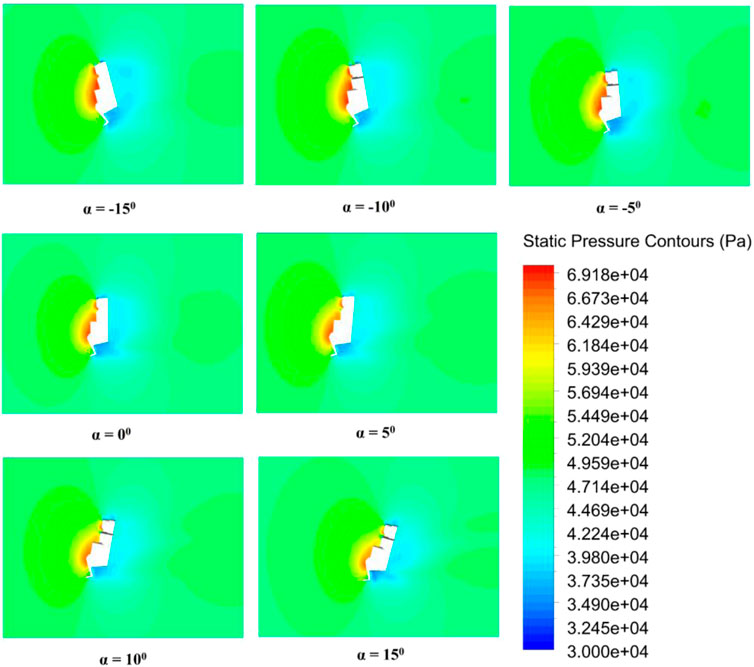
FIGURE 8. Static pressure contours on the mid-plane of the model for different α at Ma = 0.75.
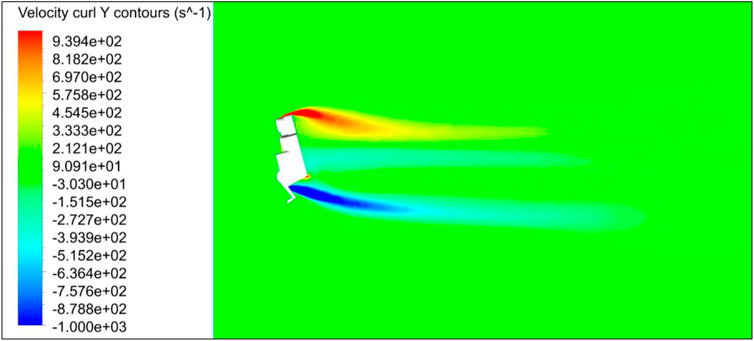
FIGURE 9. Vorticity contour on the mid-plane of the model at α = −15° and Ma = 0.75.
At α = −15°, a low-pressure area develops behind the pilot’s legs, while the higher-pressure area is near the upper part of the frontal surface. This creates a resultant force having a higher inclination with respect to the direction of the freestream. With increasing α, the higher-pressure region moves towards the bottom part of the pilot, as shown in the figure. This results in a decrease in the inclination of the resultant force. Hence, its vertical component (that is, CZ) decreases with increasing α. Similarly, due to the decrease in the intensity of higher pressure with increasing α, a lower value of CX is obtained at higher α. For all other Ma, similar patterns in the contours were observed.
3.1.2 Aerodynamic characteristics of the ejection seat system
Variation in the aerodynamic coefficients at Ma = 0.35, 0.45, 0.55, 0.65, and 0.75 is shown in Figures 10–12. The effect on CX of changing α at different Ma is displayed in Figure 10. As this figure illustrates, the magnitude of CX increases with decreasing α, similarly to the findings of Guan et al. (2013). The maximum magnitude of CX is found at α = −15°. This effect is primarily caused by the pressure difference between the front and rear surfaces of the ejection seat occupant. With decreasing values of α from 15° to −15°, the pressure difference between these two surfaces also changes, and ultimately, variation in CX occurs. Figure 10 also illustrates the finding that the magnitude of CX increases increasing Ma, with magnitude being highest at Ma = 0.75. However, the increment in CX is nonlinear. White (1974) has also observed that CX increases with increasing Ma, reporting a similar trend.
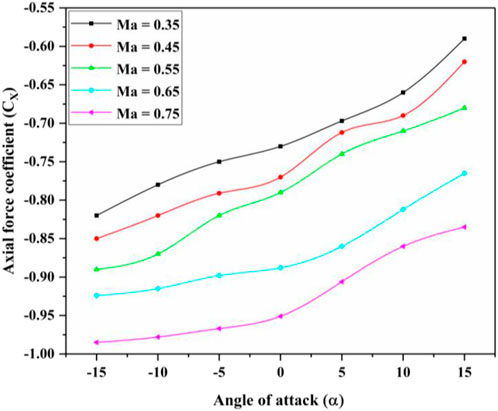
FIGURE 10. Effect of Ma on CX for different values of α at β = 0° (taking SRP as the moment reference center).
The variation in CZ with variation in α is displayed in Figure 11. As this figure illustrates, the value of CZ increases with decreasing α. As the value of α decreases, the region of higher pressure shifts towards the upper portion, while the region of lower pressure shifts towards the lower portion of the pilot. Therefore, at α = −15°, the resultant force is at its maximum compared to the other values of α examined. As illustrated in Figure 11, CZ additionally increases with increasing Ma, and the value of CZ is highest at Ma = 0.75. An experimental study performed by White (1974) also found that the value of CZ increases with decreasing α and increasing Ma, as in the current study.
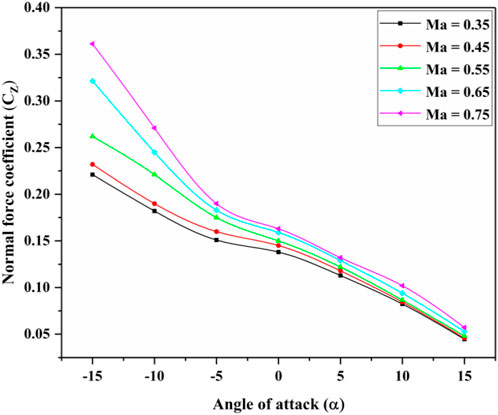
FIGURE 11. Effect of Ma on CZ for different values of α at β = 0° (taking SRP as the moment reference center).
The variation in Cm with variation in α is displayed in Figure 12. From the figure, it is evident that the value of Cm decreases with increasing α, following Guan et al. (2013). Figure 12 also indicates that Cm increases with increasing Ma, with the value of Cm being highest at Ma = 0.75.
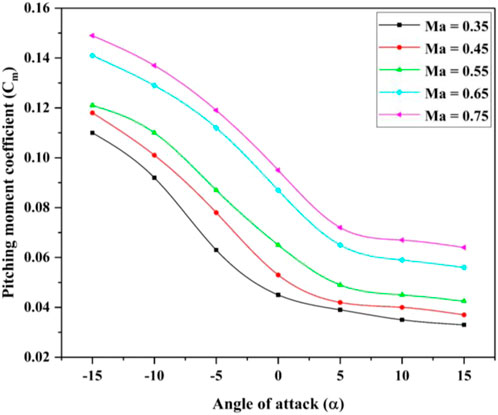
FIGURE 12. Effect of Ma on Cm for different values of α at β = 0° (taking SRP as the moment reference center).
3.2 Effects of yaw angle on the ejection seat system
3.2.1 Pressure distribution on the ejection seat system at subsonic speed
Static pressure contours on the surface of the model for β = 0°, 10°, 20°, 30°, 40°, 50°, and 60° at Ma = 0.75 are displayed in Figure 13. As this figure illustrates, at β = 0°, the front surface of the model is directly exposed to the freestream. At this angle, most of the occupant’s body parts are exposed to the freestream. As β increases from 0° to 60°, the high-pressure region moves from the right to the left of the model. Hence, at β = 60°, the left side of the model is heavily exposed to the freestream compared to its exposure at β = 0°. Similar contours are observed for all other values of Ma.
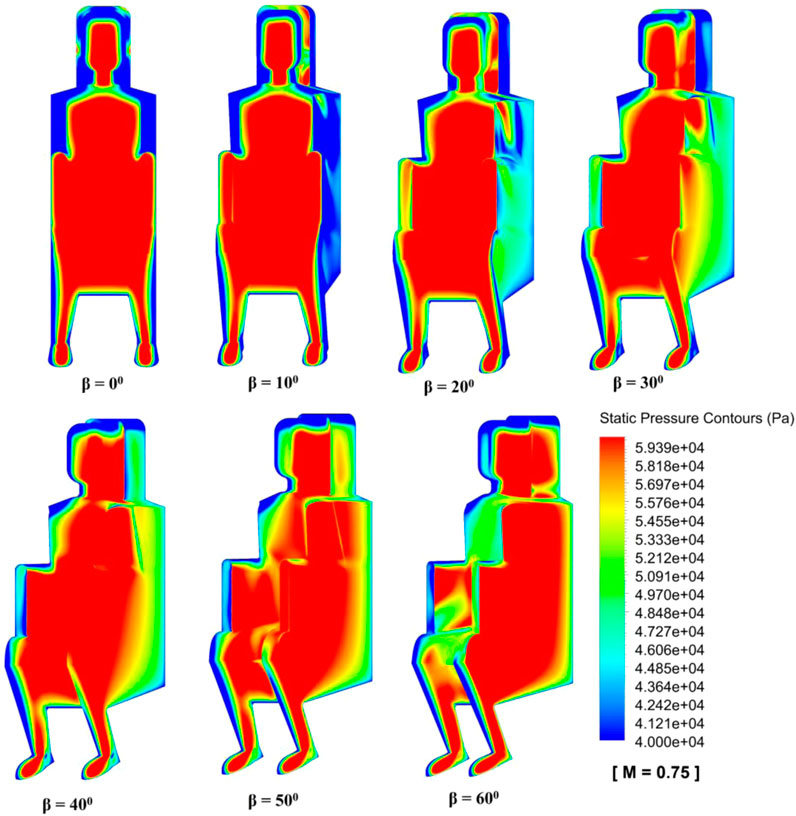
FIGURE 13. Static pressure contours on the surface of the pilot for different values of β at Ma = 0.75.
3.2.2 Aerodynamic characteristics of the ejection seat system
The effect of variation in β at α = 0° on the aerodynamic coefficients of the model is shown in Figures 14–17. As β changes from 0° to 60°, the values of the aerodynamic coefficients also change. The variation in CX is shown in Figure 14. At β = 0°, the front surface of the model is directly exposed to the freestream, which creates a large amount of pressure on the front surface of the model. The magnitude of CX is large at this value of β, as the maximum pressure difference is found at this point. However, as soon as β increases above 0°, the pressure difference also changes. When β increases from 0° to 60°, the model also rotates to the right. As it does so, the area of the model exposed to the freestream moves to the left. The effect of this is to cause a reduction in CX with increasing β. Guan et al. (2013) also observed that the magnitude of CX decreases with increasing β, as in the present study. Based on Figure 14, it can also be observed that the value of CX increases with increasing Ma, with the maximum value being attained at Ma = 0.75.
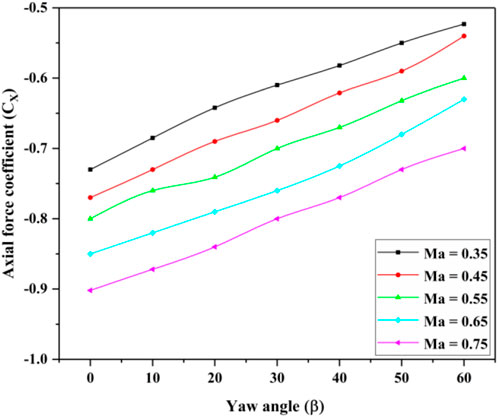
FIGURE 14. Effect of Ma on CX for different values of β at α = 0° (taking SRP as the moment reference center).
The side force coefficient (CY) of the ejection seat occupant also changes with variation in β, as shown in Figure 15. The maximum pressure difference between the front and back surfaces of the model is found at β = 0°. Therefore, the minimum CY is found at this value of β, as this is the point at which the pressure difference is at its minimum. However, as β increases, the area of the model exposed to the freestream moves to the left. This increases the pressure difference; therefore, the value of CY increases with increasing β. It is also notable that the value of CY increases with increasing Ma; the same behavior was observed by White (1974) in his experimental study. The highest value of CY is obtained at Ma = 0.75, as shown in Figure 15.
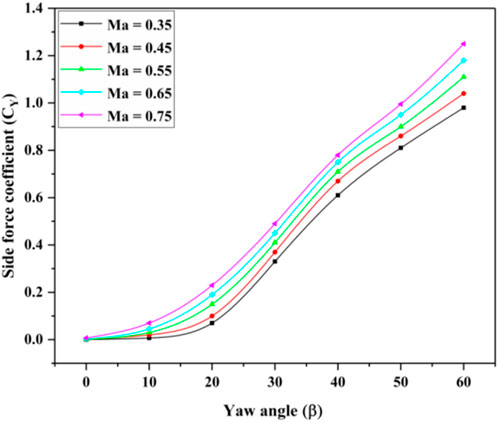
FIGURE 15. Effect of Ma on CY for different values of β at α = 0° (taking SRP as the moment reference center).
Variation in the yawing moment coefficient (Cn) and the rolling moment coefficient (Cl) with β is illustrated in Figures 16, 17, respectively. Based on these figures, it can be observed that the values of Cn and Cl increase with increasing β, which was also observed by White (1974). At β = 0°, the values of the moment coefficients are at their minimum. However, as β increases, Cn and Cl also increase. Hence, the maximum values of Cn and Cl are observed at β = 60°. As also shown in Figures 16, 17, Cn and Cl increase with increasing Ma, following a similar trend to that reported by White (1974), and the maximum value for both coefficients is found at Ma = 0.75.
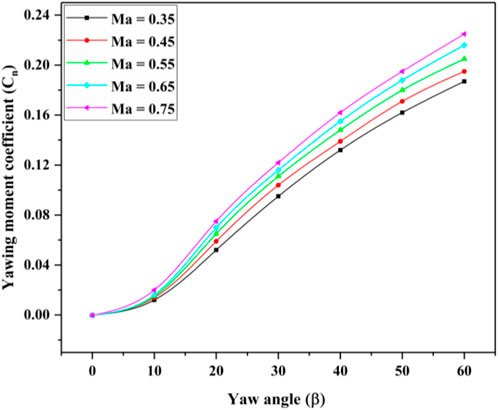
FIGURE 16. Effect of Ma on Cn for different values of β at α = 0° (taking SRP as the moment reference center).
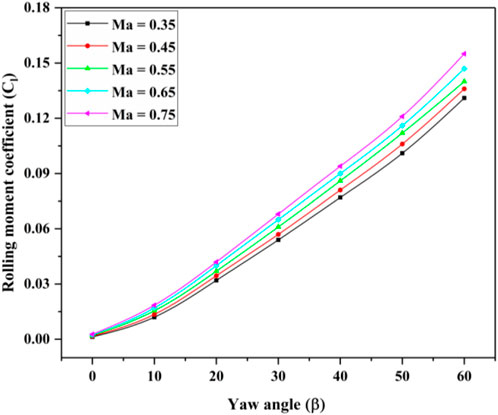
FIGURE 17. Effect of Ma on Cl for different values of β at α = 0° (taking SRP as the moment reference center).
4 Conclusion
A 3D numerical analysis was conducted using an ANSYS Fluent solver for an ejection seat system, with its occupant, for different Ma. The analysis was performed by varying α and β from −15° to 15° and from 0° to 60°, respectively. The CFD results were validated against experimental data and showed good agreement. The pressure contours on the symmetric plane, and on the surface of the pilot, were plotted for different values of α and β at Ma = 0.75. The aerodynamic coefficients were calculated for Ma = 0.35, 0.45, 0.55, 0.65, and 0.75 under varying values of α and β. The important outcomes observed on the basis of this analysis can be summarized as follows.
• The magnitude of CX is at its maximum at α = −15° due to the presence of high pressure; with increasing α, this magnitude decreases, as the pressure difference falls. Similarly, the magnitude of CX is high at β = 0° compared to other values of β. At β = 0°, the more frontal surface is exposed to the freestream; as this value increases, the pressure difference is reduced, which results in lower CX.
• As α increases, the value of CZ decreases due to the decrease in the resultant force generated by the pressure difference in the top and bottom portions of the ejection seat occupant. Therefore, the value of CZ is at its maximum and minimum at α = −15° and 15°, respectively.
• The value of CY increases with increasing β, since increasing β shifts the high-pressure region toward the left, causing an increment in CY.
• At α = −15°, the value of Cm is high, and this value decreases as α increases. In contrast, the values of Cn and Cl increase with increasing β.
• The effect of Ma on the aerodynamic coefficients of the model is also significant. The magnitude of CX increases with increasing Ma. Similarly, the values of Cy, CZ, Cm, Cn, and Cl also increase with increasing Ma.
Data availability statement
The original contributions presented in the study are included in the article/Supplementary Material, further inquiries can be directed to the corresponding authors.
Author contributions
MR: Data curation, Investigation, Methodology, Software, Validation, Writing–original draft, Writing–review and editing. VP: Conceptualization, Data curation, Formal Analysis, Methodology, Project administration, Validation, Writing–review and editing. SC: Formal Analysis, Methodology, Supervision, Validation, Writing–review and editing. DT: Funding acquisition, Resources, Software, Visualization, Writing–review and editing. SS: Conceptualization, Investigation, Project administration, Writing–original draft. EA: Formal Analysis, Funding acquisition, Project administration, Supervision, Writing–review and editing. AK: Methodology, Software, Validation, Writing–review and editing.
Funding
This research was supported by the Grant-In-Aid Scheme of AR&DB, DRDO, Ministry of Defence, Govt of India, Project Number 2006. The authors extend their appreciation to King Saud University for funding this work through Researchers Supporting Project (number RSP 2023R164), King Saud University, Riyadh, Saudi Arabia.
Conflict of interest
The authors declare that the research was conducted in the absence of any commercial or financial relationships that could be construed as a potential conflict of interest.
Publisher’s note
All claims expressed in this article are solely those of the authors and do not necessarily represent those of their affiliated organizations, or those of the publisher, the editors and the reviewers. Any product that may be evaluated in this article, or claim that may be made by its manufacturer, is not guaranteed or endorsed by the publisher.
References
Baum, J., and Loehner, R. (1993). “Numerical simulation of pilot/seat ejection from an F-16,” in Proceedings o the 31st Aerospace Sciences Meeting, Reno, NV, U.S.A., January 1993, 783.
Burk, S. M. (1970). Wind-tunnel investigation of aerodynamic characteristics of a 1/2-scale model of an ejection seat with a rigid-wing recovery system. Washington, D.C.: National Aeronautics and Space Administration.
Caruso, S., and Mendenhall, M. (1992). “Computational analysis of high-speed ejection seats,” in Proceedings o the 30th Aerospace Sciences Meeting and Exhibit, Reno, NV, January 1992, 403.
Chen, B. S., Wu, R. C., and Liu, P. H. (2023). Restenosis investigation of two-stent placement in the artery bifurcation with different stenting techniques using computational fluid dynamics analysis. Appl. Sci. 13 (8), 4694. doi:10.3390/app13084694
Chen, D. H., Wu, W. H., Wang, J. J., and Huang, Y. (2007). Investigation on the aerodynamic performance of an ejection seat. Aeronautical J. 111 (1120), 373–380. doi:10.1017/s0001924000004620
Dehua, C., Jinjun, W., Wenhua, W., and Liyan, C. (2006). Ejection seat test techniques in a high-speed wind tunnel. J. Aircr. 43 (5), 1593–1596. doi:10.2514/1.20160
Epstein, D., Markovitz, E., Nakdimon, I., Guinzburg, A., Aviram, E., Gordon, B., et al. (2020). Injuries associated with the use of ejection seats: A systematic review, meta-analysis and the experience of the Israeli air force. Injury 51 (7), 1489–1496. doi:10.1016/j.injury.2020.04.048
Guan, H., Zhu, Y., Zhao, X., and Zhang, S. 2013). Aerodynamic characteristics of ejection seat and occupant. In Proceedings of the 51st AIAA Aerospace Sciences Meeting Including the New Horizons Forum and Aerospace Exposition Grapevine, Texas, January 2013, (p. 386).
Guerrero, A., Castilla, R., and Eid, G. (2022). A numerical aerodynamic analysis on the effect of rear underbody diffusers on road cars. Appl. Sci. 12 (8), 3763. doi:10.3390/app12083763
Habchi, S., and Hufford, G. (1995). “Transient simulation of turbulent flow over blunt bodies (ejection seat configurations),” in Proceedings of the 13th Applied Aerodynamics Conference, San Diego,CA,U.S.A, June 1995, 1837.
Habchi, S. D., Przekwas, A. J., Marquette, T., and Ayoub, P. (1992). CFD analysis of ejection seat escape systems. SAE Trans., 1566–1579. doi:10.4271/921924
Hallion, R. (1972). Supersonic flight: The story of the Bell X-1 and douglas D-558. New York: Macmillan.
Hawker, F. W., and Payne, P. R. (1979). Wind tunnel test of ACES II ejection seat with anthropometric dummy in asymmetric configurations. Maryland: PAYNE INC ANNAPOLIS MD.
Hufford, G., and Habchi, S. (1994). “Validation of CFD methodology for ejection seat applications,” in Proceedings of the 32nd Aerospace Sciences Meeting and Exhibit, Atlanta, GA, January 1994, 751.
Kenzakowski, D., York, B., and Dash, S. (1997). “Computational simulation of ejection seat aerodynamics with rocket propulsive effects,” in Proceedings of the 15th Applied Aerodynamics Conference, Atlanta, June 1997, 2253.
Marquette, T., Rock, S., Habchi, S., Marquette, T., Rock, S., and Habchi, S. (1997). “Numerical simulation of controllable propulsion for advanced escape systems,” in Proceedings of the 15th Applied Aerodynamics Conference, Atlanta, June 1997, 2254.
Rahman, M. M., and Islam, A. K. (2019). Numerical study of convective heat transfer for turbulent flow in corrugated tube using Al2O3-water nanofluid. AIP Conf. Proc. 2121 (1). doi:10.1063/1.5115916
Reichenau, D. E. (1987). Aerodynamic characteristics of a full-scale ACES-II ejection seat with a small female or large male manikin at Mach numbers from 0.2 to 1.
Reichenau, D. E. (1988). Aerodynamic characteristics of a half-scale CREST ejection seat at Mach numbers from 0.6 to 3.0. Cheektowaga, New York: Calspan Corporation/AEDC Division.
Reichenau, D. E. (1972). “Aerodynamic characteristics of an ejection seat escape system with a stabilization parachute at mach numbers from 0.3 through 1.2,” in Arnold engineering development center. Air force systems command (Virginia, U.S.: United States Air Force).
Tian, J. L., and Chen, L. (2012). “Aerodynamic characteristics numerical simulation of the protective device of ejection seat,” in Applied mechanics and materials (Stafa-Zurich, Switzerland: Trans Tech Publications Ltd), 1811–1814.
Tyler, C., and Burkinshaw, M. (2010). “Computational study of aircraft forebody impact on aerodynamic forces experienced during pilot ejection,” in Proceedings of the 48th AIAA Aerospace Sciences Meeting Including the New Horizons Forum and Aerospace Exposition, Orlando, Florida, January 2010, 313.
White, B. J. (1974). Aeromechanical properties of ejection seat escape systems. Wright-Patterson: AIR FORCE Flight Dynamics Lab Wright-Patterson AFB OH.
Zhu, Y., Zhao, X., and Zhang, S. (2011). “Computational studies of aircraft Life-Support systems,” in Proceedings of the 49th AIAA Aerospace Sciences Meeting including the New Horizons Forum and Aerospace Exposition, Orlando, Florida, January 2011, 1045.
Zhang, D., and Wei, T. (2009). The numerical simulation of flow around ejection system. Mod. Phys. Lett. B 23 (03), 489–492. doi:10.1142/s0217984909018722
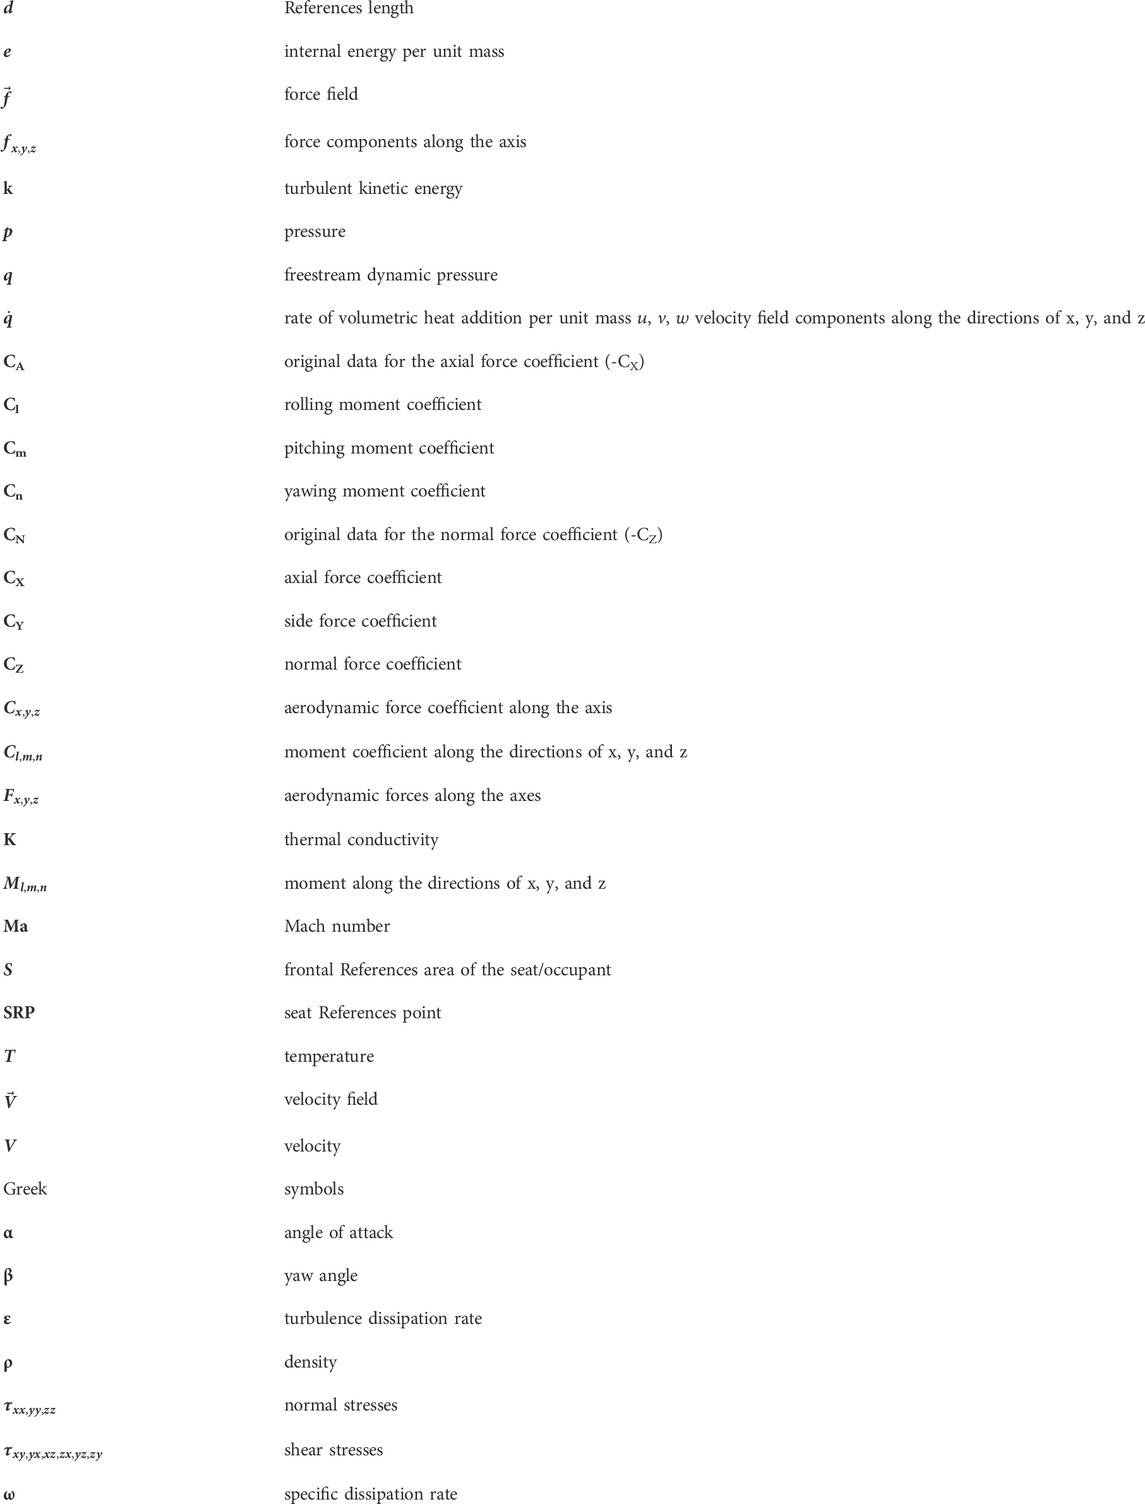
Nomenclature
Keywords: aerodynamic coefficient, ejection seat system, mach number, angle of attack, yaw angle, specific dissipation rate
Citation: Rahman MM, Prakash V, Chandel S, Thakur DG, Čep R, Khedkar N, Salunkhe S and Abouel Nasr ES (2023) Analysis of the aerodynamic characteristics of an ejection seat system using computational fluid dynamics. Front. Mech. Eng 9:1255051. doi: 10.3389/fmech.2023.1255051
Received: 08 July 2023; Accepted: 11 September 2023;
Published: 03 October 2023.
Edited by:
Georgios Mavropoulos, School of Pedagogical and Technological Education, GreeceReviewed by:
Davide Lengani, University of Genoa, ItalyEvangelos Bellos, School of Pedagogical and Technological Education, Greece
Copyright © 2023 Rahman, Prakash, Chandel, Thakur, Čep, Khedkar, Salunkhe and Abouel Nasr. This is an open-access article distributed under the terms of the Creative Commons Attribution License (CC BY). The use, distribution or reproduction in other forums is permitted, provided the original author(s) and the copyright owner(s) are credited and that the original publication in this journal is cited, in accordance with accepted academic practice. No use, distribution or reproduction is permitted which does not comply with these terms.
*Correspondence: Sunil Chandel, c3VuaWxjaGFuZGVsQGRpYXQuYWMuaW4=