 Soheila Abdolahipour
- Aerospace Research Institute, Ministry of Science, Research, and Technology, Tehran, Iran
The main objective of this study is to investigate the effects of low and high frequency actuation in improving the aerodynamic performance of the supercritical airfoil with the approach of using it in a high-lift or flight control device. For this purpose, a flow control numerical simulation is performed on a supercritical airfoil with NASA SC(2)-0714 cross section using a pulsed jet at the chord-based Reynolds number of 1 × 10⁶. The pulsed jet actuation with different reduced frequencies of 0.2, 1, 1.2, 2.4, 4, 6, and 12 is implemented on the upper side of the airfoil surface upstream of the separation point of the uncontrolled case. The aerodynamic efficiency improvements are investigated by extracting the results of time-averaged and instantaneous aerodynamic forces for all cases. The study compares the flow streamline, Q-criterion contour, and surface pressure distribution to examine how the separated flow configuration over the airfoil responds to different actuation frequencies. The results indicate that pulsed jet actuation effectively postpones the flow separation. A comparison of the time-averaged aerodynamic coefficients at different actuation frequencies revealed that utilizing a low actuation frequency range maximizes lift, while a high frequency range minimizes drag. In addition, the aerodynamic efficiency of the supercritical airfoil improves across all controlled scenarios, with the optimal increase in aerodynamic efficiency of 28.62% achieved at an actuation frequency of F+ = 1.
1 Introduction
Flow control techniques for lifting surfaces have largely concentrated on reducing or eliminating flow separation, which is usually induced by an adverse pressure gradient. All separation control strategies aim to increase the momentum content of the boundary layer flow, allowing it to cope with stronger adverse pressure gradients than would be naturally possible. Depending on the flow control strategy, different physical mechanisms are considered to achieve the desired results. In fluidic actuators, the flow control strategy is classified into steady (Radespiel et al., 2016) and unsteady (McManus et al., 1995; Sheikholeslam Noori et al., 2021) methods based on whether momentum or mass flux is added continuously or periodically. In the steady method, fluid with high momentum and energy is continuously injected into the boundary layer. Thus, achieving the desired result requires a considerable amount of mass and momentum. In contrast, unsteady actuation produces vortical structures in the flow that increase the mixing rate throughout the flow field (Wu et al., 1998). As a result, the turbulence mixing is improved and the momentum is more efficiently transferred between high-momentum region in the cross-flow and low-momentum region near the wall (Greenblatt and Wygnanski, 2000). It is noteworthy that flow control with unsteady actuation is based on the phenomenon of natural flow instability, which has the potential to reduce the mass flux requirement and enhance flow control efficiency (Bernardini et al., 2014). Therefore, unsteady flow control has been widely considered due to the lower power and momentum requirements compared to the steady flow control method. In unsteady flow control, several parameters affect the separation control on lifting surfaces, including geometric and physical parameters (Bauer, 2015; Hipp et al., 2016) of the main flow (Seifert et al., 2004; Haucke and Nitsche, 2013; Wild, 2015) and the actuation system (Stalnov and Seifert, 2010; Taleghani et al., 2012; Hecklau et al., 2013; Feero et al., 2017; Munday and Taira, 2018; Walker et al., 2018).
One of the most important parameters of unsteady actuation is the actuation frequency. The actuation frequency is usually presented as a reduced frequency F+, which is defined as F+ = fL/V where f is the actuation frequency, V is the freestream velocity, and L is the length scale of the flow domain. Different frequency ranges were identified for maximum control effect depending on the physical flow control mechanism used in the flow (Mirzaei et al., 2012; Mohammadi and Taleghani, 2014; Sheikholeslam Noori et al., 2020; Taeibi et al., 2022). The literature has reported that the strategy of coupling periodic actuation with natural flow unsteadiness improves flow control efficiency significantly. However other works have demonstrated that aerodynamic efficiency can be improved over a much wider range of actuation frequencies that are at least an order of magnitude higher than the natural shedding frequencies in separated shear layer (Glezer et al., 2005).
Some previous studies have shown that the optimal separation control can be achieved by utilizing actuation frequencies within the range of natural instability frequencies found in the separated shear layer. The flow over the lifting surfaces is usually characterized by two dominant natural instabilities depending on the angle of attack. At low angles of attack when the flow attaches over the lifting surface, vortex shedding in the wake is dominant. At high angles of attack when flow separation is severe, the flow is characterized by roll-up vortices in the shear layer and large scale vortex shedding in the separated wake (Boutilier and Yarusevych, 2012; Feero, 2018). Wu et al. (1998) performed a numerical simulation of separation control on NACA-0012 airfoil using a local unsteady excitation located near the leading edge at post-stall angles of attack and Reynolds number 5 × 10⁵. They found that the effective actuation frequency range at post-stall angles of attack 20–30° was about 0.3–2.0 times the natural shedding frequency. Duvigneau and Visonneau (2006) used 2D unsteady Reynolds-averaged Navier–Stokes equations to simulate aerodynamic stall control through a synthetic jet actuator located at the leading edge of a NACA 0015 airfoil at Reynolds number 8.96 × 10⁵. They utilized the automatic optimization of the control parameters to maximize the lift enhancement at angles of attack between 12 and 24°. They found that the optimal lift enhancement was obtained at F+ = 0.85 for all angles of attack in the range of 14–20° and F+ = 0.25 for angles of attack 22. For the same configuration and Reynolds number, You and Parviz (2008) conducted a 3D LES study. They reported that the unsteady actuation on the airfoil at an angle of attack of 16.6°, can increase lift up to 70% when F+ = 1.284. The separation control on a NACA-0015 airfoil was also experimentally studied at Reynolds number 3 × 10⁴ and angle of attack of 18° (Tuck and Soria, 2008; Buchmann et al., 2013). The results indicated that maximum lift can be obtained by actuation frequency at the range of vortex shedding frequency in the separated wake F+ = 0.65 and its superharmonic F+ = 1.3.
Glezer et al. (2005) proposed a novel method to control separation on an airfoil through fluidic modifications of the apparent aerodynamic shape, aiming to alter the pressure gradient to reduce or eliminate separation. They utilized actuation frequencies significantly higher than those of natural vortex shedding. In this approach, the high actuation frequency ensures that the interaction between the unsteady actuation and the crossflow is perceived as a time-invariant phenomenon within the flow’s timescale. Therefore, the interaction area over the surface produces a displacement of the crossflow that induces a virtual change in the shape of the surface and alters the streetwise pressure gradient over the airfoil. All of the modifications can lead to mitigation or elimination of boundary layer separation. Glezer et al. (2005) employed this control approach to study the flow field of a stalled airfoil and circular cylinder that undergo boundary layer separation. Yarusevych and Kotsonis (2017) investigated the response of a laminar separation bubble to excitation with low and high frequencies in the range of 2 ≤ F+ ≤ 10 and F+ = 100 at Re = 1.3 × 10⁵. The study findings indicated that the greatest impact on the average decrease in the size of the laminar separation bubble occurred at F+ = 6. Several researchers have studied the role of actuation frequency in separation control over a stalled airfoil. Their investigations showed the flow reattachment and the aerodynamic performance improvement on an airfoil for both high and low reduced frequency F+ = O(1) and F+ = O(10) (Amitay and Glezer, 2002a; Amitay and Glezer, 2002b; Glezer, 2011; Salmasi et al., 2013; Feero et al., 2015; Taleghani et al., 2018).
A review of literature reveals that the use of pulsed jet actuators to actively control flow separation over airfoils and wings has been a developing topic for several decades. In recent years, pulsed jet actuators have been widely utilized as flow separation control techniques to enhance the aerodynamic performance of high-lift devices in short take-off and landing (STOL) transportation airplanes (Abdolahipour et al., 2022a; Abdolahipour et al., 2022b). This method allows for an increase in aerodynamic efficiency of wings by eliminating the need for airfoil profile geometry changes or additional complex and heavy components. In addition, flow control can be utilized to offset the decreased aerodynamic efficiency of the damaged wing (Abdolahipour et al., 2007; Abdolahipour et al., 2011). Despite significant advancements in pulsed jet flow control methods over an aircraft’s wing, this technology has not yet been utilized in civil aircraft due to insufficient control power for effective operation. Most studies examining the impact of different parameters on enhancing the performance of pulsed jet flow control have focused on airfoils used in low Reynolds number flows. For effective implementation of this flow control technology in airplane wings for practical and industrial purposes, it is crucial to conduct further studies on airplane wing sections operating in Reynolds numbers similar to real flight conditions. The aforementioned studies pointed out the lack of data available on this issue. Considering this research gap, this study is an attempt to investigate the effect of actuation frequency on the actively controlling separation from the shoulder of a supercritical airfoil at incompressible high Reynolds number. The purpose of this study is to provide information about the substantially different responses of a separated flow over a supercritical airfoil to different ranges of actuation frequency from F+ = 0.2 to 12. The results include time-averaged and instantaneous aerodynamic force coefficients, streamlines, vorticity contour, and pressure distribution generated through a numerical simulation. Subsequently, a comparison was made between the results.
2 Physical model and numerical methodology
The model used in this study is a supercritical airfoil with NASA SC(2)-0714 cross-section, which is numerically simulated in turbulent flow with Reynolds number 1 × 10⁶ based on chord length. This investigation is provided at angle of attack of 16° as a situation of configuration near the stall condition. Figure 1 shows the geometry of the C-type computational domain around the airfoil discretized by a structured grid. After conducting the grid independence study, the total number of cells was considered to be about 47,000. The mesh quality near the wall is such that Y+ is calculated within a range of 1. The velocity-inlet and pressure-outlet are considered as boundary conditions for the computational domain.
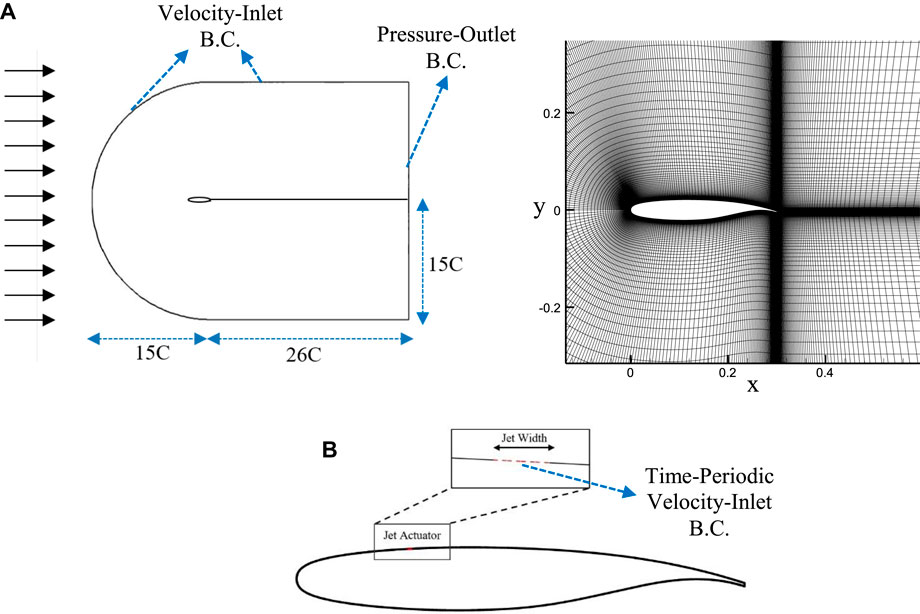
FIGURE 1. Schematic of (A) the physical model and the computational domain (B) the pulsed jet actuator on the model.
As shown in Figure 1, the pulsed jet actuator is modeled as a gap with a width of 0.002 m on the upper surface of the airfoil at 25% of the chord location upstream of the mean separation point. The curvature of the surface at the point where the actuator exits and intersects with the airfoil demonstrates a discontinuity. The pulsed air jet is simulated by the time-periodic velocity boundary condition at the exit of the actuator with an angle of 25° to the x-axis. The pulsed jet velocity changes from zero (jet-off) to the maximum value of 120 m/s (jet-on) as a square wave by duty cycle of 50% and specified actuation frequency. Therefore, an actuation cycle consists of two phases; the blowing phase (jet-on) from t/T = 0 to t/T < 0.5 and the closing phase (jet-off) from t/T = 0.5 to t/T < 1. The maximum jet velocity of 120 m/s is selected in the range of data obtained from the experiments of a solenoid valve actuator (Abdolahipour et al., 2021). The actuation reduced frequency is set to low values of F+ = 0.2, 1, and 1.2 and high values of F+ = 2.4, 4, 6, and 12.
In this numerical simulation, an approach based on solving unsteady two-dimensional Reynolds-averaged Navier–Stokes (URANS) equations was used. The governing equations including mass (Eq. 1) and momentum (Eq. 2) are considered as follows.
The equations are solved by using the pressure-based method and a second-order accurate numerical technique. The flow is considered viscous, incompressible, and turbulent in which κ-ω sst model has been used for turbulence modeling. The time step size is 2.0 × 10⁻⁵ in all simulations reported here. This time step size is chosen based on the time independence of the aerodynamic coefficients.
To validate the numerical simulation in this study, the results of the numerical analysis were compared with the data provided in the NASA technical report for the baseline case (NASA Technical Memorandum 81912, 2013). The aerodynamic characteristics described in this report are derived from model tests conducted at the wind tunnel with Reynolds 2 × 10⁶. To ensure precision, the numerical solution was also performed in the validation phase at a free flow velocity of 100 m/s, which corresponds to Reynolds 2 × 10⁶. Figure 2 presents the comparison of the pressure coefficient distribution on the airfoil surface from the numerical solution results and the wind tunnel results (NASA Technical Memorandum 81912, 2013) in the Reynolds 2 × 10⁶ at the angle of attack of 14°. Table 1 presents a comparison of the lift coefficients obtained from the numerical solution and the wind tunnel test. The results indicate high accuracy.
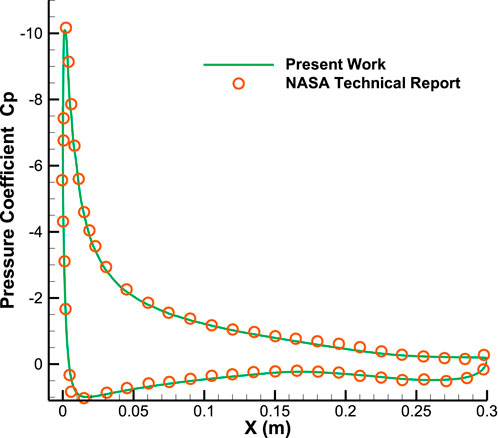
FIGURE 2. Comparing the pressure coefficients on the airfoil surface obtained from numerical analysis and NASA wind tunnel experiments (NASA Technical Memorandum 81912, 2013) in a flow with Reynolds number of 2 × 10⁶ and AOA = 16°.
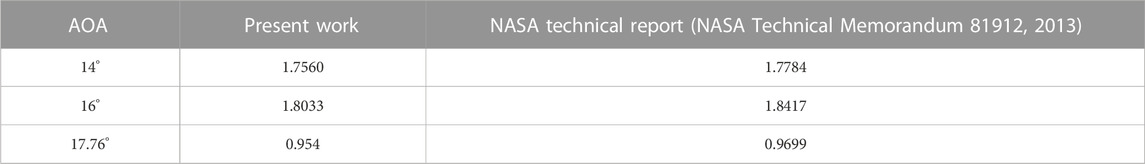
TABLE 1. Comparing the lift coefficients of the airfoil obtained from numerical analysis and NASA wind tunnel experiments (NASA Technical Memorandum 81912, 2013) in a flow with Reynolds number of 2 × 10⁶.
3 Results
Pulsed jet actuation applied upstream of the mean separation point on the supercritical airfoil at high angle of attack results in notable enhancements in the airfoil’s aerodynamic characteristics. Figure 3 displays the time-averaged aerodynamic force coefficients for both the baseline and actuated scenarios at an angle of attack of 16°. Upon initial examination, the data from all actuated cases show that the pulsed jet actuator significantly improves lift and aerodynamic efficiency and reduces drag compared to the baseline case. As shown, the highest time-averaged lift of 1.88 is achieved in the actuated case with F+ = 1, which is an increase of 12.2% compared to the baseline case. As the frequency of actuation increases up to F+ = 4, the lift that can be achieved decreases to 1.81 and then remains almost constant for higher actuation frequencies. Similarly, this trend is also observed for the drag coefficient, so that by increasing the actuation frequency up to F+ = 12, the drag value decreases from 0.070 to 0.059 (a decrease of 15.7% compared to the baseline case). Slight variations in aerodynamic coefficients are observed between actuation frequencies F+ = 4 and F+ = 12. As a result of these variations in the lift and drag coefficients, the aerodynamic efficiency varies slightly among all actuation frequencies. However, the largest aerodynamic efficiency increase of 28.62% occurs at F+ = 1.
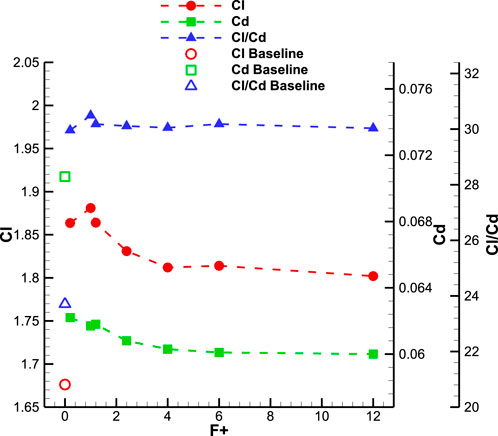
FIGURE 3. Variation of time-averaged aerodynamic forces for different actuation frequencies at AOA = 16°.
Figures 4–6 show the evolution of the aerodynamic coefficients of the airfoil during a single cycle of pulsed jet actuation at various actuation frequencies. In these figures, the jet-on and jet-off phases of the pulsed jet actuation are sketched by solid line. The data show that pulsed jet actuation at different reduced frequencies significantly improves lift and aerodynamic efficiency compared to baseline, even in the jet-off phase of the actuation cycle. At the beginning of the jet-off phase, a sudden drop in drag value is observed at all actuation reduced frequencies. This drag is related to the presence of the jet actuator in the flow, which disappears when the jet is turned off. The main point of interest in these data is a fundamental difference in aerodynamic coefficient variations observed between the low and high-frequency actuation approaches. As can be seen in Figures 4, 5, the flow actuations with low frequencies of F+ = 0.2, 1, and 1.2 produce time-dependent aerodynamic forces that oscillate around the mean values. Whereas, high frequencies of F+ = 2.4, 4, 6, and 12 generate almost time-invariant aerodynamic forces during each phase in a cycle.
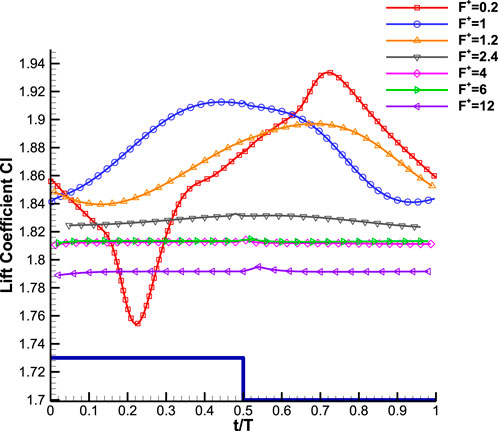
FIGURE 4. Temporal evolution of the lift coefficient during an actuation cycle at different reduced frequencies, AOA = 16° (The sketch of the corresponding actuation cycle is shown by the solid line and its amplitude is not in scale).
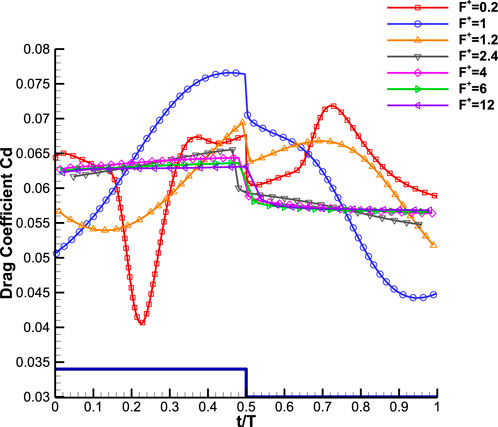
FIGURE 5. Temporal evolution of the drag coefficient during an actuation cycle at different reduced frequencies, AOA = 16° (The sketch of the corresponding actuation cycle is shown by the solid line and its amplitude is not in scale).
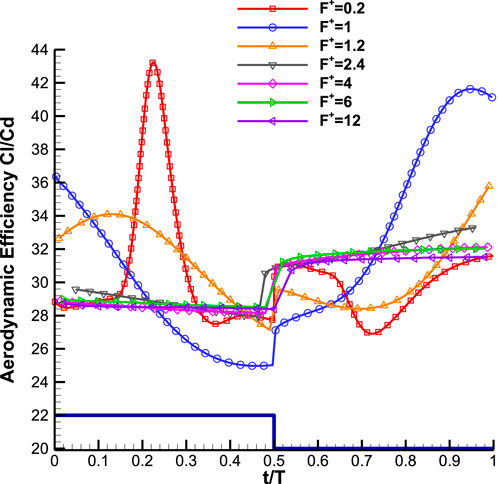
FIGURE 6. Temporal evolution of the aerodynamic efficiency during an actuation cycle at different reduced frequencies, AOA = 16° (The sketch of the corresponding actuation cycle is shown by the solid line and its amplitude is not in scale).
For the reduced frequency of F+ = 0.2, after the onset of the actuation, the lift and drag coefficients follow a reduction trend until they reach minimum values at t/T = 0.22 and then start to increase. In the second phase, when the actuator is turned off, both the lift and drag forces maintain their increasing trend (except for the turn-off point, where a sharp drop in drag coefficient is seen). In almost the last quarter of the actuation cycle, the lift and drag forces start to decrease again and create a maximum value at t/T = 0.72. Actuation frequency of F+ = 0.2 greatly increases the rate of the aerodynamic forces variation during one cycle compared to reduced frequencies of F+ = 1 and 1.2. The highest value of lift and the lowest value of drag both occurred at an actuation frequency of F+ = 0.2. Upon closer inspection, it appears that the oscillation of lift and drag forces gradually subsides as the reduced frequency increases. For high reduced frequencies ranging from F+ = 2.4 to 12, the lift and drag coefficients display similar variations throughout each cycle. Particularly, the lift coefficient remains quasi-time-invariant, and the drag coefficient changes slightly during each jet-on and jet-off phase. Meanwhile, as previously shown in Figure 3, the time-averaged values of the aerodynamic forces for all reduced frequencies are still improved compared to the baseline case with increased lift and reduced drag. To elucidate the reason why different actuation frequencies produce different force variations during a cycle, a coupled analysis of the vorticity field, streamlines, and pressure distribution around the airfoil is provided below.
Figure 7 shows the streamlines and specified Q-criterion contour for the baseline case at angle of attack of 16°. The Q-criterion identifies vortices as areas where the vorticity magnitude surpasses the strain rate magnitude. The presence of an adverse pressure gradient causes separation of the turbulent flow over the airfoil’s suction side in the last third of the chord, as evident from the streamlines. This flow separation is characterized as a reverse flow with a low-velocity region.
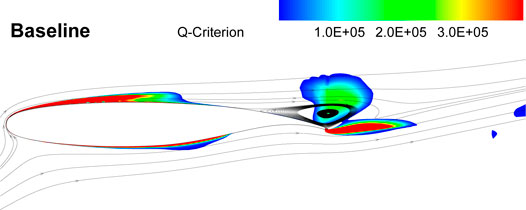
FIGURE 7. Streamlines and Q-criterion contour for baseline case at AOA = 16°.
Figure 8 shows the evolution of the streamline and Q-criterion for the actuated case with a reduced frequency of F+ = 0.2 at various time instances during one actuation cycle. The analyzed phases in Figure 8 are represented by the time evolution of the lift increment in Figure 9 between the controlled airfoil and the baseline case. As explained earlier, an actuation cycle consists of two phases; the blowing phase (jet-on) from t/T = 0 to t/T < 0.5 and the closing phase (jet-off) from t/T = 0.5 to t/T < 1. The jet flow injection over the suction side of the airfoil creates a region of high vorticity flow just downstream of the actuator chord location. As can be seen in Figure 8A for t/T = 0.1, this region grows and is energized by the jet flow and generates a patch of vorticity detaching from the airfoil surface. This patch of vorticity is transported downstream by cross flow until it reaches the separation region near the trailing edge of the airfoil in Figure 8B. Then, it pushes separated flow away from the upper surface of the airfoil between t/T = 0.22 to 0.37, as shown in Figures 8C–E. During these instants, the lift increment starts to increase as shown in Figure 9. The pulsed jet actuation provides momentum flux and additional vorticity in the flow over the suction surface. This mechanism enables the flow to dynamically overcome the unfavorable pressure gradient, ultimately delaying and reducing the area of flow separation. This phenomenon continues until t/T = 0.71 in Figure 8G when the flow separation region reaches its minimum area. During the jet-off phase, as the momentum and vorticity injection are turned off, the flow tends to separate again due to the dominance of the adverse pressure gradient. As can be seen in Figure 8H, at t/T = 0.95, the separation point is moved upstream, but not as much as the baseline case. It is worth noting that despite the increase in the separation region after the jet is turned off, the flow separation region is still smaller than that of the baseline case. This phenomenon can be seen by comparing the streamline at time t/T = 0.95 in Figure 8H with the baseline in Figure 7.
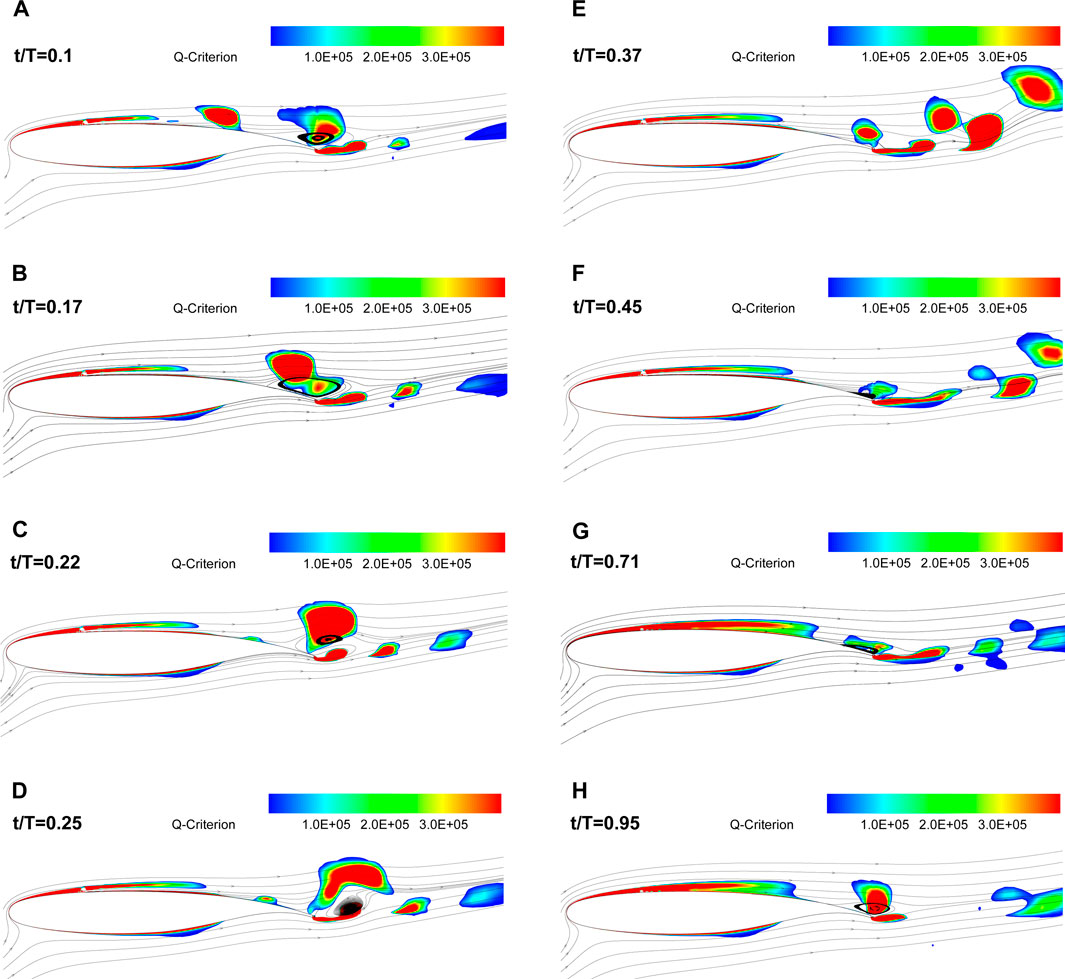
FIGURE 8. The evolution of the streamlines and Q-criterion for the actuated case at AOA = 16° with reduced frequency of F+ = 0.2 at different time instants in an actuation cycle, t/T= (A) 0.1, (B) 0.17, (C) 0.22, (D) 0.25, (E) 0.37, (F) 0.45, (G) 0.71, (H) 0.95.
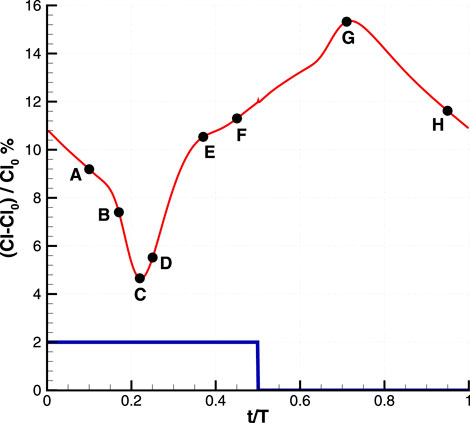
FIGURE 9. The instants from (A-H) are represented on the time evolution of the lift increment for the reduced frequency of F+ = 0.2 (The sketch of the corresponding actuation cycle is shown by solid line and its amplitude is not in scale).
For further analysis, Figure 10 presents the variation of the pressure coefficient Cp-Cp0 on the airfoil surface, where Cp0 represents the pressure coefficient of the baseline case. The effects induced by the pulsed jet are not limited to the downstream area of the actuator but involve the flow field throughout the entire airfoil. The new pressure distribution exhibits a larger suction peak at the leading edge.
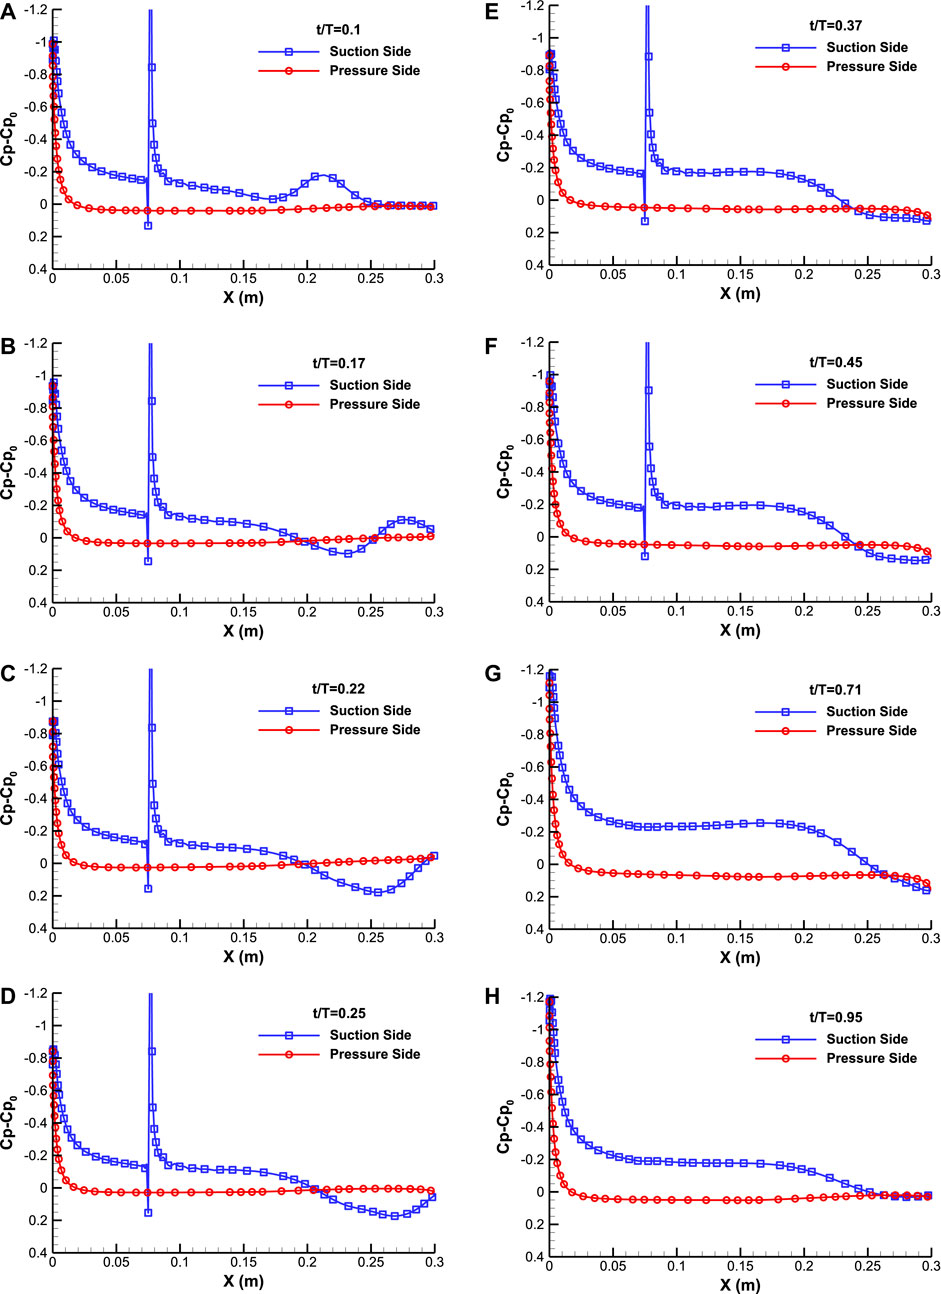
FIGURE 10. Variation of the pressure coefficient around the airfoil for reduced frequency of F+ = 0.2 at different time instants in an actuation cycle, t/T= (A) 0.1, (B) 0.17, (C) 0.22, (D) 0.25, (E) 0.37, (F) 0.45, (G) 0.71, (H) 0.95.
As seen in Figure 8, the pulsed jet actuation generates a patch of additional vorticity detaching from the airfoil surface. This patch of vorticity moving towards the trailing edge can be seen as a region of higher suction pressure in Figure 10A. When the patch of vorticity encounters the separation flow at t/T = 0.17 (Figure 10B), a pressure increase is observed at the airfoil surface just in front of it (Figure 10B). The curvature of the streamlines upstream of the separation is also consistent with this pressure increase on the airfoil. This higher pressure region leads to a reduction in lift. The maximum pressure increment along the upper surface is observed at t/T = 0.22 in Figure 10C where a minimum lift increment is also obtained in Figure 9. Then the separated flow moves away from the airfoil surface (Figure 10D) and an increase in the suction pressure on the upper surface of the airfoil is observed (Figure 10E). Due to the advantageous modifications in the flow field, the flow separation on the airfoil surface is delayed and the separation region is reduced. Finally, the flow that is separated interacts with the flow that comes from the pressure side of the airfoil, resulting in a new vortex shedding pattern in the wake (see Figure 8F). It is responsible for reducing the suction pressure in the vicinity of the trailing edge on the upper surface of the airfoil as shown in Figures 10F, G.
During the jet-off phase, by turning off the momentum and vorticity injection, the flow field changes again and the separation point is moved upstream, but not as much as the baseline case. The new separation region is observed as a constant pressure area on the upper airfoil surface. Upstream of the separation point, a region of negative pressure increase extends along the airfoil due to the flow attaching to the streamlined body. The time-periodic advection of these pressure variations contributes to oscillations in the airfoil’s lift and drag forces.
In summary, compared to the baseline when the jet is activated, the separation point moves toward the trailing edge. The suction pressure increment occurred along the upper surface followed by gradual pressure recovery toward the trailing edge. These lead to a reduction in flow separation and an increase in lift.
Figure 11 shows the evolution of streamlines and Q-criterion for the controlled case with reduced frequency of F+ = 1 at different time instants in an actuation cycle. This figure illustrates a noticeable difference between the flow under actuation at the reduced frequency of F+ = 1 compared to F+ = 0.2, due to the difference in the duration of the jet-on and jet-off phases. As can be seen in Figure 11A, the interaction of the patch of vorticity with the separated flow, occurs before t/T = 0.05. It is much earlier than the controlled case with F+ = 0.2. Actually, the phenomenon observed in Figure 11A is equivalent to that in Figure 8D at t/T = 0.25 for controlled case of F+ = 0.2. Therefore, unlike the previous case, in the controlled case with reduced frequency of 1, the lift starts to increase almost at the beginning of the jet-on phase as shown in Figure 4. Then the maximum lift is obtained at t/T = 0.45. As can be seen in Figure 11B at t/T = 0.45, the flow separation is delayed and the separation region is reduced compared to the baseline case but is larger than the controlled case with F+ = 0.2 at the corresponding instant. The larger separation area can be attributed to the shorter blowing phase, resulting in less promotion of the maximum lift (Clmax = 1.9125 at t/T = 0.45) by the pulsed jet actuator’s effects (as compared to Clmax = 1.9336 for controlled case F+ = 0.2 at t/T = 0.72). The larger size of the separation region is mainly due to the shorter duration of the blowing phase so that maximum lift (Clmax = 1.9125 at t/T = 0.45) is less promoted by the effects provided by the pulsed jet actuator (compared to Clmax = 1.9336 for controlled case F+ = 0.2 at t/T = 0.72). After the jet is turned off, due to hysteresis, the positive effects of jet injection in reducing flow separation and increasing lift are still observed at t/T = 0.55 in Figures 4, 11C. At the end of the jet-off phase at t/T = 0.95 in Figure 11D, the flow separation is growing, but unlike the controlled case with F+ = 0.2 in Figure 8H, the separation region is not fully formed. The variation of the pressure coefficient Cp-Cp0 on the airfoil surface for F+ = 6 at the times corresponding to the Figure 11, is presented in Figure 12. On average, the pressure difference between the upper and lower surfaces is greater for the majority of time intervals in Figure 12 compared to Figure 10.
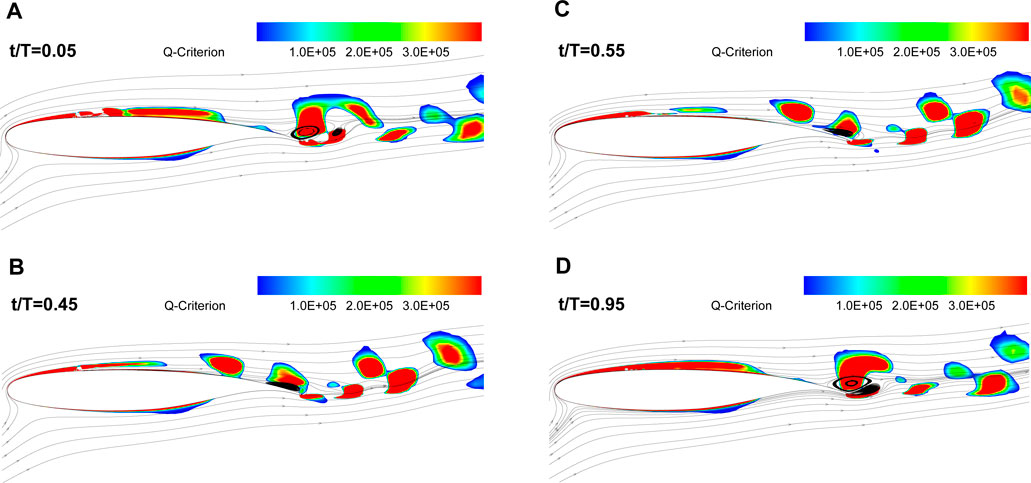
FIGURE 11. The evolution of the streamlines and Q-criterion for the actuated case at AOA = 16° with reduced frequency of F+ = 1 at different time instants in an actuation cycle, t/T= (A) 0.05, (B) 0.45, (C) 0.55, (D) 0.95.
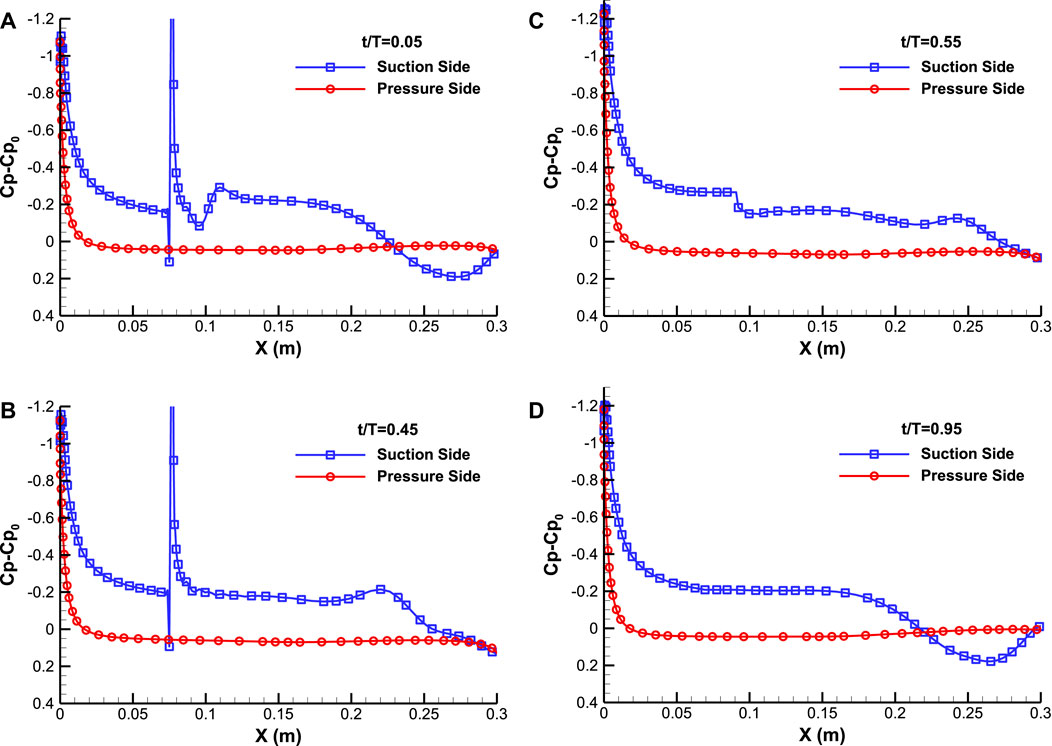
FIGURE 12. Variation of the pressure coefficient around the airfoil for reduced frequency of F+ = 1 at different time instants in an actuation cycle, t/T= (A) 0.05, (B) 0.45, (C) 0.55, (D) 0.95.
The unsteady flow structure and dynamics of vortices around the controlled airfoil under the influence of actuation with high frequencies F+ = 2.4, 4, 6, and 12 compared to the actuation with low frequencies F+ = 0.2, 1, 1.2 have completely different patterns. Figure 13 shows the evolution of the streamline and Q-criterion for actuation frequency of F+ = 6 at different time instants in one cycle of actuation. Since the duration of each actuation cycle is shorter than the advection time scale on the airfoil, a series of small patches of vorticity shedding from the actuator can be observed at any instant. However, unlike reduced frequencies of 0.2 and 1 in Figures 8, 11, these patches of vorticity appear smaller and less intense. The small size of the patches of vorticity is mainly due to the very short duration of the blowing phase. As a consequence, actuation at high frequency is not strong enough to eliminate flow separation during a cycle and it only leads to slight downstream migration of the separation point compared to baseline. This leads to the reduction of the separation region and thus to the improvement of the aerodynamic forces.
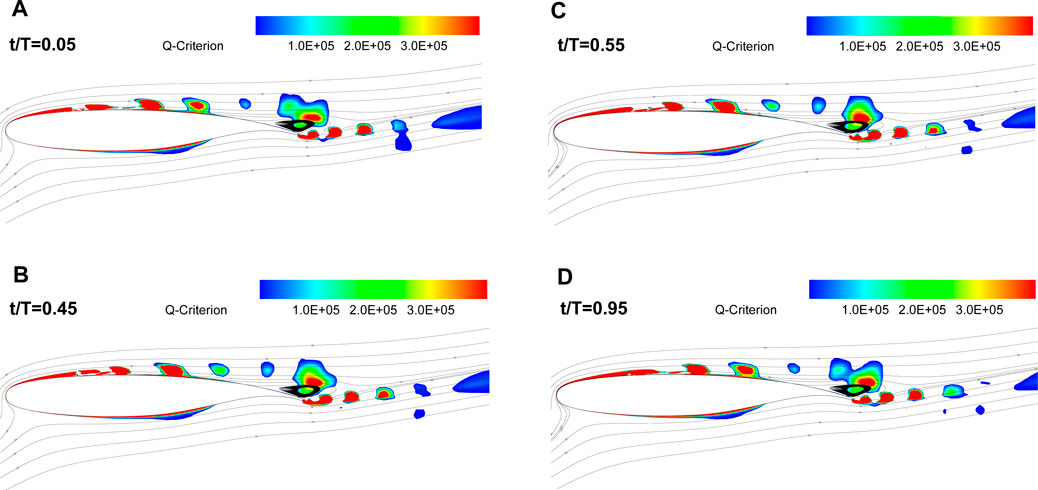
FIGURE 13. The evolution of the streamlines and Q-criterion for the actuated case at AOA = 16° with reduced frequency of F+ = 6 at different time instants in an actuation cycle, t/T= (A) 0.05, (B) 0.45, (C) 0.55, (D) 0.95.
In contrast to the low-frequencies actuation, the high-frequency actuation exhibits a similar flow structure at different time instants during an actuation cycle, resulting in relatively time-invariant aerodynamic forces. It seems that the time duration of each actuation cycle is so short that the cross flow does not sense significant changes in terms of turning the actuator on or off.
The variation of the pressure coefficient Cp-Cp0 on the airfoil surface for F+ = 6 at the times corresponding to the Figure 13, is presented in Figure 14. The pressure distributions for an actuation frequency of F+ = 6, which exceeds the natural frequency of flow by an order of magnitude, exhibit marked differences from previously discussed cases. In general, high-frequency actuation yields a lower suction peak at the leading edge of the airfoil. After the suction peak, the pressure difference between the upper and lower surfaces decreases compared to corresponding low-frequency actuation cases, resulting in lower lift. Furthermore, the area with a constant suction pressure exhibits a larger separated flow over the upper surface of the airfoil compared to the low-frequency actuation cases.
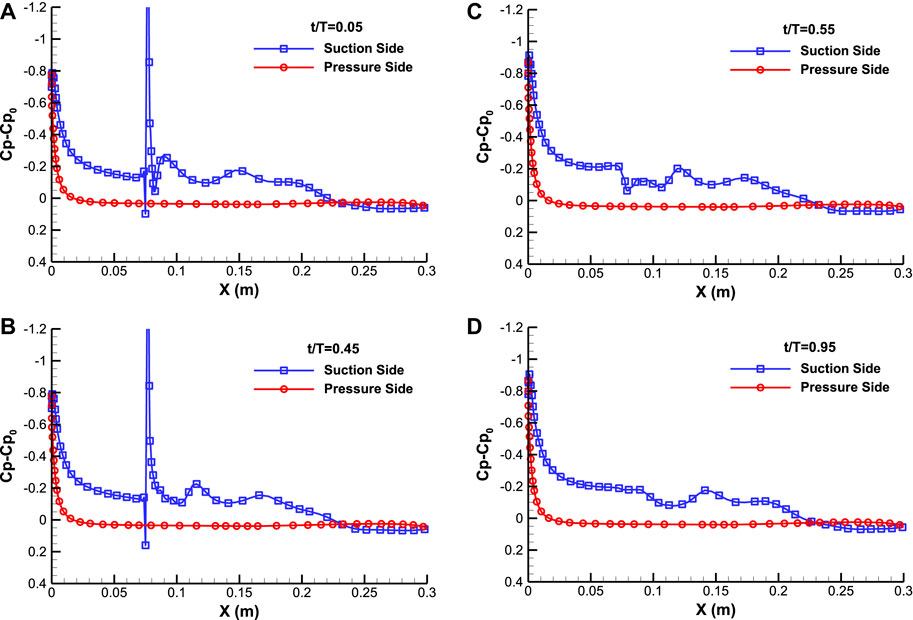
FIGURE 14. Variation of the pressure coefficient around the airfoil for reduced frequency of F+ = 6 at different time instants in an actuation cycle, t/T= (A) 0.05, (B) 0.45, (C) 0.55, (D) 0.95.
4 Conclusion
Numerical simulations were conducted to investigate the impact of different pulsed jet actuation frequencies on improving the performance of separation control on a supercritical airfoil with a NASA SC(2)-0714 cross-section. The actuation frequency varies between the low range of F+ = 0.2 and the high range of F+ = 12, which respectively correspond to the natural instability frequencies of the separated shear layer and higher order frequencies (0.2 ≤ F+ ≤ 12). The study was conducted under incompressible flow conditions, with a high Reynolds number of 1 × 10⁶, and an angle of attack of 16°, where the maximum lift was obtained. This study aimed to enhance aerodynamic efficiency and maximum lift through an unsteady flow investigation. Furthermore, it aimed to increase knowledge regarding the mechanisms that are effective in augmenting instantaneous lift and diminishing instantaneous drag.
The study demonstrated that utilizing pulsed jet actuation upstream of the separation point over the supercritical airfoil at a high angle of attack effectively postponed flow separation for all actuation frequencies. This led to an enhanced lift-to-drag ratio for all controlled cases with a maximum lift-to-drag increase of 28.62% at F+ = 1. In this study, the low reduced frequency of F+ = 1 produced the greatest time-averaged lift increment of 12.21%, while the high reduced frequency of F+ = 12 resulted in the highest time-averaged drag reduction of 15.7%. Furthermore, the aerodynamic forces experienced slight changes with the actuation frequencies in controlled cases at reduced frequencies exceeding F+ = 4, suggesting that the enhancement of aerodynamic characteristics becomes restricted when actuation frequency is high enough.
Temporal evolution of lift coefficient during an actuation cycle at different reduced frequencies showed that the controlled cases with low actuation frequencies of F+ = 0.2, 1, and 1.2 produced time-dependent aerodynamic forces that oscillated around the mean values. Therefore, it can increase the load fluctuations on the airfoil. The results showed that the oscillation of lift and drag forces gradually disappeared from low to high reduced frequency. Therefore, high actuation frequencies of F+ = 2.4, 4, 6, and 12 generated almost time-invariant aerodynamic forces during each phase in a cycle.
Investigating the evolution of the streamline and vorticity field for different reduced frequencies in an actuation cycle showed that in all the controlled cases, the interaction of the pulsed air jet with the crossflow generated patches of vorticity near the airfoil surface and within the turbulent boundary layer. Therefore, in addition to increasing the momentum of the near-wall flow, the patches of vorticity enhanced the momentum exchange between the outer parts of the boundary layer with high momentum flow and the region near the surface with low momentum flow. It was also found that the patches of vorticity were smaller and less intense in the controlled cases with high frequencies compared to the low frequencies due to the short duration of the blowing phase. However, in controlled cases with high frequencies, the high shedding sequence of patches of vorticity and the hysteresis effect had a positive impact on reducing fluctuation of aerodynamic coefficients compared to the low frequencies.
Data availability statement
The original contributions presented in the study are included in the article/Supplementary Material, further inquiries can be directed to the corresponding author.
Author contributions
SA: Investigation, Methodology, Software, Writing–original draft, Writing–review and editing.
Funding
The author(s) declare that no financial support was received for the research, authorship, and/or publication of this article.
Conflict of interest
The author declares that the research was conducted in the absence of any commercial or financial relationships that could be construed as a potential conflict of interest.
Publisher’s note
All claims expressed in this article are solely those of the authors and do not necessarily represent those of their affiliated organizations, or those of the publisher, the editors and the reviewers. Any product that may be evaluated in this article, or claim that may be made by its manufacturer, is not guaranteed or endorsed by the publisher.
References
Abdolahipour, S., Mani, M., and Ahmadi Dehaghi, G. M. (2011). Numerical and experimental study of the influence of damage on the aerodynamic characteristics of a finite wing. Fluids Eng. Div. Summer Meet. 44403, 1441–1447. doi:10.1115/AJK2011-03055
Abdolahipour, S., Mani, M., and Render, P. M. (2007). “Numerical investigation into the aerodynamic characteristics of wings with triangular shape damage in different span positions,” in Proceedings of the 15th Annual Conference of the CFD Society of Canada, Toronto, Ontario, May 2007, 27–31.
Abdolahipour, S., Mani, M., and Shams Taleghani, A. (2022a). Experimental investigation of flow control on a high-lift wing using modulated pulse jet vortex generator. J. Aerosp. Eng. 35 (5), 05022001. doi:10.1061/(asce)as.1943-5525.0001463
Abdolahipour, S., Mani, M., and Shams Taleghani, A. (2022b). Pressure improvement on a supercritical high-lift wing using simple and modulated pulse jet vortex generator. Flow, Turbul. Combust. 109 (1), 65–100. doi:10.1007/s10494-022-00327-9
Abdolahipour, S., Mani, M., and Taleghani, A. S. (2021). Parametric study of a frequency-modulated pulse jet by measurements of flow characteristics. Phys. Scr. 96 (12), 125012. doi:10.1088/1402-4896/ac2bdf
Amitay, M., and Glezer, A. (2002a). Controlled transients of flow reattachment over stalled airfoils. Int. J. Heat Fluid Flow 23 (5), 690–699. doi:10.1016/s0142-727x(02)00165-0
Amitay, M., and Glezer, A. (2002b). Role of actuation frequency in controlled flow reattachment over a stalled airfoil. AIAA J. 40 (2), 209–216. doi:10.2514/2.1662
Bauer, M. (2015). Design and application of a fluidic actuator system for high lift flow control. Ph.D. Dissertation. Berlin, Germany: Technical University of Berlin.
Bernardini, C., Benton, S. I., Chen, J. P., and Bons, J. P. (2014). Pulsed jets laminar separation control using instability exploitation. AIAA J. 52 (1), 104–115. doi:10.2514/1.j052274
Boutilier, M. S., and Yarusevych, S. (2012). Parametric study of separation and transition characteristics over an airfoil at low Reynolds numbers. Exp. Fluids 52 (6), 1491–1506. doi:10.1007/s00348-012-1270-z
Buchmann, N. A., Atkinson, C., and Soria., J. (2013). Influence of ZNMF jet flow control on the spatio-temporal flow structure over a NACA-0015 airfoil. Exp. Fluids 54, 1–14. doi:10.1007/s00348-013-1485-7
Duvigneau, R., and Visonneau, M. (2006). Optimization of a synthetic jet actuator for aerodynamic stall control. Comput. fluids 35 (6), 624–638. doi:10.1016/j.compfluid.2005.01.005
Feero, M. A. (2018). Investigation of synthetic jet flow control parameters for the mitigation of laminar boundary layer separation. Ph.D. Dissertation. Toronto, Canada: University of Toronto.
Feero, M. A., Goodfellow, S. D., Lavoie, P., and Sullivan, P. E. (2015). Flow reattachment using synthetic jet actuation on a low-Reynolds-number airfoil. AIAA J. 53 (7), 2005–2014. doi:10.2514/1.j053605
Feero, M. A., Lavoie, P., and Sullivan, P. E. (2017). Influence of synthetic jet location on active control of an airfoil at low Reynolds number. Exp. Fluids 58 (8), 99. doi:10.1007/s00348-017-2387-x
Glezer, A. (2011). Some aspects of aerodynamic flow control using synthetic-jet actuation. Philosophical Trans. R. Soc. A Math. Phys. Eng. Sci. 369 (1940), 1476–1494. doi:10.1098/rsta.2010.0374
Glezer, A., Amitay, M., and AndrewHonohan, M. (2005). Aspects of low-and high-frequency actuation for aerodynamic flow control. AIAA J. 43 (7), 1501–1511. doi:10.2514/1.7411
Greenblatt, D., and Wygnanski, I. J. (2000). The control of flow separation by periodic excitation. Prog. Aerosp. Sci. 36 (7), 487–545. doi:10.1016/s0376-0421(00)00008-7
Haucke, F., and Nitsche, W. (2013). “Active separation control on a 2D high-lift wing section towards high Reynolds number application,” in Proceedings of the The 31st AIAA Applied Aerodynamics Conference, California, June 2013.
Hecklau, M., Salazar, D. P., and Nitsche, W. (2013). “Influence of the actuator jet angle on the reattachment process with pulsed excitation,” in New results in numerical and experimental fluid Mechanics VIII (Berlin: Springer Verlag), 143–150.
Hipp, K. D., Walker, M. M., Benton, S. I., and Bons, J. P. (2016). Control of poststall airfoil using leading-edge pulsed jets. AIAA J. 55 (2), 365–376. doi:10.2514/1.j055223
McManus, K., Joshi, P., Legner, H., and Davis, S. (1995). “Active control of aerodynamic stall using pulsed jet actuators,” in Proceedings of the Fluid Dynamics Conference, San Diego,CA,U.S.A., June 1995, 2187.
Mirzaei, M., Taleghani, A. S., and Shadaram, A. (2012). Experimental study of vortex shedding control using plasma actuator. Appl. Mech. Mater. 186, 75–86. doi:10.4028/www.scientific.net/amm.186.75
Mohammadi, M., and Taleghani, A. S. (2014). Active flow control by dielectric barrier discharge to increase stall angle of a NACA0012 airfoil. Arabian J. Sci. Eng. 39, 2363–2370. doi:10.1007/s13369-013-0772-1
Munday, P. M., and Taira, K. (2018). Effects of wall-normal and angular momentum injections in airfoil separation control. AIAA J. 56 (5), 1830–1842. doi:10.2514/1.j056303
NASA Technical Memorandum 81912 (2013). Low-speed aerodynamic characteristics of a 14-percent-thick NASA phase 2 supercritical airfoil designed for a lift coefficient of 0.7.
Radespiel, R., Burnazzi, M., Casper, M., and Scholz, P. (2016). Active flow control for high lift with steady blowing. Aeronautical J. 120 (1223), 171–200. doi:10.1017/aer.2015.7
Salmasi, A., Shadaram, A., and Taleghani, A. S. (2013). Effect of plasma actuator placement on the airfoil efficiency at poststall angles of attack. IEEE Trans. Plasma Sci. 41 (10), 3079–3085. doi:10.1109/tps.2013.2280612
Seifert, A., Greenblatt, D., and Wygnanski, I. J. (2004). Active separation control: an overview of Reynolds and mach numbers effects. Aerosp. Sci. Technol. 8 (7), 569–582. doi:10.1016/j.ast.2004.06.007
Sheikholeslam Noori, S. M., Shams Taleghani, S. A., and Taeibi, M. (2020). Phenomenological investigation of drop manipulation using surface acoustic waves. Microgravity Sci. Technol. 32, 1147–1158. doi:10.1007/s12217-020-09839-3
Sheikholeslam Noori, S. M., Shams Taleghani, S. A., and Taeibi, M. (2021). Surface acoustic waves as control actuator for drop removal from solid surface. Fluid Dyn. Res. 53 (4), 045503. doi:10.1088/1873-7005/ac12af
Stalnov, O., and Seifert, A. (2010). On amplitude scaling of active separation control. Act. Flow Control II , Notes Numer. Fluid Mech. Multidiscip. Des. 108, 63–80. doi:10.1007/978-3-642-11735-0_5
Taeibi, M., Shams Taleghani, S. A., Sheikholeslam Noori, S. M., and Ahmadi, G. (2022). Computational simulation of water removal from a flat plate, using surface acoustic waves. Wave Motion 111, 102867. doi:10.1016/j.wavemoti.2021.102867
Taleghani, A. S., Shadaram, A., and Mirzaei, M. (2012). Effects of duty cycles of the plasma actuators on improvement of pressure distribution above a NLF0414 airfoil. IEEE Trans. Plasma Sci. 40 (5), 1434–1440. doi:10.1109/tps.2012.2187683
Taleghani, A. S., Shadaram, A., Mirzaei, M., and Abdolahipour, S. (2018). Parametric study of a plasma actuator at unsteady actuation by measurements of the induced flow velocity for flow control. J. Braz. Soc. Mech. Sci. Eng. 40 (4), 173. doi:10.1007/s40430-018-1120-x
Tuck, A., and Soria, J. (2008). Separation control on a NACA 0015 airfoil using a 2D micro ZNMF jet. Aircr. Eng. Aerosp. Technol. 80 (2), 175–180. doi:10.1108/00022660810859391
Walker, M. M., Hipp, K. D., Benton, S. I., and Bons, J. P. (2018). Effect of jet spacing on swept-wing leading-edge separation control. AIAA J. 56 (7), 2907–2910. doi:10.2514/1.j056352
Wild, J. (2015). Mach-, Reynolds- and sweep effects on active flow separation control effectivity on a 2-element airfoil wing. Act. Flow Combust. Control 127, 87–100. doi:10.1007/978-3-319-11967-0_6
Wu, J.-Z., Lu, X.-Y., Denny, A. G., Fan, M., and Wu, J.-M. (1998). Post-stall flow control on an airfoil by local unsteady forcing. J. Fluid Mech. 371, 21–58. doi:10.1017/s0022112098002055
Yarusevych, S., and Kotsonis, M. (2017). Steady and transient response of a laminar separation bubble to controlled disturbances. J. Fluid Mech. 813, 955–990. doi:10.1017/jfm.2016.848
You, D., and Parviz, M. (2008). Active control of flow separation over an airfoil using synthetic jets. J. Fluids Struct. 24 (8), 1349–1357. doi:10.1016/j.jfluidstructs.2008.06.017
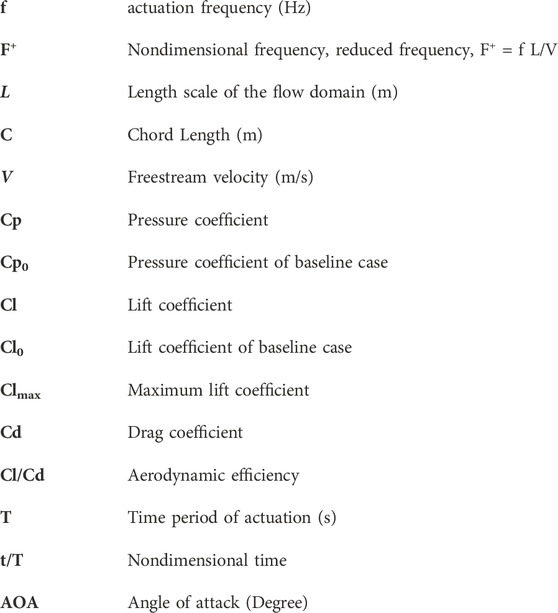
Nomenclature
Keywords: flow control, pulsed jet actuator, actuation frequency, aerodynamic performance, vortex dynamics, reduced frequency, vorticity, supercritical airfoil
Citation: Abdolahipour S (2023) Effects of low and high frequency actuation on aerodynamic performance of a supercritical airfoil. Front. Mech. Eng 9:1290074. doi: 10.3389/fmech.2023.1290074
Received: 06 September 2023; Accepted: 07 November 2023;
Published: 22 November 2023.
Edited by:
Farschad Torabi, K. N. Toosi University of Technology, IranReviewed by:
Ebrahim Afshari, University of Isfahan, IranHossein Afshar, Islamic Azad University, Iran
Copyright © 2023 Abdolahipour. This is an open-access article distributed under the terms of the Creative Commons Attribution License (CC BY). The use, distribution or reproduction in other forums is permitted, provided the original author(s) and the copyright owner(s) are credited and that the original publication in this journal is cited, in accordance with accepted academic practice. No use, distribution or reproduction is permitted which does not comply with these terms.
*Correspondence: Soheila Abdolahipour, c2FiZG9sYWhpQGFyaS5hYy5pcg==