 Iman Baratian
 Barat Ghobadian
 Ahmad Banakar
- Biosystems Engineering Department, Tarbiat Modares University, Tehran, Iran
The application of hydro turbines for harnessing water energy within distribution networks, as an alternative to pressure relief valves, is steadily increasing. These turbines are particularly suitable for recovering energy from incompressible subsonic fluid flows. In this research paper, three models of positive displacement lobe machine designed to function as water turbines were extensively examined and compared. The three selected turbine types included the circular lobe turbine, the cycloidal arc lobe turbine and the epicycloid arc lobe turbine. These turbines were meticulously designed and developed for their respective applications. Under identical operational conditions, optimization processes were applied to enhance volumetric efficiency and power efficiency for all three turbine variants, each having a different number of blades. A computer program was devised to facilitate the optimization and calculation of blade geometries under various operating conditions. This research delved into the impact of blade geometry type and the number of blades on turbine efficiency and size. The data obtained from the present investigation were systematically analyzed, and the performance of the different turbines were compared. Notably, the circular lobe turbine was found to be the largest among the three, occupying more space. The cycloidal arc requiring a greater amount of material resulting in rotor volume, which subsequently resulted in a higher overall cost. In contrast, the cycloidal arc lobe turbine emerged as the smallest variant, demanding less space for operation. Efficiency-wise, the cycloidal arc lobe turbine exhibited the highest efficiency with two blades, while the circular lobe turbine displayed the lowest efficiency with six blades. Moreover, among the turbines with the same number of lobes, the cycloidal arc lobe turbine consistently demonstrated superior efficiency compared to the circular lobe turbine.
1 Introduction
Hydrodynamics and aerodynamics have similar behavior in many engineering cases. The application of airfoils is important in both fields of aerodynamics (Taleghani et al., 2012; Salmasi et al., 2013; Shams Taleghani et al., 2020; Abdolahipour et al., 2022a; Abdolahipour et al., 2022b) and hydrodynamics (Ouro and Stoesser, 2019; Bagal and Bhardwaj, 2022; Zhang, 2022; ElHelew et al., 2023; Ferretti et al., 2023), and some airfoils such as NACA0012 and NACA 4412 are generally used in both fields (Mirzaei et al., 2012; Mohammadi and Taleghani, 2014). In many cases such as low-speed aerodynamics, the fluid flow equations are also used in hydrodynamics. This has caused some aerodynamic designers in the car industry and aeronautics to use water tunnel tests instead of wind tunnels to measure the drag coefficient (Erm and Ol, 2012; Sibilski et al., 2020; Lis et al., 2021).
In recent decades, optimizing and efficiently managing water distribution and transmission systems has become a critical concern due to growing human needs for both water resources and energy. One key factor in enhancing the performance of these systems is the efficient utilization of energy within the flowing water. This optimization holds significant importance as it not only improves the efficiency of water distribution and transmission networks but also contributes to energy conservation.
In this regard, Positive Displacement Lobe Turbines have emerged as an effective tool for energy conversion in these systems. Their utilization as intelligent alternatives to pressure-reducing valves in water distribution and transmission networks is gaining prominence. This substitution not only leads to energy savings and operational cost reduction but also offers an opportunity for harnessing renewable energy resources.
Unlike large power plants, small-scale hydropower installations often consist of a wide range of designs, layouts, and various equipment options, offering numerous choices for applications (Zhoua and Denga, 2017). However, the discussed technologies are often outdated and lack the required credibility and efficiency for in-network water distribution and conduit applications (IEA-ETSAP and IRENA, 2015).
A fundamental hydropower unit comprises a turbine and a generator. Despite their diversity, many turbines are categorized into reaction, impulse, and hydrokinetic turbines based on operational principles. Reaction turbines like Francis and Kaplan utilize water pressure and motion to generate hydrodynamic force for turbine blade rotation. Impulse turbines like Pelton, Turgo and cross-flow turbines use blades driven by high-velocity water flow. Reaction turbines are typically suited for low head systems, while impulse turbines are more suitable for medium head conditions. Nevertheless, practical applications of these turbines often involve significant overlap (McKinney, 1983). For instance, some newer impulse turbines like hydrodynamic screw turbines can also operate in low-head flows. Besides reaction and impulse turbines, there is growing interest in developing and installing hydrokinetic turbines that harness energy from water motion. Commercial hydrokinetic units are typically deployed in rivers, natural and man-made channels, and marine environments (Saria et al., 2018). The use of pumps instead of turbines (PAT) is a feasible solution but using a pump instead of a turbine reduces the overall efficiency of the machine (Liu et al., 2022).
Phommachanh et al. (2006) recommended the use of positive displacement micro-turbines for converting water energy into electricity in low-flow, high-head conditions. In their study, they compared a positive displacement turbine with an impulse turbine in a water distribution system. The results indicated that the positive displacement turbine significantly outperformed similar turbines under a wide range of operating conditions.
Yao et al. (2005) investigated the effect of the number of lobes in positive displacement pump turbines on the rotor’s input force. They utilized an epicycloidal geometry in their research, developed it and provided a higher-degree geometric equation for the tip end of the rotor to reduce pulsation and improve rotor rotation. According to their findings for an epicycloidal lobe pump, increasing the number of lobes reduces output flow pulsation, resulting in a more uniform output flow.
Li et al. (2018); Li et al. (2019); Li et al. (2020) developed a geometry for a cycloidal lobe and presented a combined geometry of convex and concave arc cycloidal for a root blower. They studied and examined this geometry in their research and developed cycloidal arc lobe geometry.
Sonawat et al. (2020) studied the use of a positive displacement turbine in a district heating water network to replace pressure reducing valves. In this study, a specific 4-lobe turbine model was investigated both theoretically and experimentally. Various factors such as pulsation and efficiency were examined, focusing on a single turbine model as chosen by the researchers.
Rotor geometry significantly influences the efficiency and performance of a lobe turbine, and it varies with the changes in geometry specifications and lobe types (Kang and Vu, 2014).
In the most previous researches, the use of a lobed machine as a pump in the network has been explored and only a few studies considered positive displacement machines as turbines within the network. Additionally, the optimal design of positive displacement machines has not been thoroughly explored and the impact of geometry and the number of lobes on their output efficiency has not been investigated. Therefore, in the current research work three different geometries of lobe positive displacement machines were investigated. Considering the use of these machines as turbines in water transmission networks, a method for optimizing blade and rotor geometry was developed. Furthermore, geometry optimization under identical operating conditions examined the effects of the number of blades and geometry type on turbine efficiency. Ultimately, the priority of using different geometries and blade counts was determined.
2 Materials and methods
2.1 Blade design geometry
The principles of operation in a turbine are such that two rotor blades rotate around their central fixed axis and rolling over without contacting each other. This study focuses on “circular lobe turbines”. Circular turbines have various types, all of which follow the same general principles but differ in the details of the blade curvature. The basic principles of designing circular and non-circular lobe turbines are the same, with the main difference being the variation in timing gears and the different rotational and linear speeds of the blades. In a lobe turbine and pumps, unlike gear types, there is no contact between the blades, and the blades are connected to a gear axis that rotates at a specific speed, allowing the blades to rotate without contacting each other. In general, the shape of the blades in a turbine can be either uniform or non-uniform. In this study, a circular turbine with uniform blades has been investigated.
2.2 Basic principles of rotor design for lob machine
Figure 1 displays a schematic cross-section of the lobe turbine rotor. In this figure,
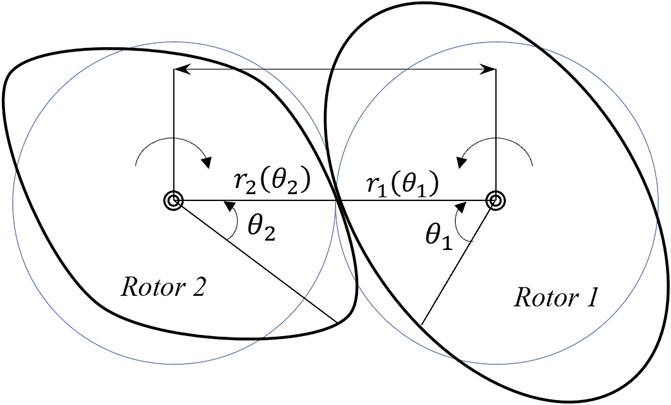
FIGURE 1. General view of the rotor and circular pitch circle.
Therefore, the rotational position of rotor 2 can be determined using Eq. 2:
If the values for
By combining the above equations, the equations of the airfoil curve can be represented in the following form, Eqs 5, 6:
Under the conditions of uniform rotation, the absence of oscillation, slip, and circular motion of the rotor, the curves of each rotor are simple and closed. This implies that the equations
In the above relation, the variable “
This study focuses on the examination of the circular base curve propeller in a lobe machine. The circular lobe machine features a circular pitch, and both of its rotors share the same rotational speed. Additionally, the radii of the pitch circles in the rotors are identical. In this specific lobe type, the rotor blades are uniform in size and shape due to the consistent base circle size and rotational speed. Typically, this rotor profile is referred to as “circular” in the lobe machine context.
2.3 Circular lobe design
A circular-toothed lobe represents one of the fundamental and widely used geometries for rotor blades, forming the basis for numerous designs. The profile of the rotor’s circular-toothed section is defined as part of a circular curve with a radius of
Figure 2 provides an illustration of the specifications for two-blade and three-blade lobes, which serve as the basis for deriving the governing equations. In a three-blade lobe, the overlap angle of the rotor tooth section is 60°, while it is 90° in a two-blade lobe. Generally, when the rotor has N number of blades, the overlap angle of the tooth circle section can be determined using Eq. 9:
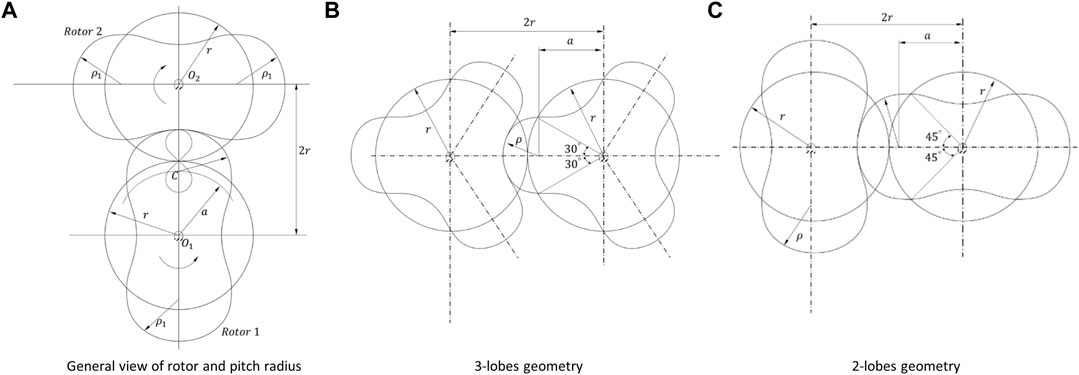
FIGURE 2. General View and lobe Geometry of circular lobe tooth profile for deriving equation.
The trigonometric relation that governs the lob turbine design is shown in Eq. 10 (Litvin and Fuentes, 2004):
This equation allows to determine the radius of the tooth circle based on the values of r and a, which are adjustable design variables. So, Eq. 1 can be used to calculate the profile of the convex section of the rotor’s tooth.
The profile of the rotor’s tooth is an essential factor in the design of lob turbines, and by adjusting r and a, the shape and performance of the rotor blades can be controlled.
The equation governing the blade tooth section is established as follows in Eq. 11 (Litvin and Fuentes, 2004):
Using the method for calculating the coordinates of contact points between the rotors, the equation describing the rotor’s tooth profile can be derived as Eq. 12 (Litvin and Fuentes, 2004):
By solving the above equation for angle ϕ, the angle θ can be calculated. Using the equations mentioned earlier, the equation governing the convex section of the blade can be derived as Eq. 13 (Litvin and Fuentes, 2004):
The maximum radius or tooth radius of the rotor can also be determined using Eq. 14 (Litvin and Fuentes, 2004):
Additionally, the relationship between the tooth radius and the minimum profile radius, which is showed on Eq. 15 is established based on Eq. 1 as follows:
With these equations, the rotor profile can be calculated. The input parameters for geometry design are values of “a” and “
2.4 Cycloidal arc lobe design
The Cycloidal Arc Lobe is derived from plotting the trajectory of a point on a circle as it rotates along another line or circle. This point can typically be situated on the outer edge or inside the circumference of the rotating circle.
The ratio of the pitch circle’s radius to the rolling circle’s radius leads to the creation of different shapes, and this approach is extensively employed in lobe rotor design. The same principle underlies the design of epicycloid rotors. In this research, two rotors with epicycloidal bases but differing geometries at the rotor tips are employed. Previous work by Yao and others has focused on epicycloidal rotors with the goal of minimizing issues related to slipping and mutual interaction between the two rotors. Drawing from their prior experiences, they divided the convex tooth section of the rotor into two parts (Yao et al., 2005): one with an epicycloidal profile and the other with a circular profile, while the concave tooth section is treated as a circular segment. Unlike the circular lobe design, the center of the convex tooth circle is positioned on the circumference of the base circle.
In Figure 3, a cross-sectional view of a three-bladed arc-cycloidal rotor is illustrated. It is evident that each tooth is composed of one convex epicycloidal section, one concave epicycloidal section and two circular arc segments. Two coordinate systems are established for the two rotors, with each rotor rotating in the opposite direction about its axis. The convex and concave arc sections have their own distinct equations. Fundamentally the primary relationships between the lobe rotors, as detailed in Section 2.2 are applicable here as well, with the only difference being in the curvature equations of the curved sections.
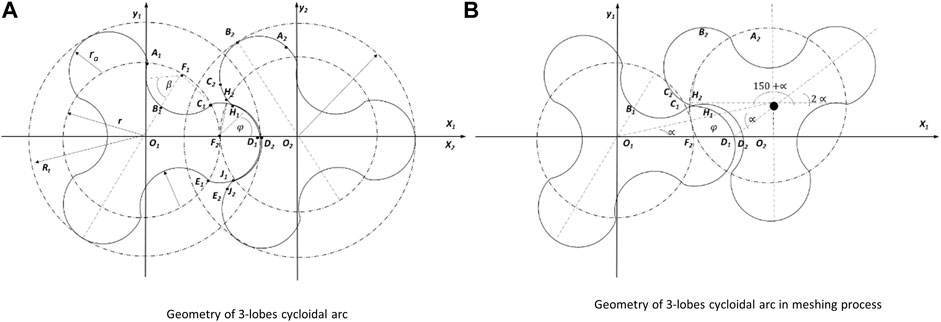
FIGURE 3. Geometry and cross-sectional view of a three-lobe cycloidal arc rotor.
Equation 16 shows the relationship between the angles depicted in Figure 3 and is valid for this particular rotor geometry (Yao et al., 2005):
In this rotor geometry, the maximum radius is equal to the sum of the base circle radius and the radius of curvature at the rotor tip. This is because the center of the rotor tip circle is positioned on the base circle which is shown in Eq. 17:
The equation for the curvature of the convex arc section of the rotor, curvature HDJ, can be also obtained based on Figure 3 as Eq. 18 (Yao et al., 2005):
Furthermore, by using the aforementioned equations and the general equations for designing lobe rotors, the equation for the curvature of the concave section of the rotor, curvature ABC, can be derived as Eq. 19 (Yao et al., 2005):
Yao et al. aimed to enhance rotor performance by incorporating a circular curvature at the termination of the convex arc section and extending the cycloidal arc with a circular segment. To achieve this, they employed an inverse computational approach based on Figure 3, resulting in the following equation that governs the cycloidal section, curvature CH as Eq. 20 (Yao et al., 2005):
Using the equations provided above, the complete geometry of the arc-cycloidal rotor can be accurately determined.
2.5 Epicycloid arc lobe design
Another type of lobe rotor examined in this study is the rotor with an epicycloidal geometry. This rotor is also a subset of cycloidal lobe rotors and follows the general principles and equations of lobe rotor geometry. In this type of lobe turbine, both convex and concave curvatures of the blade are formed by tracing a point on one circle as it rolls along another circle. Additionally, to minimize the issues of rotor slippage and mutual interaction between the blades, Li et al. have used higher-degree curves at the connection point of the convex and concave sections, leading to the development of this rotor type (Li et al., 2020).
Figure 4, illustrates the design principles and the formation of the rotor curve. Sections AB and CD represent the cycloidal regions of the rotor, while section BC is the curved area with higher degrees of curvature.
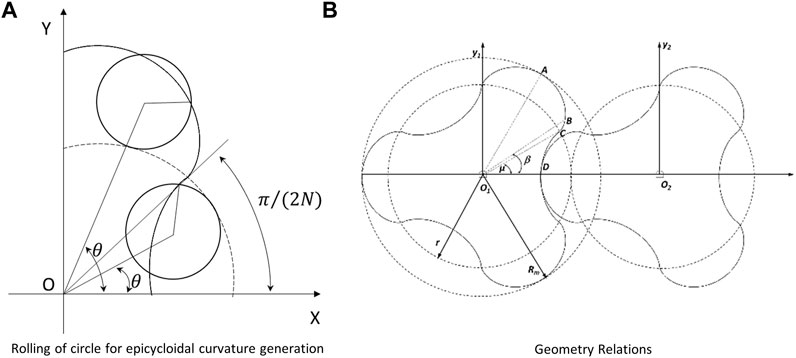
FIGURE 4. Geometric relation of epicycloidal lobe rotors.
This type of rotor, with its unique geometry, offers its own advantages and characteristics, which make it suitable for specific applications within the broader category of the lobe rotors.
The curve for the tip section of the rotor; the curvature of section AB is obtained from Eq. 21 (Li et al., 2020):
Furthermore, the curve for the convex section of the rotor; the curvature of section CD is obtained from Eq. 22 (Li et al., 2020):
The equation governing the curve of the higher-degree section of the rotor; section BC is also developed as Eq. 23 (Li et al., 2020):
In the equation above,
To optimize the above equation constraints are utilized based on Eq. 25 (Li et al., 2020):
In the above equations,
With these equations, the complete geometry of the epicycloidal rotor can be calculated and designed.
2.6 Optimization of rotors
The calculation of the rotor’s geometric profile was explained in the previous section. For a given volume, there are thousands of different turbine designs with various geometric dimensions that can be used. To design an appropriate rotor and turbine, it is essential to relate geometric parameters to relevant performance parameters. The most critical performance parameters for hydraulic machines are the volumetric efficiency and the output power. Initially, functional parameters must be linked to the machine’s efficiency to perform the design based on higher efficiency.
In the previous section, the process of calculating the geometric profile of the rotor was discussed. When designing a turbine, it is crucial to establish a connection between geometric parameters and key performance indicators. Among the most critical performance parameters for hydraulic machines are volumetric efficiency and output power. To initiate the design process, it is essential to establish a relationship between geometric parameters and efficiency, with an emphasis on achieving higher efficiency.
The power efficiency of the machine, denoted as
In the above equation,
Efficiency is a crucial factor in the design process, as it directly impacts the performance and effectiveness of the hydraulic turbine. Optimizing geometric parameters with a focus on enhancing efficiency can lead to more effective and energy-efficient turbines.
The equation for volumetric efficiency
The goal in turbine design is to maximize volumetric efficiency, which means achieving a high ratio of actual flow rate to ideal flow rate bases on Eq. 27. High volumetric efficiency indicates that the turbine is effectively converting the incoming fluid into mechanical energy, minimizing losses and waste.
The actual turbine flow rate is calculated from the difference between the inlet and outlet flow rates which is showed on Eq. 28:
The ideal turbine flow rate can be written as Eq. 29:
The lobe machine uses a structure, identical to that of a pump for power generation purposes with the only difference being in the analysis and operation. Therefore, essentially a pump instead of a turbine is used with different design objectives. However, pump design parameters can also be used in turbine design. For this purpose, the dimensionless parameter called the “pumping ratio” is used, which depends only on rotor geometry.
The concept of the “pumping ratio” is an important parameter in the design and analysis of lobe machines that are used as pumps or turbines. This dimensionless parameter is primarily determined by the geometry of the rotor and provides valuable insights into the machine’s performance. The pumping ratio itself is a dimensionless quantity, and it quantifies the machine’s ability to transfer fluid from the inlet to the outlet. It depends on rotor geometry and is a key factor in assessing the machine’s performance.
By calculating the pumping ratio, can gain insights into how the machine’s geometry and configuration affect its fluid-handling capabilities and helping to optimize performance for specific applications, such as a pump or a turbine.
The equation provided defines the pumping ratio (
The relationship described in the provided Eqs 19, 20 highlights an essential aspect of the design and performance of lobe machines that function as pumps or turbines.
Based on this relationship, it can be observed that if two pumps have the same size and rotor speed and the pump with a higher pumping ratio has a greater water output. This observation holds true for turbines as well. By combining Eqs 19, 20, Eq. 31 is obtained:
To use the dimensionless pumping ratio in rotor design, the mathematical relationship between them needs to be determined. In Figure 5, the area of the region exiting the turbine in each rotor rotation is denoted as B. The ideal output volume in each rotor rotation can be calculated as Eq. 32:
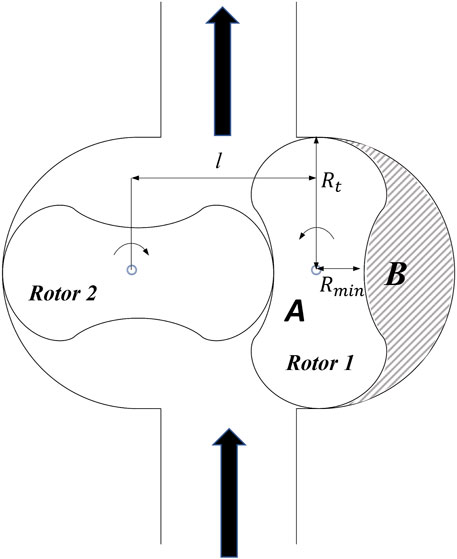
FIGURE 5. Schematic of fluid sections in lobe turbine.
In the above equation, N represents the number of rotor blades, and w is the blade length. The rotor area is denoted as A. Now, by using the above relationship, the pumping ratio can be rewritten as Eq. 33:
Using the equation above, the effects of changing the geometric profile of the rotor on the pumping ratio can be studied. To do this, the efficiency equations using
This equation represents the power efficiency
So, the volumetric efficiency,
To investigate the effects of altering the geometric profile of the rotor on the pumping ratio (
In Figure 6, the relationship between volumetric efficiency (
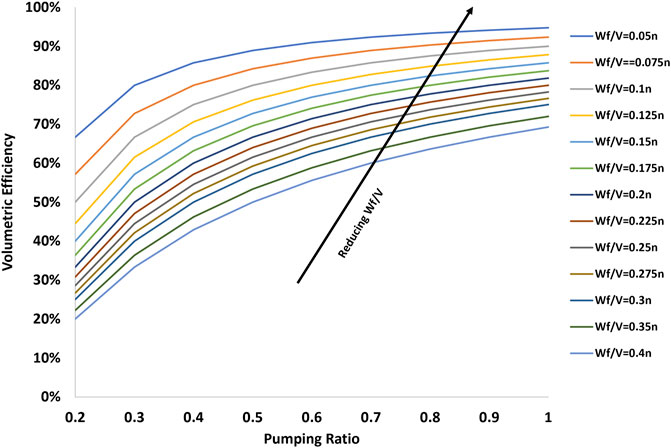
FIGURE 6. Variation of
Figure 7 illustrates the variation in power efficiency (
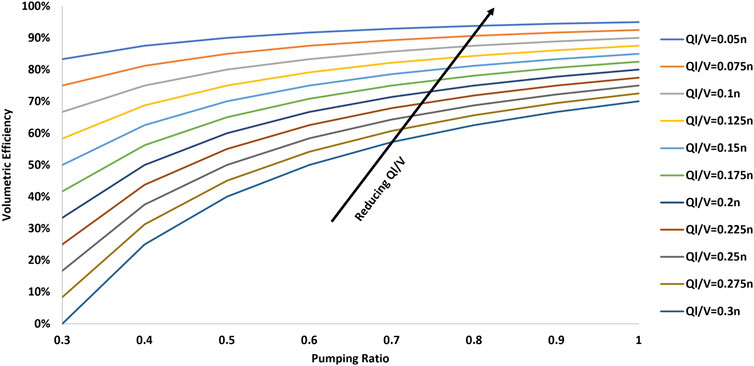
FIGURE 7. Variation of
These observations highlight the crucial role of selecting appropriate geometric parameters for the rotor to optimize efficiency and overall turbine performance under specified operating conditions.
To enhance the rotor design, a computer program was devised for determining the geometric parameters of the rotor. The objective was to maximize the output efficiency while considering the specified input conditions at the design point. The program takes into account the crucial input factors such as the maximum runner speed, the maximum fluid flow rate, and the desired number of lobes. Using these initial conditions, the program calculates both the pitch circle radius and the maximum tips radius to ensure that the turbine achieves peak output efficiency.
By inputting these parameters into the computer program, the geometric specifications of the runner, including the base circle radius and maximum radius are calculated to create an optimized turbine with the highest efficiency under the specified input conditions. SQP algorithm which is a versatile and effective method for solving nonlinear constrained optimization problems, have been used in this research.
The results indicate that using this computer program and adjusting the input parameters, it is possible to achieve the design of turbines with maximum efficiency under specific input conditions. It was assumed uniform operating conditions, including a maximum runner speed of 40 rotations per minute and a maximum fluid flow rate of 0.5 cubic meters per minute as design boundary conditions. Furthermore, the width of the runner is assumed to be 0.8 times the maximum length of the runner, with a constant length-to-width ratio of the runner.
By providing these parameters as input to the computer program, it performs calculations to determine the rotor’s geometric specifications, which include the pitch circle radius and the maximum radius. This process results in an optimized turbine configuration that can achieve the highest efficiency while operating under the specified input conditions.
The algorithm of optimization is briefly as follow:
• Input initial conditions and design parameters including: rotation speed, flow rate, lobe number, geometry
nput first evaluation of geometry design (pitch radius and tip radius)
• Geometry calculation for desire point
•
• Maximize
• Geometry design for optimum point
The research findings suggest that using this computer program and the adjustment of input parameters, it becomes feasible to design turbines that can operate with maximum efficiency under specific input conditions. The study maintained consistent operating conditions, including a maximum runner speed of 40 rpm and a maximum fluid flow rate of 0.5 cubic meters per minute, serving as the design boundary conditions. Additionally, the width of the runner was assumed to be 0.8 times the maximum length of the runner, maintaining a constant length-to-width ratio for the rotor.
3 Results and discussion
The optimization process and design of Circular lobe turbines ranging from 2 to 6 lobes have been systematically carried out. In this particular turbine configuration, two parameters, namely, the pitch circle radius and the radius of blade curvature (tips radius), are fundamental in the comprehensive rotor design. It's important to note that for each parameter, there exists a multitude of potential rotor designs, resulting in a vast design space. By adjusting one of these parameters while maintaining the other constant, it leads to the creation of diverse rotor designs, which, in turn, can yield entirely distinct turbine configurations. Figure 8 visually portrays a selection of these rotor designs, each characterized by different ratios of the base circle radius to the radius of blade curvature.
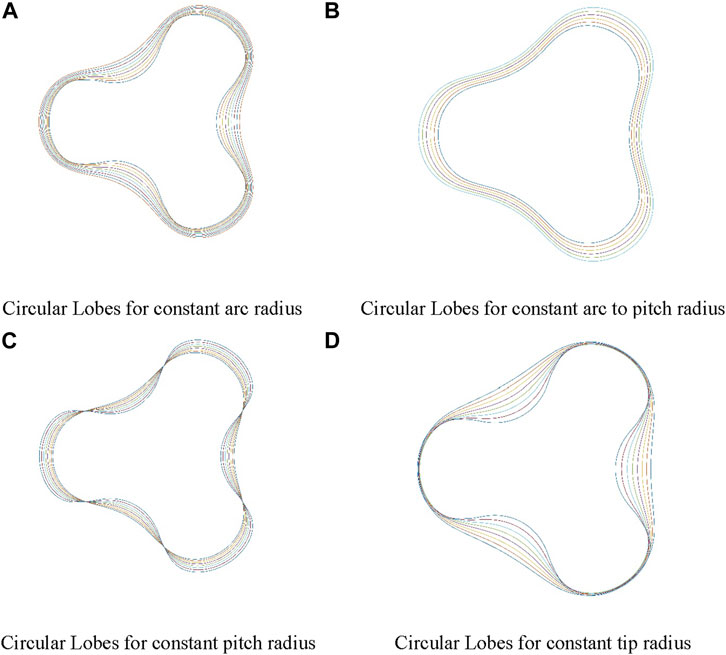
FIGURE 8. Various design of circular lobe based on different pitch radius and arc radius (A) Circular lobes for constant arc radius (B) Circular lobes for constant arc to pitch radius (C) Circular lobes for constant pitch radius (D) Circular lobes for constant tip radius.
The optimization process for the designated design point was executed through utilization of a specialized computer program. Figure 9 offers graphical representations of the rotor designs across varying blade counts.
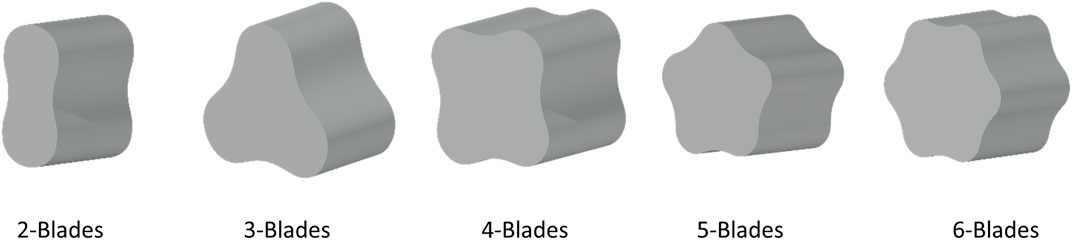
FIGURE 9. Circular rotor designs across varying lobes counts.
This approach not only facilitates the exploration of an extensive spectrum of rotor designs for circular lobe turbines but also enables the fine-tuning of their performance characteristics to align with specific lobe counts by adjusting the pitch circle radius and radius of blade curvature while preserving the other pertinent factors as constants.
In the realm of Cycloidal Arc lobe rotor configuration, the interplay between the number of blades and the base circle radius serves as the cornerstone for the comprehensive rotor calculation. Consequently, for each distinctive shell and corresponding pitch circle radius, there exists a singular and unique rotor configuration.
The design of Cycloidal Arc lobe rotors, tailored to a specific design point, was diligently executed while accommodating a range of blade counts. For each design point, the optimal rotor geometry was meticulously calculated and devised. Figure 10 furnishes visual depictions of the resulting rotor designs across varying blade counts.
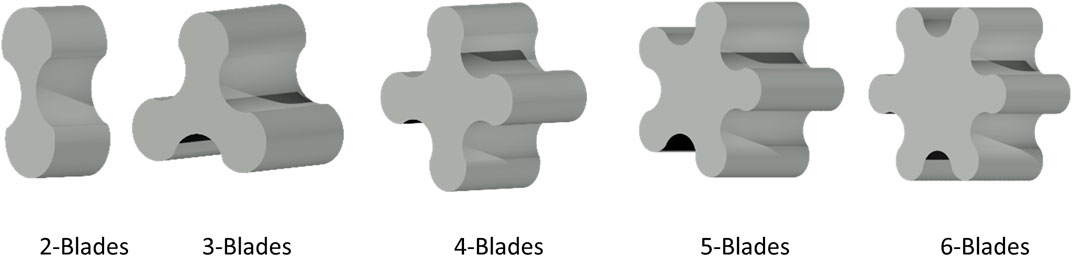
FIGURE 10. Cycloidal arc rotor designs across varying lobes counts.
This strategic approach not only empowers the fine-tuning of Cycloidal Arc lobe rotor designs in accordance with predefined design points but also offers the flexibility to adapt differing blade counts, thereby generating distinct and tailored geometries for each configuration.
Figure 11 offers graphical depictions of the geometry for diverse design configurations within Epicycloidal Arc rotor category. This strategic approach empowers the fine-tuning of Epicycloidal Arc lobe rotor designs based on the defined design point and varying blade counts. The result is a collection of unique geometries for each configuration, setting them apart from the cycloidal lobe with distinctive design features. Epicycloidal Arc lobe and Cycloidal Arc lobe, though both falling within the same category of rotors, exhibit distinct variations in the curvature of their blade tips. Similar to the cycloidal lobe, this rotor type’s blade geometry can be precisely determined by specifying the base circle radius and the number of blades. Each combination of radius and blade count yields a one-of-a-kind rotor design, distinguished by its unique design nuances compared to the cycloidal lobe. Furthermore, adhering to the parameters of a designated design point and encompassing various rotor blade counts, an optimization process was conducted to refine the design of this turbine.
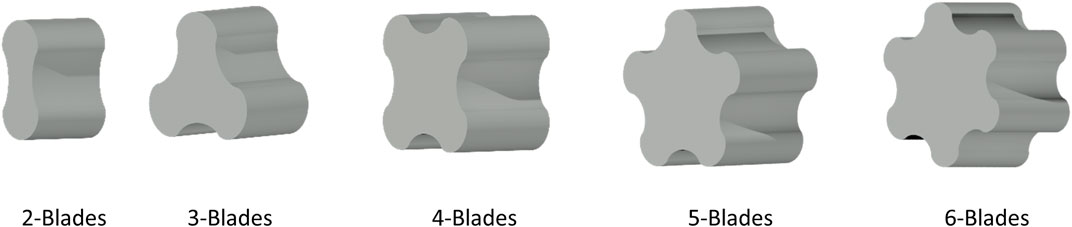
FIGURE 11. Epicyloidal arc rotor designs across varying lobes counts.
For a specific design point, an examination of three distinct types of lobe turbine rotors was conducted investigating each rotor model across a range of lobe counts thoroughly, spanning from two to six blades. This comprehensive research resulted in a total of 15 unique optimized designs, all sharing consistent input parameters but differing in rotor type and blade count. Figure 12, provides graphical representation offers a detailed overview of the obtained outcomes, particularly focusing on the pump ratio (
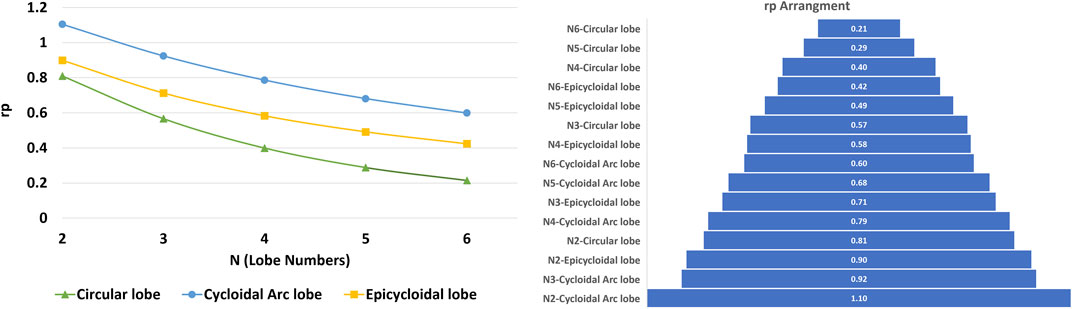
FIGURE 12. Changes in
In brief, the results shed light on a notable trend: an increase in the number of blades within lobe turbine rotors tends to correlate with reduced efficiency. Additionally, it is observed that, overall, the Cycloidal Arc rotor outperforms the Epicycloidal Arc rotor in terms of efficiency, with the Circular rotor exhibiting lower efficiency levels in comparison to both of these alternatives.
However, when comparing different rotor lobe counts, the general order of increasing efficiency is not always consistent, and the sequence of optimal designs can vary. Figure 12 illustrates the arrangement of various optimal designs based on rotor type and blade count, sorted by their efficiency levels. As observed, the Cycloidal Arc rotor with two blades attains the highest efficiency, followed by the same rotor with three blades. In the next position, the epicycloidal rotor with two blades, despite being of a different rotor type, exhibits higher efficiency than both Cycloidal Arc and Circular rotor types, followed by the Circular rotor with two blades. This demonstrates that the number of rotor blades holds greater significance compared to the rotor geometry type.
Based on Figure 12, it can be summarized that as the number of rotor blades increases, the geometric efficiency of the rotor decreases. Therefore, the Cycloidal Arc rotor with two blades achieves the highest efficiency, while the Circular rotor with six blades demonstrates the lowest efficiency.
Figure 13 illustrates the variation in Rm for different optimal rotor design. The maximum rotor radius represents the volume occupied by the rotor and the rotor shell. Therefore, a smaller rotor blade tip radius occupies less space and is more favorable both physically and economically. As observed, the Circular lobe rotor has the largest rotor radius, while the Cycloidal arc lobe rotor exhibits the smallest maximum radius and is the preferred choice in the first priority. Additionally, for a lower number of lobes, especially in the case of two lobes, this parameter is relatively similar for various blade geometries, and as the number of lobes increases, both the rotor radius and the spacing between different rotor types increase.
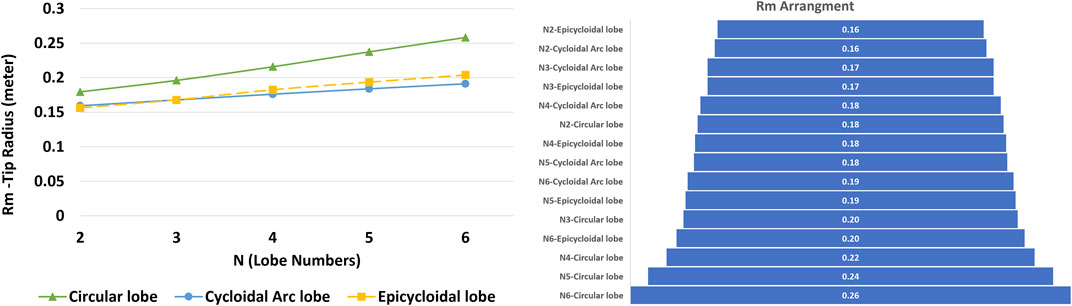
FIGURE 13. Changes in
The order of rotor radii in the 15 optimal configurations, is shown in Figure 13. This graph illustrates that as the number of rotor lobes increases, the maximum radius and the space occupied by the turbine also increase. Furthermore, upon examining this parameter, it becomes evident that the 2-lobe rotor with cycloidal arc and epicycloidal geometry has the smallest Rm and, consequently, the best design. Conversely, the 6-blade circular rotor has the largest Rm, which should be avoided.
The examination of rotor radius results shows a strong correlation with rotor efficiency. The prioritization of rotors based on efficiency aligns closely with their prioritization based on maximum radius. The trend governing the maximum rotor radius remains consistent with that of the pitch circle radius. The variation in pitch circle radius for different optimal designs is illustrated in Figure 14. The pitch circle radius directly affects the rotor’s efficiency and the occupied cross-sectional area, although it does not have a direct impact on the efficiency or volume occupied by the rotor.
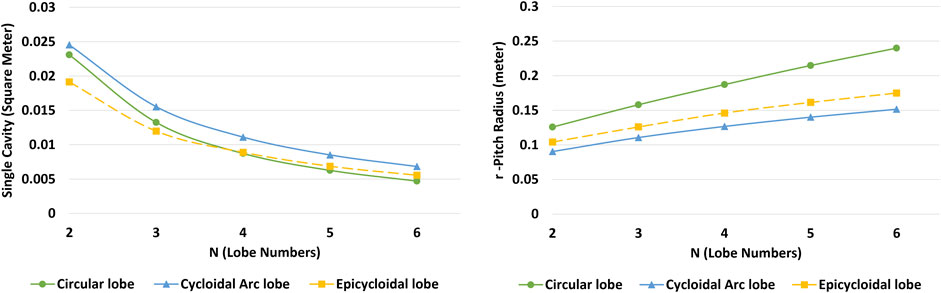
FIGURE 14. Changes in pitch radius and single cavity for different rotors based on the number of blades.
Another factor indirectly influencing the selection of an optimal design is the “single cavity”. This factor affects the choice of the optimal geometry by influencing
Figure 15 illustrates the variations in rotor volume. As observed, the cycloidal arc lobe rotor has the highest volume and, consequently, the highest material consumption, while the epicycloidal rotor has the lowest material consumption.
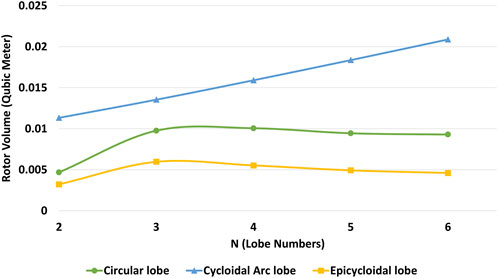
FIGURE 15. Changes in rotor volume for different rotors based on the number of blades.
An examination of the rotor volume change chart reveals that there is no specific correlation between turbine efficiency, weight, volume, and material consumption. Therefore, to make an informed choice for the optimal design, real-world design should rely on techno-economic optimization based on actual operating conditions and the type of raw material used. Given the diversity of raw materials and different operating conditions, especially operational costs and income from work, this decision should be investigated for specific conditions, and it cannot be universally optimized and analyzed.
4 Conclusion
In this paper, three different geometries of lobe turbines, including circular lobe, circular arc lobe, and epicycloidal arc lobe, have been examined, optimized, and compared. Specific operating conditions were defined and based on these conditions, the optimum rotor blade design for each geometry with different blade numbers was carried out to maximize turbine efficiency. In total, 15 different optimized geometries were designed and calculated, and the results were compared. The findings of this research can be summarized as follows:
• For all different geometries, increasing the number of rotor blades leads to a decrease in volumetric efficiency and hydraulic efficiency of the turbine. Increasing in the number of blades, leads to decrease in pumping ratio from 1.1 to 0.6 for Cycloidal Arc lobe while it varies from 0.9 to 0.49 for Epicycloidal Arc lobe and from 0.81 to 0.21 for Circular Lobe.
• The cycloidal arc lobe turbine has a higher overall efficiency compared to the circular lobe and epicycloidal arc lobe turbines. This relationship holds true even for the same number of lobes. Maximum value of pumping ratio resulting maximum efficiency has been calculated for 2-Lobe Cycloidal Arc lobe and is equal to 1.1 which is higher than 0.90 for 2-Lobe Epicyloial Arc lobe and the lowest value for 2-Lobe is 0.81 for Circular lobe.
• The cycloidal arc lobe turbine with two lobes has the highest efficiency, while the circular lobe turbine with six lobes has the lowest efficiency. The highest pumping ratio is 1.1 for 2-Lobe Cycloidal Arc lobe and the lowest is 0.21 for 6-Lobe Circular lobe.
• Circular lobe turbines occupy more space, while cycloidal arc lobe turbines occupy less space compared to the other turbines. Tip radius of rotor, which is the index for spacing, has highest value for 6-Lobe circular lobe equal to 0.26, while the minimum amount is 0.16 for 2-lobe epicyloidal lobe.
• The “Cycloidal arc lobe” rotor has the highest volume, which is equal to 0.0113 cubic meter for 2-Lobe rotor and, consequently, the highest material consumption, while the epicycloidal rotor has the lowest volume which is equal to 0.0032 cubic meter and, consequently, the least material consumption.
• Considering factors such as available space, economic considerations, operating fluid properties, and specific working conditions such as pulse problems, the optimal design point and the suitable model and number of blades should be selected.
• In conclusion, this research work highlights the importance of selecting the right turbine geometry and blade count based on specific operational and fluid properties. The findings emphasize the need for careful consideration of these factors to optimize turbine design for various applications and conditions.
Data availability statement
The raw data supporting the conclusion of this article will be made available by the authors, without undue reservation.
Author contributions
IB: Conceptualization, Data curation, Formal Analysis, Methodology, Project administration, Resources, Software, Supervision, Validation, Visualization, Writing–original draft, Writing–review and editing. BG: Conceptualization, Data curation, Methodology, Project administration, Supervision, Writing–original draft, Writing–review and editing. AB: Conceptualization, Data curation, Methodology, Project administration, Supervision, Writing–original draft, Writing–review and editing.
Funding
The author(s) declare that no financial support was received for the research, authorship, and/or publication of this article.
Conflict of interest
The authors declare that the research was conducted in the absence of any commercial or financial relationships that could be construed as a potential conflict of interest.
Publisher’s note
All claims expressed in this article are solely those of the authors and do not necessarily represent those of their affiliated organizations, or those of the publisher, the editors and the reviewers. Any product that may be evaluated in this article, or claim that may be made by its manufacturer, is not guaranteed or endorsed by the publisher.
References
Abdolahipour, S., Mani, M., and Shams Taleghani, A. (2022a). Experimental investigation of flow control on a high-lift wing using modulated pulse jet vortex generator. J. Aerosp. Eng. 35 (5), 05022001. doi:10.1061/(asce)as.1943-5525.0001463
Abdolahipour, S., Mani, M., and Shams Taleghani, A. (2022b). Pressure improvement on a supercritical high-lift wing using simple and modulated pulse jet vortex generator. Flow, Turbul. Combust. 109 (1), 65–100. doi:10.1007/s10494-022-00327-9
Bagal, N. L., and Bhardwaj, D. (2022). 48V EGR pump system development and fuel benefit evaluation. Front. Mech. Eng. 8, 673134. doi:10.3389/fmech.2022.673134
ElHelew, W. K., Abdelmaqsoud, A. M., ElBagoury, K. F., and Shanan, H. A. (2023). Technical and economic evaluation of an engine and irrigation pump using a T-type mixer for natural gas. Front. Mech. Eng. 8, 1081659. doi:10.3389/fmech.2022.1081659
Erm, L. P., and Ol, M. V. (2012). An assessment of the usefulness of water tunnels for aerodynamic investigations. Australia: Defence Science And Technology Organisation Victoria.
Ferretti, P., Pagliari, C., Montalti, A., and Liverani, A. (2023). Design and development of a peristaltic pump for constant flow applications. Front. Mech. Eng. 9, 1207464. doi:10.3389/fmech.2023.1207464
IEA-ETSAP and IRENA (2015). Hydropower: Technology brief. Available at: http://www.irena.org/DocumentDownloads/Publications/IRENAETSAP_Tech_Brief_E06_Hydropower.pdf (Accessed July 31, 2017).
Kang, Y. H., and Vu, H. (2014). A newly developed rotor profile for lobe pumps: generation and numerical performance assessment. J. Mech. Sci. Technol. 28 (3), 915–926. doi:10.1007/s12206-013-1159-7
Li, Y., Du, J., and Guo, D. S. (2019). Numerical research on viscous oil flow characteristics inside the rotor cavity of rotary lobe pump. J. Braz. Soc. Mech. Sci. Eng. 41, 274. doi:10.1007/s40430-019-1781-0
Li, Y., Guo, D., Fan, Z., and Du, J. (2020). Effects of different blade numbers on radial exciting force of lobe pump rotor. Int. J. Fluid Mach. Syst. 13 (No. 2), 281–291. doi:10.5293/ijfms.2020.13.2.281
Li, Y., Guo, D. S., and Li, X. (2018). Mitigation of radial exciting force of rotary lobe pump by gradually varied gap. Eng. Appl. Comput. Fluid Mech. 12, 711–723. doi:10.1080/19942060.2018.1517053
Lis, D., Januszko, A., and Dobrocinski, T. (2021). A flow analysis using a water tunnel of an innovative unmanned aerial vehicle. Appl. Sci. 11 (13), 5772. doi:10.3390/app11135772
Litvin, L. F., and Fuentes, A. (2004). Gear Geometry and applied theory. Cambridge: Cambridge University Press.
Liu, M., Tan, L., and Cao, S. (2022). Performance prediction and geometry optimization for application of pump as turbine: a review. Front. Energy Res. 9. Article 818118. doi:10.3389/fenrg.2021.818118
McKinney, J. D. (1983). Microhydropower handbook. Idaho Falls, Idaho: Technical Information Center - U.S. Department of Energy.
Mirzaei, M., Taleghani, A. S., and Shadaram, A. (2012). Experimental study of vortex shedding control using plasma actuator. Appl. Mech. Mater. 186, 75–86. doi:10.4028/www.scientific.net/amm.186.75
Mohammadi, M., and Taleghani, A. S. (2014). Active flow control by dielectric barrier discharge to increase stall angle of a NACA0012 airfoil. Arabian J. Sci. Eng. 39, 2363–2370. doi:10.1007/s13369-013-0772-1
Ouro, P., and Stoesser, T. (2019). Impact of environmental turbulence on the performance and loadings of a tidal stream turbine. Flow. Turbul. Combust. 102, 613–639. doi:10.1007/s10494-018-9975-6
Phommachanh, D., Kurokawa, J., Choi, Y.-D., and Nakajima, N. (2006). Development of a positive displacement micro-hydro turbine. JSME Int. J. Ser. B 49 (No. 2), 482–489. doi:10.1299/jsmeb.49.482
Salmasi, A., Shadaram, A., and Taleghani, A. S. (2013). Effect of plasma actuator placement on the airfoil efficiency at poststall angles of attack. IEEE Trans. Plasma Sci. 41 (10), 3079–3085. doi:10.1109/tps.2013.2280612
Saria, M. M., Badruzzamana, M., Cherchia, C., Swindleb, M., Ajamic, N., and Jacangeloa, J. G. (2018). Recent innovations and trends in in-conduit hydropower technologies and their applications in water distribution systems. J. Environ. Manag. 228, 416–428. doi:10.1016/j.jenvman.2018.08.078
Shams Taleghani, A., Ghajar, A., and Masdari, M. (2020). Experimental study of ground effect on horizontal tail effectiveness of a conceptual advanced jet trainer. J. Aerosp. Eng. 33 (4), 05020001. doi:10.1061/(asce)as.1943-5525.0001140
Sibilski, K., Nowakowski, M., Rykaczewski, D., Paweł, S., Żyluk, A., Sibilska-Mroziewicz, A., et al. (2020). Identification of fixed-wing micro aerial vehicle aerodynamic derivatives from dynamic water tunnel tests. Aerospace 7 (8), 116. doi:10.3390/aerospace7080116
Sonawat, A., Kim, S. J., Yang, H. M., Choi, Y. S., Kim, K. M., Lee, Y. K., et al. (2020). Positive displacement turbine - a novel solution to the pressure differential control valve failure problem and energy utilization. Energy 190, 116400. doi:10.1016/j.energy.2019.116400
Taleghani, A. S., Shadaram, A., and Mirzaei, M. (2012). Effects of duty cycles of the plasma actuators on improvement of pressure distribution above a NLF0414 airfoil. IEEE Trans. Plasma Sci. 40 (5), 1434–1440. doi:10.1109/tps.2012.2187683
Yao, L., Ye, Z., Dai, J. S., and Cai, H. (2005). Geometric analysis and tooth profiling of a three-lobe helical rotor of the Roots blower. J. Mater. Process. Technol. 170, 259–267. doi:10.1016/j.jmatprotec.2005.05.020
Zhang, W. (2022). Effect of streamline curvature on three-dimensionality of transitional near-wall flow in a linear hydrofoil cascade: a dns investigation. Flow. Turbul. Combust. 109, 603–625. doi:10.1007/s10494-022-00359-1
Zhoua, D. B., and Denga, Z. (2017). Ultra-low-head hydroelectric technology: a review. Renew. Sustain. Energy Rev. 78, 23–30. doi:10.1016/j.rser.2017.04.086
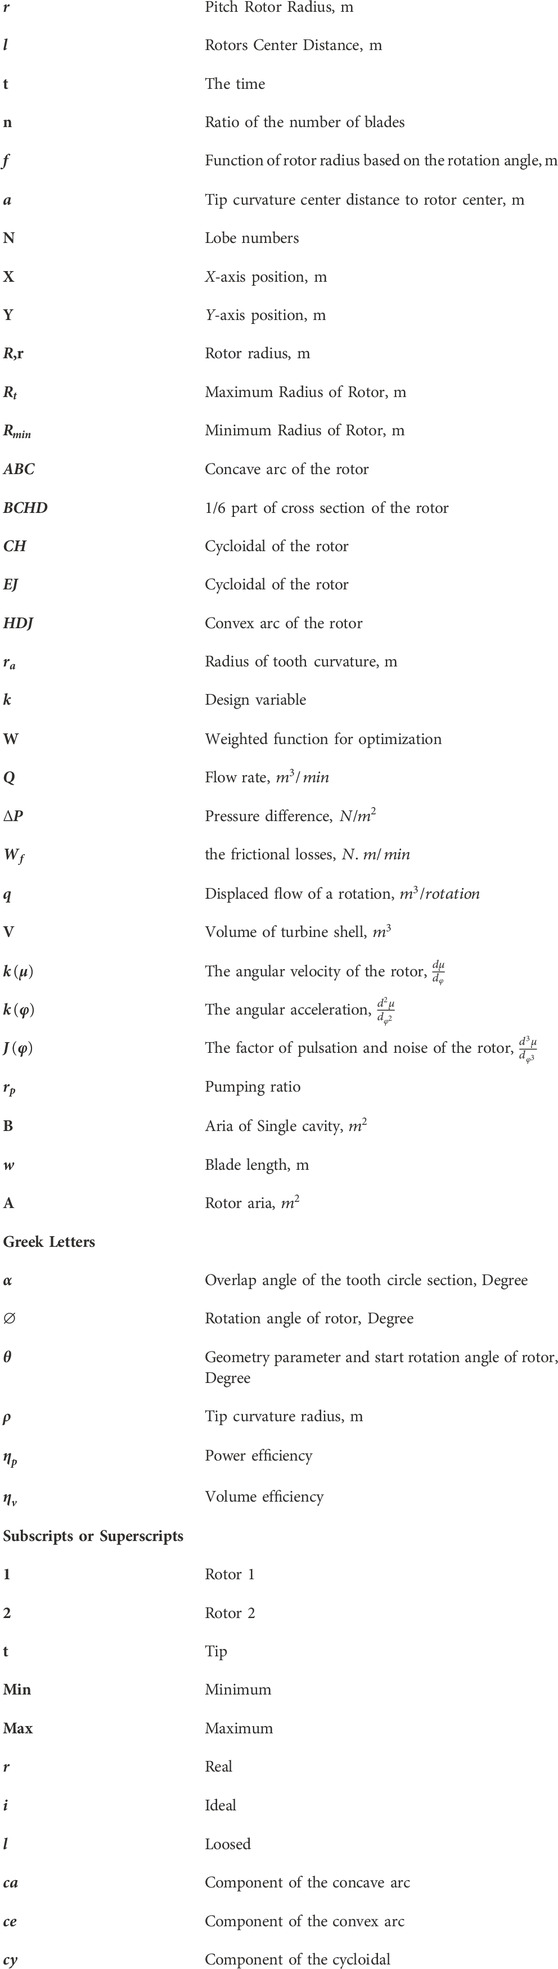
Nomenclature
Keywords: incompressible flow, positive displacement turbine, lobe pump as turbine, geometric analysis, lobe rotor analysis
Citation: Baratian I, Ghobadian B and Banakar A (2023) Parametric comparison of different lobe rotor geometry for positive displacement turbine in water distribution network. Front. Mech. Eng 9:1300967. doi: 10.3389/fmech.2023.1300967
Received: 23 September 2023; Accepted: 13 November 2023;
Published: 29 November 2023.
Edited by:
Arash Shams Taleghani, Ministry of Science, Research and Technology, IranReviewed by:
Ebrahim Afshari, University of Isfahan, IranSoheila Abdolahipour, Aerospace Research Institute, Iran
Copyright © 2023 Baratian, Ghobadian and Banakar. This is an open-access article distributed under the terms of the Creative Commons Attribution License (CC BY). The use, distribution or reproduction in other forums is permitted, provided the original author(s) and the copyright owner(s) are credited and that the original publication in this journal is cited, in accordance with accepted academic practice. No use, distribution or reproduction is permitted which does not comply with these terms.
*Correspondence: Barat Ghobadian, Z2hvYmFkaWJAbW9kYXJlcy5hYy5pcg==