 Yuanshao Wang
 Bao Zhang
 Xiaoping Su1*
- 1School of Mechanical and Power Engineering, Nanjing Tech University, Nanjing, China
- 2Nanjing Tech University Pujiang Institute, Nanjing, China
- 3Naveco Automobile Co., Ltd., Nanjing, China
Negative stiffness (NS) structures have obvious advantages in attenuating low-frequency vibration. Although most existing NS structures exhibit good damping effects, their stability is poor, limiting their application in complex mechanical systems. To improve their damping and stability, a negative stiffness structure composed of rubber spring and elastic beam (NSS-RB) is proposed. Its elastic properties are studied via numerical modeling. Numerical and experimental results show NSS-RB has high static and low dynamic stiffness, achieving good damping and stability. Applied to a power battery package damping system, NSS-RB outperforms the rubber spring (RS) system in vibration reduction: the low-frequency vibration attenuation rate exceeds 90%, with good ride comfort and no instability.
1 Introduction
NS structures are widely used in energy absorption, vibration reduction, protection and other fields (Wang et al., 2019; Zhong et al., 2019; Zhou et al., 2019). At present, NS structures have become a new way to improve the vibration reduction performance of mechanical systems (Chen et al., 2022; Dara et al., 2022; Jin et al., 2019; Alomar and Concli, 2021). Researchers have done a lot of research on NS structures. For example, (Yu et al., 2022) proposed a quasi-zero stiffness shock absorber composed of torsion bar spring and NS structure, and studied its static nonlinear stiffness characteristics by numerical method and finite element method. However, the dynamic stiffness characteristics of the shock absorber are not analyzed in this paper, and whether this structure can be applied to the impact load condition is not introduced. Chan et al. (2019) designed a three-dimensional NS structure and studied its energy absorption and resilience, and found that reasonable design of structural geometric parameters could effectively improve the level of energy absorption. However, the authors did not introduce the correlation of three-directional stiffness. Gholikord et al. (2022) comprehensively uses design, simulation and experimental techniques to analyze the mechanical properties of NS structures and improve the damping performance under cyclic loading. In the research process, M.G used quasi-static cyclic loads without considering alternating loads and impact loads. Whether the analysis results can reflect the dynamic characteristics of the NS structure needs to be further studied. In order to improve the mechanical performance of NS structure, many NS structures are developed, such as multi-stage quasi-zero stiffness mechanism, quasi-zero stiffness isolator, negative stiffness sandwich structure and so on (Guo et al., 2024; Peiman et al., 2022; Meng et al., 2021). More and more negative stiffness structures are used in engineering because of their excellent vibration absorption characteristics (Fanc et al., 2023; Hong et al., 2023; Wang et al., 2018). In recent years, some scholars have conducted research on negative stiffness damping and its applications in various fields (Shi et al., 2025; Sudheendra and Satish, 2025; Gao et al., 2025; Sonkusare and Bera, 2025).
The traditional NS structures are mainly monostable and multistable structures. The two types of NS structures can achieve good damping, but under alternating load and impact load, the existing NS structures have some problems such as poor resilience, dynamic instability, and stiffness jump. These problems limit the application of NS structures in engineering. In order to overcome the disadvantages of existing negative stiffness structures, a negative stiffness structure composed of rubber spring and elastic beam (NSS-RB) is presented in the paper. The structure has high static stiffness and low dynamic stiffness, excellent damping and stability performance. And NSS-RB is applied to the vibration reduction system of electric vehicle power battery pack. The elastic properties of NSS-RB are studied by building the numerical model, and the rationality of NSS-RB is verified by the test method. The main research contents are as follows:
1. The NSS-RB is designed and the elastic characteristics of high static and low dynamic stiffness are analyzed.
2. The NSS-RB stiffness test is carried out to verify the correctness of the theoretical model.
3. The dynamic characteristics of NSS-RB are analyzed by vibration contrast test.
2 Theoretical aspects
2.1 Structure and principle
Figure 1 shows the structure and principle of NSS-RB. The structure is shown in Figure 1a, which is composed of upper plate, bottom bracket, rubber spring, elastic beam and the moving rod system. The upper end of the rubber spring is fixed on the upper plate, and the lower end is fixed on the bottom bracket. There are two cavities in the rubber spring, and the elastic beam and moving rod system are arranged in the cavity 1. The moving rod system comprises a pole and a slider connecting rod mechanism. The slider connecting rod mechanism is symmetrically arranged on both sides of the rod. Both ends of the elastic beam are installed in the grooves of the bottom bracket, and the sliders are installed on the elastic beam. The stiffness of NSS-RB is composed of the rubber spring stiffness kr(x) and the elastic beam stiffness ke(x), kr(x) and ke(x) are in parallel. NSS-RB damping is the rubber spring damping CR.
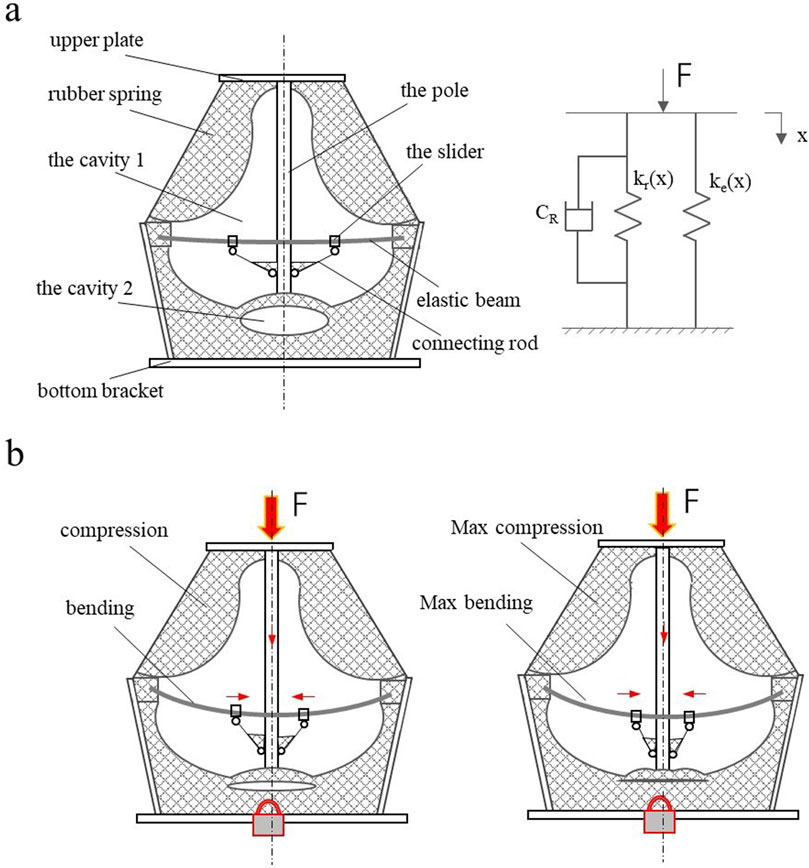
Figure 1. Structure and principle of NSS-RB. (a) The structure. (b) The principle.
Figure 1b shows the principle of NSS-RB. In the working process, the rubber spring is compressed and the elastic beam is bent. When the external force F increases, the bar moves downward, the two sliders move toward the bar, the cavity 2 is gradually compressed, and the rubber spring stiffness is nonlinear. When the external force F continues to increase, cavity 2 is completely compressed, and the stiffness of the rubber spring becomes large. The stiffness of the elastic beam varies greatly when the distance between the two sliders is different, and the stiffness is negative.
The stiffness curve of the rubber spring is shown in Figure 2. The stiffness curve is divided into three sections. The linear stiffness of sectionⅠis 65 N/mm, which is mainly used for damping, and the deformation range of Section 1 is 0–8.0 mm. Section 2 is nonlinear stiffness, rubber cavity 2 is compressed gradually, the deformation range is 8.00–11.0 mm. Section 3 is limited stiffness, rubber cavity 2 is fully compressed to prevent excessive deformation of rubber spring.
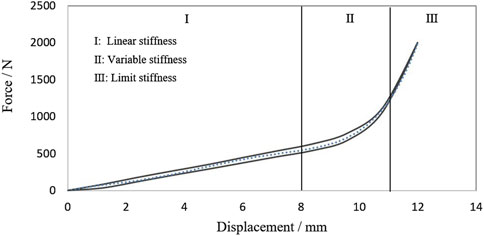
Figure 2. Stiffness curve of rubber spring.
2.2 Mechanical model
The mechanical properties of NSS-RB are determined by the rubber spring and the elastic beam. The rubber spring is a variable cross-section structure with nonlinear stiffness, which provides positive stiffness for NSS-RB. The elastic beam is a rectangular structure with equal section, which provides negative stiffness for NSS-RB. The mechanical model of elastic beam is shown in Figure 3.
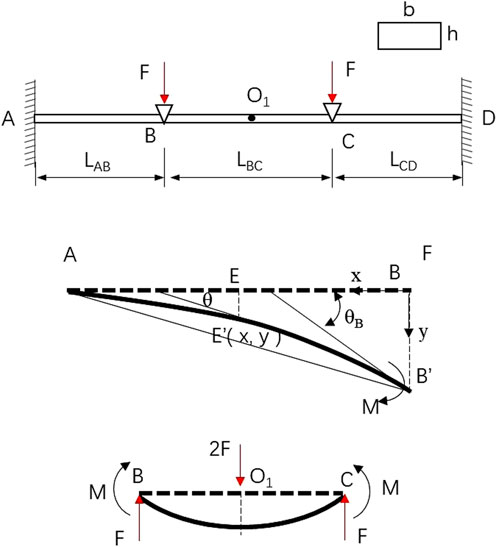
Figure 3. Mechanical model of elastic beam.
The two ends of the elastic beam A and D are constrained, and Z-direction loads are applied at points B and C. In Figure 3, LAB = LCD. Because of the symmetry of segment AB and segment CD, segment AB and segment BC are selected to analyze the elastic characteristics. In the process of loading, elastic beams produce composite deformation, that is, tensile deformation and bending deformation (Quan et al., 2020; Mykola and Konstantin, 2021; Zang et al., 2021).
The shape of the segment AB is similar to a parabola after loading, and when the deformation is small, the segment AB is approximately circular. The deflection of E′ on segment AB’ is y and the angle is θ, there is
Where IZ stands for section moment of inertia and E stands for elastic modulus. M stands for the bending moment, and x, y, and θ as shown in the figure.C1 and C2 are constants.
The boundary conditions: x = LAB, θA = 0; x = LAB, yA = 0; there is
According to Equation 2, then Equation 1 can be expressed as
According to Equation 3, the deflection and angle of the end B are
The bending moment M acts on both ends of segment BC to make it bend. The force model of the segment BC can be equivalent to that the midpoint of segment BC is acted on by force 2F and the force direction is downward. The end B and end C are subjected to the force F, and the force direction is upward. The deflection of the midpoint O1 is
According to Equations 4, 5, the deformation at the midpoint of the elastic beam is
The stiffness K of the elastic beam is
Where b is the width of the elastic beam and h is the height of the elastic beam.
Equation 7 shows that the stiffness of the elastic beam is affected not only by its structure size but also by the distance LBC. And the height h and LBC have the greatest influence on the stiffness. The stiffness kB is proportional to h3 and inversely proportional to LBC. In the process of elastic beam deformation, if LBC is gradually reduced, the negative stiffness characteristic can be realized. The maximum deformation of the elastic beam can be calculated according to Equation 6, and the calculation results provide a basis for the design of the moving distance of the elastic beam.
2.3 Numerical example
In this part, the elastic characteristics of elastic beams and NSS-RB are analyzed by numerical example. The parameters of the elastic beam are shown in Table 1. And the influence of LBC on the stiffness and maximum deformation is analyzed.
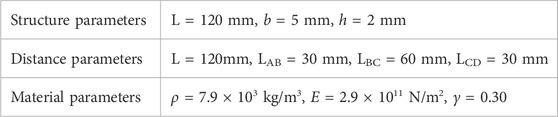
Table 1. The parameters of the elastic beam.
Figure 4 shows the relationship between the stiffness of the elastic beam and the LBC reduction. The stiffness decreases with the decrease of LBC and is nonlinear negative stiffness. The stiffness is 76.3 N/mm at the initial position LBC = 60 mm, and the stiffness is 21.2 N/mm at the position LBC = 28 mm. The stiffness is reduced by 72.2%.
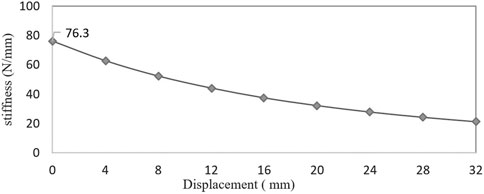
Figure 4. Stiffness curve of the elastic beam.
Figure 5 shows the relationship between the deformation of the elastic beam and the LBC reduction. The maximum load of the elastic beam is 150 N, and the maximum deformation is the deflection of the middle point of the elastic beam. The maximum deformation increases with the decrease of LBC. The maximum deformation is 3.93 mm at the initial position LBC = 60 mm, and the maximum deformation is 7.29 mm at the position LBC = 28 mm.
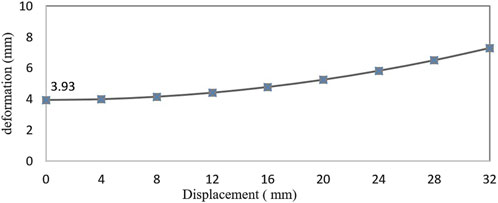
Figure 5. Deformation curve of the elastic beam.
The kinematic model of the moving bar system is shown in Figure 6. Under the action of force F, the pole drives the connecting rod mechanism to move downward, which results in the decrease of LBC. It is necessary to establish the relationship between the displacement of moving bar system and LBC to avoid motion interference. Connecting rod
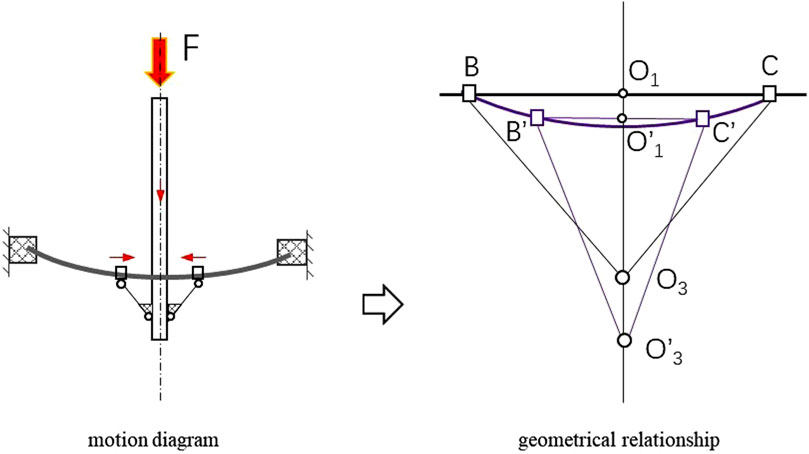
Figure 6. Kinematic model of the moving bar system.
According to Equation 8, when O3 moves to O3’, there is
According to Equations 9, 10, the relationship between the displacement of moving bar system and LBC is described according to Equation 11.
The maximum load of NSS-RB is 250 N. Figure 7 shows the relationship between the deformation of NSS-RB and the LBC reduction. The deformation increases with the decrease of LBC and shows nonlinear characteristics. The maximum deformation is 1.75 mm at the initial position LBC = 60 mm, and the maximum deformation is 11.28 mm at the position LBC = 28 mm.
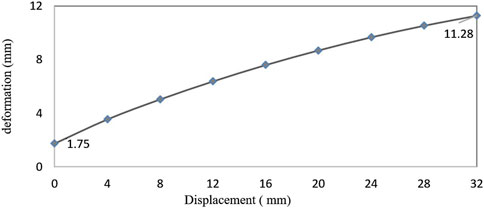
Figure 7. Deformation curve of NSS-RB.
NSS-RB stiffness kP is the sum of the rubber spring stiffness and the elastic beam stiffness. NSS-RB stiffness is shown in Figure 8. When the deformation DC < 8.0 mm, NSS-RB stiffness shows negative stiffness characteristics. The rubber spring provides positive stiffness and the elastic beam provides negative stiffness. When DC = 0.0 mm, kP = 141.3 N/mm; When DC = 8.0 mm, kP = 90.0 N/mm; the stiffness decrease is 36.3%. When DC = 8.0 mm, the rubber spring cavity 2 begins to be compressed. When DC = 10.0 mm, the rubber spring cavity 2 is fully compressed. The high static stiffness and low dynamic stiffness of NSS-RB are conducive to load and damping, a significant change in system stiffness is achieved when different displacements occur under different loads, rather than a simple linear relationship.
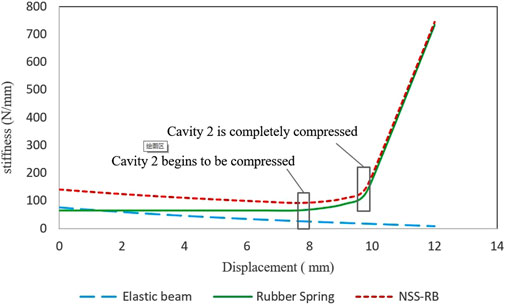
Figure 8. Stiffness curve of NSS-RB.
The design of elastic beam distance LBC should not only meet the requirements of stiffness and deformation, but also meet the requirements of structural strength. The maximum stress expression of a rectangular elastic beam
The load at point B of the elastic beam FB is obtained according to Equation 13.
The elastic beam material is 55SI2MNB and the tensile strength is 1,274 MPa. Figure 9 shows the relationship between the maximum stress of the elastic beam and the LBC reduction. The maximum stress is 1,214.9 MPa and appears at the initial position (LBC = 60 mm). The stress decreases with the decrease of LBC, and the relationship is linear. Therefore, in order to meet the strength requirements, it is necessary to control the initial distance LBC, that is, the initial value should not be higher than 60 mm.
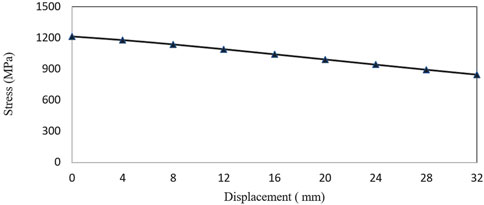
Figure 9. Stress curve of the elastic beam.
3 NSS-RB application
In recent years, with the rapid development of electric vehicle (EV), the safety of EV has been paid more and more attention. The spontaneous combustion accident of power battery pack (PBP) is increasing gradually, which has seriously endangered the life safety of drivers and passengers. Under long-term vibration condition, the power battery and high-voltage system produce large extrusion deformation, which causes leakage, short-circuit and spontaneous combustion. Therefore, the damping design of PBP is very important.
At present, rubber spring (RS) system is widely used in the design of PBP damping system. The low-frequency vibration attenuation rate of the rubber mount system is usually below 80%, which can not meet the damping performance requirements of PBP. In order to improve the damping rate of low frequency vibration, the negative stiffness structure is a better choice. In this part, NSS-RB specimens are made according to the analysis results, and the stiffness test and vibration test are carried out.
3.1 Stiffness test
The lower end of NSS-RB specimen is fixed on the support of the test bench, and the upper end is fixed on the fixture of the hydraulic column. The test process is shown in Figure 10. In static stiffness test, loading and unloading tests are carried out respectively, and the maximum displacement is 12 mm. In dynamic stiffness test, the loading frequency of the sine wave is 2.0 Hz and the amplitude is ±0.2 mm, and the initial compression of NSS-RB specimen is selected by 2 mm and 4 mm respectively. Force and displacement data are collected during the test to analyze the static and dynamic stiffness characteristics of NSS-RB specimen.
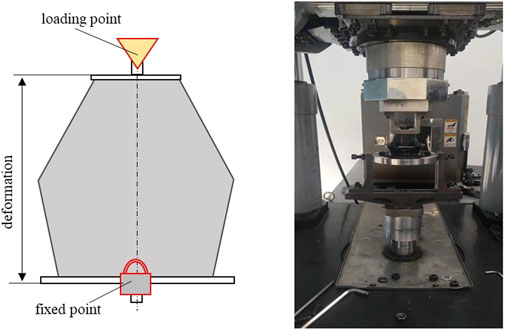
Figure 10. NSS-RB stiffness test.
Figure 11 shows the static stiffness test result of NSS-RB specimen, which is in good agreement with the theoretical result. The deformation is less than 8 mm, and the test stiffness shows negative stiffness. At the initial position, the test value is 155.8 N/mm, the theoretical value is 141.3 N/mm, and the agreement is 90.7%. In other locations, the agreements are greater than 90%. The test results at the initial position is larger than the theoretical results, the main reason is that the elastic beam buckles before elastic deformation occurs, which is not considered in the theoretical analysis.
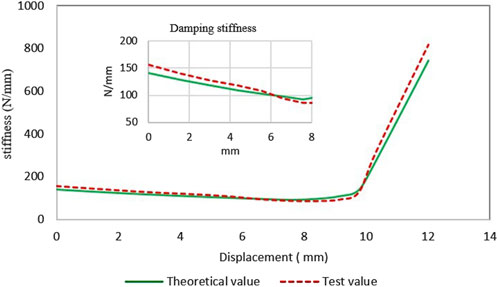
Figure 11. Static stiffness curve of NSS-RB.
Figure 12 shows the dynamic stiffness test result of NSS-RB specimen. When the initial compression is 2 mm, the dynamic stiffness is 128.14 N/mm and the loss factor is 0.148. When the initial compression is 4 mm, the dynamic stiffness is 120.5 N/mm and the loss factor is 0.261. The smaller the loss factor shows that the greater the elasticity of the specimen. The results show that the dynamic stiffness decreases with the increase of NSS-RB deformation.
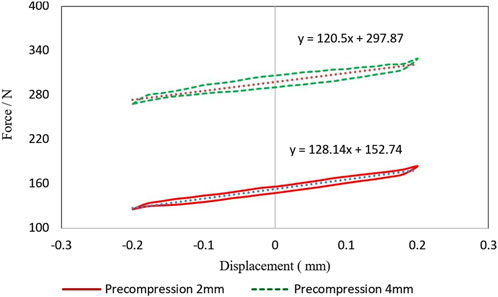
Figure 12. Dynamic stiffness curve of NSS-RB.
3.2 Vibration test
The PBP has a mass of 150 kg and is supported by six RSs. NSS-RB is used instead of RS, and the vibration comparison test was carried out. The PBP vibration test is shown in Figure 13. The PBP is fixed on the vibration test bench, and an acceleration sensor is arranged at the upper and lower ends of the elastic support respectively. The random vibration test with amplitude ±5 mm and with amplitude ±10 mm are carried out respectively. The test acquisition equipment is LMS.Test.Lab, the acquisition frequency is 30 Hz, the resolution is 0.01, and the acquisition time is 20 s.
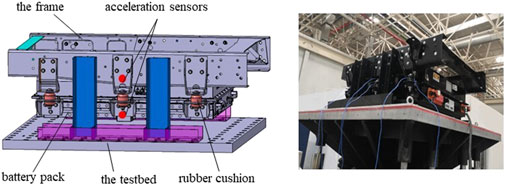
Figure 13. Vibration comparison test.
Figure 14 shows the random vibration test data with an amplitude of ±5 mm. Figure 14a shows the time-domain vibration data of PBP. The average vibration acceleration of PBP equipped with RS is 0.42 m/s2, and the average vibration acceleration of PBP equipped with NSS-RB is 0.33 m/s2. Compared to RS, NSS-RB reduced the acceleration by 21.4%.
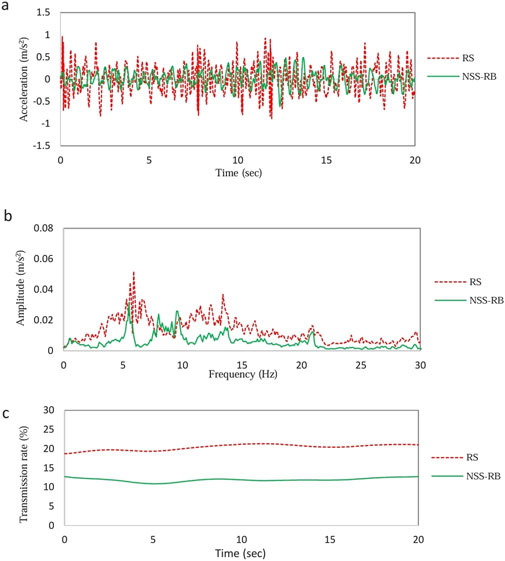
Figure 14. Random vibration test data with amplitude ±5 mm. (a) Time domain data. (b) Frequency domain data. (c) Vibration transmissibility.
Figure 14b shows the frequency-domain vibration data of PBP. The first peak frequency of the RS system is 5.9 Hz, and the amplitude is 0.052 m/s2; the first peak frequency of the NSS-RB system is 5.5 Hz, and the amplitude is 0.032 m/s2. Compared with RS system, the natural frequency of NSS-RB system moves to low frequency, and the peak value decreases obviously.
Figure 14c shows the vibration transmission curve. The average transmission rate of RS system is 20%, and that of NSS-RB system is 12%. The comparison results show that the damping effect of NSS-RB system is better than that of RS system under the small amplitude vibration conditions.
Figure 15 shows the random vibration test data with an amplitude of ±10 mm. The time domain vibration data is shown in Figure 15a, and the average acceleration of PBP with RS system is 0.83 m/s2, the average acceleration of PBP with NSS-RB system is 0.56 m/s2. The NSS-RB system reduces the acceleration by 20% compared to the RS system.
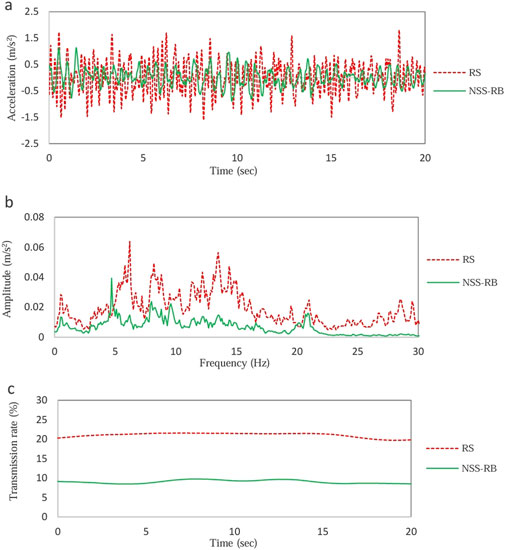
Figure 15. Random vibration test data with amplitude ±10 mm. (a) Time domain data. (b) Frequency domain data. (c) Vibration transmissibility.
The frequency-domain vibration data is shown in Figure 15b, the first peak frequency of the RS system is 6.2 Hz, and the amplitude is 0.064 m/s2; the first peak frequency of the NSS-RB system is 4.7 Hz, and the amplitude is 0.039 m/s2. Figure 15c shows the vibration transmission curve, the average transmission rate of RS system is 21.5%, and that of NSS-RB system is 9.5%.
The results also show that with the increase of the amplitude of random vibration, the natural frequency of RS system moves to high frequency and the damping performance becomes worse, the natural frequency of NSS-RB system moves to low frequency and the damping performance becomes better. Therefore, compared with RS, NSS-RB has obvious advantage in damping.
4 Conclusion
In this paper, a negative stiffness structure composed of rubber spring and elastic beam (NSS-RB) is presented. The rubber spring provides positive stiffness and the elastic beam provides negative stiffness. Numerical and experimental results show that NSS-RB has high static stiffness and low dynamic stiffness, and the stiffness decreases with the increase of its deformation. The characteristic is very suitable for loading and damping.
The application of NSS-RB in the damping system of PBP is introduced. The NSS-RB system reduces the vibration of the battery pack, which has a positive impact on the safety of electric vehicle vehicles. Under amplitude vibration conditions, the damping effect of NSS-RB system is better than that of RS system. with the increase of the amplitude of random vibration, the natural frequency of NSS-RB system moves to low frequency and the damping performance becomes better.
Data availability statement
The original contributions presented in the study are included in the article/supplementary material, further inquiries can be directed to the corresponding authors.
Author contributions
YW: Data curation, Writing – original draft. BZ: Methodology, Writing – review and editing. XS: Conceptualization, Validation, Writing – review and editing.
Funding
The authors declare that no financial support was received for the research and/or publication of this article.
Acknowledgements
The authors would like to acknowledge the support of Naveco Automobile Co., Ltd for providing the materials and apparatus.
Conflict of interest
Author BZ was employed by Naveco Automobile Co., Ltd.
The remaining authors declare that the research was conducted in the absence of any commercial or financial relationships that could be construed as a potential conflict of interest.
Generative AI statement
The authors declare that no Generative AI was used in the creation of this manuscript.
Any alternative text (alt text) provided alongside figures in this article has been generated by Frontiers with the support of artificial intelligence and reasonable efforts have been made to ensure accuracy, including review by the authors wherever possible. If you identify any issues, please contact us.
Publisher’s note
All claims expressed in this article are solely those of the authors and do not necessarily represent those of their affiliated organizations, or those of the publisher, the editors and the reviewers. Any product that may be evaluated in this article, or claim that may be made by its manufacturer, is not guaranteed or endorsed by the publisher.
References
Alomar, Z., and Concli, F. (2021). Compressive behavior assessment of a newly developed circular cell-based lattice structure. Mater. and Des. 205, 109716. doi:10.1016/j.matdes.2021.109716
Chan, S.Ha, Lakes, R. S., and Plesha, M. E. (2019). Cubic negative stiffness lattice structure for energy absorption: numerical and experimental studies. Int. J. Solids Struct. 127–135. doi:10.1016/j.ijsolstr.2019.06.024
Chen, S., Tan, X., Hu, J., Wang, B., Wang, L., Zou, Y., et al. (2022). Continuous carbon fiber reinforced composite negative stiffness mechanical metamaterial for recoverable energy absorption. Compos. Struct. 288 (15 May 2022), 115411. doi:10.1016/j.compstruct.2022.115411
Dara, A., Raju Bahubalendruni, M. V. A., Johnney Mertens, A., and Balamurali, G. (2022). Numerical and experimental investigations of novel nature inspired open lattice cellular structures for enhanced stiffness and specific energy absorption. Mater. Today Commun. 31, 103286. doi:10.1016/j.mtcomm.2022.103286
Fancher, R., Frankel, I., Chin, K. C. H., Abi Ghanem, M., MacNider, B., Shannahan, L., et al. (2023). Dependence of the kinetic energy absorption capacity of bistable mechanical metamaterials on impactor mass and velocity. Extreme Mech. Lett. 63, 102044. doi:10.1016/j.eml.2023.102044
Gao, T., Zhao, H., and Zhang, Y. (2025). Dynamic characteristics and vibration suppression performance of an inerter-based nonlinear energy sink with negative stiffness. J. Vib. Eng. and Technol., 13(7):465–465. doi:10.1007/s42417-025-02038-7
Gholikord, M., Etemadi, E., Imani, M., Hosseinabadi, M., and Hu, H. (2022). Design and analysis of novel negative stiffness structures with significant energy absorption. Thin-Walled Struct. 181, 110137. doi:10.1016/j.tws.2022.110137
Guo, S., Gao, R., and Tian, etc, X. (2024). A quasi-zero-stiffness elastic metamaterial for energy absorption and shock attenuation. Eng. Struct. 280 (1 April 2023), 115687. doi:10.1016/j.engstruct.2023.115687
Hong, N., Zhao, Z., Du, Y., and Chen, Q. (2023). Energy spectra and performance assessment of isolated structures with a negative stiffness amplification system. Soil Dyn. Earthq. Eng. 169, 107857. doi:10.1016/j.soildyn.2023.107857
Jin, N., Wang, F., Wang, Y., Zhang, B., Cheng, H., and Zhang, H. (2019). Failure and energy absorption characteristics of four lattice structures under dynamic loading. Mater. and Des. 169 (5 May 2019), 107655. doi:10.1016/j.matdes.2019.107655
Meng, H., Huang, X., Chen, Y., Theodossiades, S., and Chronopoulos, D. (2021). Structural vibration absorption in multilayered sandwich structures using negative stiffness nonlinear oscillators. Appl. Acoust. 182, 108240. doi:10.1016/j.apacoust.2021.108240
Mykola, N., and Konstantin, R. (2021). Elastic beam resting on vlasov Elastic Foundation and subjected to an external concentrated load. Acta Sci. Pol. Archit. 20, 29–35. doi:10.22630/aspa.2021.20.4.32
Peiman, H., Attari, N. K. A., and Rofooei, F. R. (2022). Evaluation of a robust dynamic vibration absorber based on negative stiffness and internal resonance against seismic excitation. Int. J. Non-Linear Mech. 146, 104130. doi:10.1016/j.ijnonlinmec.2022.104130
Quan, Z., Jianguo, Z., Yan, P., Pu, H., and Yang, Y. (2020). A novel amplification ratio model of a decoupled XY precision positioning stage combined with elastic beam theory and Castigliano's second theorem considering the exact loading force. Mech. Syst. Signal Process. 136, 106473. doi:10.1016/j.ymssp.2019.106473
Shi, L., Peng, L., and Zhang, R. (2025). Optimal design of base-isolated structures and device development based on negative stiffness inertial electromagnetic damping. Eng. Struct., 342:120915–120915. doi:10.1016/j.engstruct.2025.120915
Sonkusare, D. V., and Bera, K. K. (2025). Edgewise vibration control of wind turbine blades using negative stiffness TMDs. Int. J. Mech. Sci., 303:110636–110636. doi:10.1016/j.ijmecsci.2025.110636
Sudheendra, H., and Satish, N. (2025). Negative stiffness brace device for structural systems: analytical and experimental Study. J. Struct. Eng., 151, 04025153. doi:10.1061/jsendh.steng-14076
Wang, M., Sun, F., and Jin, H. (2018). Performance evaluation of existing isolated buildings with supplemental passive pseudo-negative stiffness devices. Eng. Struct. 177, 30–46. doi:10.1016/j.engstruct.2018.09.049
Wang, X., He, T., Shen, etc, Y., Shan, Y., and Liu, X. (2019). Parameters optimization and performance evaluation for the novel inerter-based dynamic vibration absorbers with negative stiffness. J. Sound Vib. 463, 114941. doi:10.1016/j.jsv.2019.114941
Yu, C., Fu, Q., and Zhang, J. (2022). etc. The vibration isolation characteristics of torsion bar spring with negative stiffness structure. Mech. Syst. Signal Process. 180 (15 November 2022), 109378. doi:10.1016/j.ymssp.2022.109378
Zang, J., Cao, R. Q., and Zhang, Ye W. (2021). Steady-state response of a viscoelastic beam with asymmetric elastic supports coupled to a lever-type nonlinear energy sink. Nonlinear Dyn. 105, 1327–1341. doi:10.1007/s11071-021-06625-7
Zhong, R., Zong, Z., Frank Pai, P., and Ruan, X. (2019). Multi-stopband negative stiffness composite column design for vibration absorption. Thin-Walled Struct. 144, 106330. doi:10.1016/j.tws.2019.106330
Keywords: negative stiffness, elastic beam, damping system, dynamics, vibration
Citation: Wang Y, Zhang B and Su X (2025) Dynamic characteristics of negative stiffness structure with high static and low dynamic stiffness. Front. Mech. Eng. 11:1728890. doi: 10.3389/fmech.2025.1728890
Received: 20 October 2025; Accepted: 10 November 2025;
Published: 20 November 2025.
Edited by:
Fen Lin, Nanjing University of Aeronautics and Astronautics, ChinaCopyright © 2025 Wang, Zhang and Su. This is an open-access article distributed under the terms of the Creative Commons Attribution License (CC BY). The use, distribution or reproduction in other forums is permitted, provided the original author(s) and the copyright owner(s) are credited and that the original publication in this journal is cited, in accordance with accepted academic practice. No use, distribution or reproduction is permitted which does not comply with these terms.
*Correspondence: Bao Zhang, emhhbmdiYW8xMzUwQDEyNi5jb20=; Xiaoping Su, c3V4aWFvcGluZ0BuanRlY2guZWR1LmNu