- Center for Advanced Research in Environmental Genomics, University of Ottawa, Ottawa, ON, Canada
Anatoxin-a (ANTX) is a neurotoxin produced by several freshwater cyanobacteria and implicated in lethal poisonings of domesticated animals and wildlife. The factors leading to its production in nature and in culture are not well understood. Resource availability may influence its cellular production as suggested by the carbon-nutrient hypothesis, which links the amount of secondary metabolites produced by plants or microbes to the relative abundance of nutrients. We tested the effects of nitrogen supply (as 1, 5, and 100% N of standard cyanobacterial medium corresponding to 15, 75, and 1500 mg L−1 of NaNO3 respectively) on ANTX production and release in a toxic strain of the planktonic cyanobacterium Aphanizomenon issatschenkoi (Nostocales). We hypothesized that nitrogen deficiency might constrain the production of ANTX. However, the total concentration and more significantly the cellular content of anatoxin-a peaked (max. 146 μg/L and 1683 μg g−1 dry weight) at intermediate levels of nitrogen supply when N-deficiency was evident based on phycocyanin to chlorophyll a and carbon to nitrogen ratios. The results suggest that the cellular production of anatoxin-a may be stimulated by moderate nitrogen stress. Maximal cellular contents of other cyanotoxins have recently been reported under severe stress conditions in another Nostocales species.
Introduction
Many cyanobacteria are capable of producing compounds that are toxic to other organisms. The cyanotoxins have been classified into four main groups according to their mode of action. In addition to the hepatoxins, cytotoxins, and gastrointestinal toxins, there are several types of neurotoxins (Codd et al., 2005). A potent neurotoxin synthesized by freshwater cyanobacteria is anatoxin-a (ANTX), likely one of the smallest toxic alkaloids described to date (LD50 of 0.2 mg/kg IP in mice, Carmichael et al., 1979). Prior to its chemical identification, ANTX was labeled the Very Fast Death Factor due to its ability to induce death within 4 min following intraperitonial injection in mice. ANTX has now been detected in lakes and rivers throughout the world (e.g., Codd et al., 2005; Cadel-Six et al., 2007; Wood et al., 2007; Aráoz et al., 2008), and, in some cases, at concentrations leading to lethal poisonings of livestock, domestic animals, and wildlife.
The factors regulating ANTX production, whether in the field or in the laboratory, are not well understood (Osswald et al., 2007). The toxin has been studied less that the more commonly encountered microcystins associated with freshwater cyanobacterial blooms (a Web of Science search since 1995 yields about a quarter of the number of papers on ANTX relative to the number of papers on microcystins). ANTX production is strain specific with cellular contents ranging up to 13,000 μg/g dry weight in Anabaena (reviewed by Osswald et al., 2007). The optimal temperature for production appears to lie between 19.8 and 22.0°C and is maximal during the exponential phase of growth in batch cultures.
Several hypotheses have been proposed to explain why toxins more generally are produced by cyanobacteria. They may be produced as a defense mechanism against grazers or other organisms in order to gain ecological advantage. Or they may be involved in cell signaling processes (Wiegand and Pflugmacher, 2005). Cyanotoxins including ANTX have been labeled as secondary metabolites as they do not appear to be involved in primary metabolism (Carmichael, 1992). In this regard, an increase in demand for resources at the cellular level would in theory lead to a decrease in ANTX production.
The availability of nutrients may play a role in the production of secondary metabolites, including nitrogen containing alkaloids such as ANTX, as suggested by the carbon-nutrient balance hypothesis (Hamilton et al., 2001). This hypothesis links the amount of secondary metabolites produced by plants to the relative abundance of nutrients. Recently, the production and composition of microcystins (MC) was investigated in relation to nitrogen to carbon supply ratios (N:C) in the freshwater cyanobacterium Microcystis aeruginosa (van de Waal et al., 2009). Consistent with the carbon-nutrient balance hypothesis, a high N:C ratio in the external media and within the cells led to higher concentrations of microcystins (and of the nitrogen-rich MC variant MC-RR) in comparison to lower N:C ratios. Despite the fact that less than 1% of the total cellular nitrogen was invested in microcystins, the availability of inorganic nitrogen appeared to influence secondary metabolite concentrations and composition. Nitrogen availability may also play an analogous role in the production of other nitrogen containing secondary metabolites such as ANTX.
In the following study, the relationship between nitrogen availability and ANTX production was investigated in Aphanizomenon issatschenkoi (Ussaczew) Proschkina-Lavrenko using an ANTX producing strain isolated from a hypereutrophic New Zealand lake (CAWBG02, Wood et al., 2007). A. issatschenkoi is a colonial planktonic species, which can produce heterocysts (Ballot et al., 2010), the primary site for atmospheric nitrogen (N2) fixation in the Nostocales in the absence of available inorganic nitrogen. The process of nitrogen fixation being energy demanding, this study hypothesized that nitrogen fixation might lead to further reductions in the production of secondary metabolites containing nitrogen when the supply of inorganic N was low. Both intracellular and extracellular production was estimated: given its small molecular weight ANTX can be found in significant but variable amounts in solution (Rapala et al., 1993).
Materials and Methods
Culture Conditions and Sampling
A culture of A. issatschenkoi was obtained from the Cawthron Institute, New Zealand (strain CAWBG02). Batch cultures were grown at a light intensity of 85 μE m−2 s−1 on a 12:12 light: dark cycle at 20 ± 1°C in a Conviron growth chamber (E-15) in 500 mL Erlenmeyer flasks. Three different growth media were used with sodium nitrate (NaNO3) at 100, 5, and 1% of full strength BG11 (Andersen, 2005) corresponding to 1500, 75, and 15 mg L−1 of NaNO3 respectively. Total culture volumes were 250 mL and inocula for all the experimental cultures came from the same parent culture in exponential phase acclimated to the same temperature and light regime. Under these conditions, A. issatschenkoi grew as single trichomes and minimal clumping occurred which facilitated subsampling. Two milliliters from each flask were sub-sampled every 3–4 days to measure optical density using a Pye-Unicam SP-100 UV-spectrophotometer at 750 nm. The optical density at 750 nm provides a measure of turbidity of the culture and is a function of both cell density and cell size. Growth rates were obtained by plotting the natural logarithm of absorbance readings at 750 nm during the exponential growth and using linear analysis (Guillard, 1973). Optical densities at 627 and 438 nm were also measured as an estimate of phycocyanin to chlorophyll a changes (van de Waal et al., 2009). Phycocyanin is a protein and accessory pigment found in all cyanobacteria and involved in light harvesting (Whitton and Potts, 2000).
For toxin extraction from cells, 10 mL from each flask was filtered on days 10, 20, 30, and 40 of growth using pre-ashed and pre-weighed Whatman GF/C filters. The first three time points corresponded to early, mid, and late exponential phases whereas the last corresponded to stationary phase at least in the 1 and 5% N cultures. A subsequent 10 mL was filtered from each flask using the same filter type for the analysis of particulate organic carbon (C) and nitrogen (N). Filters were oven dried overnight at 60°C, re-weighed to obtain the dry weight (mg mL−1) and stored frozen at −20°C. During filtrations, one 20 mL of filtrate was collected from each culture in solvent rinsed (acetone and hexane) scintillation vials wrapped in foil. Filtrates were spiked with 50 μL formic acid to stabilize ANTX and frozen immediately at −20°C. For chlorophyll a analysis, 5 mL were sub-sampled and filtered using 934-AH glass microfiber filters with approximately the same pore size as GF/C. Filters were inserted in clean 15 mL plastic test tubes and stored at −20°C for subsequent analysis. The experiment was terminated when the 1 and 5% N cultures had clearly reached stationary phase.
Extraction and Analysis of Anatoxin-A, Particulate Organic Carbon and Nitrogen, and Chlorophyll a
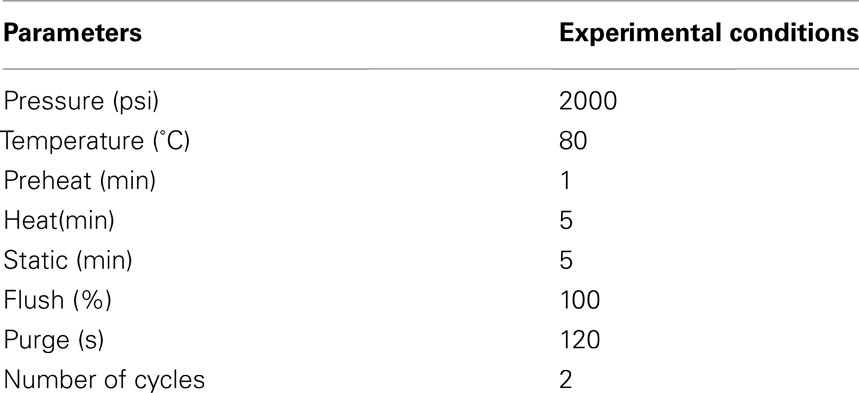
The extraction of ANTX from cyanobacterial cells was performed using an ASE 200 device Dionex Corporation (Bannockburn, IL, USA). Frozen GF-C filters with cyanobacterial biomass were thawed and inserted in stainless-steel ASE cells (11 mL) packed with pre-washed Hydromatrix. The ASE parameters were optimized for anatoxin-a specifically (Table 1) based on a previous ASE protocol optimized for microcystins (Aranda-Rodriguez et al., 2005). Extracts were collected in solvent (acetone and hexane) rinsed amber vials and then spiked with 50 μL formic acid (pH ∼3). Extracts were then evaporated down to dryness at 59°C under a gentle nitrogen flow using a Zymark Turbovap II and then resuspended in 1 mL of 50% methanol in water. Filtrates were freeze-dried and then resuspended in 1 mL of 50% methanol in water. All extracts, both particulate and liquid phase, were filtered with pre-conditioned 0.2 μm Acrodisc filters and stored at −20°C until analysis.
Toxin analyses were performed on a Sciex QTRAP 3200 LC-MS/MS (ABSciex, Toronto, Canada). The system consisted of a 1200 series Agilent liquid chromatograph with a high performance autosampler (model G1376B), a binary pump (model G1312A), a column thermostat (model G1316A), and a triple quadrupole linear ion trap mass spectrometer equipped with a turbospray ion source, specifically electrospray ionization (ESI) in positive mode with a voltage of 4500 eV and setpoint temperature of 350°C. The acquisition of data was performed with Analyst software (version 1.4.1). Chromatographic separations were achieved with a Zobrax SB-C18 Rapid Resolution column (50 × 2.1 mm I.D., 1.8 μm particle size column) and a guard column (12.5 × 2.1 mm I.D, 5 μm; Agilent Technologies, Canada) at 40°C. The optimal mobile phase conditions were: water and MeOH with 0.1% formic acid and ammonium formate 20 mM with a constant flow rate of 0.3 mL/min. Injection volume for samples was set to 1 μL. The needle was washed with 50% methanol, 50% acetonitrile, and 0.01% formic acid at the flush port (3×) after each injection to minimize carry over. The method successfully separated anatoxin-a from phenylalanine which often interferes with anatoxin analyses as the compounds are isobaric (Furey et al., 2005). ANTX and PHE standards were individually infused in the MS with a 4.6 mm I.D Harvard syringe at a flow rate of 10 μL/min. Multiple reaction monitoring (MRM) scans were performed for each standard by selecting the protonated molecular ion [M + H]+1 (parent ion) with the first mass filter quadrupole (Q1). The product ions, yielded by collision-induced dissociation, were scanned by the third quadrupole (Q3). Unambiguous Q1/Q3 pair transitions were obtained by manually optimizing the declustering potential to get characteristic product ions of ANTX and PHE (Table 2). Standard curves were produced with anatoxin-a fumarate obtained from Tocris Bioscience (USA) and analyzed in line with unknowns. All samples were analyzed on the same run to minimize any day to day instrument variability. The instrument limit of detection was 1 pg of ANTX and the limit of quantification 3.5 pg on column.
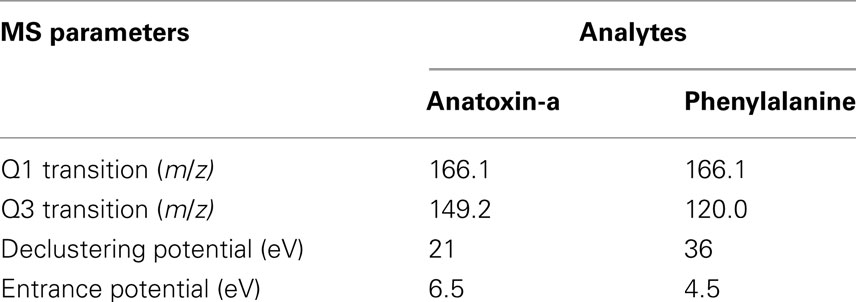
Table 2. MRM transitions of each analyte obtained after infusion into turboV electrospray source of 3200 QTRAP and their respective voltages.
Particulate organic C and N were measured using a Costech elemental analyzer (ECS 4010; Costech, Valencia, CA, USA) following Frost et al. (2009). Chlorophyll a was extracted by incubating the frozen 934-AH filters with culture material in 13 mL of 95% ethanol at 4°C for about 24 h (Jespersen and Christoffersen, 1987). Following centrifugation of the extracts, chlorophyll a concentrations were then estimated based on optical densities at 750, 665, and 649 nm (Bergmann and Peters, 1980).
Statistical Analyses
In order to compare the effects of N treatments, one-way analyses of variance (ANOVA) were performed on the following end-points: total and cellular toxin concentrations, growth rates, chlorophyll a, phycocyanin to chlorophyll a ratios, and particulate organic carbon to nitrogen (C:N) ratios at time intervals corresponding to the early to late exponential phase as well as the early stationary phase. A one-way ANOVA was chosen over a repeated measures ANOVA in order to focus analyses on specific and predictable growth phases. In the case of significant treatment effects (p < 0.05), Tukey’s pairwise comparison test was subsequently used to determine differences between treatments. All statistical analyses were carried out using SigmaStat (version 3.1) software.
Results
Growth and Nitrogen Stress
All cultures entered the exponential phase of growth after about 18 days and reached the stationary phase after approximately 34 days for the 1% N treatment and 40 days for both 5 and 100% N treatments (Figure 1). The growth curves based on optical density were clearly different between the three nitrogen treatments (Figure 1). By day 30, the mean optical density of the 100% N treatment was significantly higher (p < 0.001) than that at the lower N concentrations. On days 34 and 40, the treatments were all significantly different from one another, with the lowest optical densities corresponding to the 1% N treatment. The average biomass as dry weight (Table 3) of both the 1 and 5% N treatments was also significantly lower than that of 100% N treatment on all four sampling dates (10, 20, 30, and 40). Population growth rates ranged from 0.03 to 0.07 day−1 and were significantly higher in the 100% N cultures in comparison to the 1% N (Table 3).
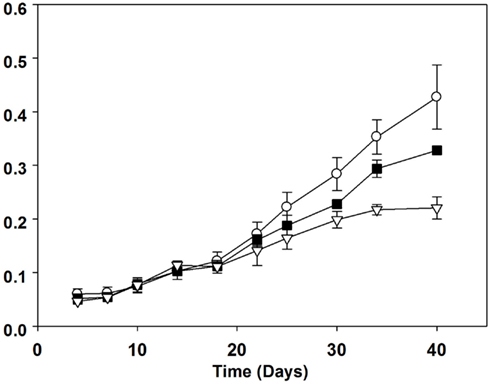
Figure 1. Batch culture growth of Aphanizomenon issatschenkoi in 100% (open circles), 5% (filled squares), and 1% (open triangles) nitrogen-rich media. The error bars are standard errors of mean (n = 3).

Table 3. Average growth rate based on optical density changes (± standard error), carbon to nitrogen (C:N) molar ratios and yield as dry weight biomass (mg/mL) for Aphanizomenon issatschenko i grown in different nitrogen concentrations (shown as % of full strength BG11 media).
Chlorophyll a concentrations of the cultures showed an analogous pattern to absorbance (data not presented). By day 20 and on three subsequent sampling dates all three treatments were significantly different from one another (p < 0.001). The highest chlorophyll a concentrations were measured in the 100% N treatment, followed by the 5 and 1% N treatments: maximum values were attained on day 30 (584 ± 26, 382 ± 8, and 192 ± 16 μg L−1 respectively). In contrast to the optical density data (Figure 1), by day 40 chlorophyll a concentrations began to decline across all treatments.
With respect to the ratio of phycocyanin to chlorophyll a, the 100% N batch cultures had clearly the highest mean ratio and the 1% N the lowest (Figure 2). Significant differences between either all treatments or the 1 and 100% N treatments were observed from day 7 to day 34. On day 40, the mean ratio for the 1% N was significantly different (p < 0.001) from both higher N treatments. With respect to cellular nutrient composition, the particulate organic carbon to nitrogen ratios (Table 3) began to differ from day 20 onward. Batch cultures grown in 100% N medium were significantly different (p < 0.001) from the other two treatments with a lower mean ratio on both day 20 and 30. At day 40 however, no difference between the C:N mean ratios of batch cultures grown in 100 and 1% N was detected using Tukey’s all pair wise test. This was due to the high standard error between triplicates of the 1% N treatment. However, a Duncan all pair wise test showed a significant difference (p = 0.045) between the 100% N treatment and the other two treatments.
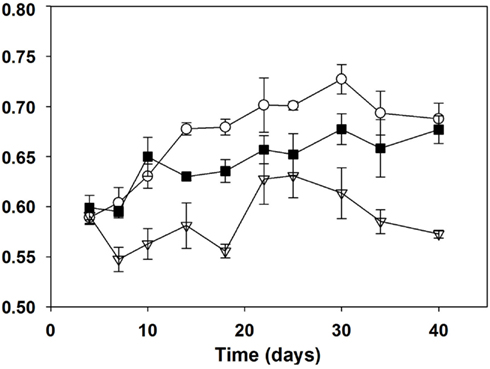
Figure 2. Phycocyanin to chl-a ratios (627 nm: 438 nm) of Aphanizomenon issatschenkoi grown in 100% (open circles), 5% (filled squares), and 1% (open triangles) nitrogen-rich media. The error bars are standard errors of mean (n = 3).
Anatoxin-a
The total ANTX concentrations ranged from 4 to 146 μg L−1 across time and treatments with the highest concentrations observed during the exponential phase (day 30) for all three nitrogen concentrations (Figure 3). On day 10, the highest total ANTX mean concentration corresponded to the 5% N treatment and the lowest to the 1% N. By day 30, the 5% N cultures had the highest total ANTX concentrations with a mean concentration of 111 ± 18 μg L−1; the 100% N cultures had the lowest concentrations ranging from 51 to 74 μg L−1. However, with the exception of day 10, the total ANTX culture concentrations were not statistically different between the three treatments on a given day, with the exception of day 10, despite highly significant differences in culture biomass.
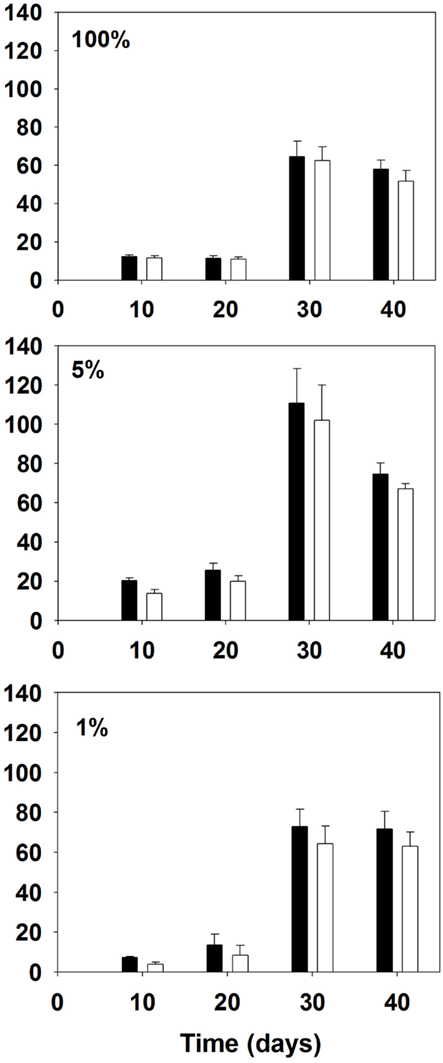
Figure 3. ANTX culture concentrations (μg/L) of total toxin (filled bars) and intracellular toxin (open bars) of Aphanizomenon issatschenkoi grown in 100% (top panel), 5% (middle panel), and 1% (bottom panel) nitrogen-rich media. The error bars are standard errors of mean (n = 3).
The ANTX cellular content ranged from 6 to 1683 μg g−1 dry weight with the highest values in each treatment corresponding to 30 days of growth or the late exponential phase (Figure 4). ANTX content was significantly different among treatments on all dates, with higher content for the 5% N treatment compared to the other two treatments on day 20 (p = 0.018) and 30 (p = 0.003). The highest ANTX cellular content was measured in the 5% N treatment on day 30 with a mean of 1408 ± 181 μg g−1. The 5 and 1% N treatment had higher ANTX cell content than the batch cultures grown in 100% N with the 5% N treatment resulting in the highest amounts except on day 40, which corresponded to the onset of the stationary phase.
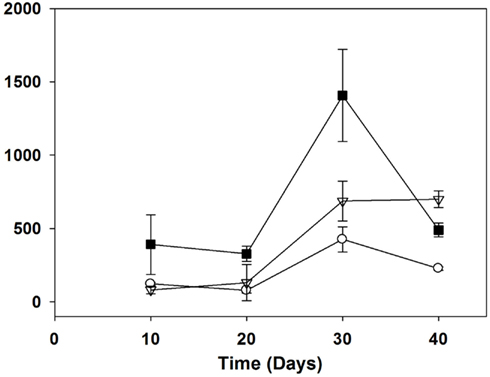
Figure 4. Anatoxin-a cellular content (μg/g dry weight) of Aphanizomenon issatschenkoi grown in 100% (open circles), 5% (filled squares), and 1% (open triangles) nitrogen-rich media. The error bars are standard errors of mean (n = 3).
The extracellular ANTX concentrations ranged from below detection (<0.1 μg L−1) to 13 μg L−1 and were considerably lower than particulate concentrations (Figure 3) while representing between 3 and 47% of the total production. Cultures grown in 100% N medium had significantly (p < 0.001) lower ANTX extracellular concentrations and lower percent extracellular release than the other two treatments on days 20 and 30. The highest mean extracellular concentrations were found in the 1% N treatments on days 30 and 40, reaching 9 ± 0.12 μg L−1. Two of the 1% cultures also had higher concentrations of ANTX in the extracellular phase compared to the intracellular phase one on day 10 and one on day 20.
Discussion
The total amount of ANTX produced by A. issatchenkoi CAWBG02 was lower in this study than that reported for this strain when first isolated. For a 23 day culture Selwood et al. (2007) reported a maximum concentration of 1105 μg L−1, whereas a maximum of 146 μg L−1was estimated here. This could stem in part from differences in growing conditions related to differences in the composition of media, temperature, and light as well as aeration since the present cultures were not bubble aerated which Selwood et al. (2007) mentioned could double the toxin production. Furthermore differences in both extraction and analytical procedures for ANTX could also lead to differences: there are at present no common standard methods for most algal toxins or certified reference materials in use. The cellular content reported is within the range of that reported for a recently isolated strain of A. issatschenkoi from northeastern Germany (Ballot et al., 2010). Collectively the species appears less toxic than the benthic cyanobacterium Phormidium favosum which produces 8000 μg g−1 per dry weight (Gugger et al., 2005) or previous reports for Anabaena strains (summarized in Osswald et al., 2007), although the problem of analytical interference from phenylalanine may have inflated these earlier estimates of ANTX which did not clearly separate these isobaric compounds.
In this study, nitrogen limited the biomass yield of A. issatschenkoi in the low N cultures as evidenced by lower dry weights and overall final yields under the 1 and 5% relative to 100% N (Table 3). The growth rate was also reduced in the 1% cultures and, to a lesser extent, in 5% cultures. Nitrogen deficiency was also reflected in cellular constituents: in particular lower chlorophyll a concentrations and overall lower ratios of phycocyanin to chlorophyll a (Figure 2). The phycobiliproteins, being nitrogen-rich accessory pigments, are typically reduced relative to chlorophyll a under nitrogen stress in cyanobacteria (Turpin, 1991).
When soluble inorganic nitrogen becomes limiting in the environment, many cyanobacteria belonging to the Nostocales, such as Aphanizomenon, are capable of fixing atmospheric nitrogen to compensate for their needs for that specific nutrient. Hence, the particulate organic nitrogen content should have been more or less constant throughout the 40 days in all three treatments if N2 fixation had occurred to compensate for nitrogen limitation. On days 20 and 30, the C:N ratios were significantly higher for cultures grown in 1 and 5% N compared to 100% N treatment. This further confirms that nitrogen was limiting and that N2 fixation did not compensate for the N-deficiency, particularly in the 1% N treatment. In fact, heterocysts were not evident in the cultures and were either non-existent or too small to differentiate from vegetative cells. This may be consistent for CAWBG02 as it did not produce heterocysts in culture with or without nitrogen supplementation in the original report (Wood et al., 2007). With respect to another non-fixing cyanobacterium, van de Waal et al. (2009) reported molar C:N ratios ranging from 6.25 to 7.14 for M. aeruginosa when neither N nor C was limiting. A. issatschenkoi in the present study had lower C:N ratios overall. Nevertheless, significantly higher ratios of C:N were reached in the cultures grown under low nitrogen concentrations (Table 3).
According to the carbon-nutrient balance hypothesis, nutrients should be allocated to the production of secondary metabolites once growth is assured (Hamilton et al., 2001). Because cyanotoxins are generally considered secondary metabolites (Carmichael, 1992), their production should increase whenever the availability of essential nutrients increases. A higher production of anatoxin-a, an alkaloid that contains a nitrogen atom, was expected under higher nitrogen availability. In this study, the highest nitrogen supply corresponded to the highest growth rate and yield (Table 3) of CAWBG02 but not necessarily to higher total ANTX concentrations (Figure 3). In fact, the highest concentrations of total ANTX were produced by cultures grown in 5% N while the lowest mean concentrations of total ANTX were found in the 100% N treatment although the differences were not highly significant. Highly significant differences were observed in ANTX cellular contents (Figure 4): the 5% N cultures produced the highest cellular content and the 100% N treatment the lowest. The 100% N cultures had the highest growth rate, the highest biomass yield, the highest levels of particulate organic nitrogen and the highest phycocyanin to chlorophyll a ratios (Table 3; Figure 2), yet they produced the lowest ANTX cellular content. Additional concentrations of nitrogen should be tested to confirm these results based on only three contrasting treatments. If ANTX is indeed a type of defense compound then, its production might be a mechanism that confers ecological advantage particularly under low nutrient conditions that are common in aquatic systems during summer stratification when cyanobacteria tend to thrive and zooplankton grazing is typically high (Sommer et al., 1986).
The mean extracellular to total toxin concentration ratios were higher in 1% N treatment than in the other two treatments, the extracellular fraction almost exceeding the particulate fraction in stationary phase (Figure 3). Stress conditions in cyanobacteria can lead to permeability changes of the cell membrane that result in leakage (Whitton and Potts, 2000). However, it should be noted that the extracellular ANTX concentrations presented in this study were likely underestimated, as is likely the case for previous studies (Rapala et al., 1993). ANTX is quite labile under light and may degrade once released into the medium (Stevens and Krieger, 1988). Short-term radio-labeling experiments would be required to estimate more accurately the extracellular release. Furthermore, although the cultures were initially bacteria free, prepared and sub-sampled under sterile conditions, it is possible that some biodegradation arose.
This study suggests that toxin production may be higher when cyanobacterial cells are under moderate nutrient stress. Recently, Kurmayer (2011) reported that another nitrogen-fixing cyanobacterium Nostoc produced higher levels of microcystin cell content under stress conditions, particularly under low phosphorous (P-PO4) and low light irradiance, even though growth rates were reduced up to 100-fold compared to controls. As a result, microcystin content per cell was negatively correlated to P-PO4 and irradiance. Interestingly nitrogen reduction did not have the same effect, but, in this case, the number of heterocysts increased suggesting some alleviation of N-deficiency. Even if Nostoc produced higher levels of microcystin per cell when grown under stress conditions, the total toxin production was still lower than when grown under optimal conditions. In contrast, in the present study, both cellular and total ANTX concentrations in A. issatschenkoi were higher in cultures grown at intermediate N concentrations (Figures 3 and 4). Similarly, Rapala et al. (1993) observed that ANTX cellular contents were higher in both A. flos-aquae and Anabaena flos-aquae when grown in nitrogen-free media as opposed to nitrogen-rich control media. In this study, mean ANTX cell contents of CAWBG02 were both significantly lower in 100 and 1% N media than in 5% N. Stress conditions may increase ANTX cellular production to a certain point where cyanobacterial cells are still capable of producing the toxin without compromising primary metabolism. Mean cellular ANTX concentrations for the 1% N were slightly higher than those of the 100% N, but the difference was not significant. Based on cellular composition, the 1% N cultures were more severely stressed and the N concentration may have been too low to sustain much toxin production.
The results presented in this study suggest that ANTX production may increase in A. issatschenkoi under moderate nitrogen limitation. According to the carbon-nutrient balance hypothesis and our current understanding of secondary metabolism, the opposite was expected. One possible ecological advantage of such a strategy could be that when nitrogen is limiting and population density declines, additional population losses through grazing would be minimized via higher cell specific toxin concentrations. In the present experiments batch cultures were used as they best represent algal bloom dynamics typical of nuisance cyanobacterial growth in nature. However, it is possible that factors that are not well controlled in batch cultures may have influenced the results. Growth rates were slightly different among the treatments and might have had an effect on ANTX concentrations. Although it has not been specifically demonstrated for anatoxin-a, in the case of microcystins the cellular growth rate is the primary factor regulating production (Orr and Jones, 1998). However, in this case the higher growth rate observed in the 100% N culture did not lead to the higher anatoxin concentration or cellular content. Further studies encompassing a wider range of nutrient concentrations and using other toxin producing cyanobacterial taxa are necessary to confirm these results and to determine if physiological stress maximizes toxin production more generally.
Conflict of Interest Statement
The authors declare that the research was conducted in the absence of any commercial or financial relationships that could be construed as a potential conflict of interest.
Acknowledgments
We thank A. Saleem (University of Ottawa), R. Aranda-Rodriguez, and Z. Jin (Health Canada, Ottawa), along with M. Quilliam (National Research Council of Canada, Halifax) for advice with LS/MS/MS instrumentation and analyses. We thank L. Kimpe for her assistance with the Accelerated Solvent Extraction (ASE) and S. Bhatti with algal culturing. This work was supported by an Ontario Ministry of Environment Best in Science to Frances R. Pick and M. Quilliam.
References
Anderson, R. A. (ed.). (2005). Algal Culturing Techniques. Burlington: Elsevier Academic Press, 578.
Aranda-Rodriguez, R., Tillmanns, A., Benoit, F. M., Pick, F. R., Harvie, J., and Solenaia, L. (2005). Pressurized liquid extraction of toxins from cyanobacterial cells. Environ. Toxicol. 20, 390–396.
Aráoz, R., Herman, M., Rippka, R., Ledreux, A., Molgo, J., Changeux, J., Tandeau de Massac, N., and Nghiêm, H. O. (2008). A non-radioactive ligand-binding assay for detection of cyanobacterial anatoxins using Torpedo electrocyte membranes. Toxicon 52, 163–174.
Ballot, A., Fastner, J., Lentz, M., and Wiedner, C. (2010). First report of anatoxin-a producing cyanobacterium Aphanizomenon issatschenkoi in northeastern Germany. Toxicon 56, 964–971.
Bergmann, M., and Peters, R. H. (1980). A simple reflectance method for the measurement of particulate pigment in lake water and its application to phosphorus-chlorophyll-seston relationships. Can. J. Fish. Aquat. Sci. 37, 111–114.
Cadel-Six, S., Peyraud-Thomas, C., Brient, L., Marsac, N. T., Rippka, R., and Méjean, A. (2007). Different genotypes of anatoxin-producing cyanobacteria coexist in the Tarn River, France. Appl. Environ. Microbiol. 73, 7605–7614.
Carmichael, W. W. (1992). Cyanobacteria secondary metabolites – the cyanotoxins. J. Appl. Bacteriol. 72, 445–459.
Carmichael, W. W., Biggs, D. F., and Peterson, M. A. (1979). Pharmacology of anatoxin-a, produced by the freshwater cyanophyte Anabaena flos-aquae NRC-44-1. Toxicon 17, 229–236.,
Codd, G. A., Morrison, L. F., and Metcalf, S. J. (2005). Cyanobacterial toxins: risk, management for health protection. Toxicol. Appl. Pharmacol. 203, 264–272.
Frost, P. C., Kinsman, L. E., Johnston, C. A., and Larson, J. H. (2009). Watershed discharge modulates relationships between landscape components and nutrient ratios in stream seston. Ecology 90, 1631–1640.
Furey, A., Crowley, J., Hamilton, B., Lehane, M., and James, K. J. (2005). Strategies to avoid the mis-identification of anatoxin-a using mass spectrometry in the forensic investigation of acute neurotoxic poisoning. J. Chromatogr. A 1082, 91–97.
Gugger, M., Lenoir, S., Berger, C., Ledreux, A., Druart, J., and Humbert, J.-F. (2005). First report in a river in France of the benthic cyanobacterium Phormidium favosum producing anatoxin-a associated with dog neurotoxicosis. Toxicon 45, 919–928.
Guillard, R. R. L. (1973). “Division rates,” in Handbook of Phycological Methods, ed. J. R. Stein (Cambridge: Cambridge University Press), 289–312.
Hamilton, J. G., Zangerl, A. R., De Lucia, E. H., and Berenbaum, M. R. (2001). The carbon-nutrient balance hypothesis: its rise and fall. Ecol. Lett. 4, 86–95.
Jespersen, A., and Christoffersen, K. (1987). Measurements of chlorophyll-a from phytoplankton using ethanol as extraction solvent. Arch. Fur. Hydrobiol. Stuttg. 109, 445–454.
Kurmayer, R. (2011). The toxic cyanobacterium Nostoc sp. strain 152 produces highest amounts of microcystin and nostophycin under stress conditions. J. Phycol. 47, 200–207.
Orr, P. T., and Jones, G. J. (1998). Relationships between microcystin production and cell division rates in nitrogen-limited Microcystis aeruginosa cultures. Limnol. Oceanogr. 43, 1604–1614.
Osswald, J., Rellan, S., Gago, A., and Vasconcelos, V. (2007). Toxicology and detection methods of the alkaloid neurotoxin produced by cyanobacteria, anatoxin-a. Environ. Int. 33, 1070–1089.
Rapala, J., Sivonen, K., Luukainen, R., and Niemalä, S. I. (1993). Anatoxin-a concentration in Anabaena and Aphanizomenon under different environmental conditions and comparison of growth by toxic and non-toxic Anabaena strains – a laboratory study. J. Appl. Phycol. 5, 581–591.
Selwood, A. I., Holland, P. T., Wood, S. A., Smith, K. F., and Mcnabb, P. S. (2007). Production of anatoxin-a and a novel biosynthetic precursor by the cyanobacterium Aphanizomenon issatschenkoi. Environ. Sci. Technol. 41, 506–510.
Sommer, U., Gliwicz, Z. M., Lambert, W., and Duncan, A. (1986). The PEG-model of seasonal succession of planktonic events in fresh waters. Arch. Hydrobiol. 106, 433–471.
Stevens, D. K., and Krieger, R. I. (1988). Analysis of anatoxin-a by GC/ECD. J. Anal. Toxicol. 12, 126–131.
Turpin, D. H. (1991). Effect of inorganic N availability on algal photosynthesis and carbon metabolism. J. Phycol. 27, 14–20.
van de Waal, D. B., Verspagen, M. H., Lürling, M., van Donk, E., Visser, P. M., and Huisman, J. (2009). The ecological stoichiometry of toxins produced by harmful cyanobacteria: an experimental test of the carbon-nutrient balance hypothesis. Ecol. Lett. 12, 1326–1335.
Whitton, B. A., and Potts, M. (2000). Introduction to the Cyanobacteria, the Ecology of Cyanobacteria: Their Diversity in Time and Space. Dordrecht: Kluwer Academic Publishers, 1–11.
Wiegand, C., and Pflugmacher, S. (2005). Ecotoxicological effects of selected cyanobacterial secondary metabolites a short review. Toxicol. Appl. Pharmacol. 203, 201–218.
Keywords: cyanobacteria, anatoxin-a, nitrogen deficiency, carbon-nutrient hypothesis
Citation: Gagnon A and Pick FR (2012) Effect of nitrogen on cellular production and release of the neurotoxin anatoxin-a in a nitrogen-fixing cyanobacterium. Front. Microbio. 3:211. doi: 10.3389/fmicb.2012.00211
Received: 06 February 2012; Accepted: 24 May 2012;
Published online: 12 June 2012.
Edited by:
George S. Bullerjahn, Bowling Green State University, USAReviewed by:
Xosé Anxelu G. Morán, Instituto Español de Oceanografía, SpainShawn R. Campagna, University of Tennessee Knoxville, USA
Copyright: © 2012 Gagnon and Pick. This is an open-access article distributed under the terms of the Creative Commons Attribution Non Commercial License, which permits non-commercial use, distribution, and reproduction in other forums, provided the original authors and source are credited.
*Correspondence: Alexis Gagnon, Center for Advanced Research in Environmental Genomics, University of Ottawa, Ottawa, ON, Canada K1N 6N5. e-mail:YWdhZ24wNDJAZ21haWwuY29t


