- Food and Nutritional Science, School of Biological Sciences, The University of Hong Kong, Pokfulam, Hong Kong
Exo-polysaccharide (EPS) produced by dairy starters plays critical roles in improving texture and functionalities of fermented dairy products. One of such high EPS producers, Streptococcus thermophilus ASCC 1275 (ST1275) was used as a model dairy strain to understand the stimulation of its EPS production under optimal milk fermentation conditions. The mRNA-seq analysis and targeted pathway analysis indicate that genes associated with lactose (milk sugar) catabolism, EPS assembly, proteolytic activity, and arginine/methionine/cysteine synthesis and transport in ST1275 were significantly up-regulated under the optimized conditions of pH 5.5, 40°C, or WPI supplementation compared to that of pH 6.5 and 37°C, respectively. This indicates that genes involved in above metabolisms cooperate together for improving EPS yield from ST1275. This study provides a global view map on potential targeted pathways and specific genes accounted for enhanced EPS production in Str. thermophilus and that could be modulated by fermentation conditions.
Introduction
Food-grade exo-polysaccharide (EPS) from lactic acid bacteria (LAB) and bifidobacteria plays important roles in improving the texture and functionalities of foods (Welman and Maddox, 2003; Galle and Arendt, 2014). There are numerous reports on the isolation and identification of EPS producers, optimization of EPS production and chemical and functional characterization of EPS (Ruas-Madiedo and De Los Reyes-Gavilán, 2005; Tabibloghmany and Ehsandoost, 2014). Since past decades, EPS production from dairy starter bacteria has drawn great attentions from dairy industry due to its important value-added functions such as texture-modifying property, immunomodulation and novel prebiotic for gut microbiota (Badel et al., 2011; Tabibloghmany and Ehsandoost, 2014; Salazar et al., 2016). However, there are challenges to optimize dairy fermentation process for EPS production due to limitations for manufacturing fermented dairy products such as cheese and yogurt. Thus, seeking for high EPS-producing dairy starter bacteria, i.e., Streptococcus thermophilus (Iyer et al., 2010), has become a promising strategy to make EPS-rich fermented milks.
Several studies have demonstrated high EPS production from non-starter lactic acid bacteria (NSLAB) such as Lactobacillus casei group, Lb. acidophilus, Lb. helveticus, Lb. brevis, and Lb. plantarum (Welman and Maddox, 2003; Tabibloghmany and Ehsandoost, 2014). For example, Lb. rhamnosus RW-9595M produced the highest amount of EPS in chemically defined medium among the reported strains of LAB and bifidobacteria (Bergmaier et al., 2004). Although NSLAB strains have been reported to improve the quality of some fermented dairy foods (Leroy and De Vuyst, 2004; Settanni and Moschetti, 2010), these NSLAB strains may only be adopted as adjunct starters due to their weak proteolytic activities and low acidifying rates (Buckenhüskes, 1993; Sasaki et al., 1995). Thus, numerous strains of typical dairy starters including Str. thermophilus, Lb. delbrueckii ssp., bulgaricus (Lb. bulgaricus), and Lactococcus lactis ssp. lactis (Lc. lactis) have been characterized for EPS production but their yields were not high (Frengova et al., 2000). Among them, Str. thermophilus ASCC 1275 (ST1275), a conventional dairy starter, has been identified in our pioneer study documented in 2003 as a high EPS producer in milk, and its EPS production could be simply improved by adjusting the fermentation conditions such as pH, temperature or supplementing milk with limited amount of whey protein concentrate/isolate (WPC or WPI), a by-product from cheese-making process (Zisu and Shah, 2003). Characteristics of EPS from ST1275 have been extensively studied in our lab for use in fermented milk products (Amatayakul et al., 2006a,b; Purwandari et al., 2007; Li and Shah, 2014, 2016).
Our attention was drawn when slight changes in the cell viability of ST1275 cultivated in milk under different fermentation conditions exhibited a major shift in EPS production (Figure S1, Supplementary Material) by this organism (Zisu and Shah, 2003). This motivated us to understand the intracellular changes in regards to EPS biosynthesis in ST1275. Recently, our genomic study provided detailed insights into gene features that are associated with nucleotide sugar synthesis and EPS assembly in ST1275, It is also interesting that ST1275 could produce the highest amount (refer to Supplementary Table 6 of the reference) of EPS in milk among the reported strains of Str. thermophilus (Wu et al., 2014). Due to the importance of Str. thermophilus in dairy industry (Iyer et al., 2010), ST1275 was used as a model strain of high EPS producer in this study to understand the role of environmental conditions in shaping bacterial physiology and EPS biosynthetic machinery. The mRNA-seq analysis was applied to profile gene expression patterns of ST1275 cultivated in milk under different fermentation conditions that have been documented in our previous study (Zisu and Shah, 2003).
Materials and Methods
Bacterial Cultivation and Batch Milk Fermentation
Streptococcus thermophilus ASCC 1275 (ST1275) was cultivated in Difco™ M17 broth (BD company, Franklin Lakes, NJ, USA) containing 1% (w/v) lactose at 37°C for 18 h prior to the inoculation (1%; v/v) into 10% (w/v) reconstituted skim milk (RSM). Milk batch fermentations under different pH, temperature and whey protein isolate (WPI) were followed as in our 2003 pioneer study for this strain (Zisu and Shah, 2003). The RSM medium was autoclaved at 120°C for 15 min. Milk fermentation was carried out in an assembled bioreactor—GLS 80® stirred reactor (DURAN Group, Mainz, Germany). The pH probe was sterilized by 1 N NaOH solution and was then inserted into the bioreactor through one of the ports in screw cap. Another two ports were connected to 6 M NaOH and 50% (wt/vol) citric acid solutions which were used for adjusting the pH of milk. Four conditions were selected for milk fermentation based on our previous study: condition 1 (Cd1)—pH 6.5 and 37°C; condition 2 (Cd2)—pH 5.5 and 37°C; condition 3 (Cd3)—pH 5.5 and 40°C; condition 4 (Cd4)—pH 5.5 and 37°C with 0.5% (wt/vol) WPI supplementation to the RSM. The EPS production from ST1275 from above conditions was observed after 24 h: Cd1−255 mg/L; Cd2−458 mg/L; Cd3−622 mg/L; Cd4−1,029 mg/L (Zisu and Shah, 2003). The milk fermentation was stopped after 6 h since the cells were in late log-growth phase. One volume of fermented milk after sampling was immediately treated with 0.33 volume of 1 M trisodium citrate (Derzelle et al., 2005); bacterial cell pellet were harvested by centrifugation and stored at −80°C for further RNA extraction. Three independent fermentation experiments were performed for each condition.
Total RNA Extraction and mRNA-Seq Procedure
Total RNA from bacterial cell pellet was extracted with Ambion's RiboPure-Yeast kit as per manufacturer's instructions. Extra DNase I treatment was necessary to remove any genomic DNA. Then, RNA integrity number (RIN) was obtained from Agilent 2100 Bioanalyzer, all extracted RNA samples have RIN score above nine indicating low RNA degradation; these samples were qualified for RNA-seq and were sent to BGI Tech Solutions (Hong Kong) Co., Ltd. for downstream sequencing process. Basically, ribosomal RNA (rRNA) was removed before library constructions followed by mRNA fragmentation, cDNA synthesis and fragment enrichment; then libraries were loaded into the Illumina HiSeq4000 platform for sequencing. The transcriptome datasets of the current study are available in the Sequence Read Archive (SRA) database in National Center for Biotechnology Information under accession numbers from SRX3029248 to SRX3029259.
Bioinformatic and Statistical Analyses
The filtering process of raw sequencing reads was carried out by BGI Tech Solutions (Hong Kong) Co., Ltd. resulting in about 2 gigabases of clean Illumina reads per sample. The quality threshold was set to 20 for filtering by BGI. Since Str. thermophilus ST1275 has been fully sequenced; read alignment/mapping was achieved by the package Tophat version 2.1.1 with very sensitive mode (read mismatches: 2) with the usage of Bowtie version 2.1.0 (Kim et al., 2013). The read counts per gene per sample were generated with HTSeq package (version 0.9.1) after the sorting procedure for accepted hits in BAM format with samtools (version 1.3.1) (Anders et al., 2015). The edgeR's quasi-likelihood pipeline (Robinson et al., 2010) took read count table for downstream analysis and the key parameters used are as follows: genes were excluded for analysis if it was not expressed at a count-per-million (CPM) above 0.5 in at least two libraries; trimmed mean of M values (TMM) normalization approach was performed to eliminate composition biases among all libraries (Robinson and Oshlack, 2010); log2CPM value was calculated for generating heatmaps, multi-dimensional scaling (MDS) plot, principal component analysis (PCA) plot, and downstream statistical analysis; trended dispersion was estimated for quasi-likelihood F-tests. False discovery rate (FDR) has been introduced to improve the statistical analysis for differentially expressed genes (DEGs). Gene with a fold-change significantly above 1.0 at a FDR cut-off of 5% is considered as a DEG.
Reverse-Transcriptase Quantitative PCR Assay
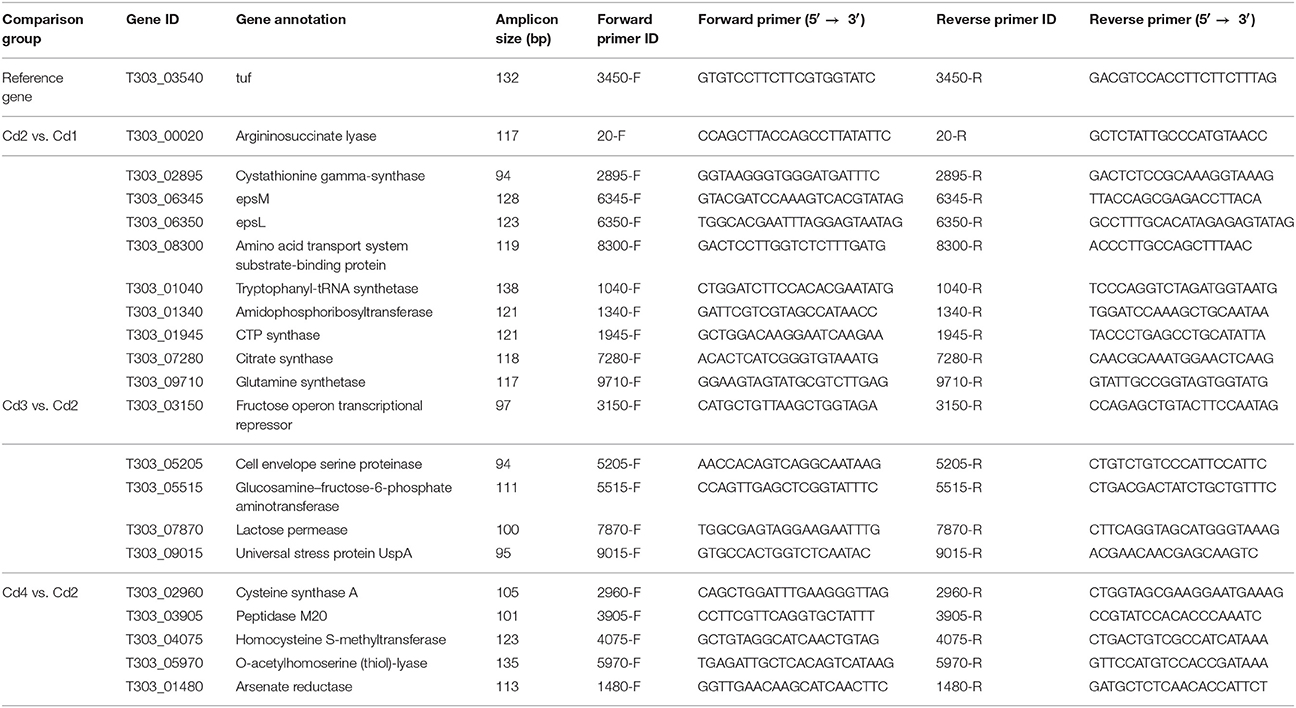
In order to validate gene expression level generated from RNA-seq, 20 genes (Cd2 vs. Cd1, Cd3 vs. Cd2, and Cd4 vs. Cd2) were selected for qPCR validation; these genes should have varying levels (log2 fold-change) of gene expression; we also included several key genes involved in EPS biosynthesis and proteolysis in this validation. Total RNA samples were treated with DNase I (Invitrogen) to remove remaining DNA; cDNA synthesis was carried out with High-Capacity RNA-to-cDNA™ Kit (Applied Biosystems). RT-qPCR assays were carried out using SYBR™ Green PCR Master Mix as previously described (Wu et al., 2015). The primers for 20 target genes and reference gene (tuf) are listed in Table 1. The amplification efficacy for each pair of primers was in the range of 90–110%, and non-specific amplification products were not detected by both melt curve analysis and agarose gel electrophoresis. Comparative critical threshold method (2−ΔΔCt) was used to calculate relative expression of each targeted gene: Cd1 was used as the reference for Cd2 vs. Cd1 comparison, and Cd2 was used as the reference for Cd3 vs. Cd2 and Cd4 vs. Cd2 comparisons. Each cDNA sample was performed in duplicates (technical repeats) in this assay; total RNA samples isolated from triplicate samples (biological repeats) per one condition were included in qPCR assay; qPCR assay was carried out for the same RNA samples that were also used for RNA-sequencing. The mean values of log2 fold-change (RNA-seq analysis) and -ΔΔCt (qPCR assay) of the selected genes were used for correlation analysis.
Results
RNA-Seq Data Production and Read Mapping/Alignment
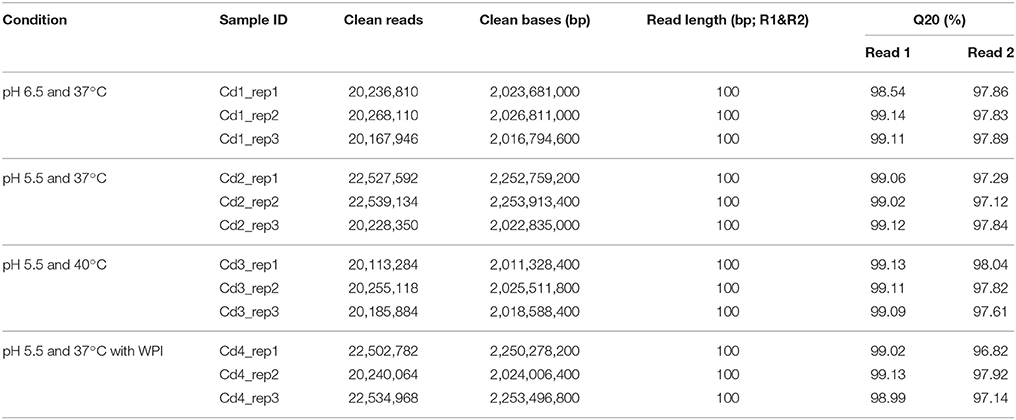
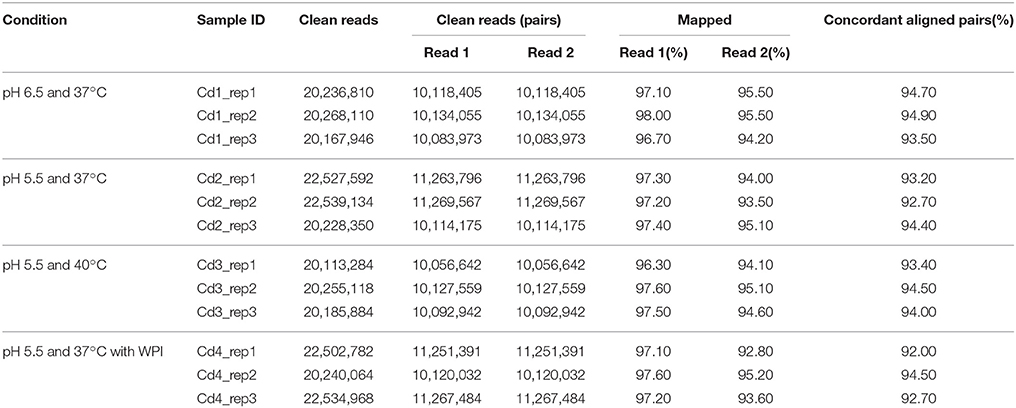
The results of sequencing data production and read mapping/alignment are shown in Tables 2, 3. As shown in Table 2, about 99% of raw forward read and 97.5% raw reverse read per sample passed the filtering at quality threshold of 20; this resulted in about 10,000,000 pairs of reads totaling 2 gigabases per sample. Among these filtered pairs, about 93.5% of them termed as concordant aligned pairs that were uniquely mapped to the genome of ST1275 (Table 3); this provides enough sequencing depth for identifying DEGs.
RNA-Seq Analysis and RT-qPCR Validation
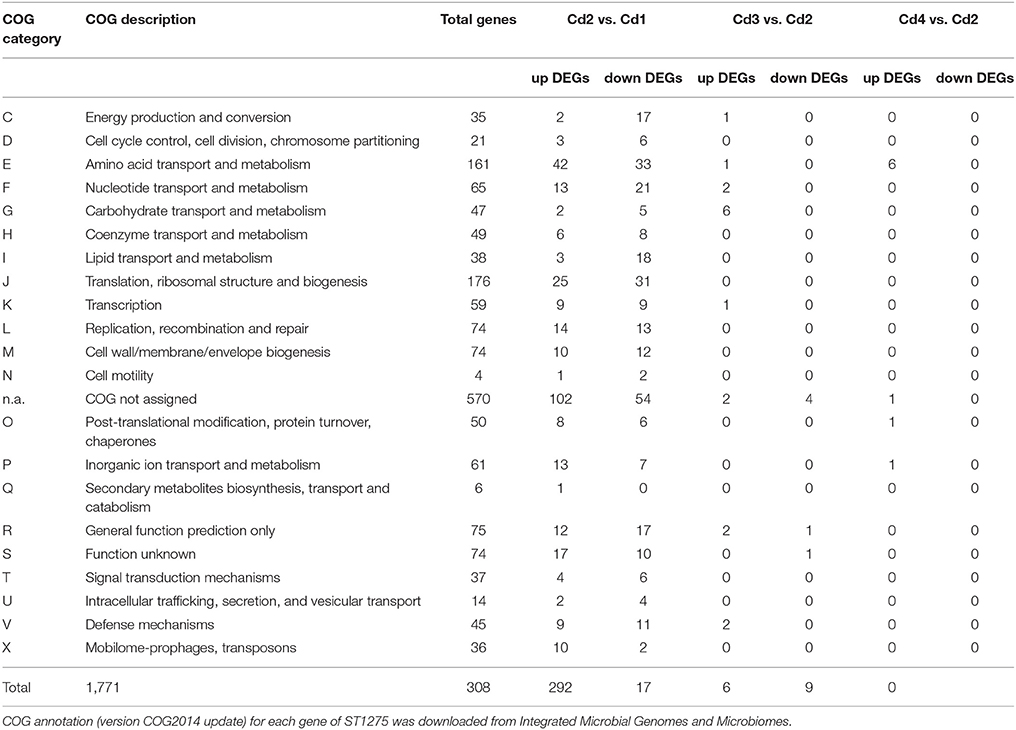
General presentations of RNA-seq analysis results are shown in Figure 1, Table 4 and the detailed expression data (log2CPM and log-fold-change) is presented in Table S1. Both MDS and PCA plots showed a clear separation of condition 1 from other three conditions suggesting the optimal pH for enhanced EPS production had very significant effect on the transcriptome of ST1275 (Figures 1A–C). The result shows that 292 genes were down-regulated and 308 up-regulated DEGs (Cd2 vs. Cd1) in total, whereas only 23 DEGs (Cd3 vs. Cd2) and 9 DEGs (Cd4 vs. Cd2) were observed in the evaluation of effects of temperature and WPI, respectively (Figures 1D–F). General presentation of DEGs with COG classification is shown in Table 4; the pH decrease (Cd2 vs. Cd1) had dramatically affected on the gene expression profiles with similar numbers of up and down DEGs. It is clear that temperature increase (Cd3 vs. Cd2) and WPI supplementation (Cd4 vs. Cd2) significantly improved the gene expression level of genes classified into carbohydrate (lactose) transport and metabolism and amino acids (arginine, cysteine, and methionine) transport and metabolism, respectively (Table 4). As shown in Table S1, about 1711 mRNA transcripts were detected by RNA-seq, whereas the amount of coding sequences (CDS) of ST1275 were 1694, suggesting the highly sensitive detection of gene transcripts by RNA-seq approach offering genome-scale profiling map.
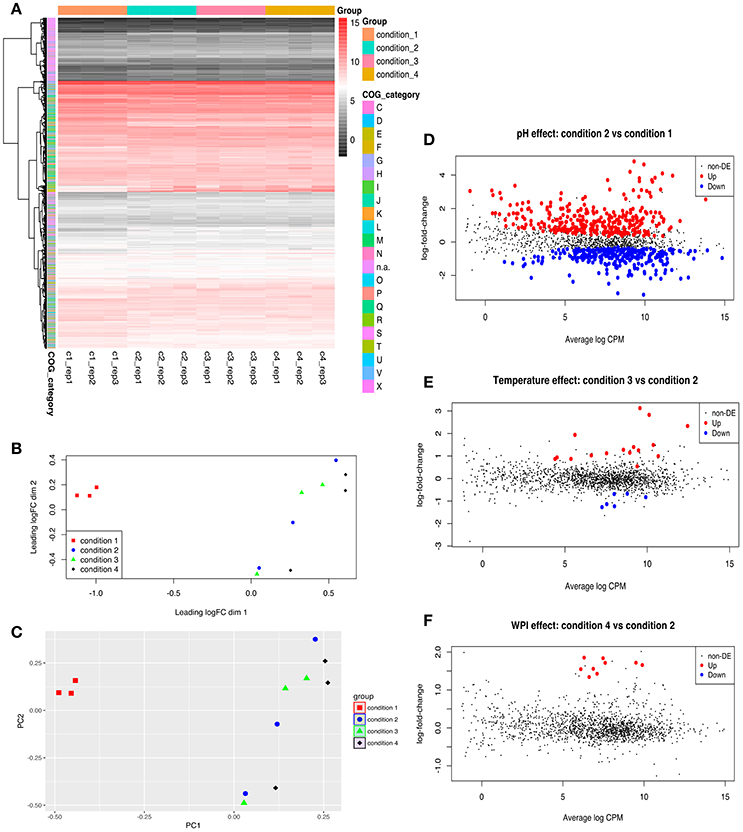
Figure 1. Genome-wide comparative transcriptome analysis of ST1275 under different pH, temperature and milk base. (A) Heatmap of gene expression level for samples collected from 4 conditions; genes are retained if they are expressed at a count-per-million (CPM) above 0.5 in at least two samples; expression values are normalized log2CPM by using edgeR package. (B) visualization of expression profiles (log2CPM) of different samples by multi-dimensional scaling (MDS) plot in edgeR package. (C) visualization of expression profiles (log2CPM) of different samples by principal component analysis (PCA) plot in ggfortify package. (D) Detection of DEGs for samples from condition 2 compared to samples from condition 1. (E) Detection of DEGs for samples from condition 3 compared to samples from condition 2. (F) Detection of DEGs for samples from condition 4 compared to samples from condition 2. Genes with a fold-change significantly above 1.0 at an FDR cut-off of 5% is considered as DEGs. COG denotation: C, energy production and conversion; D, cell cycle control, cell division, chromosome partitioning; E, amino acid transport and metabolism; F, nucleotide transport and metabolism; G, carbohydrate transport and metabolism; H, coenzyme transport and metabolism; I, lipid transport and metabolism; J, translation, ribosomal structure and biogenesis; K, transcription; L, replication, recombination and repair; M, cell wall/membrane/envelope biogenesis; N, cell motility; n.a., not assigned; O, post-translational modification, protein turnover, chaperones; P, inorganic ion transport and metabolism; Q, secondary metabolites biosynthesis, transport and catabolism; R, general function prediction only; S, function unknown; T, signal transduction mechanisms; U, intracellular trafficking, secretion, and vesicular transport; V, defense mechanisms; X, mobilome: prophages, transposons.
Next, reverse-transcriptase qPCR assay was used to confirm the gene expression of 20 genes with variable fold changes by RNA-seq. Twenty genes including 10 from Cd2 vs. Cd1 comparison, 5 from Cd3 vs. Cd2 comparison and 5 from Cd4 vs. Cd2 comparison were selected for qPCR verification. The reference gene (T303_03540; Table 1), tuf, was used for normalization of gene expression in ST1275 during qPCR assay (Li et al., 2011); the count-per-million values of this gene under the four conditions tested were very similar indicating its highly stable expression in ST1275 (Table S1). Thus, tuf was selected as the reference gene for normalization purposes for qPCR assay. As shown in Figure 2, the correlation coefficient (r) was about 0.9769 indicating that the fold changes of selected genes from RNA-seq and qPCR assay were strongly and positively correlated, in the other words, qPCR results confirmed the expression levels of these 20 genes via RNA-seq analysis. Since these 20 genes had variable fold changes (Figure 2), this may generally support the accuracy of RNA-seq results. However, RNA-seq over-performs qPCR assay in terms of detection limit, detection accuracy and data interpretation (FDR analysis); thus, we believe that RNA-seq method in this study could provide us accurate transcriptome results for ST1275.
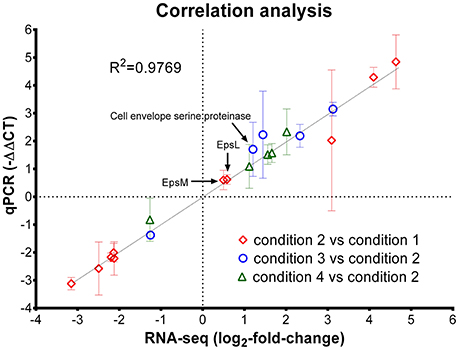
Figure 2. Correlation analysis of gene expression level from RNA-seq analysis and reverse-transcriptase qPCR assay. Diamond, genes selected from the comparison of condition 2 and condition 1 (pH effect); Circle, genes selected from the comparison of condition 3 and condition 2 (temperature effect); triangle, genes selected from the comparison of condition 4 and condition 2 (WPI effect). The error bar (standard deviation) for -ΔΔCT (qPCR assay) was indicated; only the mean values for qPCR assay and RNA-seq results were used for linear regression analysis.
Nucleotide Sugar Synthesis
The effects of pH, temperature and WPI on the gene expression of nucleotide sugar synthesis are presented in Figure 3, Table S1. For Cd2 vs. Cd1 (pH effect), the pH of milk medium that decreased from pH 6.5 to pH 5.5 down-regulated expression level of genes (T303_07160, T303_07165, T303_07195) that are associated with dTDP-rhamnose and UDP-GlcNAc (Figure 3B). The expression of glycolysis-associated genes such as T303_07865, T303_04850, T303_02195 and T303_06845 did not change much (Cd2 vs. Cd1). As for temperature effect (Cd3 vs. Cd2), the temperature of milk fermentation that increased from 37 to 40°C significantly up-regulated the expression of genes associated with lactose catabolism, UDP-glucose/UDP-galactose synthesis and UDP-GlcNAc synthesis (Figure 3B, Table S1). There were no significant changes in the expression level of nucleotide sugar synthesis-associated genes in ST1275 in milk supplemented with WPI (Cd4 vs. Cd2; Table S1).
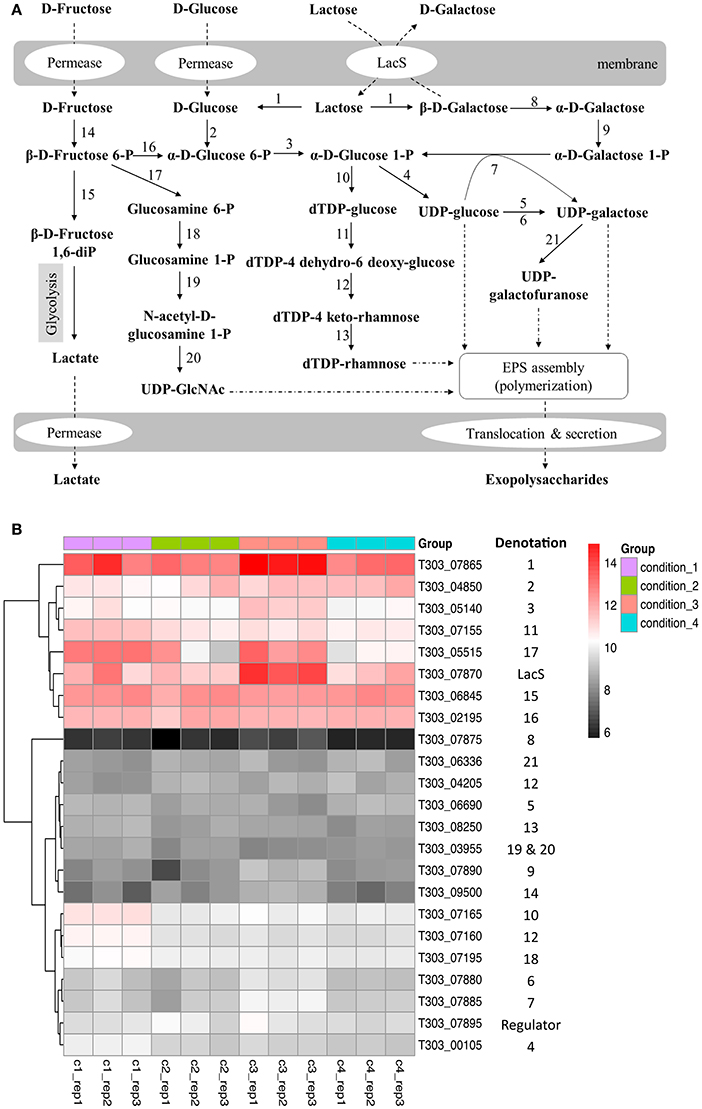
Figure 3. Changes in gene expression of nucleotide sugar synthesis-associated genes in ST1275 under different conditions. (A) biosynthesis pathways of nucleotide sugars. (B) Heatmap of expression level (log2CPM) of nucleotide sugar synthesis-associated genes. Denotations: 1, β-Galactosidase; 2, Glucokinase; 3, Phosphoglucomutase; 4, UDP-glucose pyrophosphorylase; 5, UDP-glucose 4 epimerase; 6, UDP-galactose 4 epimerase; 7, Galactose 1-phosphate uridylytransferase; 8, Galactose mutarotase; 9, Galactokinase; 10, dTDP-glucose pyrophosphorylase; 11, dTDP-glucose-4, 6-dehydratase; 12, dTDP-4 keto-6 deoxy-glucose 3, 5-epimerase; 13, dTDP-4 keto-L-rhamnose reductase; 14, Fructokinase; 15, 6-phosphofructokinase; 16, Phosphoglucose isomerase; 17, glutamine-fructose-6-phosphhate transaminase; 18, Phosphoglucosamine mutase; 19 and 20, N-acetylglucosamine-1-phosphate uridyltransferase (bifunctional); 21, UDP-galactopyranose mutase.
EPS Assembly
The changes in gene expression of eps gene cluster are shown in Figure 4, Table S1. Significant DEGs were only observed when assessing the effect of pH drop (Cd2 vs. Cd1; Table S1): (1) epsM and epsL related with EPS polymerization and membrane translocation, and has been validated by qPCR; (2) epsK, epsI, and epsJ related with glycosidic bond formation by glycosyltransferase. The gene expression of epsQ, assigned for the transfer of EPS between the membrane and peptidoglycan layer (Wu et al., 2014), were significantly down-regulated suggesting the EPS exportation may be reduced. However, as the milk fermentation is a long-term process that gives enough time for cells to release EPS. As presented in Figure 4, a similar expression pattern (from T303_06320 to T303_06385) was observed in Cd2, Cd3, and Cd4 compared to that in Cd1; this suggests that temperature increase (Cd3 vs. Cd2) and WPI supplementation (Cd4 vs. Cd2) did not alter the expression of these genes, whereas pH drop (Cd2 vs. Cd1) up-regulated the genes associated with EPS assembly and translocation.
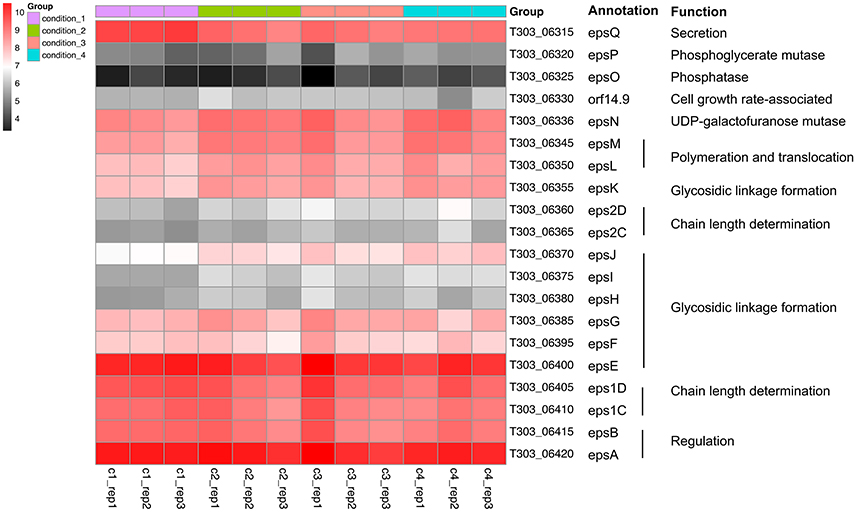
Figure 4. Heatmap of expression level (log2CPM) of EPS assembly-associated genes in ST1275 under different conditions.
So far, the two epsC-epsD gene sets were only observed in ST1275 among the sequenced strains of Str. thermophilus (Wu et al., 2014). Interestingly, two unique eps1C-eps1D and eps2C-eps2D assigned for determining the chain length of EPS repeating units showed opposite expression pattern under two different pH conditions (Figure 4). For additional temperature increase, the eps1C-eps1D gene expression was also increased under Cd3 compared to that under Cd2. This indicates that the polymerization degree of EPS may vary from condition to condition.
Arginine, Methionine, and Cysteine Metabolism
The changes in gene expression of arginine/methionine/cysteine metabolism-associated genes are presented in Figure 5, Table S1. Acidic condition (pH 5.5) significantly altered the gene expression of arginine/methionine/cysteine metabolism-associated genes, especially arginine biosynthesis. WPI supplemented to milk also increased the level of mRNA transcripts of arginine/methionine/cysteine metabolism-associated genes in ST1275.
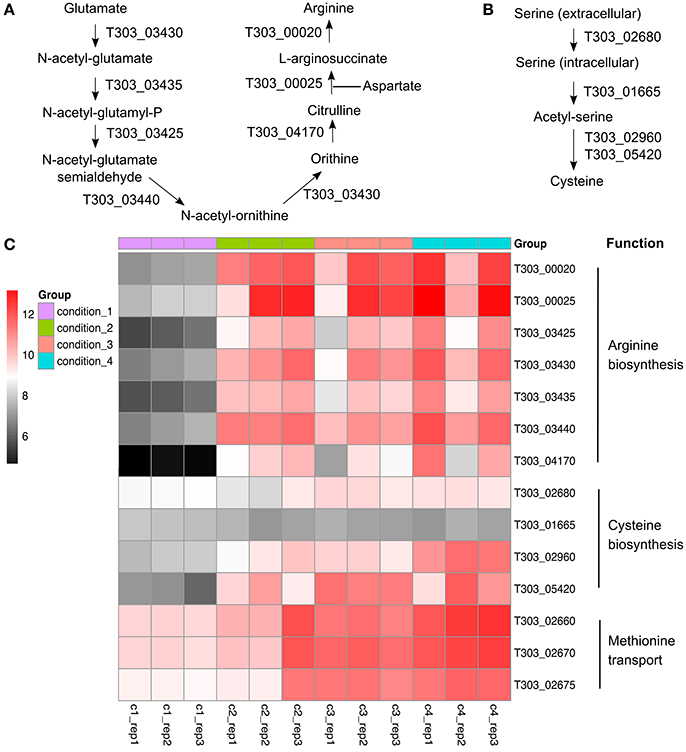
Figure 5. Gene expression profile (log2CPM) of arginine/cysteine/methionine-associated genes in ST1275 under different conditions. (A) arginine synthesis pathway; (B) cysteine synthesis pathway; (C) Heatmap of expression level (log2CPM) of arginine, cysteine, and methionine-associated genes.
Proteolytic Activity
As shown in Table S1 (log2CPM spreadsheet), the only one gene (T303_05205) encoding extracellular serine proteinase—lactocepin was up-regulated in Cd3 and Cd4 conditions as compared to Cd1 and Cd2. This may indicate an improved extracellular proteolytic activity of ST1275 under Cd3 and Cd4 in milk environment.
Discussion
EPS production machinery in ST1275, a typical conventional dairy starter, could be stimulated under optimal conditions, i.e., pH 5.5, 37 or 40°C and WPI supplementation, for EPS biosynthesis and release. Thus, genome-wide comparative transcriptome strategy was applied to obtain global changes in cellular transcription in this organism under different pH and temperature when cultured in milk environment supplemented with or without WPI. The high-quality RNA-seq data provided sufficient depth and coverage for calculating the abundance of detected coding genes (Tables 2, 3). In addition, qPCR assay also verified the accuracy of RNA-seq data (Figure 2). It was noted that several monosaccharides including mannose, galactose, glucose, fucose, glucosamine and galactosamine in the EPS of ST1275 were detected by HPLC equipped with a UV detector based on the retention time of standards (Li and Shah, 2016). This may be not accurate due to two reasons: (1) this detection is not based on mass spectroscopy; (2) there are no pathways for synthesis of nucleotide sugars such as UDP-GlcA, UDP-GalA, GDP-mannose and GDP-fucose based on our genetic annotations (Wu et al., 2014) and this transcriptome study–functional approach. However, it is advised that glucose, galactose, rhamnose and GlcNAc are commonly detected in the EPS from Str. thermophilus (Lemoine et al., 1997; Degeest et al., 2002; Broadbent et al., 2003; Vaningelgem et al., 2004; Tabibloghmany and Ehsandoost, 2014).
Effects of pH Decrease (Cd2 vs. Cd1) on Global Cellular Transcription
As more EPS was produced from ST1275 under pH 5.5 compared to that under pH 6.5, the pH effect (Cd2 vs. Cd1) on genome-wide cellular transcription was first assessed. Although there was 600 DEGs accounted for about one third of coding genes in ST1275 (Figure 1D, Table 4), it is clear that the pH decrease resulted in the dramatic shift of gene expression profiles accounted for enhanced EPS production (Figure 1B,C). Among them, EPS assembly/translocation were up-regulated under pH 5.5 (Figure 4). It has been indicated that almost 3-fold increase in the gene expression of eps gene cluster resulted in 4-fold EPS production from L. lactis (Boels et al., 2003). Thus, the increased mRNA level of eps gene cluster (epsNMLKJ) may support the enhanced EPS production from ST1275 in such acidic condition. However, dTDP-rhamnose and UDP-GlcNAc synthesis-associated genes were significantly down-regulated (Figure 3, Table S1); this alteration in EPS precursors may result in the changes in chemical composition of EPS, though the EPS production from ST1275 increased under pH 5.5. Thus, this merits further chemical characterization of EPS from different conditions.
Effects of Temperature Increase (Cd3 vs. Cd2) on Global Cellular Transcription
Lactose is the main carbohydrate in milk and Str. thermophilus transports lactose via the LacS (lactose permease) that also function as a lactose/galactose antiporter or a galactose/proton symporter (Foucaud and Poolman, 1992). Temperature increase from 37 to 40°C (Cd3 vs. Cd2) had limited effects on the cellular transcription as evidenced by only 23 DEGs (Figure 1E, Table S1). Among them, the improved gene expression of lactose catabolism-associated genes may result in more nucleotide sugars for EPS assembly (Figure 3). This has been demonstrated in Str. thermophilus strain LY03 by (Levander et al., 2002). In addition, EPS-assembly-associated genes were also enhanced (Figure 4), thus this may support better EPS production from ST1275 cultivated in a higher temperature (Boels et al., 2003). Importantly, the genes encoding cell envelope-associated proteinase were up-regulated in Cd3 compared to Cd2; this may indicate a better proteolytic activity in the condition of 40°C as extracellular proteinase of Str. thermophilus plays a critical role in adapting to milk environment (Hols et al., 2005; Delorme et al., 2010; Hafeez et al., 2013). It appears that the condition 3 (Cd 3; pH 5.5 and 40°C) showed the highest potential for enhanced EPS production based on those important gene expression patterns. Although limited alterations in dairy fermentation for certain type of products are allowed, simple changes in pH and temperature parameters may be allowed for new fermented dairy products.
Effects of WPI Supplementation (Cd4 vs. Cd2) on Global Cellular Transcription
Only 9 DEGs (Figure 1F) were obtained when assessing the WPI effect. Most of these DEGs are associated with EPS assembly and arginine, methionine, and cysteine synthesis (Figure 4,5). As mentioned above, enhanced mRNA level of eps gene cluster may support higher EPS production (Boels et al., 2003). Evidence indicates minimal sulfur amino acid auxotrophy (histidine/methionine/cysteine) of Str. thermophilus LMG18311 in chemically defined medium suggesting the roles of methionine/cysteine involved in the optimal growth of S. thermophilus (Pastink et al., 2009). Meanwhile, it has been reported that methionine is a rare amino acid in milk (Tamine and Deeth, 1980). Thus, an increase in cysteine synthesis and methionine transport from milk environment (WPI) under condition 4 may help ST1275 cells grow in milk. Furthermore, sulfur volatile compounds synthesized from methionine/cysteine in dairy starters provide characteristic flavor to fermented milk products (Liu et al., 2012). It appears that fermented milk from condition 4 may have a better flavor. Although the arginine synthesis-associated genes were up-regulated significantly (Figure 5), the function of arginine in ST1275 is still not well documented. There was one study describing the role of arginine in cytosolic pH homeostasis via the arginine decarboxylase-urease pathway (Huang et al., 2016). However, this pathway is absent in ST1275 (refer to KEGG website for this strain). In addition, whey proteins are rich in glutamate and aspartate which are substrates for arginine biosynthesis (Figure 5A); this may suggest an enhanced arginine production due to the supplementation of WPI. Further investigations on arginine function in ST1275 and its role in EPS production are necessary.
The Regulation of Two Sets of epsC-epsD in ST1275
The epsC-epsD was assigned for chain length determination and export (Goh et al., 2011). In general, EpsC is required for tyrosine phosphorylation of EpsD resulting in a EpsD phosphorylated form, whereas the activity of EpsE, the priming enzyme for EPS repeating unit synthesis, is activated by the phosphorylated EpsD (Minic et al., 2007). We previously identified two sets of epsC-epsD in ST1275 which is rare in Str. thermophilus (Wu et al., 2014). Now, it is the first time that we confirmed the transcription levels of both epsC-epsD sets in this organism (Figure 4). Notably, the transcription level of eps1C-eps1D and epsE did not change much among four conditions, whereas eps2C-eps2D was slightly up-regulated under Cd2, Cd3, and Cd4 compared to Cd1; this may suggest a secondary regulation for EpsE occurred in Cd2, Cd3, and Cd4 (Figure 4) resulting in different chain lengths of EPSs produced from ST1275. Moreover, EpsB exhibits phosphatase activity against phosphorylated EpsD (Bender and Yother, 2001; Minic et al., 2007); thus EpsB acts as a modulator of EpsD as evidenced by the enhanced EpsE activity in the mutant Str. thermophilus strain lacking EpsB (Minic et al., 2007). Hence, the slightly down regulation of epsB (inhibition) and up-regulation of eps2D (activation) may result in an improved EpsE activity that supports the improved EPS yields from ST1275 under Cd2, Cd3, and Cd4 compared to that under Cd1.
Conclusions
The genome-wide transcriptome analysis for high EPS-producing ST1275 under various fermentation conditions provided detailed global insights into the gene expression patterns that were associated with enhanced EPS yields. Particularly, up-regulation of genes that were related with nucleotide sugars synthesis, EPS assembly, arginine, methionine, and cysteine synthesis or transport and proteolysis would be accounted for improving EPS production from ST1275. This study also indicates that EPS production from Str. thermophilus involves many synthesizing genes (i.e., eps gene cluster) that could be modulated by environmental conditions such as pH to cooperate together for an enhanced EPS yield.
Author Contributions
QW and NS designed the study. QW performed the experiments excluding the mRNA sequencing service, analyzed the data, and generated the figures and tables. QW and NS wrote the paper.
Funding
This work is supported by General Research Fund (project code: 17105315) from Research Grants Council of University Grants Committee, Hong Kong.
Conflict of Interest Statement
The authors declare that the research was conducted in the absence of any commercial or financial relationships that could be construed as a potential conflict of interest.
Supplementary Material
The Supplementary Material for this article can be found online at: https://www.frontiersin.org/articles/10.3389/fmicb.2018.00445/full#supplementary-material
Figure S1. Re-analysis of data generated from our 2003 pioneer study (Zisu and Shah, 2003). (A) principal component analysis (PCA) of EPS data from ST1275 during 24-h time-course milk fermentation; (B) PCA analysis of bacterial cell viability of ST1275 during 24-h time-course milk fermentation. WPC, whey protein concentrate; PCA, principal component analysis.
Table S1. List of genes with their expression level in ST1275 under the four conditions assessing the effects of pH, temperature and WPI.
References
Amatayakul, T., Halmos, A. L., Sherkat, F., and Shah, N. P. (2006a). Physical characteristics of yoghurts made using exopolysaccharide-producing starter cultures and varying casein to whey protein ratios. Int. Dairy J. 16, 40–51. doi: 10.1016/j.idairyj.2005.01.004
Amatayakul, T., Sherkat, F., and Shah, N. P. (2006b). Physical characteristics of set yoghurt made with altered casein to whey protein ratios and EPS-producing starter cultures at 9 and 14% total solids. Food Hydrocolloid. 20, 312–324. doi: 10.1016/j.foodhyd.2005.02.015
Anders, S., Pyl, P. T., and Huber, W. (2015). HTSeq–a Python framework to work with high-throughput sequencing data. Bioinformatics 31, 166–169. doi: 10.1093/bioinformatics/btu638
Badel, S., Bernardi, T., and Michaud, P. (2011). New perspectives for Lactobacilli exopolysaccharides. Biotechnol. Adv. 29, 54–66. doi: 10.1016/j.biotechadv.2010.08.011
Bender, M. H., and Yother, J. (2001). CpsB is a modulator of capsule-associated tyrosine kinase activity in Streptococcus pneumoniae. J. Biol. Chem. 276, 47966–47974. doi: 10.1074/jbc.M105448200
Bergmaier, D., Champagne, C. P., and Lacroix, C. (2004). Growth and exopolysaccharide production during free and immobilized cell chemostat culture of Lactobacillus rhamnosus RW-9595M. J. Appl. Microbiol. 98, 272–284. doi: 10.1111/j.1365-2672.2004.02462.x
Boels, I. C., Van Kranenburg, R., Kanning, M. W., Chong, B. F., De Vos, W. M., and Kleerebezem, M. (2003). Increased exopolysaccharide production in Lactococcus lactis due to increased levels of expression of the NIZO B40 eps gene cluster. Appl. Environ. Microbiol. 69, 5029–5031. doi: 10.1128/AEM.69.8.5029-5031.2003
Broadbent, J. R., McMahon, D. J., Welker, D. L., Oberg, C. J., and Moineau, S. (2003). Biochemistry, genetics, and applications of exopolysaccharide production in Streptococcus thermophilus: a review. J. Dairy Sci. 86, 407–423. doi: 10.3168/jds.S0022-0302(03)73619-4
Buckenhüskes, H. J. (1993). Selection criteria for lactic acid bacteria to be used as starter cultures for various food commodities. FEMS Microbiol. Rev. 12, 253–271. doi: 10.1016/0168-6445(93)90067-J
Degeest, B., Mozzi, F., and De Vuyst, L. (2002). Effect of medium composition and temperature and pH changes on exopolysaccharide yields and stability during Streptococcus thermophilus LY03 fermentations. Int. J. Food Microbiol. 79, 161–174. doi: 10.1016/S0168-1605(02)00116-2
Delorme, C., Bartholini, C., Bolotine, A., Ehrlich, S. D., and Renault, P. (2010). Emergence of a cell wall protease in the Streptococcus thermophilus population. Appl. Environ. Microbiol. 76, 451–460. doi: 10.1128/AEM.01018-09
Derzelle, S., Bolotin, A., Mistou, M. Y., and Rul, F. (2005). Proteome analysis of Streptococcus thermophilus grown in milk reveals pyruvate formate-lyase as the major upregulated protein. Appl. Environ. Microbiol. 71, 8597–8605. doi: 10.1128/AEM.71.12.8597-8605.2005
Foucaud, C., and Poolman, B. (1992). Lactose transport system of Streptococcus thermophilus: functional reconstitution of the protein and characterization of the kinetic mechanism of transport. J. Biol. Biochem. 267, 22087–22094.
Frengova, G. I., Simova, E. D., Beshkova, D. M., and Simov, Z. I. (2000). Production and monomer composition of exopolysaccharides by yogurt starter cultures. Can. J. Microbiol. 46, 1123–1127. doi: 10.1139/w00-103
Galle, S., and Arendt, E. K. (2014). Exopolysaccharides from sourdough lactic acid bacteria. Crit. Rev. Food Sci. Nutr. 54, 891–901. doi: 10.1080/10408398.2011.617474
Goh, Y. J., Goin, C., O'flaherty, S., Altermann, E., and Hutkins, R. (2011). Specialized adaptation of a lactic acid bacterium to the milk environment: the comparative genomics of Streptococcus thermophilus LMD-9. Microb. Cell Fact. 10:S22. doi: 10.1186/1475-2859-10-S1-S22
Hafeez, Z., Cakir-Kiefer, C., Girardet, J. M., Jardin, J., Perrin, C., Dary, A., et al. (2013). Hydrolysis of milk-derived bioactive peptides by cell-associated extracellular peptidases of Streptococcus thermophilus. Appl. Microbiol. Biotechnol. 97, 9787–9799. doi: 10.1007/s00253-013-5245-7
Hols, P., Hancy, F., Fontaine, L., Grossiord, B., Prozzi, D., Leblond-Bourget, D., et al. (2005). New insights in the molecular biology and physiology of Streptococcus thermophilus revealed by comparative genomics. FEMS Microbiol. Rev. 29, 435–463. doi: 10.1016/j.femsre.2005.04.008
Huang, S., Ai, Z. W., Sun, X. M., Liu, G. F., Zhai, S., Zhang, M., et al. (2016). Influence of arginine on the growth, arginine metabolism and amino acid consumption profiles of Streptococcus thermophilus T1C2 in controlled pH batch fermentations. J. Appl. Microbiol. 121, 746–756. doi: 10.1111/jam.13221
Iyer, R., Tomar, S. K., Maheswari, T. U., and Singh, R. (2010). Streptococcus thermophilus strains: multifunctional lactic acid bacteria. Int. Dairy J. 20, 133–141. doi: 10.1016/j.idairyj.2009.10.005
Kim, D., Pertea, G., Trapnell, C., Pimentel, H., Kelley, R., and Salzberg, S. L. (2013). TopHat2: accurate alignment of transcriptomes in the presence of insertions, deletions and gene fusions. Genome Biol. 14:R36. doi: 10.1186/gb-2013-14-4-r36
Lemoine, J., Chirat, F., Wieruszeski, J. M., Strecker, G., Favre, N., and Neeser, J. R. (1997). Structural characterization of the exocellular polysaccharides produced by Streptococcus thermophilus SFi39 and SFi12. Appl. Environ. Microbiol. 63, 3512–3518.
Leroy, F., and De Vuyst, L. (2004). Lactic acid bacteria as functional starter cultures for the food fermentation industry. Trend. Food Sci. Technol. 15, 67–78. doi: 10.1016/j.tifs.2003.09.004
Levander, F., Svensson, M., and Rådström, P. (2002). Enhanced exopolysaccharide production by metabolic engineering of Streptococcus thermophilus. Appl. Environ. Microbiol. 68, 784–790. doi: 10.1128/AEM.68.2.784-790.2002
Li, J. S., Bi, Y. T., Dong, C., Yang, J. F., and Liang, W. D. (2011). Transcriptome analysis of adaptive heat shock response of Streptococcus thermophilus. PLoS ONE 6:e25777. doi: 10.1371/journal.pone.0025777
Li, S., and Shah, N. P. (2014). Antioxidant and antibacterial activities of sulphated polysaccharides from Pleurotus eryngii and Streptococcus thermophilus ASCC 1275. Food Chem. 165, 262–270. doi: 10.1016/j.foodchem.2014.05.110
Li, S., and Shah, N. P. (2016). Characterization, anti-inflammatory and antiproliferative activities of natural and sulfonated exo-polysaccharides from Streptococcus thermophilus ASCC 1275. J. Food Sci. 81, M1167–M1176. doi: 10.1111/1750-3841.13276
Liu, M., Prakash, C., Nauta, A., Siezen, R. J., and Francke, C. (2012). Computational analysis of cysteine and methionine metabolism and its regulation in dairy starter and related bacteria. J. Bacteriol. 194, 3522–3533. doi: 10.1128/JB.06816-11
Minic, Z., Marie, C., Delorme, C., Faurie, J. M., Mercier, G., Ehrlich, D., et al. (2007). Control of EpsE, the phosphoglycosyltransferase initiating exopolysaccharide synthesis in Streptococcus thermophilus, by EpsD tyrosine kinase. J. Bacteriol. 189, 1351–1357. doi: 10.1128/JB.01122-06
Pastink, M. I., Teusink, B., Hols, P., Visser, S., de Vos, W. M., and Hugenholtz, J. (2009). Genome-scale model of Streptococcus thermophilus LMG18311 for metabolic comparison of lactic acid bacteria. Appl. Environ. Microbiol. 75, 3627–3633. doi: 10.1128/AEM.00138-09
Purwandari, U., N. P., Shah, N. P., and Vasiljevic, T. (2007). Effects of exopolysaccharide-producing strains of Streptococcus thermophilus on technological and rheological properties of set-type yoghurt. Int. Dairy J. 17, 1344–1352. doi: 10.1016/j.idairyj.2007.01.018
Robinson, M. D., McCarthy, D. J., and Smyth, G. K. (2010). edgeR: a Bioconductor package for differential expression analysis of digital gene expression data. Bioinformatics 26, 139–140. doi: 10.1093/bioinformatics/btp616
Robinson, M. D., and Oshlack, A. (2010). A scaling normalization method for differential expression analysis of RNA-seq data. Genome Biol. 11:R25. doi: 10.1186/gb-2010-11-3-r25
Ruas-Madiedo, P., and de Los Reyes-Gavilán, C. G. (2005). Invited review: methods for the screening, isolation, and characterization of exopolysaccharides produced by lactic acid bacteria. J. Dairy Sci. 88, 843–856. doi: 10.3168/jds.S0022-0302(05)72750-8
Salazar, N., Gueimonde, M., De Los Reyes-Gavilán, C. G., and Ruas-Madiedo, P. (2016). Exopolysaccharides produced by lactic acid bacteria and bifidobacteria as fermentable substrates by the intestinal microbiota. Crit. Rev. Food Sci. Nutr. 56, 1440–1453 doi: 10.1080/10408398.2013.770728
Sasaki, M., Bosman, B. W., and Tan, P. S. (1995). Comparison of proteolytic activities in various lactobacilli. J. Dairy Res. 62, 601–610. doi: 10.1017/S0022029900031332
Settanni, L., and Moschetti, G. (2010). Non-starter lactic acid bacteria used to improve cheese quality and provide health benefits. Food Microbiol. 27, 691–697. doi: 10.1016/j.fm.2010.05.023
Tabibloghmany, F. S., and Ehsandoost, E. (2014). An overview of healthy and functionality of exopolysaccharides produced by lactic acid bacteria in the dairy industry. Eur. J. Nut. Food Safety 4, 63–86. doi: 10.9734/EJNFS/2014/6948
Tamine, A. Y., and Deeth, H. C. (1980). Yogurt: technology and biochemistry. J. Food Protect. 43, 939–977. doi: 10.4315/0362-028X-43.12.939
Vaningelgem, F., Zamfir, M., Mozzi, F., Adriany, T., Vancanneyt, M., Swings, J., et al. (2004). Biodiversity of exopolysaccharides produced by Streptococcus thermophilus strains is reflected in their production and their molecular and functional characteristics. Appl. Environ. Microbiol. 70, 900–912. doi: 10.1128/AEM.70.2.900-912.2004
Welman, A. D., and Maddox, I. S. (2003). Exopolysaccharides from lactic acid bacteria: perspectives and challenges. Trend. Biotechnol. 21, 269–274. doi: 10.1016/S0167-7799(03)00107-0
Wu, Q., Law, Y. S., and Shah, N. P. (2015). Dairy Streptococcus thermophilus improves cell viability of Lactobacillus brevis NPS-QW-145 and its γ-aminobutyric acid biosynthesis ability in milk. Sci. Rep. 5:12885. doi: 10.1038/srep12885
Wu, Q., Tun, H. M., Leung, F. C., and Shah, N. P. (2014). Genomic insights into high exopolysaccharide-producing dairy starter bacterium Streptococcus thermophilus ASCC 1275. Sci. Rep. 4:4974. doi: 10.1038/srep04974
Keywords: exopolysaccharide, Streptococcus thermophilus, milk fermentation, transcriptome, pH
Citation: Wu Q and Shah NP (2018) Comparative mRNA-Seq Analysis Reveals the Improved EPS Production Machinery in Streptococcus thermophilus ASCC 1275 During Optimized Milk Fermentation. Front. Microbiol. 9:445. doi: 10.3389/fmicb.2018.00445
Received: 11 January 2018; Accepted: 26 February 2018;
Published: 13 March 2018.
Edited by:
Michael Gänzle, University of Alberta, CanadaReviewed by:
Shu-Wei Marcia Su, Jackson Laboratory, United StatesFernanda Mozzi, CERELA-CONICET, Argentina
Copyright © 2018 Wu and Shah. This is an open-access article distributed under the terms of the Creative Commons Attribution License (CC BY). The use, distribution or reproduction in other forums is permitted, provided the original author(s) and the copyright owner are credited and that the original publication in this journal is cited, in accordance with accepted academic practice. No use, distribution or reproduction is permitted which does not comply with these terms.
*Correspondence: Nagendra P. Shah, bnBzaGFoQGhrdS5oaw==
†Present Address: Qinglong Wu, Department of Pathology and Immunology, Texas Children's Microbiome Center, Baylor College of Medicine, Houston, TX, United States
 Qinglong Wu
 Nagendra P. Shah*