 Maria Isabel Arce1*
 Daniel von Schiller2
 Mia M. Bengtsson3
 Christian Hinze3
 Hoseung Jung4
 Ricardo J. Eloy Alves5†
 Tim Urich3
 Gabriel Singer1
- 1Leibniz-Institute of Freshwater Ecology and Inland Fisheries, Berlin, Germany
- 2Department of Plant Biology and Ecology, University of the Basque Country (UPV/EHU), Bilbao, Spain
- 3Institute of Microbiology, University of Greifswald, Greifswald, Germany
- 4Integrative Research Institute on Transformations of Human-Environment Systems (IRI THESys), Humboldt University of Berlin, Berlin, Germany
- 5Department of Ecogenomics and Systems Biology, University of Vienna, Vienna, Austria
Non-flow periods in fluvial ecosystems are a global phenomenon. Streambed drying and rewetting by sporadic rainfalls could drive considerable changes in the microbial communities that govern stream nitrogen (N) availability at different temporal and spatial scales. We performed a microcosm-based experiment to investigate how dry period duration (DPD) (0, 3, 6, and 9 weeks) and magnitude of sporadic rewetting by rainfall (0, 4, and 21 mm applied at end of dry period) affected stocks of N in riverbed sediments, ammonia-oxidizing bacteria (AOB) and archaea (AOA) and rates of ammonia oxidation (AO), and emissions of nitrous oxide (N2O) to the atmosphere. While ammonium (NH4+) pool size decreased, nitrate (NO3−) pool size increased in sediments with progressive drying. Concomitantly, the relative and absolute abundance of AOB and, especially, AOA (assessed by 16S rRNA gene sequencing and quantitative PCR of ammonia monooxygenase genes) increased, despite an apparent decrease of AO rates with drying. An increase of N2O emissions occurred at early drying before substantially dropping until the end of the experiment. Strong rainfall of 21 mm increased AO rates and NH4+ in sediments, whereas modest rainfall of 4 mm triggered a notable increase of N2O fluxes. Interestingly, such responses were detected only after 6 and 9 weeks of drying. Our results demonstrate that progressive drying drives considerable changes in in-stream N cycling and the associated nitrifying microbial communities, and that sporadic rainfall can modulate these effects. Our findings are particularly relevant for N processing and transport in rivers with alternating dry and wet phases – a hydrological scenario expected to become more important in the future.
Introduction
Through channel-routing and aquatic processes, fluvial networks have the capacity to modify global pools of nitrogen (N). Unless evading to the atmosphere as dinitrogen gas (N2), nitrous monoxide (NO) or nitrous oxide (N2O) (Beaulieu et al., 2011), N that enters rivers mostly in headwaters (Peterson et al., 2001) is delivered to downstream and coastal ecosystems in organic or remineralized form (Hall et al., 2009; Howarth et al., 2011). Part of N processing in fluvial networks is associated to rivers that cease to flow and become dry at some point in space and time (Datry et al., 2014; von Schiller et al., 2017). These intermittent rivers are a natural phenomenon at the global scale, with more than 50% of the global fluvial network estimated to be intermittent (Datry et al., 2014). This proportion is expected to rise in the face of increasing water demand and global warming (Palmer et al., 2008; Hoerling et al., 2012).
Dry riverbeds have historically been considered biogeochemically inert in comparison with running waters, but recent research identifies these habitats as considerable areas of nutrient transformation (e.g., Steward et al., 2012; Gómez-Gener et al., 2015). This is a critical aspect, because how N is processed during the dry phase strongly influences ecosystem functioning and N export upon flow recovery. Evidently, understanding dry-phase processing of N can help us better understand the role of intermittent rivers in N budgets at larger spatial scales.
Sediment drying exerts a strong impact on sediment biogeochemical processes and resultant pools of N in intermittent rivers (Austin and Strauss, 2011; Gómez et al., 2012; Arce et al., 2014). Overall, a significant number of microbial cells are destroyed during drying due to osmotic shock (van Gestel et al., 1991), affecting microbial communities and the biogeochemical pathways they control (Placella and Firestone, 2013; Pohlon et al., 2013). Yet, recent research indicates that nutrient processing in intermittent rivers can be maintained during dry periods to a certain extent by the activity of microbial communities adapted to low moisture conditions (Zoppini and Marxsen, 2010; Timoner et al., 2012; Pohlon et al., 2013).
Based on redox requirements, changes in the relative importance of N cycling pathways are expected to occur during the transition from wet to dry conditions. As sediment becomes exposed to the atmosphere during drying, the expanding oxic conditions reduce anaerobic processes such as denitrification (Austin and Strauss, 2011; Gómez et al., 2012) and favor aerobic pathways such as nitrification (Gómez et al., 2017).
Nitrification is a crucial process in N cycling bridging reduced with oxidized forms of dissolved inorganic N (Merbt et al., 2015). In the first step of nitrification, i.e., AO, ammonium (NH4+) is first oxidized to nitrite (NO2−) by two different groups of microorganisms, ammonia- oxidizing archaea (AOA) and bacteria (AOB) and it is considered the rate-limiting step of nitrification crucial for the subsequent oxidation to nitrate (NO3−) which is mediated by NOB. Recently, the complete NH4+ oxidation to NO3−, termed COMAMMOX, has been identified in two species of the NOB genus Nitrospira (Daims et al., 2015; van Kessel et al., 2015).
Two studies (Gómez et al., 2012; Merbt et al., 2016) found higher AO rates and NO3− concentrations in dry riverbed habitats compared to wet sediments suggesting that oxygenation associated to loss of water promotes this process. Such NO3− enrichment tends to be more pronounced in surface sediments from where built-up NO3− is prone to be easily flushed upon flow resumption. The observed build-up of NO3− in dry riverbeds repeatedly led to the suggestion that dry period duration (DPD) may have implications for NO3− export upon flow recovery in intermittent rivers (Gómez et al., 2012; Arce et al., 2014; Merbt et al., 2016). Few studies have combined approaches at the levels of microbial cell identities and ecosystem processes in intermittent rivers, so that links between the abundance of nitrifying microbes and N-processing rates are still unclear, especially in response to temporary water stress (Prosser, 2012). Some research results were even conflicting. For instance, although Merbt et al. (2016) found the higher AO rates in dry riverbeds, they detected no major changes in the abundance of amoA genes (encoding amoA) of both AOA and AOB across the different habitats (i.e., running waters, isolated pools and dry streambeds) of a drying Mediterranean stream. Archaea and bacteria have distinct cell structure and physiology, including osmo-adaptation strategies (Zillig, 1991; Roeßler and Müller, 2001); thus, differential functional responses to stream drying could be expected.
The no-flow period in an intermittent river does not imply a completely dry riverbed where biogeochemical processes pause and life is absent. In soils and river sediments during periods of water limitation, rewetting due to rainfall can trigger rapid biogeochemical responses (Austin et al., 2004; Schwinning et al., 2004; Collins et al., 2008) such as AO (Arce et al., 2014), N mineralization (McIntyre et al., 2009) and trace gas evasion such as N2O (Gallo et al., 2014). Such rain events, albeit sporadic, have the potential to buffer the impacts of drying on N transformation rates by temporarily stimulating bacterial growth rates (Lovieno and Bååth, 2008). For example, Placella and Firestone (2013) detected rapid transcriptional response of AOA, AOB, and NOB after months of desiccation-induced inactivation. Upon rewetting, release of intracellular osmolytes even from live cells can take place (Halverson et al., 2000; Schimel et al., 2007) and contribute to increase nutrient availability enabling “hot moments” of intense biogeochemical cycling (Borken and Matzner, 2009). Any internal increase in nutrients accompanied to vertical mobilization in response to rainfall may be especially crucial to feed microbial activity in deep layers where direct nutrient inputs (e.g., atmospheric N deposition) can be limited.
Furthermore, studies in soils have demonstrated that the magnitude of a water pulse (i.e., more or less water amount) controls microbial activity in the short-term (Fierer and Schimel, 2002; Shi and Marschner, 2014; Yu et al., 2014).
Combined molecular and biogeochemical information for the dynamics of AO during progressive drying in intermittent rivers is still scarce and no evidence exists about how the duration of the preceding dry period controls the nitrifying response to a water pulse. Understanding the responses of microbial community structure and functioning associated with changes in sediment moisture will contribute to increase our knowledge about the N cycle of intermittent rivers during non-flow periods, which are the less studied phases of these ecosystems (von Schiller et al., 2017).
We performed a microcosm-based experiment to assess (i) how progressive drying affects the abundance of nitrifying microbes and their functioning as well as N fluxes (dissolved and gaseous) across the sediment vertical profile and to the atmosphere, (ii) how rainfall events of various magnitude can affect such features, and (iii) whether any effects of rainfall depend on the duration of the preceding dry period. To this end, we combined molecular and biogeochemical approaches to study nitrification. We measured the relative abundance (RA) of AO functional groups through 16S rRNA gene sequencing and quantified amoA genes for AOA and AOB by quantitative PCR (qPCR). Further, we measured rates of AO. We predicted that the abundance and activity of AO microbes and consequently the sediment NO3− concentration would increase from wet to dry conditions, and that this increase would be more pronounced in the more air-exposed surface sediments. We further predicted that rainfall would exert changes on AO rates and N fluxes with a magnitude proportional to the size of the water pulse.
Materials and Methods
Sediment Collection and Microcosm Set Up
We collected sediments from a 100-m reach of the lowland intermittent river Fredersdorfer Mühlenfließ (Brandenburg, Germany, 52°29′09.7″N, 13°42′39.4″E) in June 2015 before surface water disappearance. The occurrence of hydrological droughts in this river during 1–2 summer months has been documented since the 1990’s (Mey, 2003) and is mainly controlled by reductions of groundwater levels (Nützmann and Mey, 2007). Surface river water concentrations (mean ± SD, n = 3 replicates across the stream reach) at the time of sediment collection were 230 ± 25 μg N L−1 for NO3−, 360 ± 50 μg N L−1 for NH4+, 31 ± 2 μg P L−1 for soluble reactive phosphorus (orthophosphate, PO43−), 10.6 ± 1.5 mg C L−1 for dissolved organic carbon (DOC) and 0.53 ± 0.21 mg N L−1 for dissolved organic nitrogen (DON; see next section for the different methods used). The collected sediments were mainly composed of sand (90–96% larger than 63 μm, according to Ad hoc-AG Boden 2005) and had an organic matter content (based on loss on ignition) of 8 ± 2%.
Submerged sediments were collected in three separate sampling points of the chosen stream reach at 0–15 cm depth. Sediments from each point were sieved (mesh size 4 mm), homogenized, individually kept in plastic tanks and transported to the lab in dark and cold conditions. Unfiltered surface stream water was collected in parallel. In the lab, 30 transparent acrylic glass columns (length 30 cm, diameter 5.5 cm) with gas-tight septa caps were filled with 15 cm of sediment. Surface stream water was added to all cores to completely wet them with a 2–3 cm water column. The filled microcosms were placed in a dark climate chamber at a constant temperature of 25°C. After acclimation to laboratory conditions for 1 week, three replicate microcosms were destructively analyzed for surface water and sediment characteristics representing the initial wet conditions (t = 0 weeks). Such initial conditions were thought to simulate a pool environment, the hydrological habitat that typically appears during the fragmentation phase following flow cessation and before complete surface drying (Steward et al., 2012). At the same time, overlaying water in the remaining 27 microcosms was drained through the sediment via silicone tubes at the bottom, and microcosms were then left to dry in the climate chamber for up to 9 weeks. Microcosms were grouped into 3 sets of 9 in a way that all of sediments from the three sampling sites were represented in each set. Each set was dedicated to one of three sampling occasions (3, 6, and 9 weeks of drying). Over the entire experiment (i.e., 9 weeks), the columns were weighed every 2 days to register changes in water content (WC) (Supplementary Figure S1).
Dissolved oxygen (DO) in the interstitial part of the sediment was monitored at two sediment depths (1.5 and 8 cm) over the entire experiment using non-invasive optode technology (Microx 4, PreSens, Regensburg, Germany). For this, DO sensors (circular, diameter 0.5 cm) were attached to the inner walls of the set of microcosms dedicated to the 9-week dry period. These measurements thus represented DO dynamics during the entire experiment without any rewetting (Supplementary Figure S1).
As a second experimental approach besides DPD, we used artificial rainwater to generate water pulses of two different magnitudes and after ending each dry period (3, 6, and 9 weeks). We selected rainfalls magnitudes (RM) of 4 mm (modest rainfall) and 21 mm (intense rainfall) based on historical monthly data of precipitation during the summer season in the region of the stream used for sediment collection. Water was applied by spraying it on sediments. A third treatment of 0 mm (no rainfall) served as a control (Supplementary Figure S1). This resulted in a two-factorial experimental design: DPD × RM with n = 3 for each design cell. We used available information of the chemical composition of rainfall in Northeast Germany (CarboZALF meteorological station). Briefly, chemical composition averaged 1.4 mg L−1 of Cl−, 2.2 mg L−1 of SO42−, 0.4 mg L−1 of K+, and 1.6 mg L−1 of Ca2+. Although natural rain contains inorganic N, the artificial rainwater was not amended with N to avoid potential interferences with N available in the sediment. In no case, rainfall events generated an overlaying water column.
Water Sampling and Analysis
At initial conditions (t = 0 weeks), surface water samples from the surface of microcosms were collected with plastic syringes and filtered through combusted (4 h, 450°C) Whatman GF/F filters (Maidstone, England, United Kingdom; 0.7 μm pore size) mounted in syringe filter holders. Water was analyzed for NO3− and NH4+ following the cadmium reduction (Wood et al., 1967) and Salicylate (Reardon et al., 1966) method using a segmented flow analyser (Skalar San++, Breda, Netherlands), for PO43− following the molybdate method (Murphy and Riley, 1962) on a Shimadzu (Kyoto, Japan) UV-1800 spectrophotometer, and for DON using size exclusion liquid chromatography equipped with an organic nitrogen detection system (LC-OCD-OND, DOC-Labor Huber, Karlsruhe, Germany). Concentrations of NO3−, NH4+ and DON in surface water from the wet microcosms (t = 0 weeks) were (mean ± SD, n = 3) 0.43 ± 0.16, 1.64 ± 0.20 and 0.77 ± 0.14 mg N L−1, respectively. The PO43− concentration was 36 ± 2 μg P L−1.
Sediment Sampling and Analysis
During initial wet conditions (t = 0 weeks) and after t = 3, 6, and 9 weeks, sediments were destructively removed from a microcosm subset. After 3, 6, and 9 weeks, sediment sampling was done 24 h after rainfall treatments were applied. The sediments in surface (0–3 cm) and deep (3–15 cm) layers were separately collected and homogenized in plastic bags. Previous trials with the used microcosms in the climate chamber served us to decide these two layers are different enough on the base of drying and oxygenation over the 9 weeks of the total experimental time. Immediately after collection, subsamples (0.5 mL) for DNA extraction were stored in sterile plastic vials under liquid N and subsequently at −80°C. The remaining sediment samples were analyzed after collection for WC, concentration of N species and AO rates.
WC was determined after drying sediment sub-samples at 60°C for 72 h and expressed as % water (g/g). The concentrations of NO3−, NH4+ and DON in the sediments were measured after extraction with 2M KCl 1:5 (175 rpm, 25°C, 1 h). The resulting filtrates were analyzed as described above for water samples. Sediment contents were expressed as μg or mg of N per g of dry sediment (DM) after correcting by the WC% in the sediment.
We measured the AO rate as a proxy of nitrifying activity following the acetylene (C2H2) gas inhibition method at a partial pressure of 100 Pa (Offre et al., 2009). This method allows measurements in sediments under actual humidity, which is not possible when using other methods that involve the addition of the inhibitor in a water solution (Merbt et al., 2016). For each sediment replicate, two (125 mL) flasks fitted with septa caps were incubated with 10 g of sediments for 72 h, with or without C2H2 (inhibited/control flasks). Every 24 h, all bottles were opened for 30 min to ensure continuous aerobic conditions for nitrification and C2H2 was added again to the blocked flasks. At the end of the incubation, sediment NH4+ concentration was analyzed after conducting a KCl extraction as previously described. The quantity of NH4+ oxidized was calculated as the difference in extractable NH4+ between the inhibited and control flasks after incubation and was expressed as μg NH4-N g−1 DM h−1 (Levi et al., 2013).
DNA Extraction, 16S rRNA Gene Sequencing and Analysis of Nitrifying Functional Groups
Total community DNA was extracted from 0.25-g sediment samples using the PowerSoil DNA isolation kit (MoBio Laboratories, CA, United States) according to the manufacturer’s instructions with exception of a bead beating step performed in a MP FastPrep-24 5G High Speed Homogenizer (MP Biomedical, CA, United States) during 30 s at a speed of 5 m/s. The extracted DNA was quantified using a NanoDrop spectrophotometer (measured concentrations ranged between 20 and 63 ng μl−1), expressed in ng per g of DM and used as a proxy of microbial biomass. DNA was amplified with primer pairs targeting the V4 region of the 16S ribosomal RNA (rRNA) gene for archaea and bacteria (515F and 806R; Walters et al., 2016). PCR amplification, Illumina MiSeq library preparation and paired-end sequencing (V3 chemistry) was carried out by LGC Genomics (Berlin, Germany). Sequence reads (clipped from adaptor and primer sequence remains) were processed using the DADA2 package in R (version 1.2.0) (Callahan et al., 2016; R Core Team, 2017). Chimeric sequences were removed using the removeBimeraDenovo function. The resulting amplicon sequence variants (ASVs, analogous to operational taxonomic units) were used to construct a table containing RAs of ASVs across all samples. ASVs were taxonomically classified with BlastN using a lowest common ancestor approach (Lanzén et al., 2012) on a manually curated version (silvamod) of the Silva database (Pruesse et al., 2007, SSURef version 123) with MEGAN parameters (top percent 2, minimum bit score 155, minimum number of hits 1). Nitrifier ASVs were identified and classified via a 2-step approach. First, AOA and AOB were identified among the Silva-classified ASVs based on the taxonomical affiliation of the 16S rRNA genes to known nitrifying genera, families and orders in the Silva database. Second, we further critically verified the affiliation to nitrifier groups of identified ASVs from step 1 by Blast against the Genbank 16S rRNA and nr databases. Despite not being the focus of our experiment, we tentatively identified COMAMMOX and NOB groups and provided data about their RA. Especially for AOB and NOB the classification with Silva resulted in too broad groups with not all identified sequences being from characterized AOB or NOB, respectively. For the verification of these potential nitrifier ASVs in step 2 we used different thresholds of sequence identity to reference sequences. Threshold for acceptance of ASVs as AOB were 93% sequence identity to known nitrifying species of the Nitrosomonadaceae (Betaproteobacteria) family and Nitrosococcus genus (Gammaproteobacteria) in the Genbank 16S rRNA database. For species and candidatus species of the AOA the threshold was 92% sequence identity and for NOB (Nitrospirae) the sequence identity threshold was 90%. The differing identity thresholds reflect the phylogenetic breadth of the target groups, i.e., family (Nitrosomonadaceae), order (Nitrososphaerales and Nitrosopumilales) and class (Nitrospirae). ASVs related to COMAMMOX were identified by BlastN against the 16S rRNA gene sequences of Nitrospira inopinata and Nitrospira nitrosa based on at least 98% sequence identity. Results were expressed as RAs of each group with respect to the whole community based on 16S rRNA. Illumina MiSeq 16S rRNA amplicon sequence data was submitted to the NCBI Short Read Archive under the accession number SRP137655.
Quantitative PCR of AOB amoA genes was performed with primer pair amoA-1F/amoA-2R (Rotthauwe et al., 1997). AOA amoA genes were amplified with primers CamoA-19F (5′-ATGGTCTGGYTWAGACG-3′; Tourna et al., 2008; Pester et al., 2012) and TamoA-629R (5′-GCCATCCATCKRTANGTCCA-3′; designed in this study), respectively. All qPCR amplifications were performed with two DNA template concentrations (2 and 5 ng μl−1) in duplicate 15 μL reactions each on an Analytik Jena qTower 2.2 cycler, as follows: 10 μL 2× innuMIX qPCR Master Mix (Analytik Jena), 10 μM of each primer for archaeal and bacterial amoA, respectively. Cycling conditions were as follows: 2 min initial denaturing step at 95°C, followed by 35 cycles of 30 s denaturing at 95°C, 30 s joint annealing-extension at 55°C for archaea and for bacteria, 45 s elongation at 72°C and 5 min final extension at 72°C, for archaea or bacteria, respectively. A plate read was included at the end of each cycle for 10 s at 72°C for archaea and for bacteria. Quantification of archaeal and bacterial amoA genes was based on serial dilutions (10–107 gene copies) of M13-PCR products containing the amoA gene of Nitrososphaera viennensis or Nitrosospira multiformis ATCC25196, respectively. qPCR efficiencies for archaeal and bacterial amoA gene assays were 90–97% and 91–92%, respectively. Trend lines of duplicate standards from all assays had slope and Y-intercept values ranging from −3.39 to −3.6 and 31.35 to 39.6, respectively, all with R2 values ≥ 0.99, and with sensitivity down to 10 copies per reaction. Specific amplification was confirmed by melting curve analysis and standard 1% agarose gel electrophoresis after qPCR. Results were expressed as number of gene copies per g DM.
N2O Fluxes Sampling and Analysis
Fluxes of N2O from sediments to atmosphere were measured at shorter intervals during the entire drying period, and during the rainfall events. Using the 9 microcosms set up for the longest DPD (i.e., 9-week) (Supplementary Figure S1), N2O dynamics were monitored at multiple times: before microcosm drainage (t = −3 days), immediately after drainage (t = 0 days) and several days after drainage and further desiccation (t = 3, 6, 9, 14, 20, 30, 42, 54, and 65 days). On each sampling day, these microcosms were capped gas-tight, and gasses were sampled from the headspace of the columns several times over 5 h. In addition, in the different sets of microcosms for the different DPDs, gas sampling was conducted during the simulated rainfall events over 5 monitoring phases: before (t = −2 h), immediately after (t = 0 h) and further 3 times after the water pulse (t = 2, 6, and 24 h). At the end of each monitoring phase, the caps of the microcosms were removed and the air inside was allowed to equilibrate with the atmosphere. The collected 20-mL gas samples were stored in 10-mL pre-evacuated glass vials with inert butyl rubber crimp caps (Machery-Nagel GmbH & Co., Berlin, Germany). N2O was analyzed on a gas chromatograph fitted with an electron capture detector (ECD; Shimadzu, Tokyo, Japan).
Gas fluxes were calculated via linear regression of gas concentrations versus time elapsed since the microcosm cap placement. We used microcosm headspace volume to compute the mass of N2O as μg of N at each sampling time and divided by the sediment area. We also considered the WC in sediments for correcting concentrations of gasses dissolved in water (Tiedje, 1982). Gas fluxes were expressed as μg N2O-N m−2 h−1. Finally, the cumulative fluxes over 24 h following the rainfall event (μg N2O-N m−2) were calculated by integrating the fluxes over time from the water pulse to the end of the 24-h period.
Statistical Analysis
We addressed the effect of the DPD on the studied variables by comparing values under 0 mm (i.e., dry sediments) across the different times (t = 3, 6, and 9 weeks) with those measured under initial, wet conditions (i.e., t = 0 weeks) using Student’s t-test assuming unequal variances. We followed Holm’s method to adjust P-values in order to avoid type II error inflation due to excessive P-value adjustment. To examine the influence of RM (0, 4, and 21 mm) and whether it was controlled by the DPD (t = 3, 6, and 9 weeks), we then used mixed effects models that included RM and DPD as fixed factors and their interaction. Variance heterogeneity was common, and we thus used a flexible variance structure (Zuur et al., 2009). Mixed effects models were run in parallel for the two sediment layers to ease interpretation. When the interaction term RM x DPD was significant, specific differences among rainfall treatments fixed by time were also evaluated through Holm’s post hoc test. In the case of cumulative N2O fluxes, when significant RM effects were found, we explored differences in the fluxes before, immediately after and following the rainfall using similar mixed effect models. In this case, we included time (i.e., monitoring times = −2, 0, 2, 6, and 24 h), RM (0, 4 and 21 mm) and the interaction time × RM as factors within the model. Mixed models were used to adequately account for repeated measurements. After P-value adjustments results were considered significant at P ≤ 0.05. When necessary, simple linear regressions were used to assess the relationship between some variables and R2 and P-values were provided. A non-metric multidimensional scaling (nMDS) was also made using all OTUs as input data (all prokaryotes) to visualize potential linkages of AOA and AOB with certain chemical and biogeochemical variables. All the statistical analyses were performed using packages ‘nlme’ and ‘lsmeans’ in R version 3.2.21. Multivariate analyses on microbial community data were carried out with functions of ‘vegan’ (Oksanen et al., 2016).
Results
Sediment WC and DO
Over the course of the 9-week-experiment and without any simulated rainfall, the WC in the microcosms gradually decreased from ∼30% at initial wet conditions to ∼10% at the end of the experiment (Figure 1A). In parallel, DO in the sediments increased with desiccation converging to saturation at ∼9 mg L−1 after 20 days and then remaining stable throughout the rest of the experiment (Figure 1A). The surface layer dried faster (Figures 1B,C) and showed a faster increase in DO (Figure 1A) than the deep layer. When comparing WC% in the dry microcosms (i.e., 0 mm selected) with wet conditions (t = 0 weeks), we found significant differences only after 9 weeks in surface sediments (Figure 1B) and after 6 and 9 weeks in deep sediments (Figure 1C) (t-test, P < 0.001). In both cases, there were significant differences between RM regardless of the DPD (Table 1), with WC% generally higher under 21 mm rainfall.
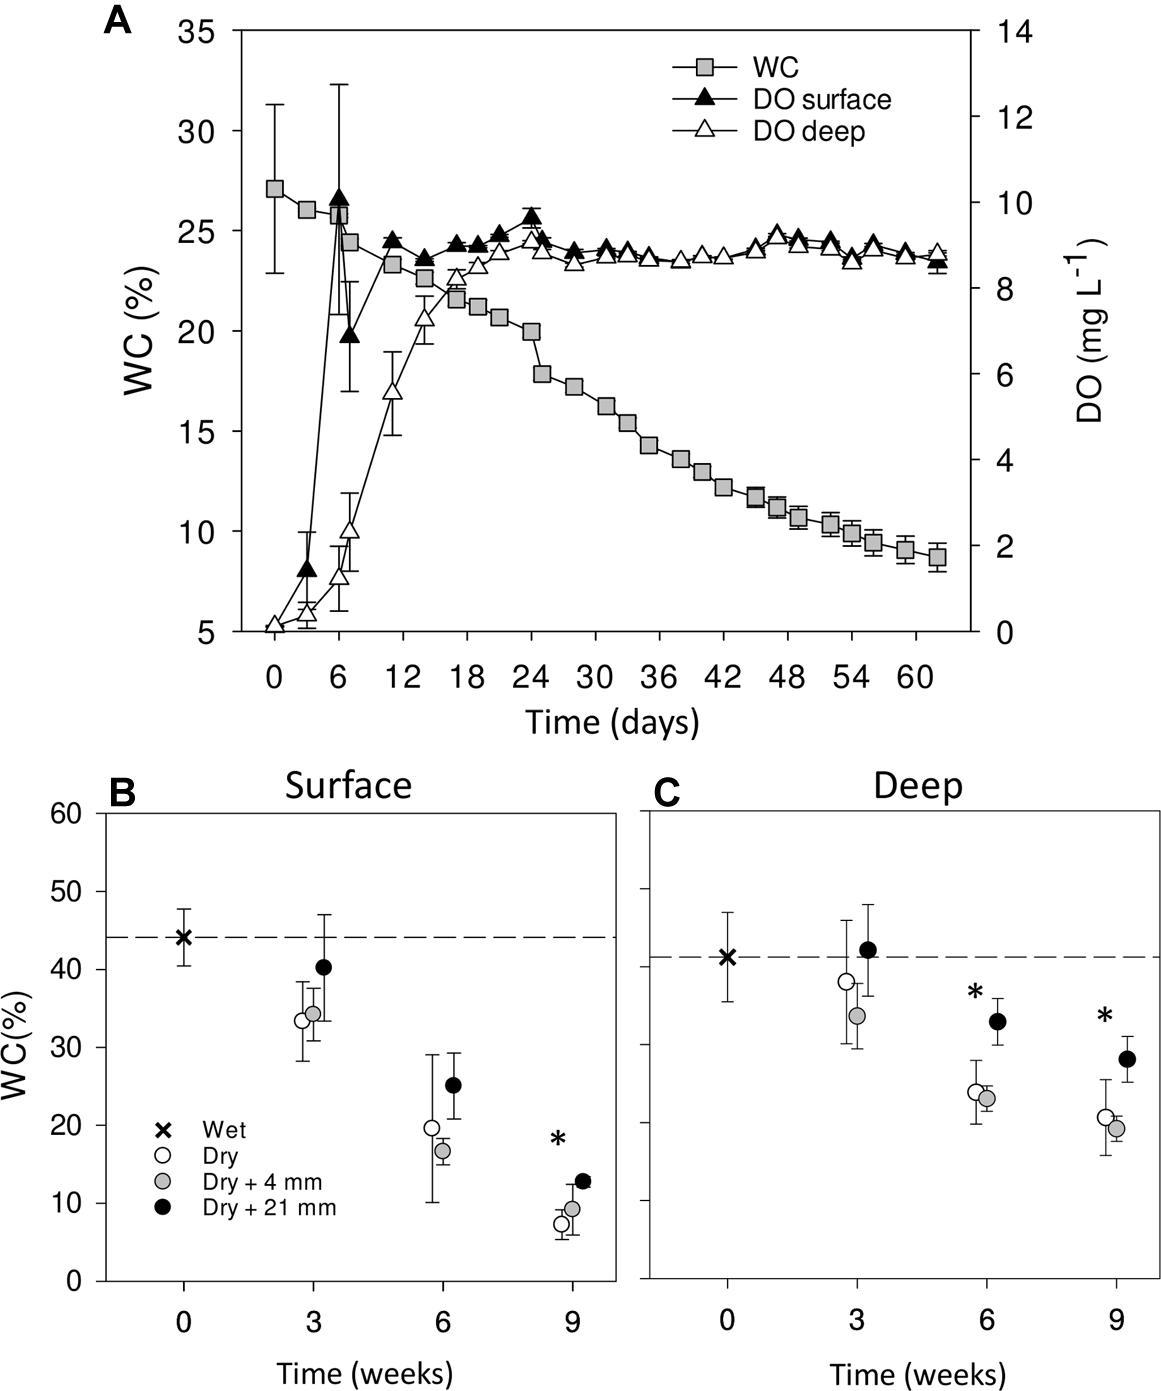
FIGURE 1. Mean (±SE, n = 9) WC and DO concentration in surface and deep sediments monitored over the entire experiment in dry microcosms with no rainfall application (A). Mean WC (±SE, n = 3) in surface (B) and deep (C) sediments during initial conditions (0 weeks) and after the different RMs for each DPD. Asterisks (∗) denote significant (P ≤ 0.05) differences to initial wet conditions after Student’s t-test followed by Holm’s correction for multiple comparisons. The dashed line represents the initial conditions as a reference for a better comparison.
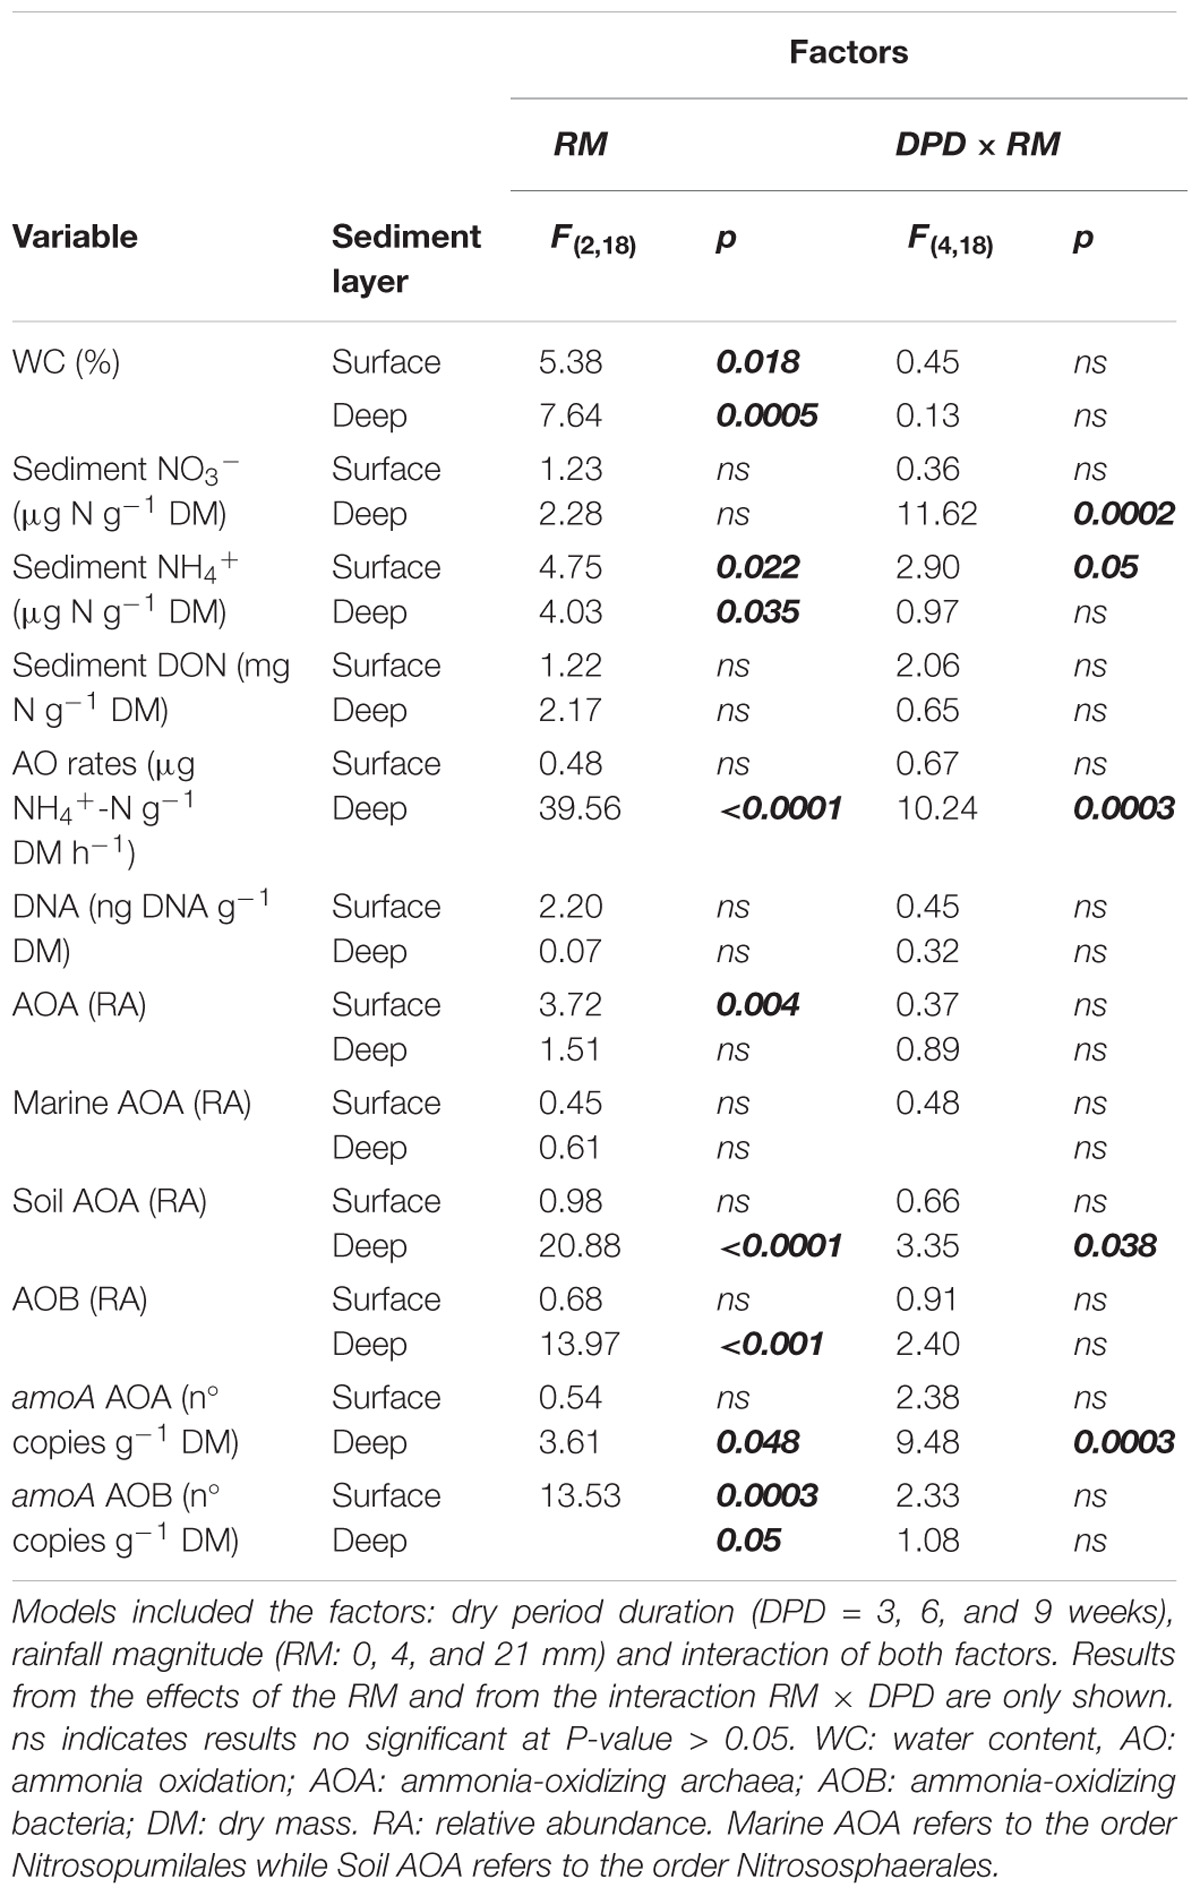
TABLE 1. Statistical results from the mixed effects models of the variables measured per sediment layer.
Sediment N Content
Compared with wet conditions (t = 0 weeks), NO3− in both sediment layers significantly increased in the microcosms subjected to dry conditions (i.e., 0 mm selected; t-test, P ≤ 0.05) (Figures 2A,B). Without any rainfall, the average NO3− in dry surface sediments increased 350 times over 6 weeks of drying (up to 113 μg N g−1 DM, SD = 42, n = 3) and 440 times over 9 weeks (up to 141 μg N g−1 DM, SD = 28, n = 3) (Figure 2A). The increase was not as high in deep sediments, where NO3− reached 50 μg N g−1 DM (SD = 23, n = 3) after 9 weeks of drying without any rainfall (Figure 2B). In contrast to NO3−, NH4+ in dry sediments decreased significantly (t-test, P ≤ 0.05) after 3 weeks of drying and then remained low as drying progressed (Figures 2C,D). This NH4+ decrease was more pronounced in deep (Figure 2D) than in surface (Figure 2C) layers, mainly due to higher initial NH4+. Concentrations of DON also dropped with drying, yet variation was large and the observed differences with respect to initial wet conditions in the dry microcosms were not significant (t-test, P > 0.05) (Figures 2E,F).
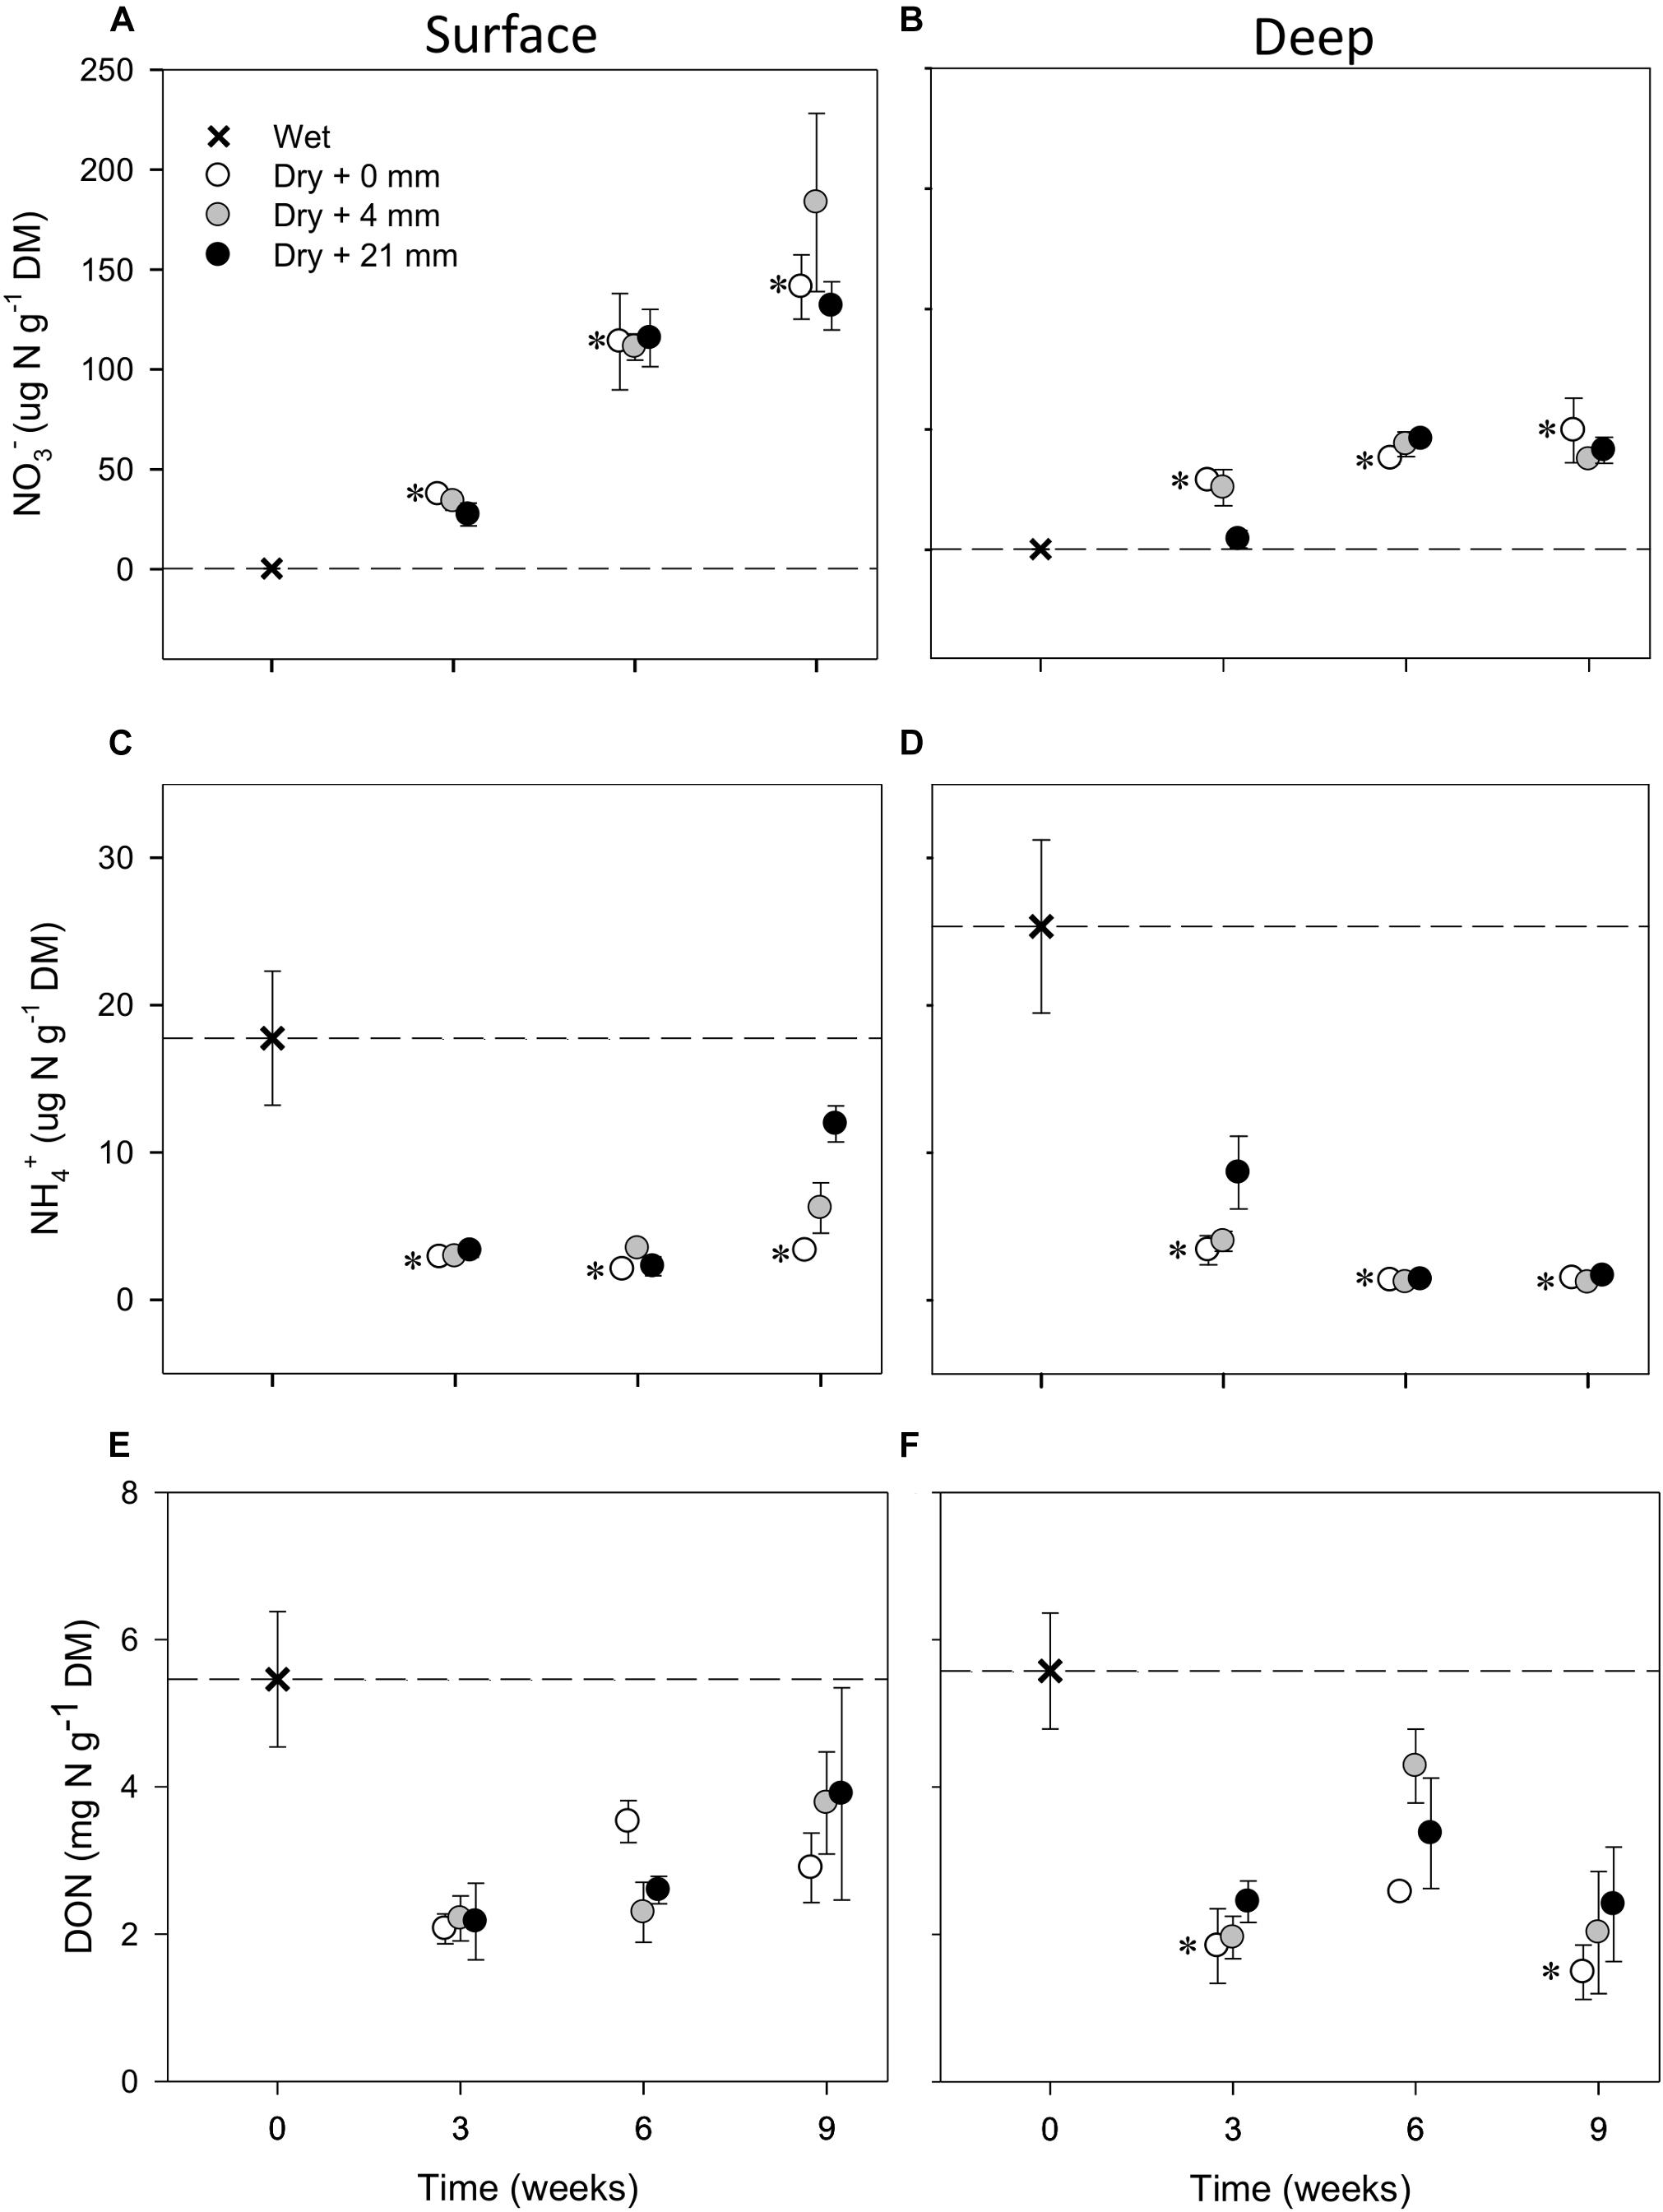
FIGURE 2. Mean (±SE, n = 3) concentration of NO3−, NH4+, and DON in surface (A,C,E, respectively) and deep sediments (B,D,F, respectively) during initial conditions (i.e., 0 weeks) and after the different RMs for each DPD. Asterisks (∗) denote significant (P ≤ 0.05) differences to initial wet conditions after Student’s t-test followed by Holm’s correction for multiple comparisons. The dashed line represents the initial conditions as a reference for a better comparison.
The mixed effects models detected significant differences among levels of RM in deep sediments in the case of NO3− and in both layers in the case of NH4+ (Table 1). Yet, in some instances, RM effects depended on the DPD as indicated by the significance of the interaction term (Table 1). In the case of NO3−, concentrations in deep sediments after 3 weeks were significantly lower under 21 mm of rainfall (t-test, P ≤ 0.05) (Figure 2B). In the case of NH4+, significantly higher concentrations were observed in surface sediments subjected to 4 mm and 21 mm of rainfall (t-test, P ≤ 0.05) after 6 and 9 weeks, respectively (Figure 2C).
AO Rates
Compared with wet conditions (t = 0 weeks), AO rates in surface sediments tended to decrease with drying (i.e., 0 mm selected), yet significant differences were found only after 3 and 9 weeks (t-test, P ≤ 0.05, Figure 3A). In contrast, in deep sediments AO rates remained relatively stable as drying progressed (Figure 3B). RM effects on AO rates were found only in deep sediments, albeit mediated by DPD (Table 1). In this case, the highest AO rates were observed after 6 weeks of drying under 21 mm rainfall (Figure 3B).
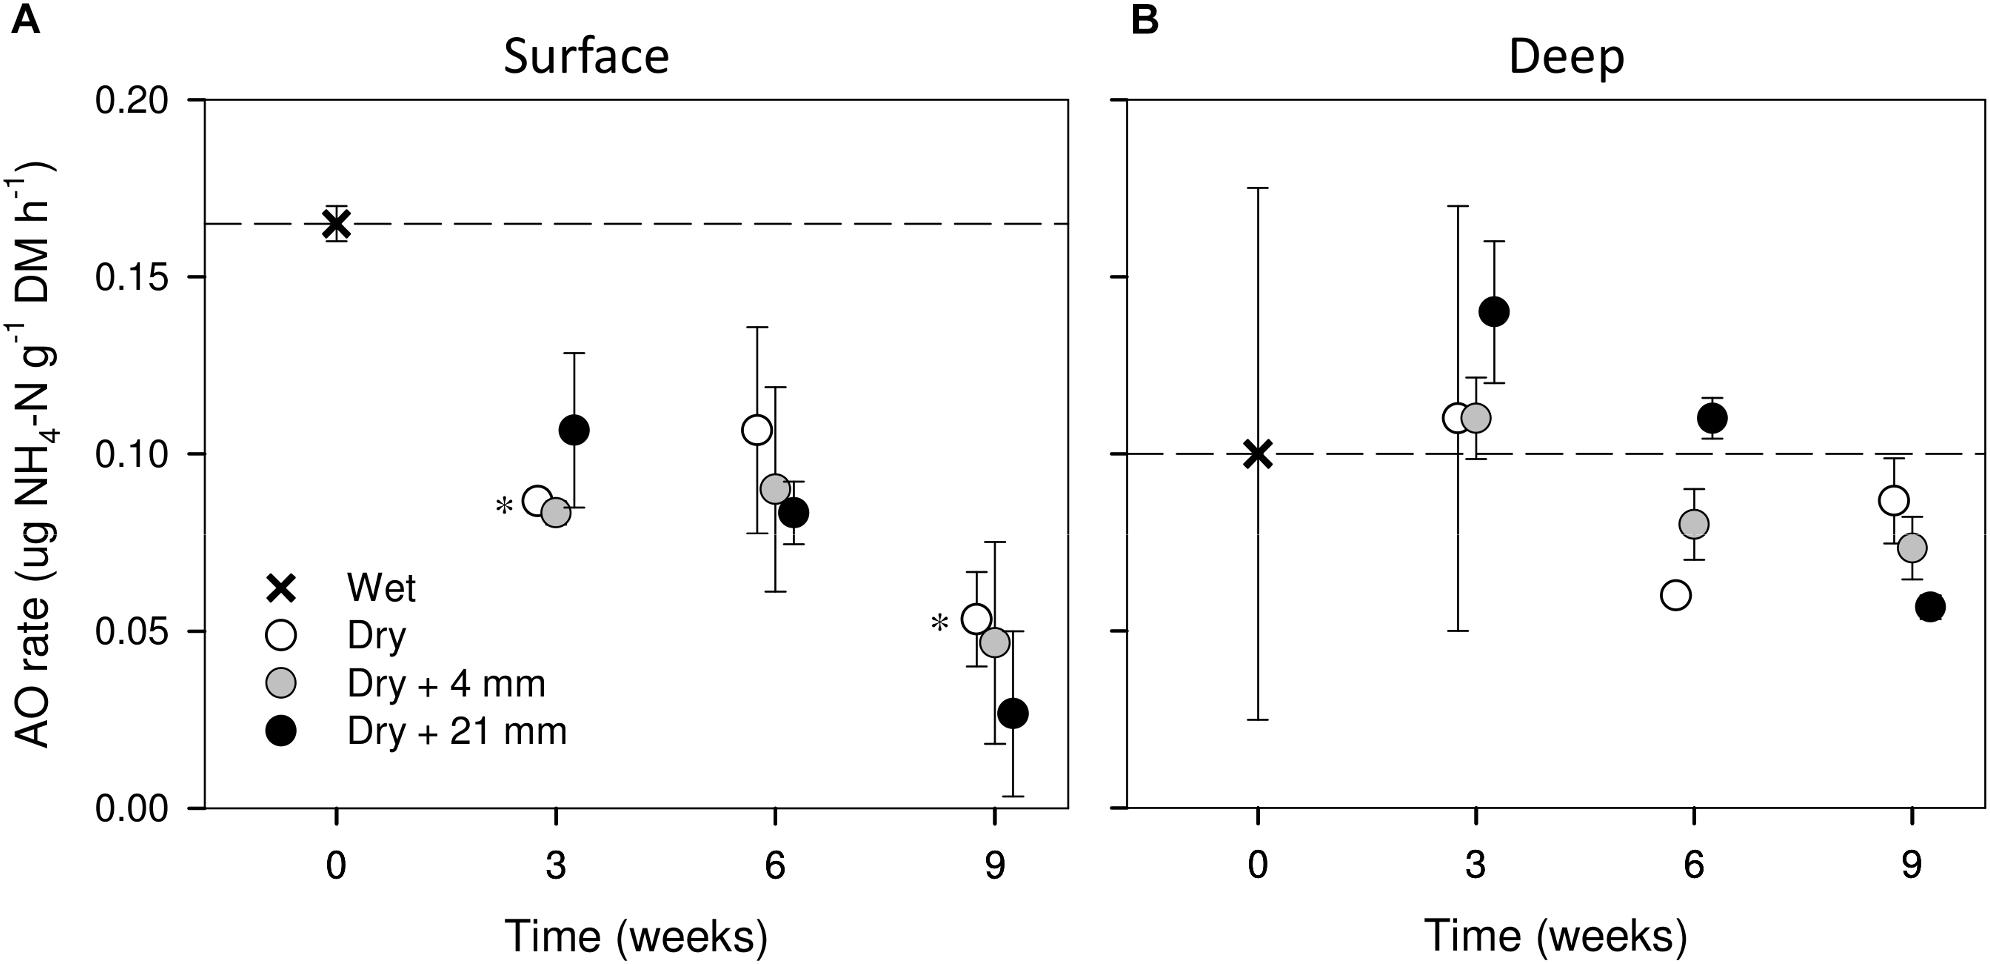
FIGURE 3. AO rates in surface (A) and deep (B) sediments during initial conditions (0 weeks) and after the different RMs for each DPD. Asterisks (∗) denote significant (P ≤ 0.05) differences to initial wet conditions after Student’s t-test followed by Holm’s correction for multiple comparisons. Values are means ± SE (n = 3). The dashed line represents the initial conditions as a reference for a better comparison.
Microbial Biomass, Community Dynamics, and Relative Abundance of Nitrifying Functional Groups
DNA content in sediments, as a proxy for microbial biomass, ranged from 9 to 27 and 9 to 29 μg g−1 DM in surface and deep layers, respectively (Supplementary Figure S2). We found no significant differences in DNA content from wet (t = 0 weeks) to drying conditions (i.e., 0 mm; t-test, P > 0.05) and between RM treatments (Table 1).
We detected the ammonia oxidizers: AOA, AOB and we potentially identified COMAMMOX as well as NOB affiliated with the Nitrospirales. For a better comparative description of RA, in Figures 4A,B we grouped the results of RA of all nitrifying microbial groups, determined by analysis of 16S rRNA gene amplicon datasets concerning wet (t = 0 weeks) and dry conditions (i.e., 0 mm selected). We observed that none of the studied groups was highly abundant, as none of them accounted for more than 1% of the total microbiota 16S rRNA genes (Figures 4A,B). Among all nitrifying microbes, NOB were potentially the most abundant group from wet to drying conditions after 6 weeks, especially in surface sediments (Figures 4A,B), later, in both sediment layers AOA strongly increased after 9 weeks of drying (Figures 4A,B) exhibiting significant differences with wet conditions as drying progressed (t-test, P ≤ 0.05). AOB and the tentative group proposed as COMAMMOX stayed relatively constant throughout the experiment in both sediment layers (Figures 4A,B).
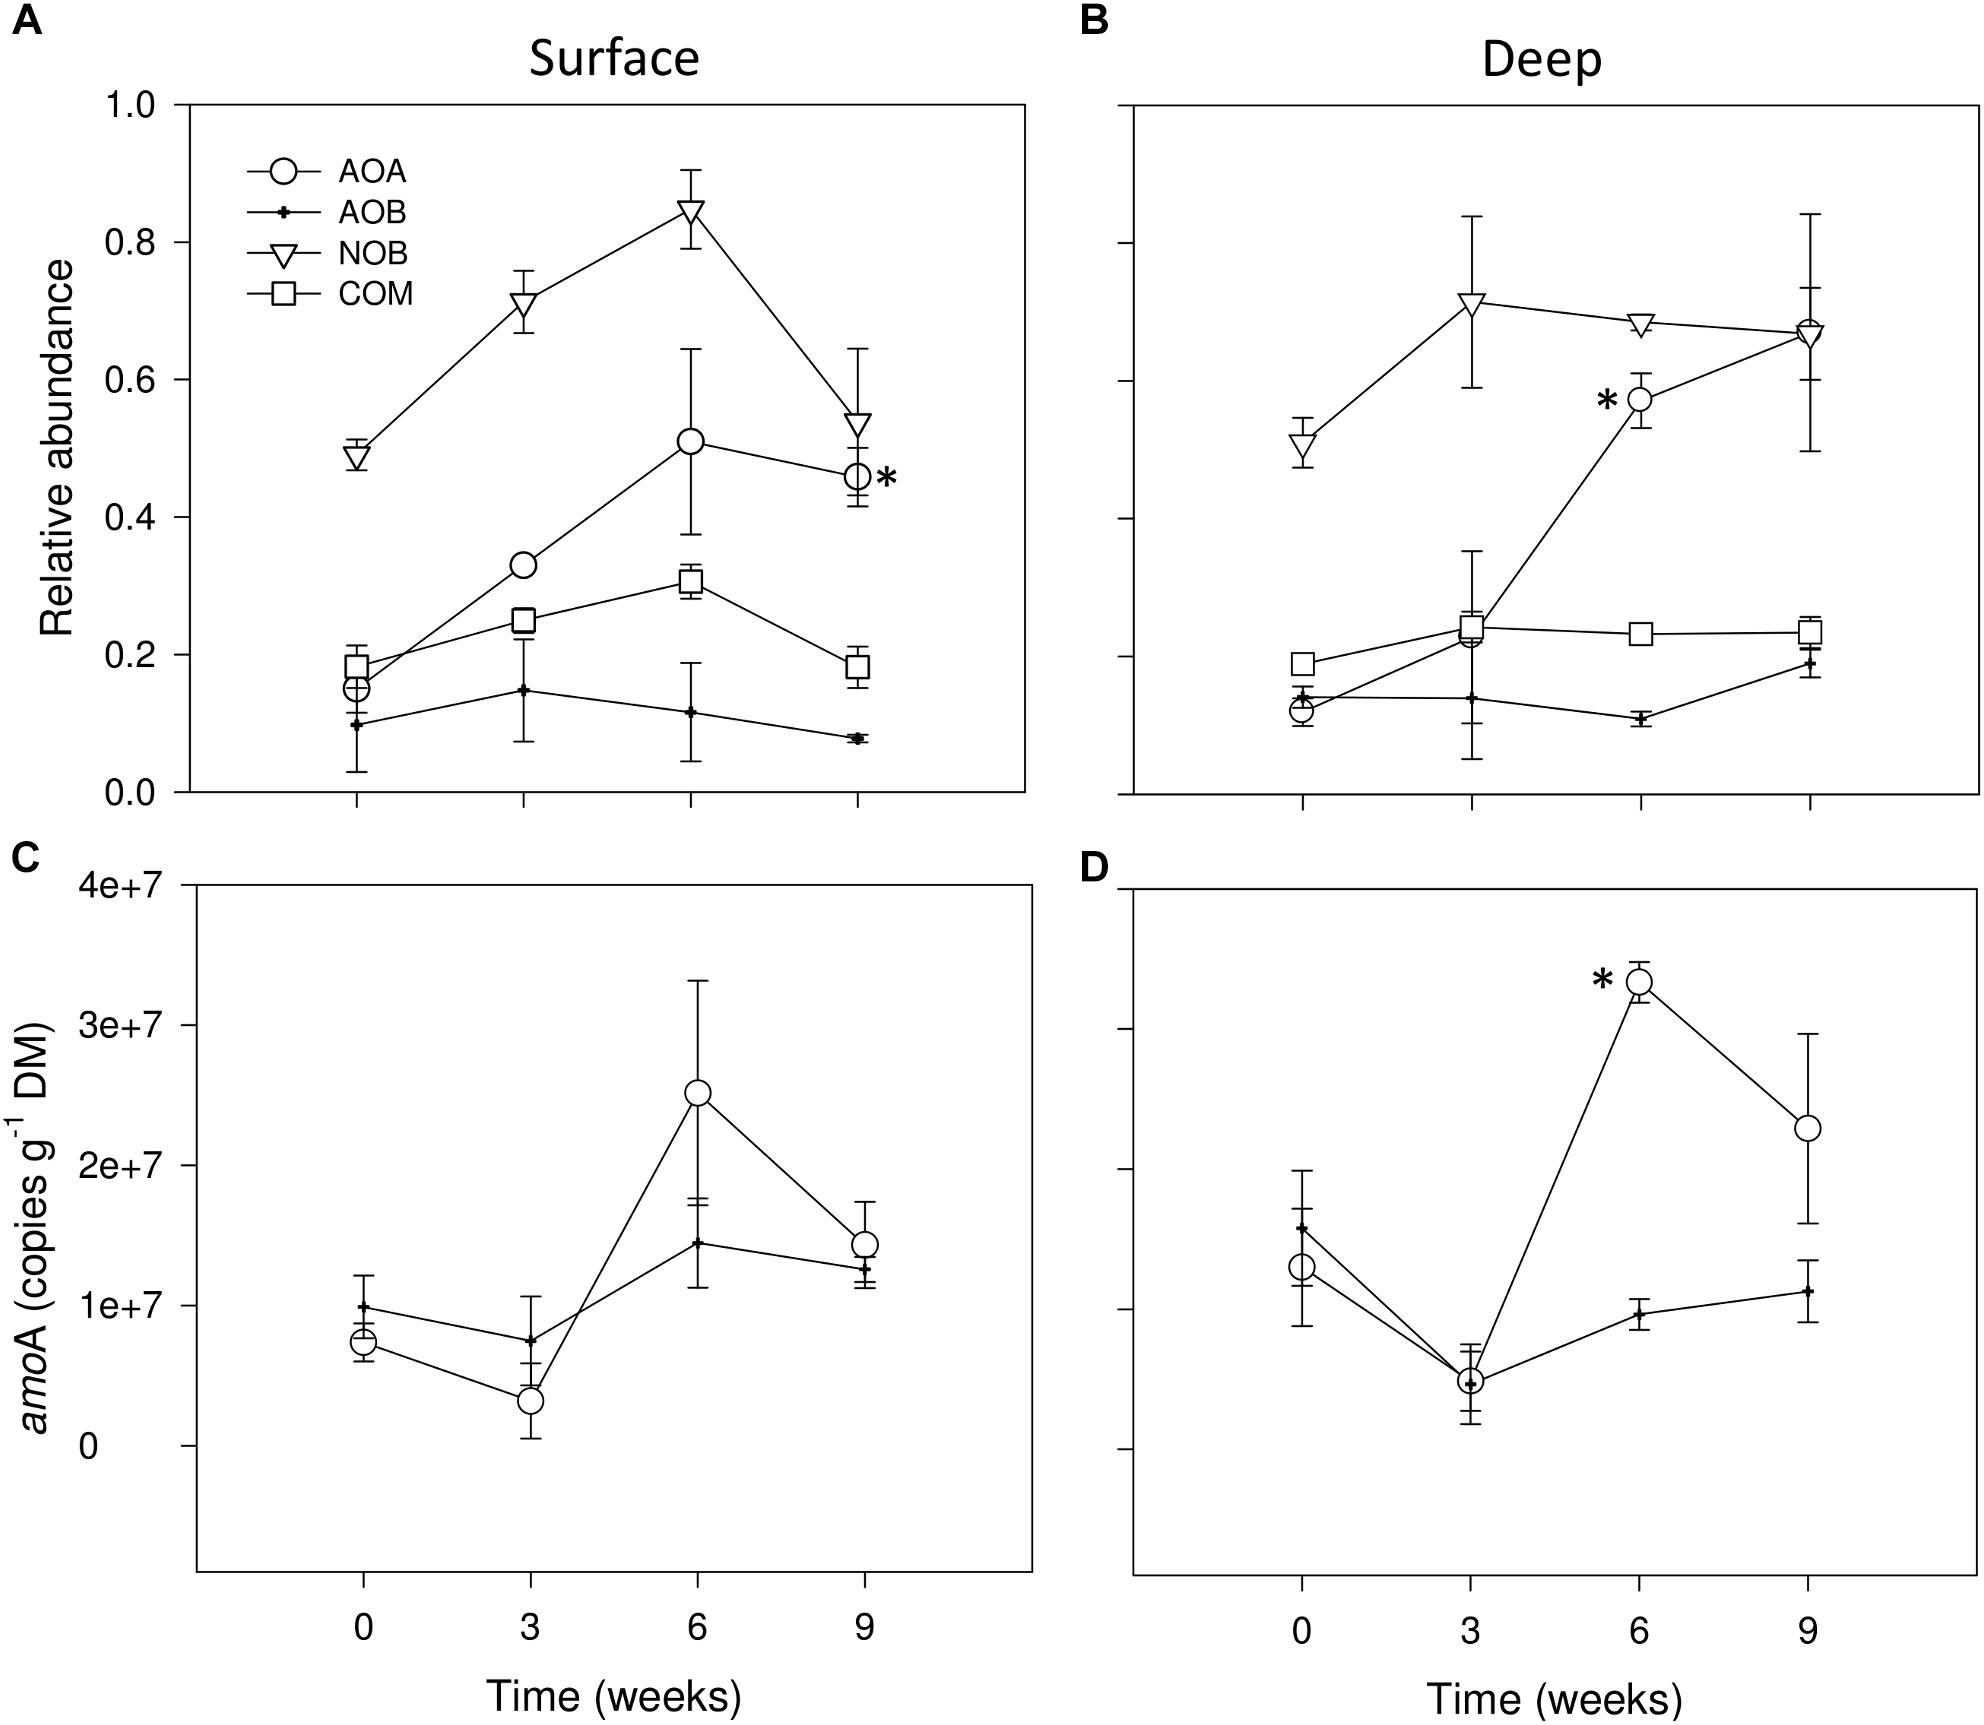
FIGURE 4. Relative abundances (%) of 16S rRNA sequence tags from AOA, AOB, NOB and COMAMMOX groups in surface (A) and deep sediments (B) during initial conditions (i.e., 0 weeks) and after the different DPDs with no rainfall (i.e., 0 mm selected). Number of copies of amoA genes for AOA and AOB in surface (C) and deep sediments (D) during initial conditions and after the different DPDs with no rainfall. Asterisks (∗) denote significant (P ≤ 0.05) differences to initial wet conditions after Student’s t-test followed by Holm’s correction for multiple comparisons. Values are means ± SE (n = 3).
The mixed effects models (Table 1) showed significant differences between RM for AOA in surface sediments, for AOB in deep sediments regardless the DPD. No consistent pattern based on RM effects was found for these groups, yet higher RAs seemed to appear under 0 and 4 mm (Supplementary Figure S3).
The overall community dynamics of prokaryotes in the sediments, visualized by nMDS analyses (Figure 5), revealed a temporal trend from 0 to 9 weeks, presumably driven by WC. Communities at 6 and 9 weeks were associated to higher RA of AOA and sediment NO3−, while communities at 0 and 3 weeks were associated to higher AO rates, higher NH4− and WC (Figure 5). RA of AOB varied independently of this temporal trend.
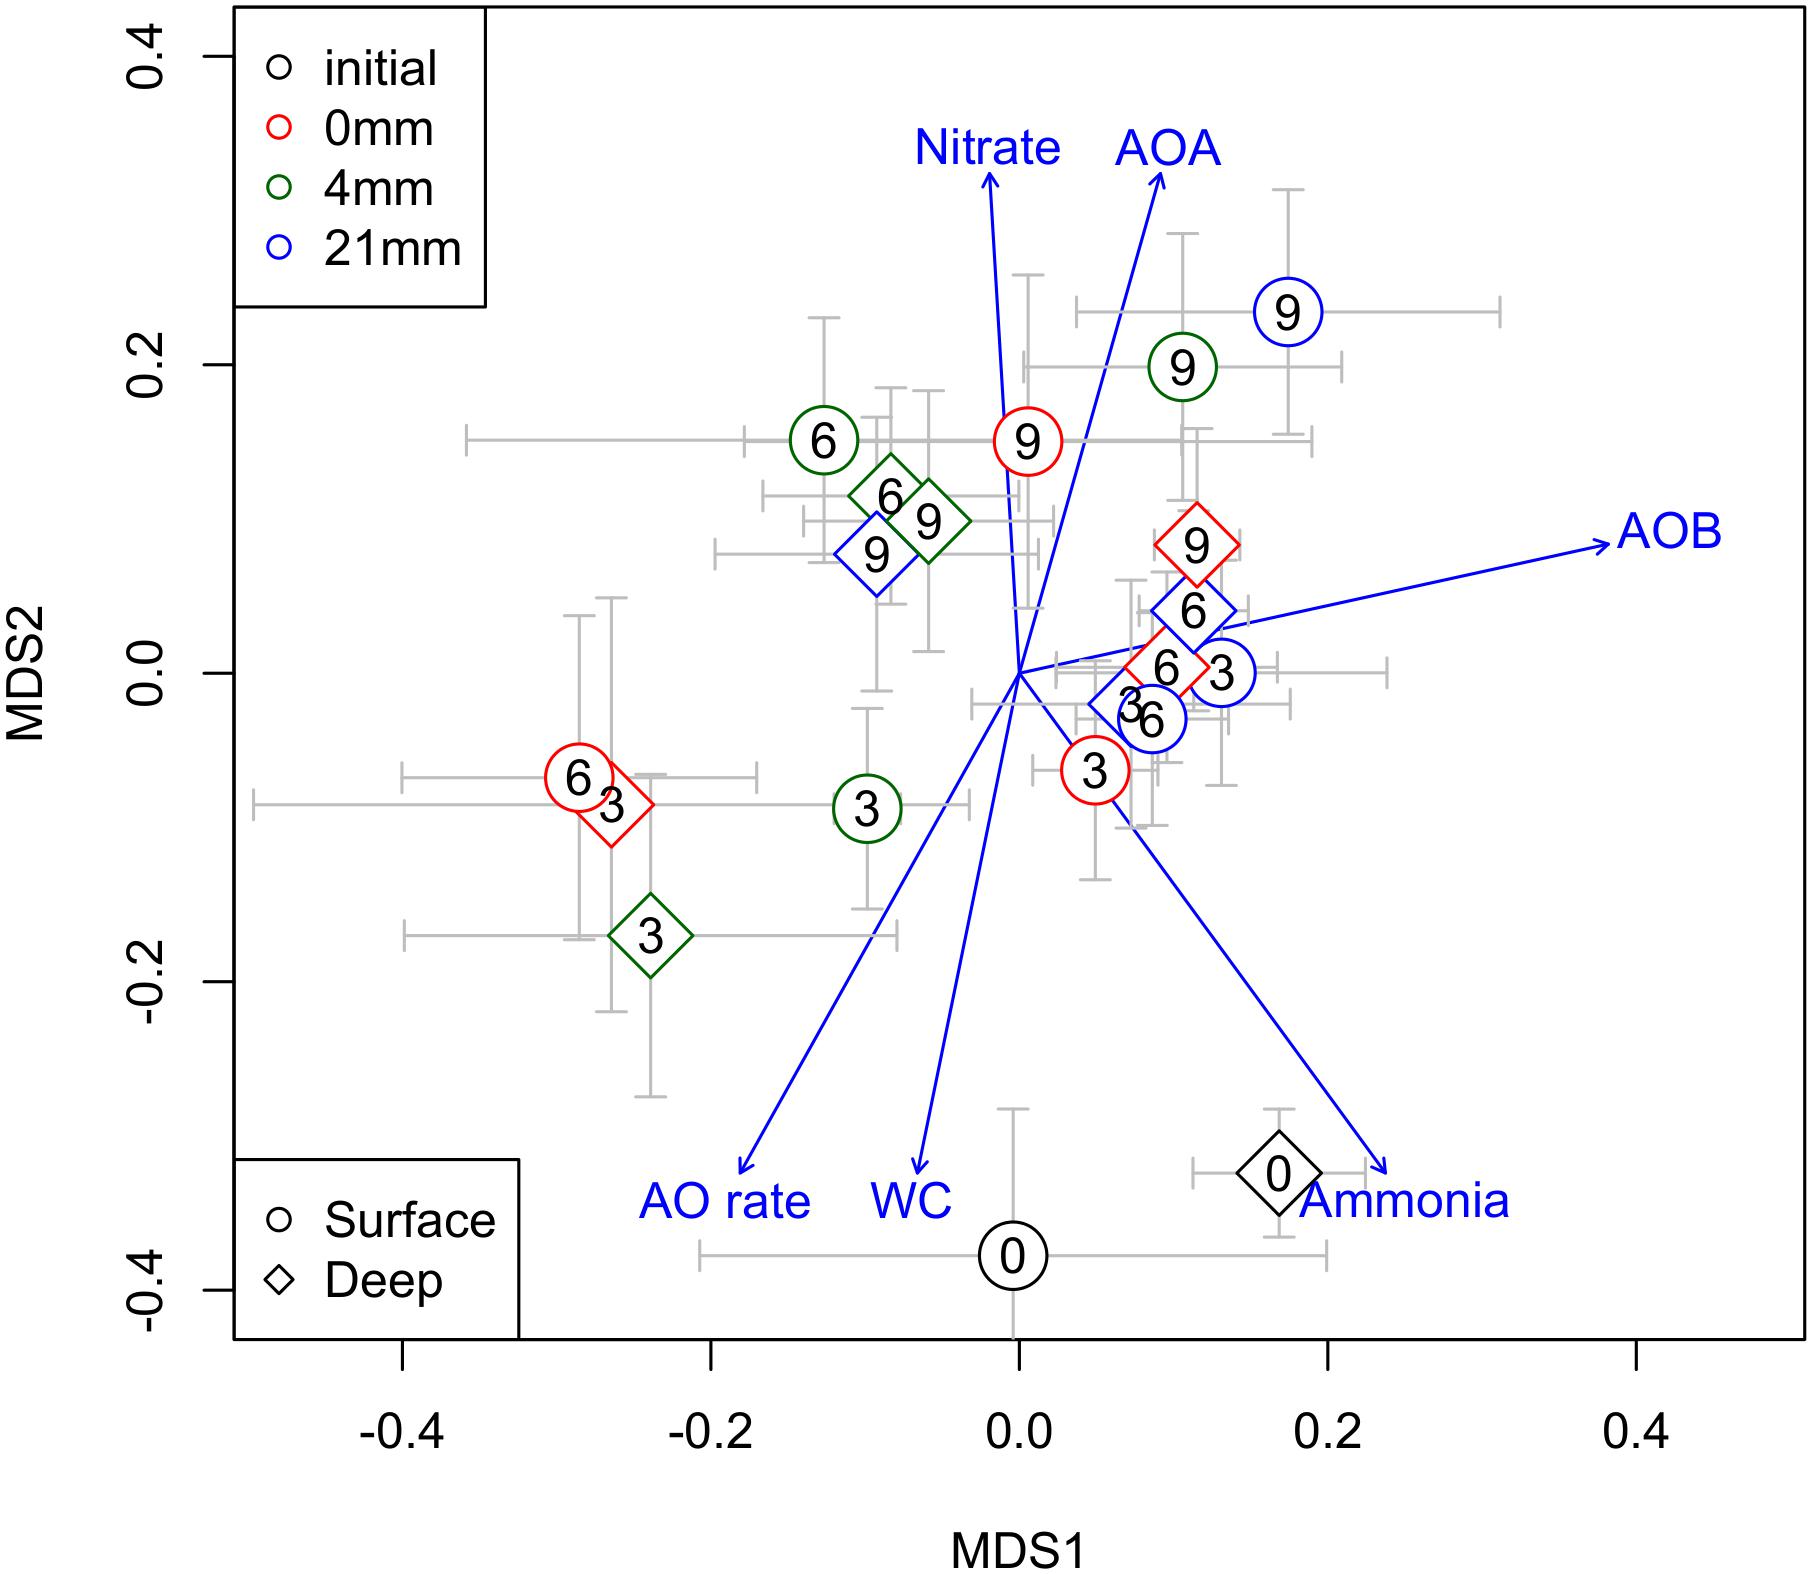
FIGURE 5. Non-metric multidimensional scaling ordination (nMDS) of all prokaryotes community showing AOA and AOB (RA) in relation to a suit of chemical and biogeochemical variables of sediments (WC%, nitrate and ammonia concentration and AO rates) potentially associated across the different DPDs. The different DPDs (t = 0, 3, 6, and 9 weeks) are reflected by numbers within the symbols. Different symbols shapes and colors denote different sediment layers sediments and different RMs, respectively.
In the case of the AOA orders, the candidate order Nitrosopumilales (formerly known as “marine group I”) dominated over the Nitrososphaerales (formerly known as “soil group,” Kerou et al., 2016) during the whole experiment (Supplementary Figure S4). Despite a lack of statistical significance, the RA of Nitrosopumilales tended to increase with time in the dry sediments compared with wet conditions, especially in deep layers. Similarly, Nitrososphaerales exhibited a modest increase after 9 weeks of drying in surface sediments, while in deep sediments, no marked changes compared with wet conditions were detected in any case (Supplementary Figure S4). An effect of RM was only found for Nitrososphaerales and only in deep sediments after 6 weeks of drying (Table 1). In this case, the microcosms subjected to the intermediate RM of 4 mm showed the lowest abundances, while those that remained dry (i.e., 0 mm) and subjected to 21 mm had similar values (Supplementary Figure S4).
Abundance of AOB and AOA amoA Genes
During wet conditions, the abundances of the functional marker genes amoA of AOA and AOB were similar, with average values of 7.4 106 and 9.8 106g−1 DM, respectively, in surface sediments (Figure 4C) and of 1.3 107 and 1.6 107, respectively, in deep sediments (Figure 4D). Overall, the number of amoA copies in the dry microcosms (i.e., 0 mm selected) after 3 weeks tended to drop when compared with wet conditions (t = 0 weeks), especially in deep sediments (Figure 4D). After 6 weeks, however, AOA amoA copies in both sediment layers tended to increase to values significantly higher than in wet conditions only in deep sediments (t-test, P ≤ 0.05) (Figure 4D). Later, a slight decrease of amoA copies for AOA was detected after 9 weeks of desiccation while for AOB it remained stable (Figures 4C,D).
As indicated by the significant interaction term (Table 1), RM had a significant effect in the case of AOA amoA in deep sediments only after 6 weeks, when rainfall of 0 mm (i.e., dry microcosms) generated the highest values (Supplementary Figure S3). In the case of AOB amoA, significant differences between RM were found in both sediment layers (Table 1). While in surface sediments, amoA copy numbers were higher under 0 mm for most dry periods (Supplementary Figure S3), in deep sediments, this treatment tended to support the lowest values (Supplementary Figure S3).
N2O Fluxes
Over the 9-week experiment, we observed considerable N2O fluxes from microcosms without rainfall (Figure 6A). From the beginning (t = −3 days) and over the first 2 weeks of drying, there was an increase in N2O fluxes, especially after 11 days of desiccation, when fluxes peaked at 182.5 μg N2O-N m−2 h−1. Following this peak, N2O fluxes decreased to low values until the end of the experiment (Figure 6A).
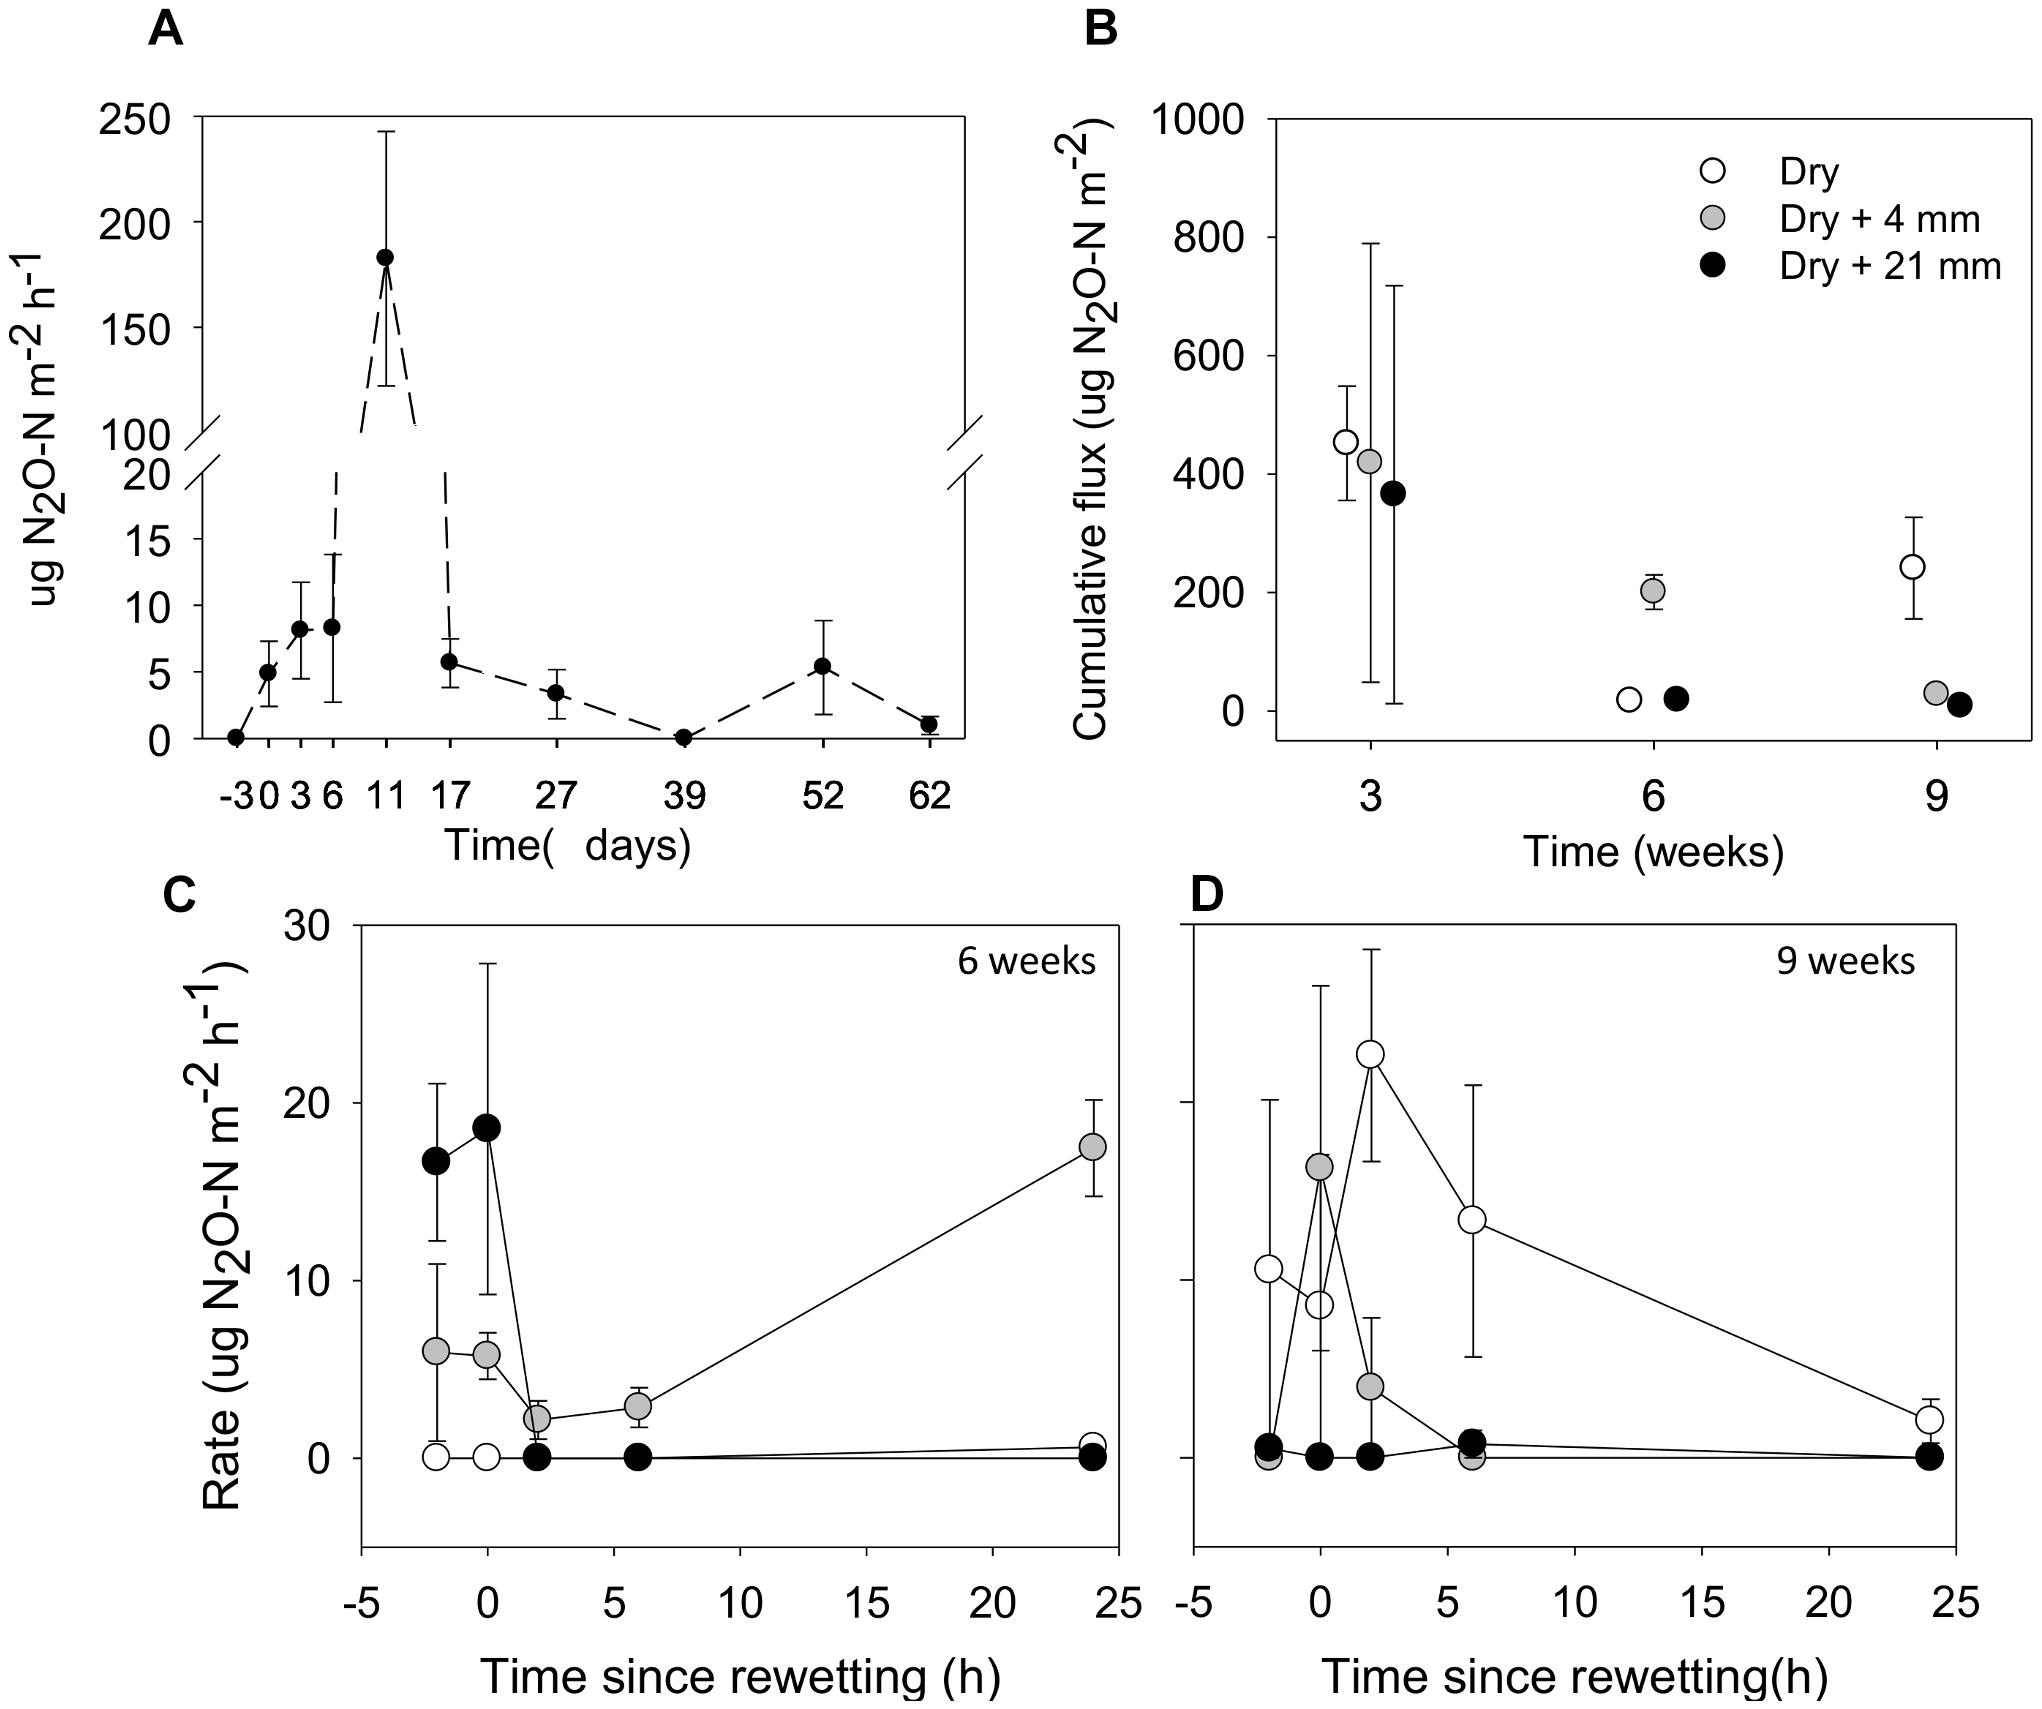
FIGURE 6. (A) Fluxes of N2O from sediments before microcosms drainage (microcosms with a surface water column; t = –3 days), immediately after drainage (t = 0 days) and several times after drainage and drying. (B) Accumulated fluxes of N2O following 24 h under the effects of variable RMs (0, 4, and 21 mm) after the different DPDs. (C) and (D) Fluxes of N2O before (t = –2 h), immediately (t = 0 h) and following rainfall events (t = 2, 6, and 24 h) after 6 and 9 weeks of drying, respectively. Values are means ± SE (n = 3).
The cumulative flux of N2O estimated over 24 h tended to decrease as drying progressed in microcosms without rainfall (i.e., 0 mm selected) (Figure 6B). The mixed effects model indicated that cumulative fluxes responded to RM depending on the DPD (interaction term F(4,18) = 8.61, P < 0.001). Significant differences among levels of RM were only detected after 6 and 9 weeks of drying. After 6 weeks, the highest cumulative flux was observed after the rainfall of 4 mm (mean = 200.7 μg N2O-N m−2), while after 9 weeks, it was detected under 0 mm (mean = 241.3 μg N2O-N m−2; t-test, P ≤ 0.05, Figure 6B).
In addition, after 6 and 9 weeks we thoroughly examined the development of N2O fluxes before and following rainfall events (Figures 6C,D). In both cases the mixed effects models showed significant differences among levels of RM on N2O fluxes depending on the monitoring phase (t = −2, 0, 2, 6, and 24 h), as indicated by the significant interaction (after 6 weeks, F(2,39) = 9.30, P < 0.001; after 9 weeks, F(2,39) = 5.32, P < 0.01). We must note the considerable variability of N2O-N fluxes that existed among treatments before rainfall (t = −2 h), specially marked after 6 weeks of drying (Figure 6C). After 6 weeks, the N2O fluxes under 0 mm rainfall remained consistently close to zero during the 24-h monitoring period. In contrast, N2O fluxes following the water pulses (4 and 21 mm) changed considerably over time (Figure 6C). For example, when compared with t = −2 h (mean = 16.65 μg N2O-N m−2 h−1, n = 3), we observed a notable reduction of the average N2O fluxes at t = 2 h after the water pulse (0 μg N2O-N m−2h−1) (Figure 6C). However, the rainfall of 4 mm almost doubled the average N2O flux at t = 24 h (mean = 17.45 μg N2O-N m−2h−1, n = 3) when compared with t = −2 h (mean = 8.95 μg N2O-N m−2h−1, n = 3) (Figure 6C). After 9 weeks, we found that when compared with 0 mm, average N2O fluxes following water pulses were generally low, especially under the rainfall of 21 mm (Figure 6D). Although increased N2O fluxes immediately after the rainfall of 4 mm (t = 0 h) were measured when compared with t = −2 h (mean from 0 to 16.28 μg N2O-N m−2h−1, n = 3), fluxes gradually fell down to zero and remained as such until the end of the monitoring period (Figure 6D).
Discussion
Our experiment revealed considerable variations in sediment N processing and microbial communities of AOA and AOB in response to drying duration. Our prediction of increased nitrifying microbes’ abundance and activity with desiccation and differential response in surface and deep sediment layers was only partially supported by the results. As expected, we observed that the abundance of AO groups, in particular of AOA, generally increased with desiccation. Furthermore, drying progression led to an increase in sediment NO3− and this increase was stronger in surface sediments. Contrary to our expectations, however, the AO rates did not increase with desiccation, but rather decreased (in surface sediments) or remained stable (deep sediments) over the course of the experiment.
The predicted effects of rainfall on the base of their magnitude – that is, stronger changes at higher RM - were only observed for AO rates and sediment NH4+ in surface and in deep sediments, respectively. Interestingly, this response depended on the duration of the preceding dry period, appearing only after 6 and 9 weeks in the case of AO rates and NH4+, respectively. N2O flux also fluctuated in association to sediment drying, and, surprisingly, its variable reaction to RM disagreed with our initial expectations. However, in terms of microbial communities, no marked changes were visible for sediment microbial communities of AOA and AOB after 24 h of our simulated rainfall.
Abundance of Ammonia-Oxidizing Functional Groups in Response to Drying and Rainfall
All known major microbial groups involved in the AO pathway were identified over the whole experiment, including the newly described COMAMMOX group (Daims et al., 2015; van Kessel et al., 2015) that we tentatively identified and separated from NOB. We applied two independent, complementary approaches for the identification of nitrifying microbes, (1) 16S rRNA genes and (2) amoA gene qPCR. While the former yielded information on the taxonomy of nitrifying microbes, it only provided RA data, that are difficult, if not impossible, to relate to process measurements (Alves et al., 2013). qPCR-assays of amoA for two of the groups (AOA and AOB) yielded functional gene copy numbers per gram of DM, values that can be directly related to rates of AO.
For AOA and AOB, the temporal trend of abundance examined through both 16S rRNA genes and amoA genes provided similar information, i.e., an increasing trend of AOA abundance, while AOB abundance remained rather constant if compared with wet conditions. However, this congruence was supported only for AOA groups which related positively with amoA genes (Simple Linear Regression, R2 = 0.45, P < 0.01, n = 24), highlighting the difficulty of establish robust linkages between community structure and functioning features, such as the abundance of a particular functional gene (Prosser, 2012). We acknowledge the limitations of using DNA-based community profiling, as DNA is a relatively stable molecule and can remain in the environment even after the death of the cells harboring it. Therefore, temporal trends should be interpreted with caution, as there may be a significantly delayed drop in detection of dying organisms’ genes upon environmental change.
The relatively constant amount of DNA in the sediments during the whole experiment may support this fact. Likewise, the observed disagreement between AO rates measurements and microbes abundance is not simply caused by differences in the amount of extracted DNA. On the other hand, our findings enable a comparison of the RA of nitrifying groups in 16S rRNA gene amplicons with the AO process measurements.
According to our initial expectations, AOA exhibited an increasing trend until 6 weeks of drying in both surface and deep sediments. Furthermore, AOA amoA abundance also increased until 6 weeks of drying. Although we must be cautious when interpreting our results based on DNA data from a perspective of activity, this increasing trend in abundance, at least until 6 weeks, agrees with previous studies that suggest certain resistance to water stress of AOA (Merbt et al., 2016).
On the contrary, the observed drop in the RA of AOA and amoA genes after 9 weeks could indicate sensitivity of AOA to extreme desiccation frequently associated to long dry periods. In agreement with this finding, Thion and Prosser (2014) reported negative impacts of dry conditions on AOA amoA gene abundance in grassland soils.
Interestingly, within the AOA groups, we found that the RA of the “marine order” Nitrosopumilales tended to fall rather than increase in surface sediments after 9 weeks of drying while soil AOA clades kept increasing. This result points to the notion of dry, air-exposed conditions as the possible selecting force for Nitrososphaerales (the former soil group) over Nitrosopumilales (the former marine group I) (Tourna et al., 2011; Stieglmeier et al., 2014). In fact, we found that the RA of Nitrososphaerales showed a negative relationship with WC% in surface sediments (Simple Linear Regression, R2 = −0.42, P < 0.001, n = 29). Results in this respect also support the idea of the replacement of species typical of aquatic habitats by those more frequently dominating terrestrial systems, as has been previously suggested in intermittent rivers during non-flow periods (Timoner et al., 2014; Sabater et al., 2016).
In most cases, rainfall events (either modest or intense) had no major effects on the RA of nitrifying groups and number of amoA copies. A plausible explanation for this lack of marked differences can lie in the sampling time we use to collect the sediments after rainfall (24 h following rainfalls) which could not be long enough to visualize changes driven by RMs, at least in terms of DNA. In water-limited soils, increased microbial activity in terms of biogeochemical rates has been reported in response to water pulses within timeframes of minutes (Schwinning and Sala, 2004). However, changes in activity may not be translated into changes in the abundance within the same time frame.
In some instances we found decreased RA in response to rainfall. After the longest dry period (i.e., 9 weeks) the RA of AOB (in deep layer) decreased in response to rainfall (both after 4 and 21 mm). Studies from soils have shown how sudden rewetting events after drying can exert drastic shifts in matrix potential, inducing cellular lysis and altering microbial community composition (Kieft et al., 1987; Fierer et al., 2003; Gordon et al., 2008), a situation that could be behind these findings. However, our DNA-based approaches do not allow assessments of microbial activity due to potential retention of “dead” DNA in the environment. The constant sediment DNA content over time in our experiment, may reflect both living biomass and dead material. Our inconclusive findings in this respect highlight the importance of including molecular analyses dealing with functional aspects (e.g., transcriptomics and activity measurements) to achieve deeper information whether and when changes in the humidity of sediments impact on microbial communities in streambeds.
Finding links of ammonia-oxidizing microbes abundance and functional genes with ecosystem process measurements is tough (Prosser, 2012). In our experiment, we did not find any direct relationship between the RAs of these groups and AO rates. Also, AO rates were not correlated with the quantitative data, AOA amoA and AOB amoA copy numbers. Previous studies in marine habitats and streams have also reported such lack of correspondence despite observing high AOA amoA abundances (Santoro et al., 2010; Merbt et al., 2016) as in our case. High abundance of AOA does not mean AOA are driving AO, since the cell-specific AO rates are generally higher for AOB than for most AOA (Alves et al., 2013). Truly understanding such linkages is additionally complicated by new discoveries about physiological versatility in some groups, such as the NOB and COMAMMOX (Daims et al., 2016; Kits et al., 2017), preventing the clear assignment of microbial taxa to functional guilds. Nevertheless, when data were pooled across both sediment layers, we found evidence for synchrony between the variation of marine AOA (Nitrosopumilales) and sediment NH4+ (Simple Linear Regression, R2 = −0.43, P < 0.001, n = 56) which suggests that this AOA group could be the driving force behind AO variation in our experiment and as such could contribute to dropping NH4+.
AO and N Pools in Response to Drying and Rainfall
AO rates decreased strongly in surface sediment but remained stable in the deep sediment layer. Simultaneously, NO3− increased steadily and stronger in surface than in deep sediment, while NH4+ dropped markedly within the first 3 weeks and then remained low in both sediment layers. In soils, nitrification activity has been reported to be low in water-saturated conditions (due to reduced oxygen diffusion) as well as at very low moisture (Rennenberg et al., 2009; Thion and Prosser, 2014). In our microcosms, suboptimum conditions for nitrification were likely associated to low oxygen levels observed at initial wet conditions (t = 0 weeks). Far from observing increased AO rates from wet to dry conditions due to enhanced oxygen diffusion, AO rates appeared decreased after the study dry periods, especially in surface sediments. Certain water stress as a result of loss of sediment moisture over time could be a plausible explanation for continuously low AO rates. In line with these findings, Austin and Strauss (2011) also found decreased AO rates in an experimental intermittent stream after 28 days of desiccation, likely due to water stress. However, deep layers, despite not allowing large oxygen diffusion as in surface, are more protected to desiccation and can retain more water to avoid a strong reduction in the biogeochemical activity. Contrary to our findings, Merbt et al. (2016) detected increased AO rates with drying of an intermittent stream. However, their “drying” gradient was not established along a temporal sequence in the same habitat, but across different habitats with potentially different environmental conditions controlling AO rates, such as NH4+ availability.
The notion of water limitation for AO activity in our experiment was also suggested during the water pulses, when the rainfall event greater in magnitude (i.e., 21 mm) triggered higher AO rates in deep layers. Such spikes indicate that the impact of drying on N processing can be alleviated after a certain time of desiccation by an adequate increase of sediment moisture. In fact, in our experiment, WC% was the only variable significantly related with AO rates (Simple Linear Regression, R2 = 0.42, P < 0.001, n = 56, data pooled across sediment layers). As in arid and semiarid soils (Austin et al., 2004; Schwinning et al., 2004), in our microcosms the duration of the previous dry period determined the response to a water pulse. Interestingly, the triggered AO activity in deep sediments in response to rainfall was observed after 6 weeks of drying, and despite not significant, also a modest increase after 3 weeks was detected. Thus, short and intermediate dry phase duration could be optimally supporting the positive effect of a following water pulse on AO. On the contrary, after 9 weeks, physiological constraints caused by strong desiccation (e.g., cell dormancy) may hinder the response of microorganisms to water pulses. Such physiological constraints could also explain the lack of a significant response of AO to even the most intense water pulses in the more water-stressed surface sediments.
Despite the general reduction in AO rates observed in our experiment, we cannot rule out an unobserved increase in AO rates in surface sediments occurring at very early desiccation before our first sampling, as has been reported by others. In an experimental streambed, Gómez et al. (2012) observed high accumulation of NO3− during the first 10 days of drying followed by a notable reduction likely due to microbial assimilation. Unobserved increased AO rates during the early phase of the experiment may have contributed to the large drop of NH4+ observed after 3 weeks onward, which in turn may have further decreased AO rates due to N limitation later in the experiment. NH4+ is a master driver of N cycling processes and is naturally crucial for AO (Verhamme et al., 2011). Diminishing NH4+ concentration, either due to competition for NH4+ with heterotrophs (Strauss et al., 2004) or due to reduced ammonification could also contribute to the observed general decrease in AO rates. The general drop in DON with drying with minimal differences among RMs points to N mineralization at least during the first 3 weeks of desiccation. Later, however, constrained microbial activity by water stress likely restrained ammonification as a source of inorganic N for AO as our experiment progressed. The sudden increase in NH4+ following rainfall in surface sediments after 9 weeks of drying could be due to osmotic shock and release of cellular NH4+ (Halverson et al., 2000). Interestingly, this NH4+ “flash” did not translate into an increased AO rate likely because water limitation was more important for AO than substrate availability after 9 weeks.
Last, a lack of an external source of NH4+ in our microcosms could also contribute to explain the low reactivity of AO rates to the rainfall treatments we found in many cases. Rainwater usually contains NH4+ and NO3−. However, in our experiment we avoided enriching our artificial rainwater with inorganic N to prevent confounding effects with riverbed humidity as both factors can limit AO rates. Therefore, we must be cautious when extrapolating our lab results with respect to RMs to the real environment since we could observe a different effect. We must note that in the natural environment the NH4+ inputs that frequently accompany precipitation events may trigger important “hot moments” for nitrification by alleviating not only water stress but also a potential NH4+ limitation.
Interestingly, we must highlight that despite the observed low AO rates, NO3− continued to increase steadily until the end of the experiment, suggesting sustained nitrification activity. The relatively lower increase in deep compared to surface sediments after 6–9 weeks of drying (from 0.23 to 50 μg N g−1 DM) may be at least partially explained by a more likely relevant role for denitrification and NO3− removal in deep sediments, since denitrification is substantially reduced in exposed, dry sediments (Austin and Strauss, 2011; Gómez et al., 2012). Despite this vertical stratification, with respect to NO3−, our results generally support previous studies that demonstrate that temporal progression of drying in stream sediments drives a considerable increase of mineral N pointing to dry riverbeds as potential sources of NO3− upon flow recovery (Gómez et al., 2012; Arce et al., 2014; Merbt et al., 2016).
Finally, we must keep in mind that in our microcosms, we simulated rainfall events that did not create overlaying water and allowed relatively good oxygen diffusion to sediments. Occasionally, rewetting after considerable rainfalls drives sediment patches with limited oxygen diffusion and generates temporary anoxic pools that may result in unsuitable habitats for aerobic ammonia oxidizers but sufficient for denitrifying microbes, which ultimately alters the spatial distribution of N-pools during non-flow periods (Arce et al., 2015). Consequently, transitory conditions of high NH4+ relative to NO3− may occur in dry riverbed sediments in response to changes in the dominant microbial community associated to redox conditions after a rewetting event (Gómez et al., 2017; von Schiller et al., 2017).
Variation of N2O Fluxes Associated to Drying and Rainfall
As initially predicted, results from our experiment confirm that temporal progression of drying causes notable fluctuations of N2O fluxes from streambeds. We found a gradual increase of N2O fluxes during initial drying, with a peak average value after 11 days (182.5 μg N2O-N m−2 h−1). Afterward, N2O fluxes steeply decreased to concentrations ranging between 0 and 5.6 μg N2O-N m−2 h−1. The temporal behavior in N2O fluxes can be attributed to a combination of physical and microbial changes coupled to sediment water and oxygen fluctuations. While overlaying water slowed down N2O diffusion to the headspace of the microcosms at t = −3 days, increased gas diffusion may have favored N2O evasion as detected from t = 0 to 11 days. This pulse in gas emissions during reduction of the water table was also observed in inundated wetlands (Freeman et al., 1993; Fenner and Freeman, 2011) temporary ponds (Catalán et al., 2014) and streambed sediments (von Schiller et al., 2014; Gómez-Gener et al., 2015, 2016).
Denitrification and nitrification are the main sources of N2O, representing around 70% of the annual N2O flux from ecosystems to the atmosphere (Stevens et al., 1997; Morse and Bernhardt, 2013). In our microcosms experiment, we cannot distinguish which source was behind N2O fluxes and how it changed over time. However, differences in the degree of contribution on the base of their redox requirements as drying progressed may be anticipated (Bateman and Baggs, 2005; Congreves et al., 2018). For example, the first 11 days of drying, when the maximum flux was detected, WC% varied from 28 to 22% providing wet-saturated conditions and anaerobiosis, which could have promoted N2O emissions primarily via denitrification (Burgin and Groffman, 2012; Congreves et al., 2018). Using a 15N tracer approach Morse and Bernhardt (2013) found nitrification to contribute significantly, even higher than denitrification, to N2O yields from abundant NH4+ in organic sediments after drainage. Thus, N2O derived from nitrification could take place in our microcosms as DO increased. In fact, such a peak of N2O observed after 11 days of drying prompts us to suspect that we probably missed a “hot moment” of increased AO in the sediments before 3 weeks (i.e., the first sampling time). As desiccation advances, the flux of N2O via microbial pathways is expected to be low due to water constraints and associated limitations (e.g., low substrate diffusivity, Congreves et al., 2018).
Rainfall events did not have the expected positive effect based on their magnitude. However, the implications of rainfall on N2O emissions we detected were modulated by the duration of the precedent dry period. Significant differences of cumulative fluxes were detected after 6 and 9 weeks of drying, likely when induced moisture changes by rainfalls were more evident. Surprisingly, far from observing an increasing reaction, rewetting seemed to negatively impact emissions of N2O as its magnitude increased. In fact, after 6 weeks of drying, intense rainfall (i.e., 21 mm) produced a steep drop in the N2O flux at t = 2.5 h, and, unexpectedly, after 9 weeks the highest fluxes were detected in the dry sediments (i.e., 0 mm). Only in the case of the modest rainfall (i.e., 4 mm) after 6 and 9 weeks of drying, we found an immediate positive reaction (t = 0 h) following that pulse or a full day later (t = 24 h). Thus, our results partly disagree with studies from soils, which generally report an increase of N2O emissions following water addition (as reviewed in Kim et al., 2012). They also partially contradict results by Gallo et al. (2014), who reported increased N2O emissions after water pulses due to physical release and microbial activation in ephemeral streams in South Eeast United States. As in our experiment, Muhr et al. (2008) did not detect any increase of N2O fluxes in dry forested soils after rewetting events between 8 and 50 mm. The authors attributed their observations to limited N mineralization providing inorganic-N substrate and low microbial activity in the precedent dry conditions. Anaerobiosis and increased C and N substrated are frequently associated to large microbial N2O fluxes upon rewetting (as reviewed in Congreves et al., 2018). In our microcosms, intense rainfall events could support microbial N2O emissions in dry sediments but could have also exerted a physical trapping that hinder gas exchange and displacement, thus resulting in an apparent absence of gas fluxes during the 24 h of monitoring period.
Although we obtained data on abundance and biogeochemical activity of nitrifying microbial communities, attributing N2O emissions to their relative importance is complex. AOB and AOA can produce N2O either enzymatically via nitrifier denitrification or abiotically via reduction of NO (Kozlowski et al., 2016). Moreover, although there is no empirical evidence that COMAMMOX produce N2O, it has been suggested that they probably do, because their AO pathway is similar to the classic AO pathway (Kuypers, 2015). Based on the predominance of AOA over AOB in oxic environments (Nicol et al., 2008; Schauss et al., 2009; Zhang et al., 2009), AOA have been proposed as the major source of N2O in natural ecosystems (Santoro et al., 2011; Jung et al., 2014). Unfortunately, our headspace measurements alone make resultant N2O yields notoriously difficult to elucidate regarding the relative importance of sources and microbial groups.
Conclusion
We detect and quantify the two main groups of microbes driving the first step of nitrification (AOA and AOB) in riverbed sediments under drying-rewetting conditions and we tentatively identify NOB and the newly described COMAMMOX. In addition, we provide information on their biogeochemical functioning. By combining sequencing of 16S rRNA and qPCR of amoA genes, we show that the abundance of nitrifying microbes and functional genes are not strongly constrained by the desiccation stress. This lack of a negative effect of drying was especially marked for AOA, amoA AOA before 6 weeks of desiccation. However, after 9 weeks of drying, especially in surface sediments, we detected a drop in the abundance of amoA AOA genes. Although these results must be considered within the context that they do not strictly represent functioning, collectively they indicate some sensitivity of AOA under extreme desiccation after longer dry periods. In parallel, AO rates tended to fall during the experiment, especially in surface sediments. We suggest that the variability observed in AO rates was more directly dependent on physical controls, primarily sediment WC% and indirectly NH4+ availability, than on biotic factors related to the relative variations in abundance of the different AO groups. Nevertheless, continued AO activity resulted in a notable accumulation of NO3− and a drop in NH4+ as drying continued especially in surface layers. Our experimental results support the notion that surface riverbed sediments, rich in NO3−, may act as a relevant natural source of this mobile form of N to water column upon flow resumption. Furthermore, our experiment demonstrates that drying can drive important fluctuations in the flux of N2O to atmosphere in riverbed sediments. While N2O emissions, through either physical evasion or microbial activity, can be favored at early drying, N2O emissions after longer dry periods tend to drop. We found that even under very dry conditions, rainfall events could foster N2O emissions, depending on DPD and RM. Together, our results show that dry riverbeds can be active biogeochemical processors, and suggest that dry-phase processing of N, including that under sporadic rainfall events, could significantly contribute to N budgets (dissolved and gaseous) along intermittent fluvial networks.
Author Contributions
MA, DS, and GS conceived and designed the experiments and wrote the manuscript. MA and HJ made the field and laboratory work for chemical and biogeochemical analysis. HJ and GS performed the statistical analyses. MA made the DNA extractions. MB, TU, CH, and RA made the qPCR for amoA genes and analyzed 16sRNA sequences. MB and TU contributed to write the manuscript.
Funding
MA was funded by a postdoctoral grant from IGB and from the Alexander von Humboldt Foundation. DS was additionally funded by MINECO through the project DIVERSION (CGL2016-77487-R) and by the Basque Government through a grant for Research Groups of the Basque University System (IT-951-16). MB was funded by the DFG project LakeMix (BE 6194/1-1). TU acknowledges financial support from ESF and Ministry of Education, Science and Culture of Mecklenburg-Western Pomerania project WETSCAPES (ESF/14-BM-A55-0032/16).
Conflict of Interest Statement
The authors declare that the research was conducted in the absence of any commercial or financial relationships that could be construed as a potential conflict of interest.
Acknowledgments
We would like to thank the Chemical lab and Thomas Fuss from IGB for chemical analysis, and for the help during field work, respectively, Maria del Mar Sanchez-Montoya from University of Murcia for supporting microcosms, and Anne Reinhard from the University of Greifswald for laboratory assistance.
Supplementary Material
The Supplementary Material for this article can be found online at: https://www.frontiersin.org/articles/10.3389/fmicb.2018.02794/full#supplementary-material
Abbreviations
amoA, ammonia monooxygenase subunit A; AO, ammonia oxidation; AOA, ammonia-oxidizing archaea; AOB, ammonia-oxidizing bacteria; COMAMMOX, complete ammonia oxidation to nitrate; DM, dry mass; DO, dissolved oxygen; DPD, dry period duration; NOB, nitrite-oxidizing bacteria; RM, rainfall magnitude; WC, water content.
Footnotes
References
Alves, R. J. E., Wanek, W., Zappe, A., Svenning, M. M., Schleper, C., and Urich, T. (2013). Nitrification rates in Arctic soils are associated with functionally distinct populations of ammonia-oxidizing archaea. ISME. J. 7, 1620–1631. doi: 10.1038/ismej.2013.35
Arce, M. I., Sánchez-Montoya, M. M., and Gómez, R. (2015). Nitrogen processing following experimental sediment rewetting in isolated pools in an agricultural stream of a semiarid region. Ecol. Eng. 77, 233–241. doi: 10.1016/j.ecoleng.2015.01.035
Arce, M. I., Sánchez-Montoya, M. M., Vidal-Abarca, M. R., Suárez, M. L., and Gómez, R. (2014). Implications of flow intermittency on sediment nitrogen availability and processing rates in a Mediterranean headwater stream. Aquat. Sci. 76, 173–186. doi: 10.1007/s00027-013-0327-2
Austin, A. T., Yahdjian, L., Stark, J. M., Balnap, J., Porporato, A., Norton, U., et al. (2004). Water pulses and biogeochemical cycles in arid and semiarid ecosystems. Oecologia 141, 221–235. doi: 10.1007/s00442-004-1519-1
Austin, B. J., and Strauss, E. A. (2011). Nitrification and denitrification response to varying periods of desiccation and inundation in a western Kansas stream. Hydrobiologia 658, 183–195. doi: 10.1007/s10750-010-0462-x
Bateman, E. J., and Baggs, E. M. (2005). Contributions of nitrification and denitrification to N2O emissions from soils at different water-filled pore space. Biol. Fert. Soils 41, 379–388. doi: 10.1007/s00374-005-0858-3
Beaulieu, J. J., Tank, J. L., Hamilton, S. K., Wollheim, W. M., Hall, R. O. Jr., Mulholland, P. J., et al. (2011). Nitrous oxide emission from denitrification in stream and river networks. Proc. Natl Acad. Sci. U.S.A. 108, 214–219. doi: 10.1073/pnas.1011464108
Borken, W., and Matzner, E. (2009). Reappraisal of drying and wetting effects on C and N mineralization and fluxes in soils. Glob. Chang. Biol. 15, 808–824. doi: 10.1111/j.1365-2486.2008.01681.x
Burgin, A. J., and Groffman, P. M. (2012). Soil O2 controls denitrification rates and N2O yield in a riparian wetland. J. Geophys. Res. Biogeosci. 117:G01010. doi: 10.1029/2011JG001799
Callahan, B. J., McMurdie, P. J., Rosen, M. J., Han, A. W., Johnson, A. J. A., and Holmes, S. P. (2016). DADA2: high-resolution sample inference from Illumina amplicon data. Nat. Methods 13, 581–583. doi: 10.1038/nmeth.3869
Catalán, N., von Schiller, D., Marcé, R., Koschorreck, M., Gómez-Gener, L., and Obrador, B. (2014). Carbon dioxide efflux during the flooding phase of temporary ponds. Limnetica 33, 349–360.
Collins, S. L., Sinsabaugh, R. L., Crenshaw, C., Green, L., Porras-Alfaro, A., Stursova, M., et al. (2008). Pulse dynamics and microbial processes in aridland ecosystems. J. Ecol. 96, 413–420. doi: 10.1111/j.1365-2745.2008.01362.x
Congreves, K. A., Wagner-Riddle, C., Si, B. C., and Clough, T. J. (2018). Nitrous oxide emissions and biogeochemical responses to soil freezing-thawing and drying-wetting. Soil Biol. Biochem. 117, 5–15. doi: 10.1016/j.soilbio.2017.10.040
Daims, H., Lebedeva, E. V., Pjevac, P., Han, P., Herbold, C., Albertsen, M., et al. (2015). Complete nitrification by Nitrospira bacteria. Nature 528:504. doi: 10.1038/nature16461
Daims, H., Lucker, S., and Wagner, M. (2016). A new perspective on microbes formerly known as nitrite-oxidizing bacteria. Trends. Microbiol. 24, 699–712. doi: 10.1016/j.tim.2016.05.004
Datry, T., Larned, S. T., and Tockner, K. (2014). Intermittent rivers: a challenge for freshwater ecology. BioScience 64, 229–235. doi: 10.1016/j.scitotenv.2017.09.323
Fenner, N., and Freeman, C. (2011). Drought-induced carbon loss in peatlands. Nat. Geosci. 4:895. doi: 10.1038/ngeo1323
Fierer, N., and Schimel, J. P. (2002). Effects of drying-rewetting frequency on soil carbon and nitrogen transformations. Soil Biol. Biochem 34, 777–787. doi: 10.1016/S0038-0717(02)00007-X
Fierer, N., Schimel, J. P., and Holden, P. A. (2003). Influence of drying-rewetting frequency on soil bacterial community structure. Microb. Ecol. 45, 63–71. doi: 10.1007/s00248-002-1007-2
Freeman, C., Lock, M. A., and Reynolds, B. (1993). Fluxes of carbon dioxide, methane and nitrous oxide from a Welsh peatland following simulation of water table draw-down: potential feedback to climatic change. Biogeochemistry 19, 51–60. doi: 10.1007/BF00000574
Gallo, E. L., Lohse, K. A., Ferlin, C. M., Meixner, T., and Brooks, P. D. (2014). Physical and biological controls on trace gas fluxes in semi-arid urban ephemeral waterways. Biogeochemistry 121, 189–207. doi: 10.1007/s10533-013-9927-0
Gómez, R., Arce, M. I., Baldwin, D. S., and Dahm, C. N. (2017). “Water physicochemistry in intermittent rivers and ephemeral streams,” in Intermittent Rivers and Ephemeral Streams, eds T. Datry, N. Bonada, and A. J. Boulton (San Diego, CA: Academic Press), 109–134. doi: 10.1016/B978-0-12-803835-2.00005-X
Gómez, R., Arce, M. I., Sánchez, J. J., and Sanchez-Montoya, M. M. (2012). The effects of drying on sediment nitrogen content in a Mediterranean intermittent stream: a microcosms study. Hydrobiologia 679, 43–59. doi: 10.1007/s10750-011-0854-6
Gómez-Gener, L., Obrador, B., Marcé, R., Acuña, V., Catalán, N., Casas-Ruiz, J. P., et al. (2016). When water vanishes: magnitude and regulation of carbon dioxide emissions from dry temporary streams. Ecosystems 19, 710–723. doi: 10.1007/s10021-016-9963-4
Gómez-Gener, L., Obrador, B., von Schiller, D., Marcé, R., Casas-Ruiz, J. P., Proia, L., et al. (2015). Hot spots for carbon emissions from Mediterranean fluvial networks during summer drought. Biogeochemistry 125, 409–426. doi: 10.1007/s10533-015-0139-7
Gordon, H., Haygarth, P. M., and Bardgett, R. D. (2008). Drying and rewetting effects on soil microbial community composition and nutrient leaching. Soil Biol. Biochem. 40, 302–311. doi: 10.1016/j.soilbio.2007.08.008
Hall, R. O., Tank, J. L., Sobota, D. J., Mulholland, P. J., O’Brien, J. M., Dodds, W. K., et al. (2009). Nitrate removal in stream ecosystems measured by 15N addition experiments: total uptake. Limnol. Oceanogr. 54, 653–665. doi: 10.4319/lo.2009.54.3.0653
Halverson, L. J., Jones, T. M., and Firestone, M. K. (2000). Release of intracellular solutes by four soil bacteria exposed to dilution stress. Soil Sci. Soc. Am. J. 64, 1630–1637. doi: 10.2136/sssaj2000.6451630x
Hoerling, M., Eischeid, J., Perlwitz, J., Quan, X., Zhang, T., and Pegion, P. (2012). On the increased frequency of Mediterranean drought. J. Clim. 25, 2146–2161. doi: 10.1175/JCLI-D-11-00296.1
Howarth, R., Chan, F., Conley, D. J., Garnier, J., Doney, S. C., Marino, R., et al. (2011). Coupled biogeochemical cycles: eutrophication and hypoxia in temperate estuaries and coastal marine ecosystems. Front. Ecol. Environ. 9:18–26. doi: 10.1890/100008
Jung, M. Y., Well, R., Min, D., Giesemann, A., Park, S. J., Kim, J. G., et al. (2014). Isotopic signatures of N2O produced by ammonia-oxidizing archaea from soils. ISME J. 8, 1115–1125. doi: 10.1038/ismej.2013.205
Kerou, M., Offre, P., Valledor, L., Abby, S. S., Melcher, M., Nagler, M., et al. (2016). Proteomics and comparative genomics of Nitrososphaera viennensis reveal the core genome and adaptations of archaeal ammonia oxidizers. Proc. Natl Acad. Sci. U.S.A. 113, E7937–E7946. doi: 10.1073/pnas.1601212113
Kieft, T. L., Soroker, E., and Firestone, M. K. (1987). Microbial biomass response to a rapid increase in water potential when dry soil is wetted. Soil Biol. Biochem. 19, 119–126. doi: 10.1016/0038-0717(87)90070-8
Kim, D. G., Vargas, R., Bond-Lamberty, B., and Turestsky, M. R. (2012). Effects of soil rewetting and thawing on soil gas fluxes: a review of current literature and suggestions for future research. Biogeosciences 9, 2459–2483. doi: 10.5194/bg-9-2459-2012
Kits, K. D., Sedlacek, C. J., Lebedeva, E. V., Han, P., Bilaev, A., Pjevac, P., et al. (2017). Kinetic analysis of a complete nitrifier reveals an oligotrophic lifestyle. Nature 549, 269–272. doi: 10.1038/nature23679
Kozlowski, J. A., Stieglmeier, M., Schleper, C., Klotz, M. G., and Stein, L. Y. (2016). Pathways and key intermediates required for obligate aerobic ammonia-dependent chemolithotrophy in bacteria and Thaumarchaeota. ISME J. 10, 1836–1845. doi: 10.1038/ismej.2016.2
Kuypers, M. M. (2015). Microbiology: a division of labour combined. Nature 528, 487–488. doi: 10.1038/528487a
Lanzén, A., Jorgensen, S. L., Huson, D. H., Gorfer, H., Grindhaug, S. H., Jonassen, I., et al. (2012). CREST – classification resources for environmental sequence tags. PLoS One 7:e49334. doi: 10.1371/journal.pone.0049334
Levi, P. S., Tank, J. L., Tiegs, S. D., Chaloner, D. T., and Lamberti, G. A. (2013). Biogeochemical transformation of a nutrient subsidy: salmon, streams, and nitrification. Biogeochemistry 113, 643–655. doi: 10.1007/s10533-012-9794-0
Lovieno, P., and Bååth, E. (2008). Effect of drying and rewetting on bacterial growth rates in soi. FEMS Microbiol. Ecol. 65, 400–407. doi: 10.1111/j.1574-6941.2008.00524.x
McIntyre, R. E., Adams, M. A., and Grierson, P. F. (2009). Nitrogen mineralization potential in rewetted soils from a semi-arid stream landscape, north-west Australia. J. Arid. Environ. 73, 48–54. doi: 10.1016/j.jaridenv.2008.09.011
Merbt, S. N., Auguet, J. C., Blesa, A., Martí, E., and Casamayor, E. O. (2015). Wastewater treatment plant effluents change abundance and composition of ammonia-oxidizing microorganisms in Mediterranean urban stream biofilms. Microbial. Ecol. 69, 66–74. doi: 10.1007/s00248-014-0464-8
Merbt, S. N., Proia, L., Prosser, J. I., Martí, E., Casamayor, E. O., and von Schiller, D. (2016). Stream drying drives microbial ammonia oxidation and first-flush nitrate export. Ecology 97, 2192–2198. doi: 10.1002/ecy.1486
Mey, S. (2003). Modellgestützte Untersuchung der Abflussbildungsprozesse im Einzugsgebiet des Fredersdorfer Mühlenfließ. Dept of Geosciences Volume Diploma. Berlin: Free University Berlin, 102.
Morse, J. L., and Bernhardt, E. S. (2013). Using 15N tracers to estimate N2O and N2 emissions from nitrification and denitrification in coastal plain wetlands under contrasting land-uses. Soil Biol. Biochem. 57, 635–643. doi: 10.1016/j.soilbio.2012.07.025
Muhr, J., Goldberg, S. D., Borken, W., and Gebauer, G. (2008). Repeated drying–rewetting cycles and their effects on the emission of CO2, N2O, NO, and CH4 in a forest soil. J. Plant. Nutr. Soil Sci. 171, 719–728. doi: 10.1002/jpln.200700302
Murphy, J., and Riley, J. P. (1962). A modified single solution method for the determination of phosphate in natural waters. Anal. Chim. Acta 27, 31–36. doi: 10.1016/S0003-2670(00)88444-5
Nicol, G. W., Leininger, S., Schleper, C., and Prosser, J. I. (2008). The influence of soil pH on the diversity, abundance and transcriptional activity of ammonia oxidizing archaea and bacteria. Environ. Microbiol. 10, 2966–2978. doi: 10.1111/j.1462-2920.2008.01701.x
Nützmann, G., and Mey, S. (2007). Model-based estimation of runoff changes in a small lowland watershed of north-eastern Germany. J. Hydrol. 334, 467–476. doi: 10.1016/j.jhydrol.2006.10.026
Offre, P., Prosser, J. I., and Nicol, G. W. (2009). Growth of ammonia-oxidizing archaea in soil microcosms is inhibited by acetylene. FEMS Microbiol. Ecol. 70, 99–108. doi: 10.1111/j.1574-6941.2009.00725.x
Oksanen, J., Blanchet, G., Friendly, M., Kindt, R., Legendre, R., McGlinn, D., et al. (2016). “Vegan”: Community Ecology Package. R-Package Version 2.4–6.
Palmer, M. A., Reidy Liermann, C. A., Nilsson, C., Flörke, M., Alcamo, J., Lake, P. S., et al. (2008). Climate change and the world’s river basins: anticipating management options. Front. Ecol. Environ. 6:191. doi: 10.1890/060148
Pester, M., Rattei, T., Flechl, S., Gröngröft, A., Richter, A., Overmann, J., et al. (2012). amoA-based consensus phylogeny of ammonia-oxidizing archaea and deep sequencing of amoA genes from soils of four different geographic regions. Environ. Microbiol. 14, 525–539. doi: 10.1111/j.1462-2920.2011.02666.x
Peterson, B. J., Wollheim, W. M., Mulholland, P. J., Webster, J. R., Meyer, J. L., Tank, J. L., et al. (2001). Control of nitrogen export from watersheds by headwater streams. Science 292, 86–90. doi: 10.1126/science.1056874
Placella, S. A., and Firestone, M. K. (2013). Transcriptional response of nitrifying communities to wetting of dry soil. Appl. Environ. Microbiol. 79, 3294–3302. doi: 10.1128/AEM.00404-13
Pohlon, E., Fandino, A. O., and Marxsen, J. (2013). Bacterial community composition and extracellular enzyme activity in temperate streambed sediment during drying and rewetting. PLoS One 8:e83365. doi: 10.1371/journal.pone.0083365
Prosser, J. I. (2012). Ecosystem processes and interactions in a morass of diversity. FEMS Microbiol. Ecol. 81, 507–519. doi: 10.1111/j.1574-6941.2012.01435.x
Pruesse, E., Quast, C., Knittel, K., Fuchs, B. M., Ludwig, W., Peplies, J., et al. (2007). SILVA: a comprehensive online resource for quality checked and aligned ribosomal RNA sequence data compatible with ARB. Nucleic. Acids Res. 35, 7188–7196. doi: 10.1093/nar/gkm864
R Core Team (2017). R: A Language and Environment for Statistical Computing. Available at: https://www.R-project.org/
Reardon, J., Foreman, J. A., and Searcy, R. L. (1966). New reactants for the colorimetric determination of ammonia. Clin. Chim. Acta 14, 203–205. doi: 10.1016/0009-8981(66)90120-3
Rennenberg, H., Dannenmann, M., Gessler, A., Kreuzwieser, J., Simon, J., and Papen, H. (2009). Nitrogen balance in forest soils: nutritional limitation of plants under climate change stresses. Plant. Biol. 11, 4–23. doi: 10.1111/j.1438-8677.2009.00241.x
Roeßler, M., and Müller, V. (2001). Osmoadaptation in bacteria and archaea: common principles and differences. Environ. Microbiol. 3, 743–754. doi: 10.1046/j.1462-2920.2001.00252.x
Rotthauwe, J. H., Witzel, K. P., and Liesack, W. (1997). The ammonia monooxygenase structural gene amoA as a functional marker: molecular fine-scale analysis of natural ammonia-oxidizing populations. Appl. Environ. Microbol. 63, 4704–4712.
Sabater, S., Timoner, X., Borrego, C., and Acuña, V. (2016). Stream biofilm responses to flow intermittency: from cells to ecosystems. Front. Environm. Sci. 4:14. doi: 10.3389/fenvs.2016.00014
Santoro, A. E., Buchwald, C., McIlvin, M. R., and Casciotti, K. L. (2011). Isotopic signature of N2O produced by marine ammonia-oxidizing archaea. Science 333, 1282–1285. doi: 10.1126/science.1208239
Santoro, A. E., Casciotti, K. L., and Francis, C. A. (2010). Activity, abundance and diversity of nitrifying archaea and bacteria in the central California current. Environ. Microbiol. 12, 1989–2006. doi: 10.1111/j.1462-2920.2010.02205.x
Schauss, K., Focks, A., Leininger, S., Kotzerke, A., Heuer, H., Thiele-Bruhn, S., et al. (2009). Dynamics and functional relevance of ammonia-oxidizing archaea in two agricultural soils. Environ. Microbiol. 11, 446–456. doi: 10.1111/j.1462-2920.2008.01783.x
Schimel, J., Balser, T. C., and Wallenstein, M. (2007). Microbial stress-response physiology and its implications for ecosystem function. Ecology 88, 1386–1394. doi: 10.1890/06-0219
Schwinning, S., and Sala, O. E. (2004). Hierarchy of responses to resource pulses in arid and semi-arid ecosystems. Oecologia 141, 211–220. doi: 10.1007/s00442-004-1520-8
Schwinning, S., Sala, O. E., Loik, M. E., and Ehleringer, J. R. (2004). Thresholds, memory, and seasonality: understanding pulse dynamics in arid/semi-arid ecosystems. Oecologia 141, 191–193. doi: 10.1007/s00442-004-1683-3
Shi, A. D., and Marschner, P. (2014). Drying and rewetting frequency influences cumulative respiration and its distribution over time in two soils with contrasting management. Soil Biol. Biochem. 72, 172–179. doi: 10.1016/j.soilbio.2014.02.001
Stevens, R. J., Laughlin, R. J., Burns, L. C., Arah, J. R. M., and Hood, R. C. (1997). Measuring the contributions of nitrification and denitrification to the flux of nitrous oxide from soil. Soil Biol. Biochem. 29, 139–151. doi: 10.1016/S0038-0717(96)00303-3
Steward, A. L., von Schiller, D., Tockner, K., MArshall, J. C., and Bunn, S. E. (2012). When the river runs dry: human and ecological values of dry riverbeds. Front. Ecol. Environ. 10:202–209. doi: 10.1890/110136
Stieglmeier, M., Klingl, A., Alves, R. J., Rittmann, S. K.-M., Melcher, M., Nikolaus, L., et al. (2014). Nitrososphaera viennensis gen. nov., sp. nov., an aerobic and mesophilic, ammonia-oxidizing archaeon from soil and a member of the archaeal phylum Thaumarchaeota. Int. J. Syst. Evol. Microbiol. 64, 2738–2752. doi: 10.1099/ijs.0.063172-0
Strauss, E. A., Richardson, W. B., Bartsch, L. A., Cavanaugh, J. C., Bruesewitz, D. A., Imker, H., et al. (2004). Nitrification in the upper mississippi river: patterns, controls, and contribution to the NO3- budget. J. N. Am. Benthol. Soc. 23, 1–14. doi: 10.1899/0887-3593(2004)023<0001:NITUMR>2.0.CO;2
Thion, C., and Prosser, J. I. (2014). Differential response of nonadapted ammonia-oxidising archaea and bacteria to drying–rewetting stress. FEMS Microbiol. Ecol. 90, 380–389. doi: 10.1111/1574-6941.12395
Tiedje, J. M. (1982). “Denitrification,” in Methods of Soil Analysis. Part 2. Chemical and Microbiological Properties, Agronomy Monograph 9.2, (Madison, WI: American Society of Agronomy, Soil Science Society of America), 1011–1026.
Timoner, X., Acuña, V., Von Schiller, D., and Sabater, S. (2012). Functional responses of stream biofilms to flow cessation, desiccation and rewetting. Freshw. Biol. 57, 1565–1578. doi: 10.1111/j.1365-2427.2012.02818.x
Timoner, X., Borrego, C. M., Acuña, V., and Sabater, S. (2014). The dynamics of biofilm bacterial communities is driven by flow wax and wane in a temporary stream. Limnol. Oceanogr. 59, 2057–2067. doi: 10.4319/lo.2014.59.6.2057
Tourna, M., Freitag, T. E., Nicol, G. W., and Prosser, J. I. (2008). Growth, activity and temperature responses of ammonia-oxidizing archaea and bacteria in soil microcosms. Environ. Microbiol. 10, 1357–1364. doi: 10.1111/j.1462-2920.2007.01563.x
Tourna, M., Stieglmeier, M., Spang, A., Könneke, M., Chitlmeister, A., Urich, T., et al. (2011). Nitrososphaera viennensis, an ammonia oxidizing archaeon from soil. Proc. Natl Acad. Sci. U.S.A. 108, 8420–8425. doi: 10.1073/pnas.1013488108
van Gestel, M., Ladd, J. N., and Amato, M. (1991). Carbon and nitrogen mineralization from two soils of contrasting texture and microaggregate stability: influence of sequential fumigation, drying and storage. Soil Biol. Biochem. 23, 313–322. doi: 10.1016/0038-0717(91)90185-M
van Kessel, M. A., Speth, D. R., Albertsen, M., Nielsen, P. H., Op den Camp, H. J. M., Kartal, B., et al. (2015). Complete nitrification by a single microorganism. Nature 528:555. doi: 10.1038/nature16459
Verhamme, D. T., Prosser, J. I., and Nicol, G. W. (2011). Ammonia concentration determines differential growth of ammonia-oxidising archaea and bacteria in soil microcosms. ISME J. 5, 1067–1071. doi: 10.1038/ismej.2010.191
von Schiller, D., Bernal, S., Dahm, C. N., and Martí, E. (2017). “Nutrient and organic matter dynamics,” in Intermittent Rivers and Ephemeral Streams, eds T. Datry, N. Bonada, and A. J. Boulton (San Diego, CA: Academic Press)) doi: 10.1016/B978-0-12-803835-2.00006-1
von Schiller, D. V., Marcé, R., Obrador, B., Gómez-Gener, L., Casas-Ruiz, J. P., Acuña, V., et al. (2014). Carbon dioxide emissions from dry watercourses. Inland Waters 4, 377–382. doi: 10.5268/IW-4.4.746
Walters, W., Hyde, E. R., Berg-Lyons, D., Ackermann, G., Humphrey, G., Parada, A., et al. (2016). Improved bacterial 16S rRNA gene (V4 and V4-5) and fungal internal transcribed spacer marker gene primers for microbial community surveys. Msystems 1:e00009-15. doi: 10.1128/mSystems.00009-15
Wood, E. D., Armstrong, F. A., and Richards, F. A. (1967). Determination of nitrate in seawater by cadmium–copper reduction to nitrite. J. Mar. Biol. Assoc. U.K. 47, 23–31. doi: 10.1017/S002531540003352X
Yu, Z. H., Wang, G. H., and Marsthner, P. (2014). Drying and rewetting-effect of frequency of cycles and length of moist period on soil respiration and microbial biomass. Eur. J. Soil. Biol. 62, 132–137. doi: 10.1016/j.ejsobi.2014.03.007
Zhang, L. M., Wang, M., Prosser, J. I., Zheng, Y. M., and He, J. Z. (2009). Altitude ammonia-oxidizing bacteria and archaea in soils of Mount Everest. FEMS Microbiol. Ecol. 70, 52–61. doi: 10.1111/j.1574-6941.2009.00775.x
Zillig, W. (1991). Comparative biochemistry of archaea and bacteria. Curr. Opin. Genet. Dev. 1, 544–551. doi: 10.1016/S0959-437X(05)80206-0
Zoppini, A., and Marxsen, J. (2010). Importance of Extracellular Enzymes for Biogeochemical Processes in Temporary River Sediments During Fluctuating Dry–Wet conditions. Soil Enzymology. Berlin: Springer, 103–117. doi: 10.1007/978-3-642-14225-3_6
Keywords: intermittent, stream, nitrification, ammonia oxidation, AOA, AOB, NOB, COMAMMOX
Citation: Arce MI, von Schiller D, Bengtsson MM, Hinze C, Jung H, Alves RJE, Urich T and Singer G (2018) Drying and Rainfall Shape the Structure and Functioning of Nitrifying Microbial Communities in Riverbed Sediments. Front. Microbiol. 9:2794. doi: 10.3389/fmicb.2018.02794
Received: 13 July 2018; Accepted: 30 October 2018;
Published: 16 November 2018.
Edited by:
Graeme W. Nicol, Université de Lyon, FranceReviewed by:
Martina Herrmann, Friedrich-Schiller-Universität Jena, GermanyAnnika C. Mosier, University of Colorado Denver, United States
Copyright © 2018 Arce, von Schiller, Bengtsson, Hinze, Jung, Alves, Urich and Singer. This is an open-access article distributed under the terms of the Creative Commons Attribution License (CC BY). The use, distribution or reproduction in other forums is permitted, provided the original author(s) and the copyright owner(s) are credited and that the original publication in this journal is cited, in accordance with accepted academic practice. No use, distribution or reproduction is permitted which does not comply with these terms.
*Correspondence: Maria Isabel Arce, YXJjZUBpZ2ItYmVybGluLmRl
†Present address: Ricardo J. Eloy Alves, Climate and Ecosystem Sciences Division, Earth and Environmental Sciences, Lawrence Berkeley National Laboratory, Berkeley, CA, United States