 Carla Gallardo-Benavente1,2
 Ornella Carrión3
 Jonathan D. Todd4
 Joana C. Pieretti5
 Amedea B. Seabra5Nelson Durán5,6Olga Rubilar2,7
 José M. Pérez-Donoso8*
 Andrés Quiroz2,9*
- 1Programa de Doctorado en Ciencias de Recursos Naturales, Universidad de La Frontera, Temuco, Chile
- 2Centro de Excelencia en Investigación Biotecnológica Aplicada al Medio Ambiente (CIBAMA), Facultad de Ingeniería y Ciencias, Universidad de La Frontera, Temuco, Chile
- 3School of Environmental Sciences, University of East Anglia, Norwich, United Kingdom
- 4School of Biological Sciences, University of East Anglia, Norwich, United Kingdom
- 5Centro de Ciencias Naturais e Humanas, Universidade Federal do ABC, Santo André, Brazil
- 6Institute of Biology, Universidade Estadual de Campinas, Campinas, Brazil
- 7Departamento de Ingeniería Química, Universidad de La Frontera, Temuco, Chile
- 8BioNanotechnology and Microbiology Lab, Center for Bioinformatics and Integrative Biology, Facultad de Ciencias de la Vida, Universidad Andres Bello, Santiago, Chile
- 9Departamento de Ciencias Químicas y Recursos Naturales, Facultad de Ingeniería y Ciencias, Universidad de La Frontera, Temuco, Chile
Previously we reported the biosynthesis of intracellular cadmium sulfide quantum dots (CdS QDs) at low temperatures by the Antarctic strain Pseudomonas fragi GC01. Here we studied the role of volatile sulfur compounds (VSCs) in the biosynthesis of CdS QDs by P. fragi GC01. The biosynthesis of nanoparticles was evaluated in the presence of sulfate, sulfite, thiosulfate, sulfide, cysteine and methionine as sole sulfur sources. Intracellular biosynthesis occurred with all sulfur sources tested. However, extracellular biosynthesis was observed only in cultures amended with cysteine (Cys) and methionine (Met). Extracellular nanoparticles were characterized by dynamic light scattering, absorption and emission spectra, energy dispersive X-ray, atomic force microscopy, transmission electron microscopy, X-ray diffraction and X-ray photoelectron spectroscopy. Purified QDs correspond to cubic nanocrystals of CdS with sizes between 2 and 16 nm. The analysis of VSCs revealed that P. fragi GC01 produced hydrogen sulfide (H2S), methanethiol (MeSH) and dimethyl sulfide (DMS) in the presence of sulfate, Met or Cys. Dimethyl disulfide (DMDS) was only detected in the presence of Met. Interestingly, MeSH was the main VSC produced in this condition. In addition, MeSH was the only VSC for which the concentration decreased in the presence of cadmium (Cd) of all the sulfur sources tested, suggesting that this gas interacts with Cd to form nanoparticles. The role of MeSH and DMS on Cds QDs biosynthesis was evaluated in two mutants of the Antarctic strain Pseudomonas deceptionensis M1T: megL– (unable to produce MeSH from Met) and mddA– (unable to generate DMS from MeSH). No biosynthesis of QDs was observed in the megL– strain, confirming the importance of MeSH in QD biosynthesis. In addition, the production of QDs in the mddA– strain was not affected, indicating that DMS is not a substrate for the biosynthesis of nanoparticles. Here, we confirm a link between MeSH production and CdS QDs biosynthesis when Met is used as sole sulfur source. This work represents the first report that directly associates the production of MeSH with the bacterial synthesis of QDs, thus revealing the importance of different VSCs in the biological generation of metal sulfide nanostructures.
Introduction
Nanotechnology is the study, understanding, control and restructuring of matter on the scale of nanometers (size range 1–100 nm) to create materials with new properties and functions that remarkably differ from their bulk counterpart (Sanchez and Sobolev, 2010). Nanoscience research and its applications, developed in recent decades, have significantly affected a number of areas, such as information technology, agriculture, energy, environmental science, medicine and food safety, among others (Solomon, 2018). Consequently, there is a growing need to develop nanoparticles by using new, cheaper, reliable and eco-friendly synthesis methods that do not involve toxic chemicals. To achieve this, research on the use of natural sources such as biological systems becomes essential. Biological production or biosynthesis of metal nanoparticles has been widely studied through the use of microorganisms, such as fungi, yeast and bacteria (Wu et al., 2015; Chakraborty et al., 2018; Qin et al., 2018). Due to the convenience of this method, a cost-effective, environmentally friendly and highly biocompatible alternative based on the use of bacterial cells has emerged (Monrás et al., 2012).
Bacteria of the Pseudomonas genus have been employed as cell factories to produce different types of metal nanoparticles. In fact, several Pseudomonas strains have been reported to produce extracellular gold (Au) and silver (Ag) nanoparticles (Kumar and Mamidyala, 2011; Baker et al., 2015; Ali et al., 2016; Jo et al., 2016). In addition, some Pseudomonas species can also synthesize a specific type of nanoparticles termed quantum dots (QDs), constituted of cadmium selenide (CdSe) (Ayano et al., 2015) or cadmium sulfide (CdS) (Gallardo et al., 2014; Plaza et al., 2016; Oliva-Arancibia et al., 2017).
Quantum dots or semiconductor nanocrystals are bimetallic structures that generally contain II–VI or III–V elements such as CdS, CdSe, ZnS, ZnTe, CdTe, InP or GaAs (Mal et al., 2016; Jadhav et al., 2017; McHugh et al., 2018). The size and composition of the nanoparticles are responsible for their unique physical, chemical and optical properties, which arise through quantum confinement effect (Alivisatos, 1996; Rengers et al., 2019). The remarkable properties of QDs, such as broad absorption, narrow and size-dependent emission spectra, resistance to photobleaching, strong luminescence and long luminescent lifetimes (Alivisatos, 1996; Zhou and Ghosh, 2007) allow their use in a number of technology-based applications of high economic, technological and biological value as for example optoelectronics (Faraon et al., 2007), solar cells (Nozik et al., 2010; Muthalif et al., 2019), imaging techniques (Wagner et al., 2019) and quantification of different molecules (Durán-Toro et al., 2014; Nguyen et al., 2015), among others.
Bacterial biosynthesis of cadmium-based QDs has been extensively studied in the past few years through the biological production of both intra- and extracellular nanoparticles (Plaza et al., 2016; Ulloa et al., 2016; Yang et al., 2016; Oliva-Arancibia et al., 2017), as well as to study the development of other nanoparticles and the mechanisms associated with biosynthesis (Venegas et al., 2017). However, the mechanism involved in Cd-based QD biosynthesis is still unknown. Overall, to carry out the biosynthesis of CdS nanoparticles, cadmium ion (Cd2+) should be added into the system to react with sulfide anion (S2–) provided exogenously or by the bacterial metabolism, in order to form the nanocrystal (Bai et al., 2009a; Gallardo et al., 2014; Yang et al., 2016).
Some bacteria are capable of releasing hydrogen sulfide (H2S) as a strategy to trap exogenous cadmium (Cd) to form less toxic insoluble metal-sulfides (Holmes et al., 1997). This ability has been widely used in the biosynthesis of QDs during the last years (Bai et al., 2009b). In general, the biosynthesis of CdS QDs has been associated with sulfur-containing molecules such as glutathione, peptides, Cys and H2S (Monrás et al., 2012; Yang et al., 2016). However, the role of other volatile sulfur compounds (VSCs) produced from bacterial metabolism in QDs biosynthesis, such as dimethyl sulfide (DMS), dimethyl disulfide (DMDS) and methanethiol (MeSH) (Schulz and Dickschat, 2007), has not been studied yet.
Recently, intracellular biosynthesis of CdS QDs has been reported at low temperatures (15°C) using Antarctic bacteria from the Pseudomonas genus. Nanoparticle synthesis was performed in the presence of CdCl2 without any additional sulfur sources. The mechanism of CdS formation was attributed to the production of sulfide from H2S by Cys desulfhydrase in all strains tested except for Pseudomonas fragi GC01 strain (Gallardo et al., 2014). In this work, we study the link between the production of VSCs and the biosynthesis of CdS nanoparticles in Pseudomonas fragi GC01. We also carry out for the first time the biosynthesis of QDs in bacteria using Cys and Met as sole sulfur sources.
Materials and Methods
Bacterial Strains and Culturing
Strains used in this work were P. fragi GC01 (Gallardo et al., 2014), Pseudomonas deceptionensis M1T wild type, P. deceptionensis M1T megL– and P. deceptionensis M1T mddA– (Carrión et al., 2011, 2015). Bacterial strains were grown in Luria-Bertani (LB; complete) medium (Sambrook and Russell, 2001) for 24 h or in M9 (minimal) medium (Sambrook and Russell, 2001) for 48 h (stationary phase culture) at 28°C. P. deceptionensis M1T megL and mddA mutants were grown in media containing kanamycin (20 μg mL–1) and spectinomycin (800 μg ml–1), or gentamicin (5 μg mL–1), respectively.
Evaluation of CdS QDs Biosynthesis
Nanoparticle biosynthesis by bacteria was performed following the protocol described by Monrás et al. (2012) and Gallardo et al. (2014). Briefly, bacteria were grown in M9 minimal medium supplemented with 0.25 mM of six different sulfur sources [sulfate (MgSO4), sulfite (Na2SO3), thiosulfate (Na2O3S2), sulfide (Na2S), Met and Cys] for 48 h. Then, cultures were centrifuged at 10,000 rpm for 5 min (Himac CT15E centrifuge). Bacterial pellets were resuspended in CdCl2 (10 μg mL–1) and incubated at 28°C for another 48 h before assaying the production of nanoparticles. Nanoparticle formation was assessed using a short-wave UV-transilluminator at λexcitation = 360 nm. Analyses were done with three biological replicates, and samples with no CdCl2 added were included as a control.
Sulfide Detection Assay
The production of H2S was evaluated using lead acetate-soaked papers, as described by Shatalin et al. (2011). The assay was performed using 1 mL of bacterial cultures in microcentrifuge tubes and a lead acetate paper attached under the cap. Briefly, bacterial strains were grown on M9 minimal medium at 28°C until reaching an OD600∼0.8. Then, cultures were washed with fresh M9 medium with no sulfur sources. Bacterial pellets were resuspended and inoculated into M9 medium containing sulfate, sulfite, thiosulfate, sulfide, Met and Cys (0.5 mM) as sole sulfur sources in the presence or absence of CdCl2 (10 μg mL–1). Tubes were covered with a paper embedded in lead acetate (100 mM) and incubated at 28°C for 2 h before detecting sulfides as described in Gallardo et al. (2014). Controls consisted of samples incubated with no sulfur sources.
Evaluation of Extracellular Biosynthesis of CdS QDs
The study of extracellular biosynthesis of nanoparticles was carried out following the protocol described by Monrás et al. (2012) and Gallardo et al. (2014) with some modifications. Briefly, cells were grown for 48 h in M9 medium at 28°C. Then, cultures were centrifuged at 10,000 rpm for 5 min (Himac CT15E centrifuge) and bacterial pellets were resuspended in fresh M9 medium supplemented with CdCl2 (20 μg mL–1) and a sulfur source such as Cys (0.1–2 mM), SO42–, SO32–, S2O32– or Met (0.25–50 mM). After 0.5–2 h of incubation with Cys and 72 h with the other sulfur sources at 28°C, cells were centrifuged for 5 min at 10,000 rpm. Fluorescence of the supernatant was measured using a short-wave UV-transilluminator at λexcitation = 360 nm. Cultures of bacterial strains were set up in triplicate and samples with no CdCl2 were used as controls.
Purification of Biosynthesized CdS Nanoparticles
Pseudomonas fragi GC01 was grown in M9 medium at 28°C in the presence of Cys (2 mM) or Met (40 mM) as sole sulfur sources to study the production of extracellular QDs. A total of 10 mL of culture was taken after 1, 2 and 3 h incubation with Cys and after 72 h incubation with Met. Samples were then centrifuged 15 min at 6,000 rpm (PrO-Research K241R centrifuge) before collecting the fluorescent supernatants. Supernatants were filtered through 0.2 μm filters (BioLab) to remove cellular debris. Filtered supernatant was then concentrated to 100 μL using a 10 KDa membrane (Amicon). Concentrated nanoparticle suspension was lyophilized overnight and stored at 4°C until use.
Characterization of CdS Nanoparticles
Absorption and Fluorescence Spectroscopy
Absorbance and fluorescence spectra of purified nanoparticles were determined with a multiplate reader Synergy H1 M (BioTek). Measurements were performed at room temperature and absorbance spectra were recorded in the range of 300 to 700 nm, whereas emission spectra were obtained using λexcitation = 360 nm and recorded in the range of 390 to 700 nm (Gallardo et al., 2014; Plaza et al., 2016).
Quantum Yield (QY) Determination
The quantum yield (QY) of purified CdS QDs was determined following the protocol described by Venegas et al. (2017) and Bruna et al. (2019). Briefly, the fluorescence of two samples of QDs with different absorbances (between 0.01 and 0.1) was determined after excitation at 360 nm. The procedure was applied for yellow and red nanoparticles (obtained from Cys and Met, respectively) dissolved in water and as reference fluorescein dissolved in ethanol (QY = 0.97). Emission spectra were measured to obtain the integrated fluorescence intensity (IFI, defined as the area of the fluorescence spectrum), and this value was plotted versus the absorbance of the solution. The slope of both curves (m) and the refractive index of the solvents (n) (water: 1.333 and ethanol: 1.335) were used to calculate the QY of CdS QDs considering fluorescein as reference (R). The following equation was used:
Dynamic Light Scattering (DLS) Measurements
The hydrodynamic size, zeta potential and polydispersity index (PDI, which is an indicative of size heterogeneity) were evaluated by dynamic light scattering (DLS) using the Zetasizer Nano ZS (Malvern Instruments Co., United Kingdom). Polystyrene cuvettes with a path length of 10 mm at 25°C and a refraction index of 2.6 were used.
Atomic Force Microscopy (AFM)
Atomic force microscopy (AFM) images of nanoparticles were obtained using an AFM/SPM Series 5500 dynamics microscope (Agilent Technologies). Nanoparticles were measured using a non-contact mode probe of 4 nm thickness, 125 μm in length, 30 μm frequency of 320 kHz resonance and a force constant of 42 N/m. Samples were 1/100 diluted and drop-casted over a silicon substrate before determining the average size of the nanoparticles at solid state using the WSxM 5.0 software, by automatically counting an average number of 40 particles per image for each CdS sample (Horcas et al., 2007).
Transmission Electron Microscopy (TEM)
The TEM analysis of nanoparticles was performed at the Center for the Development of Nanoscience and Nanotechnology (CEDENNA), using a HITACHI HT 7700 transmission electron microscope, operating with a Tungsten filament at an accelerating voltage of 120 kV, allowing a resolution of 0.2 nm. Samples (powder) were dispersed in distilled water using an ultrasonic bath and deposited on a copper TEM grid (200 mesh) coated with Formvar/carbon. Water was subsequently evaporated at room temperature.
Energy Dispersive X-Ray (EDX)
The elemental composition of the synthesized nanoparticles was determined with a scanning electron microscope (JSM-6010LA) operating with high vacuum, at an accelerating voltage of 20 kV and coupled to an energy-dispersive X-ray spectroscope (EDS, JEOL, JSM-6010LA).
X-Ray Diffraction (XRD)
X-ray diffraction (XRD) measurements were performed using a STADI-P (Stoe®, Darmstadt, Germany) diffractometer coupled to a Mythen 1K (Dectris®, Baden, Switzerland) detector that collected X-ray photons. Data were recorded at room temperature with powdered samples, in the 2θ range from 5.0° to 64.265°, 50 kV, 40 mA and using MoKα1 (λ = 0.7093 Å). Peaks were identified using published and standardized structures from the Inorganic Crystal Structure Database (ICSD).
X-Ray Photoelectron Spectroscopy (XPS)
X-ray photoelectron spectroscopy (XPS) measurements were performed using an X-ray photoelectron spectrometer (Thermo K-alpha spectromether, MA, United States) with a 72 W monochromated Al K-alpha+ source (E = 1486.6 eV) using 3000 eV, medium current, a spot size of 400 μm and 10 nm depth. Analyses were performed in two different points of powdered samples and the elemental composition was analyzed using CasaXPS software.
Assays of Microbial H2S, MeSH, DMS, and DMDS Production
To measure H2S, MeSH, DMS, and DMDS production, Pseudomonas strains were grown overnight at 28°C in M9 minimal medium. Cultures were then adjusted to an OD600 = 0.3 and diluted 10-fold into 2 mL vials containing 300 μL of M9 medium supplemented with 0.25, 0.5, 1, 2, and 4 mM sulfate, Cys and Met as sole sulfur sources. Samples were incubated at 28°C for 48 h before measuring VSCs by gas chromatography using a flame photometric detector (Agilent 7890A GC fitted with a 7693 autosampler) and a HPINNOWax 30 m × 0.320 mm capillary column (Agilent Technologies J&W Scientific). An eight-point calibration curve of H2S, MeSH, DMS and DMDS standards were used as described in Carrión et al. (2015). Protein content in the cells was determined by the Bradford method (BioRad). Production of H2S, MeSH, DMS and DMS was expressed as mmol per mg protein.
To estimate the production of VSCs under nanoparticle biosynthesis conditions, cells were adjusted to an OD600 = 0.8 and inoculated into 300 μL of M9 medium supplemented with 2 mM sulfate, Cys or Met in the presence or absence of CdCl2 (20 μg mL–1). Samples were then incubated for 1, 24 and 48 h at 28°C in 2 mL sealed vials before quantifying the VSCs produced by gas chromatography as above.
Data Analysis
Standard deviations (SD) of the results were expressed as mean (±). Statistical analysis of VSC production was carried out using GraphPad Prism 6.0 (GraphPad Software, Inc.). Error bars represent SD (n = 3). Student’s t-test was performed considering p < 0.05. Statistical significance was indicated as follows: *p < 0.05, ∗∗p < 0.01 and ∗∗∗p < 0.001; ns, not significant.
Results
QDs Biosynthesis and Hydrogen Sulfide Production
Pseudomonas fragi GC01 was able to use SO42–, SO32–, S2–, S2O32–, Met and Cys as sole sulfur sources, although maximal growth was obtained with the former (data not shown). This suggests that these molecules could act as substrates to generate the S2– required for the synthesis of CdS nanoparticles. To further investigate this hypothesis, the ability of P. fragi GC01 to biosynthesize CdS QDs from different S-containing molecules was evaluated. After 48 h exposure to biosynthetic conditions (0.25 mM sulfur source and 10 μg mL–1 CdCl2), P. fragi GC01 cell pellets showed fluorescence when excited with UV light (λ = 360 nm) (Figure 1A). As previously reported, the generation of fluorescent pellets in cells exposed to Cd is evidence of intracellular production of CdS QDs (Monrás et al., 2012; Gallardo et al., 2014; Plaza et al., 2016). A slightly fluorescent supernatant was only observed in the presence of Cys, indicating that extracellular QDs biosynthesis occurred. Also, this result suggests that no VSCs involved in the extracellular production of CdS are generated by cells under the other conditions tested (Figure 1B).
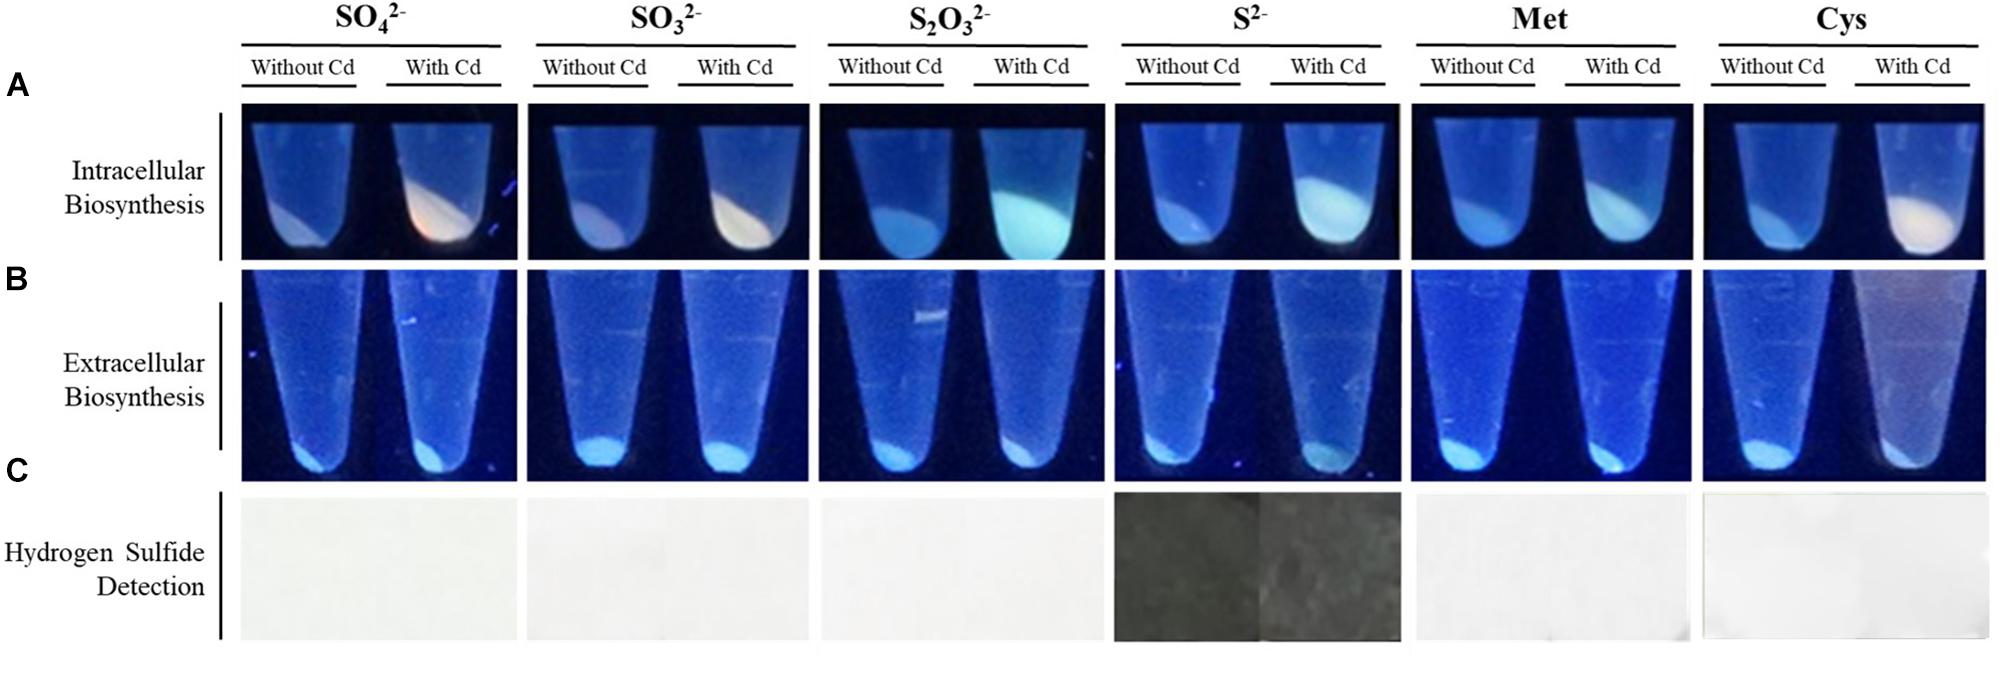
Figure 1. Biosynthesis of CdS QDs by P. fragi CG01 and hydrogen sulfide (H2S) production in the presence of different sulfur sources at 28°C. (A) Fluorescence of bacterial pellets exposed to biosynthesis conditions (CdCl2 10 μg mL–1) using 0.25 mM SO42–, SO32–, S2O32–, S2–, Met or Cys as sole sulfur sources after 48 h incubation. (B) Fluorescence of bacterial supernatant after UV light exposure. P. fragi CG01 was exposed to biosynthesis conditions with SO42–, SO32–, S2O32–, S2–, Met or Cys as sole sulfur sources at 0.5 mM for 2 h. (C) Production of H2S by P. fragi CG01 was observed as a dark precipitate on white papers treated with a lead acetate solution. Cells were grown with 0.5 mM of SO42–, SO32–, S2O32–, S2–, Met or Cys as sole sulfur sources for 2 h in minimal medium, in the presence or absence of CdCl2 (10 μg mL–1).
In general, most biosynthesis methods described to date require sulfur-containing molecules with high affinity for Cd2+ such as antioxidant thiols or the VSC H2S (Holmes et al., 1997; Bai et al., 2009b; Monrás et al., 2012; Gallardo et al., 2014). However, as reported in our previous work, QDs biosynthesis by P. fragi GC01 on LB media were not directly related to the production of H2S (Gallardo et al., 2014). Based on this, we studied the production of H2S by P. fragi GC01 and obtained results revealed that no H2S is generated when SO42–, SO32–, S2O32–, Met or Cys are used as sulfur sources (Figure 1C). As expected, H2S was only observed when P. fragi GC01 cultures were exposed to S2–, probably as a consequence of the volatilization of sulfide from the medium as a consequence of bacterial activity.
Extracellular Biosynthesis of CdS QDs
Based on the result obtained regarding the effect of Cys in the extracellular biosynthesis of CdS QDs by P. fragi GC01 (Figure 1B), we decided to evaluate new biosynthesis conditions. Extracellular biosynthesis of CdS QDs was observed in the presence of CdCl2 (20 μg mL–1) and Cys at concentrations ranging from 0.1 to 2 mM (Figure 2A). The intensity of the fluorescence in the supernatants indicated that the best condition for extracellular CdS QDs biosynthesis was 2 mM Cys and 20 μg mL–1 CdCl2 (Figure 2A). Using this condition, we evaluated the biosynthesis of QDs by P. fragi GC01 at different times to study the generation of different emission colors, a unique characteristic of QDs associated with time-dependent nanocrystal growth (Ulloa et al., 2016; Venegas et al., 2017; Bruna et al., 2019). Green, yellow and orange fluorescence colors were observed in culture supernatants of P. fragi GC01, confirming the extracellular generation of CdS QDs under this condition (Figure 2B).
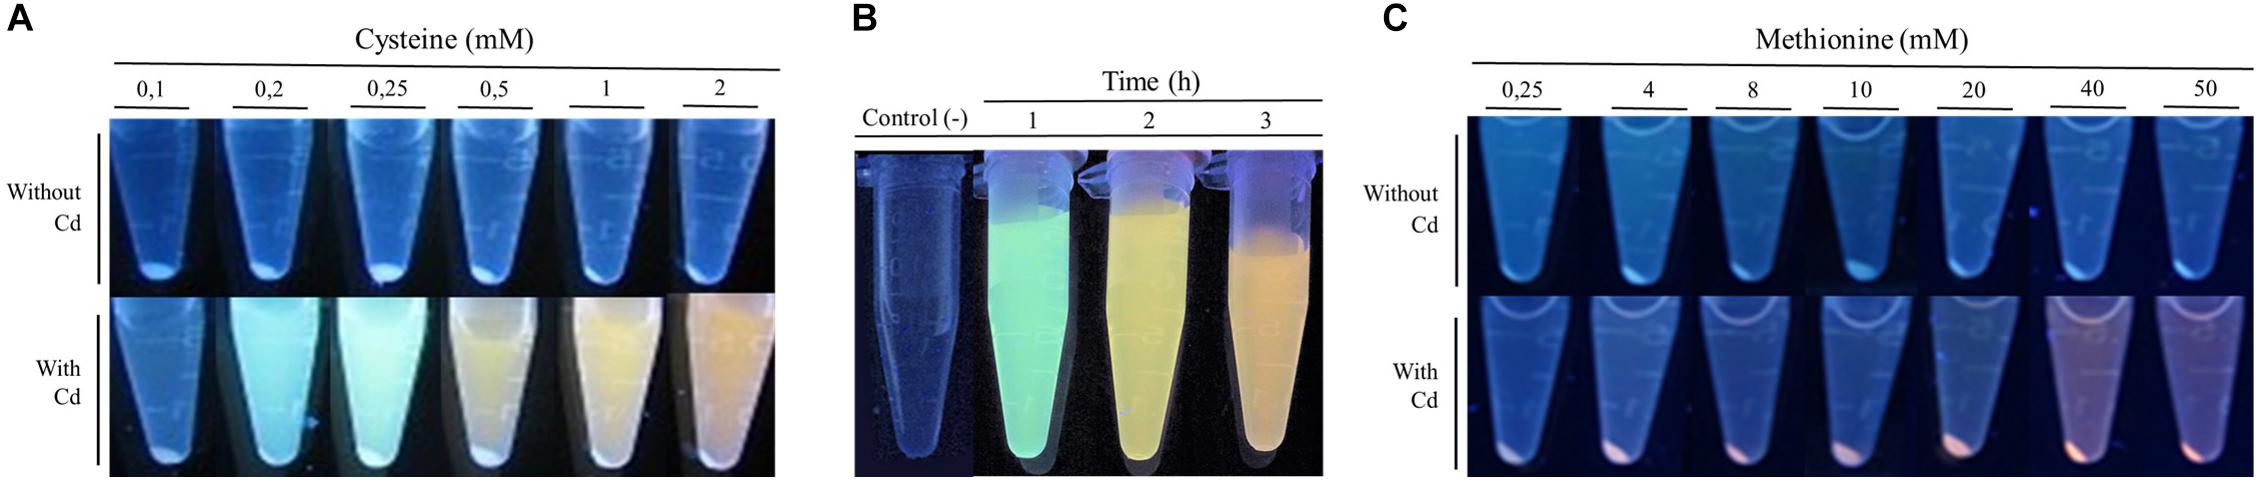
Figure 2. Fluorescence of P. fragi CG01 supernatants under biosynthesis conditions (CdCl2 20 μg mL–1) after UV light exposure as indication of extracellular biosynthesis of Cds QDs. (A) Biosynthesis in minimal medium from various Cys concentrations in the presence or absence of CdCl2 (20 μg mL–1) after 2 h of incubation. (B) Fluorescence of bacterial supernatants of cells exposed to biosynthesis conditions (Cys 2 mM and CdCl2 20 μg mL–1) at different incubation times. (C) Fluorescence of bacterial supernatant of P. fragi CG01 grown in minimal medium with various concentrations of Met in the presence or absence of CdCl2 (20 μg mL–1) for 72 h.
In addition, we evaluated the effect of SO42–, SO32–, S2O32– or Met on the extracellular QDs biosynthesis by P. fragi GC01 in the presence of CdCl2 (20 μg mL–1) and using different concentrations of the S-sources (0.25–50 mM). Fluorescence was only observed in the supernatants of cultures incubated with 40 and 50 mM Met. Supernatants of these cultures were red after 72 h incubation (Figure 2C). However, fluorescent bacterial pellets were observed at all Met concentrations tested, suggesting the formation of intracellular QDs under these conditions (Figure 2C).
Characterization of Biosynthesized CdS QDs
Quantum dots produced in supernatants of P. fragi GC01 cultures exposed to Cys and Met were purified and characterized. Specifically, the stability (based on the zeta potential) and the average hydrodynamic size of biosynthesized QDs were assessed by DLS. Biosynthesized QDs obtained with Cys had PDI values ranging from 0.50 to 0.53 and an average zeta potential (mean ± standard deviation) from −20.67 ± 0.64 mV to −15.70 ± 3.18, whereas nanoparticles synthesized using Met as sole sulfur source presented a PDI of 0.38 ± 0.04 and a zeta potential of −33.57 ± 2.76 mV. Moreover, the average nanocrystal size was below 36 nm in biosynthesis conditions with Cys (2 mM) and Met (40 mM) (Table 1).
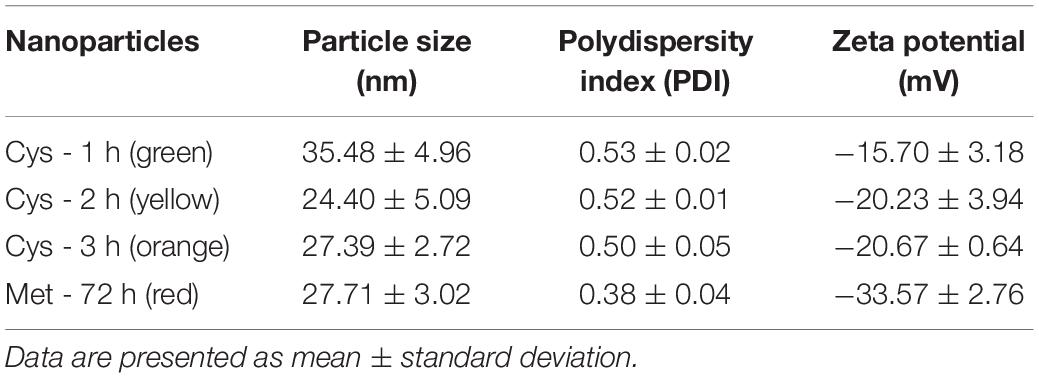
Table 1. Particle size, PDI and Zeta potential of CdS QDs biosynthesized by P. fragi GC01 at different incubation times with cysteine (Cys) and after 72 h incubation using methionine (Met) as sole sulfur source.
In addition to the hydrodynamic size, a quantitative size analysis of the biosynthesized CdS QDs was implemented with atomic force microscopy (AFM) and transmission electron microscopy (TEM). The AFM topological images of nanoparticles synthesized with Cys and Met as sole sulfur source were analyzed (Figures 3E,F). This technique allowed us to evaluate the average size of biosynthesized nanoparticles in solid-state. The average diameters of QDs produced in the presence of Cys were 28.45 ± 0.87, 15.28 ± 1.26, and 17.04 ± 1.53 nm for green, yellow and orange nanoparticles, respectively, (Figures 3A–C), while the average diameter of QDs obtained with Met was 22.70 ± 0.73 nm (Figure 3D). The QDs with green fluorescence color, corresponding to the nanoparticles obtained after 1 h of synthesis (Figure 3A), were larger than the rest of the QDs, despite being obtained in a shorter time of synthesis and their fluorescence color corresponding to smaller nanoparticle sizes. This could be due to the high polydispersity index (PDI) of the biosynthesized nanoparticles (Table 1) probably as consequence of the organic cover, in addition to the low stability of the green nanoparticles, causing their agglomeration. TEM analysis of CdS nanoparticles revealed that the nanoparticles produced by P. fragi GC01 had a spherical-like morphology with a homogenous size distribution (Figure 4). TEM images determined that the average sizes of QDs produced in the presence of Cys were 2.31 ± 0.51, 2.59 ± 0.71, and 2.59 ± 0.78 nm for green, yellow and orange fluorescent nanoparticles, respectively, (Figures 4A–C). The diameter of QDs prepared with Met was ∼16 nm, and showed the presence of planes, evincing the presence of a crystalline structure (Figure 4D). The small size of the nanoparticles obtained with Cys (∼2 nm) did not show clear differences between green, yellow and orange nanoparticles. However, TEM analysis confirmed the formation of QD-type nanoparticles with a size below 20 nm (Rengers et al., 2019).
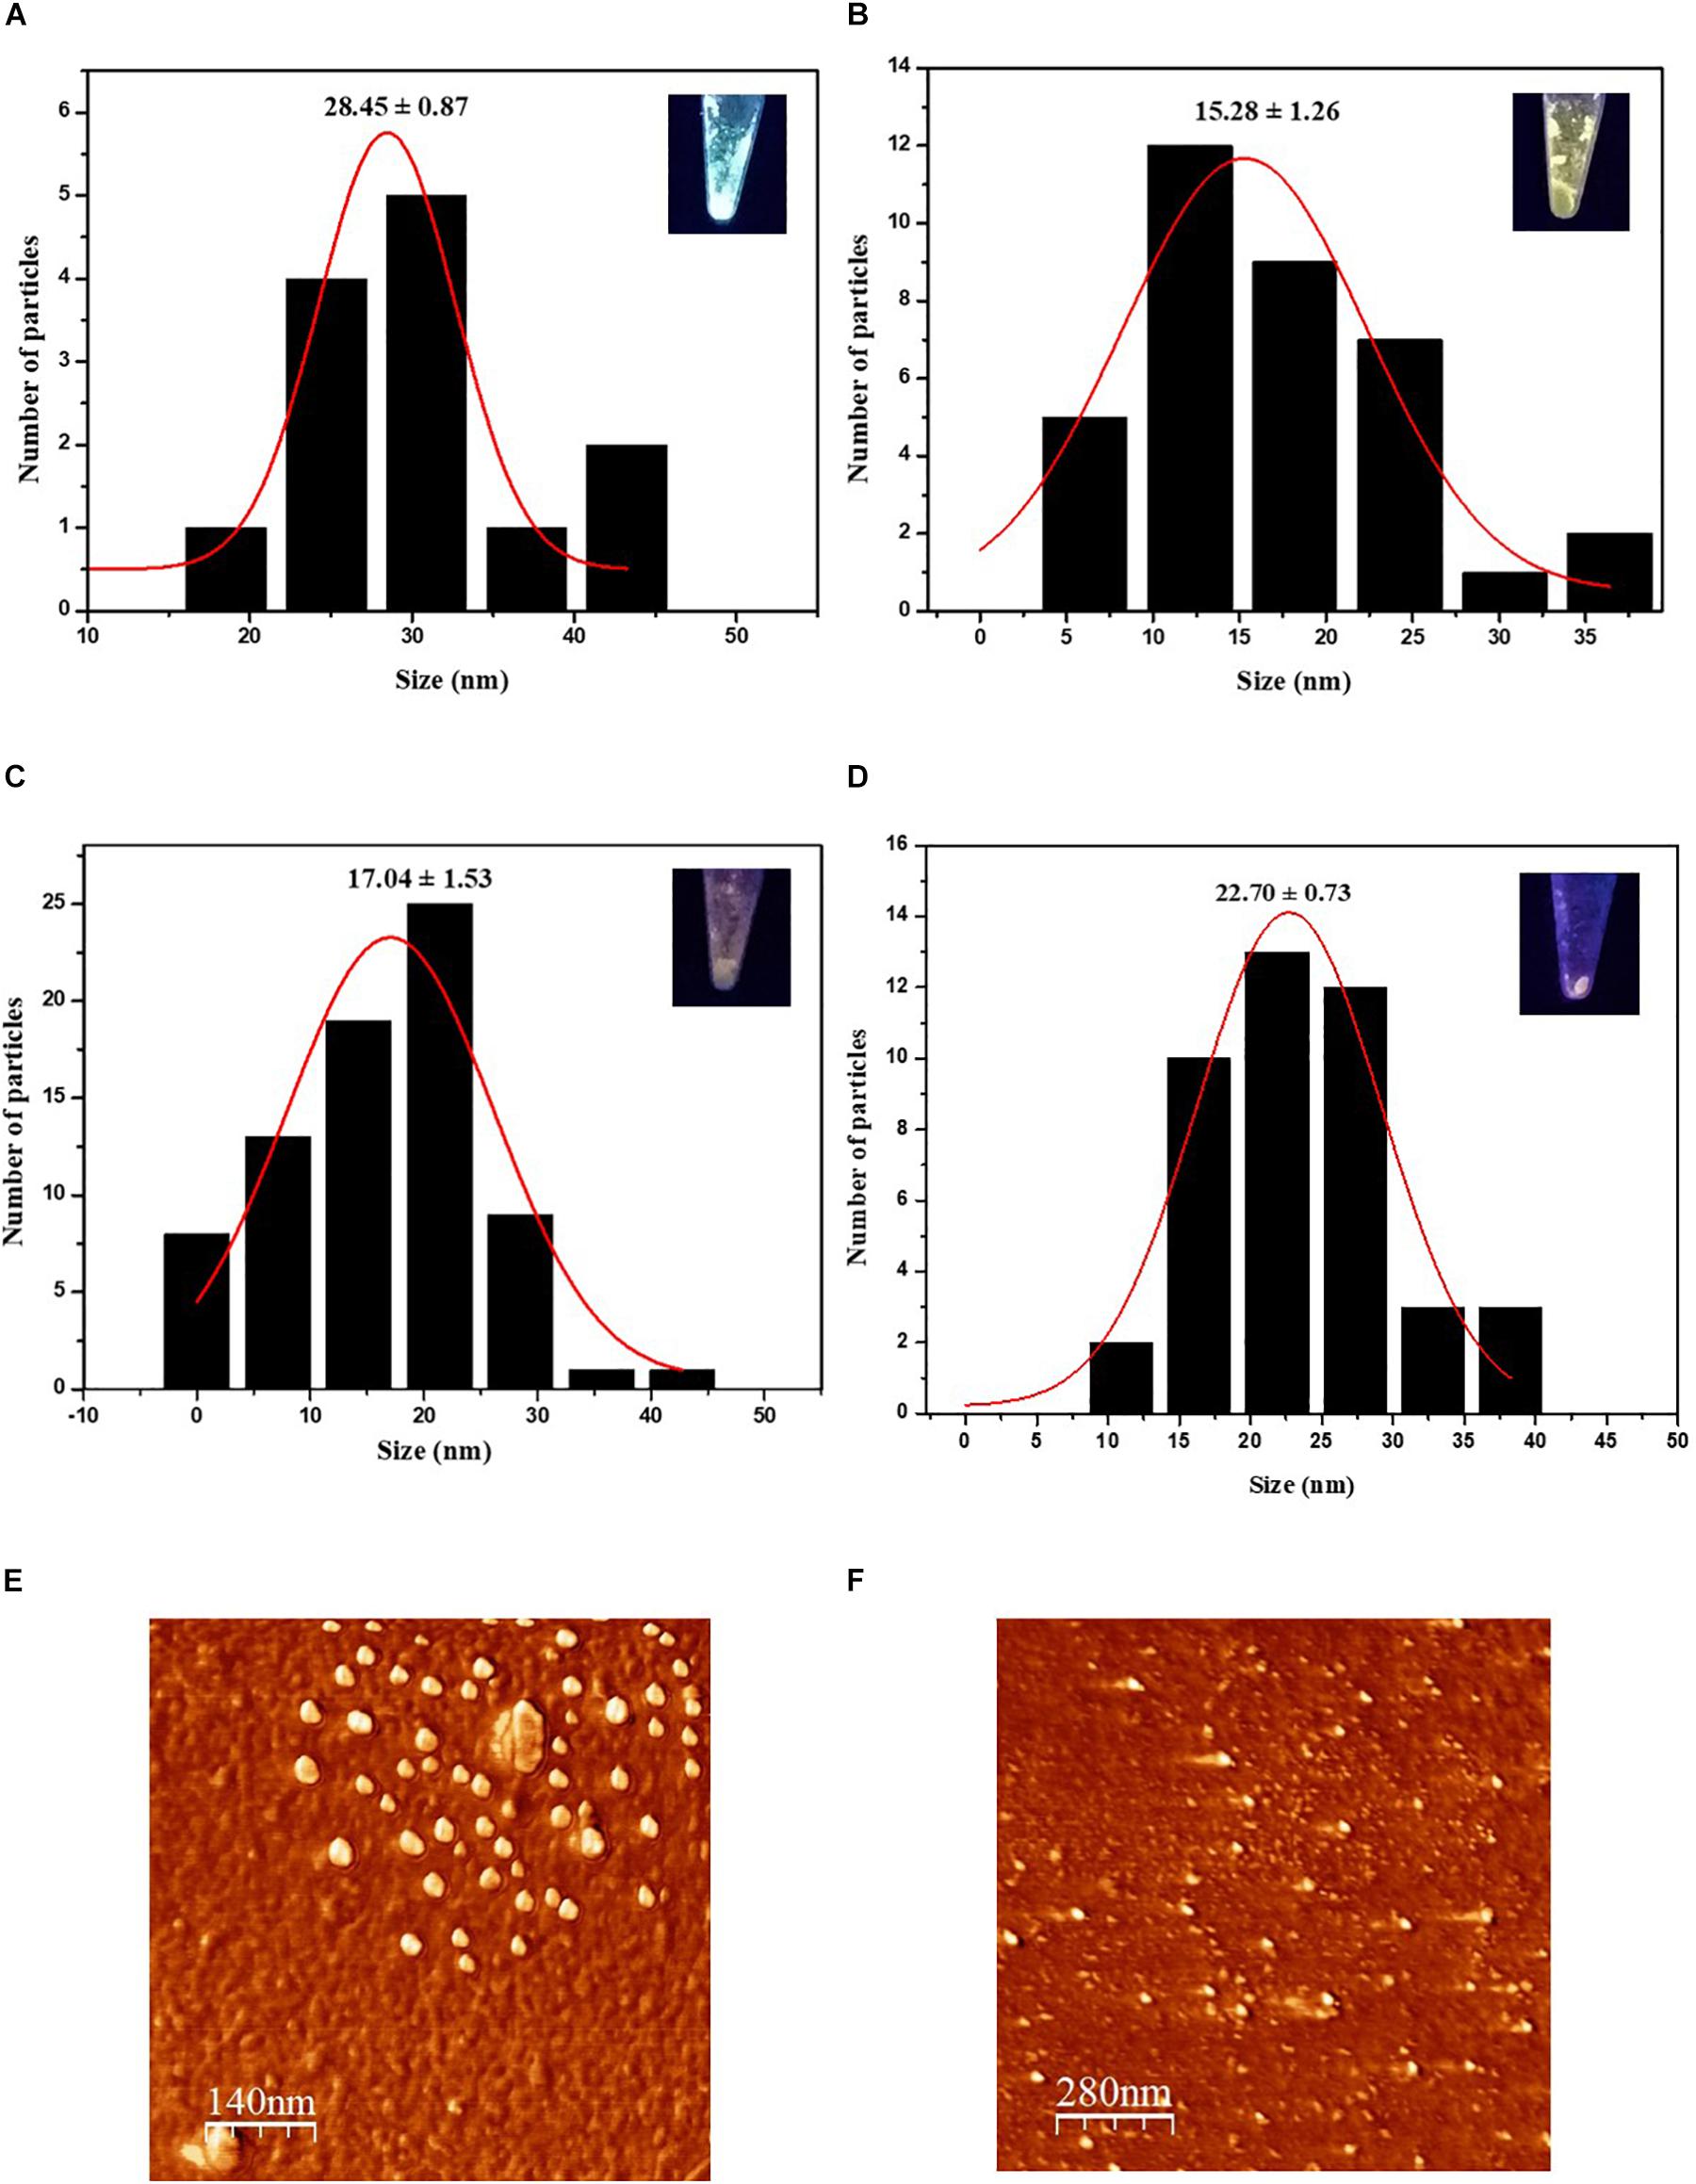
Figure 3. Characterization of CdS nanoparticles biosynthesized by P. fragi GC01 by AFM. AFM histogram of average solid-state size of nanoparticles synthesized from Cys showed (A) green, (B) yellow and (C) orange fluorescence (D). AFM histogram of average solid-state size of nanoparticles synthesized with Met. 2D AFM topographical image of CdS nanoparticles synthesized with Cys for 3 h (orange) (E) and Met after 72 h (F).
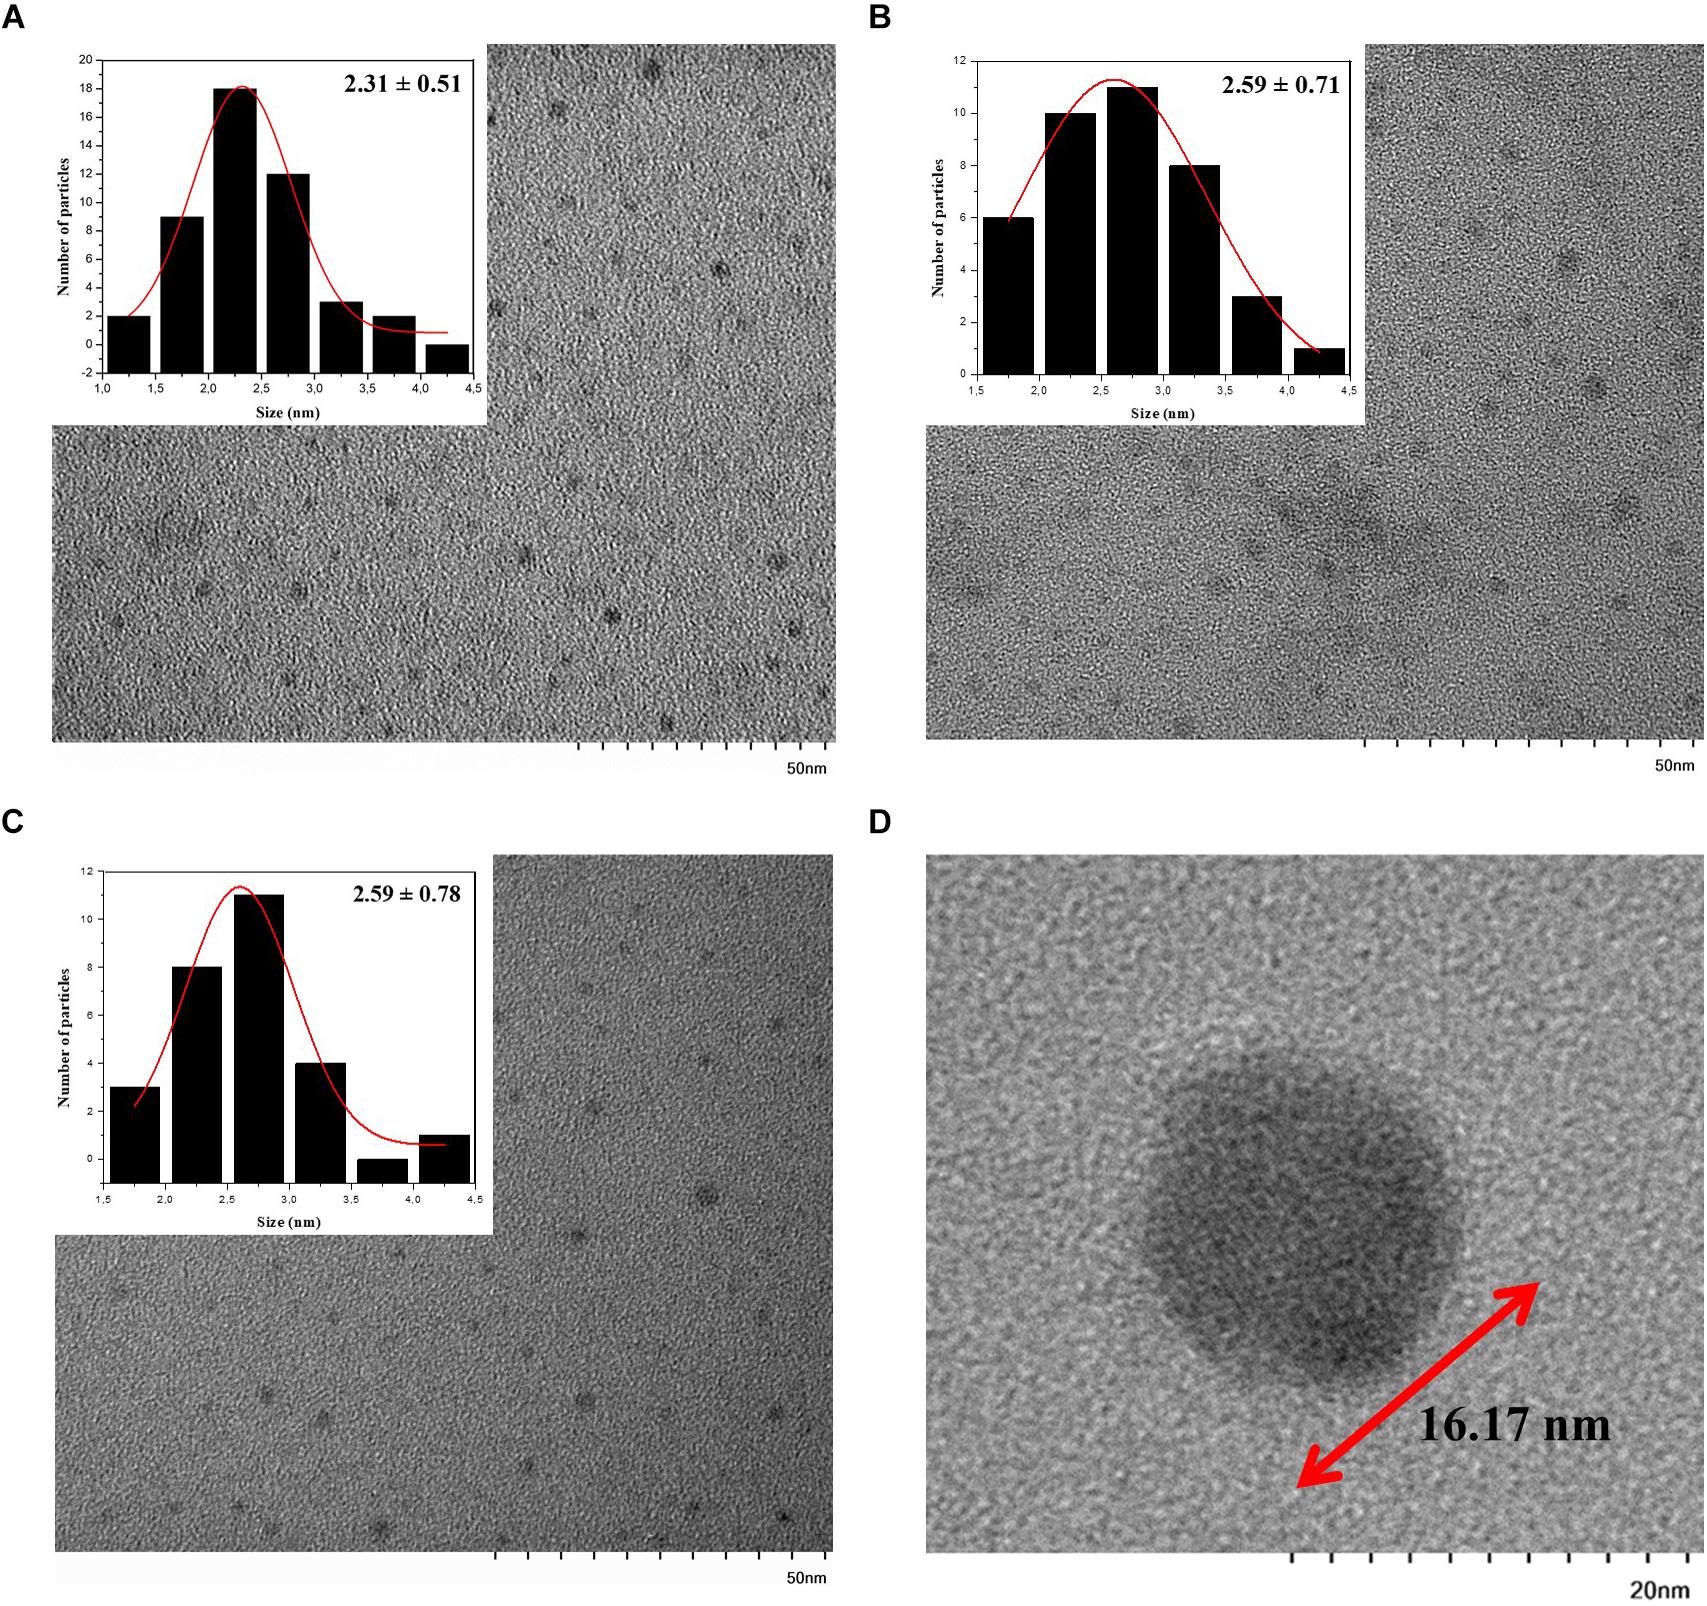
Figure 4. TEM image of CdS QDs biosynthesized with Cys or Met (inset: size histogram). QDs produced in presence of Cys and exhibiting (A) green (B) yellow and (C) orange fluorescence were evaluated. (D) CdS QDs biosynthesized with Met.
X-ray diffraction measurements were performed to evaluate the crystal nature of CdS QDs. Figures 5A,B show the XRD patterns for CdS nanoparticles prepared with Cys and Met. Three characteristic peaks were observed at 12.85°, 21.06°, and 32.69°, respectively, (111, 220 and 311 planes, indexed as cubic CdS). Bai et al. (2009a, b) obtained similar results for CdS nanoparticles synthesized by Rhodobacter sphaeroides and Rhodopseudomonas palustris (Bai et al., 2009a, 2009b). Additionally, defined peaks were observed for CdS nanoparticles obtained with Cys (Figure 5A). Conversely, nanoparticles produced in the presence of Met displayed broader peaks, indicating defects in the crystal and a larger quantity of amorphous material, suggesting a thicker organic coating (Figure 5B). This could be consequence of high amounts of organic molecules attached to the nanoparticle surface, resulting in a crystal-amorphous interfacial effect (Muntaz Begum et al., 2016).
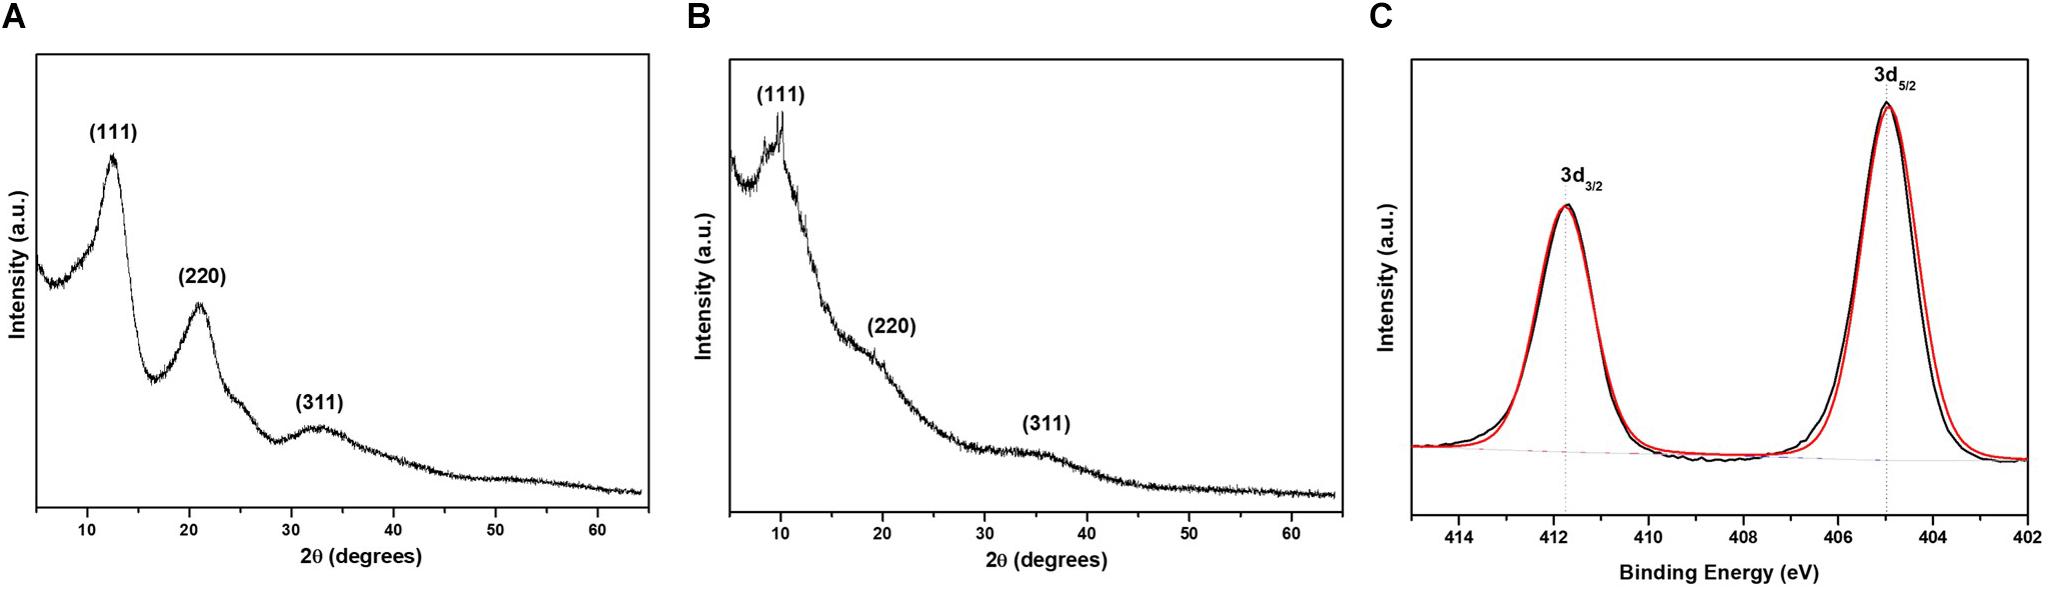
Figure 5. X-ray diffraction and X-ray photoelectron spectroscopy of QDs biosynthesized by P. fragi GC01. XRD pattern of CdS nanoparticles synthesized in cultures in the presence of (A) Cys and (B) Met as sole sulfur sources. (C) XPS spectra of Cd 3d region of CdS QDs obtained with Cys.
X-ray photoelectron spectroscopy is a measurement of the surface of the sample, able to access only a depth of 10 nm. Spectra of CdS QDs produced from Cys and Met were evaluated with this technique. Survey spectra of CdS nanoparticles biosynthesized with Cys presented C 1s, Cd 3d, Na 1s, O 1s, P 2p, and S 2p (Supplementary Figure S1A). Cd 3d deconvoluted peaks (Figure 5C) indicated binding energies of 412 and 405 eV, corresponding to Cd3/2 and Cd5/2 as reported by Marusak et al. (2016) and Richards et al. (2016). Survey spectra of CdS obtained from Met contained similar elements, but it was not possible to identify Cd 3d peaks (Supplementary Figure S1B). This is probably due to the thick organic surface coating, which avoids Cd detection by XPS. Despite XPS not allowing the identification of Cd in QDs biosynthesized in the presence of Met, XRD confirmed the formation of cubic CdS QDs and indicated the presence of amorphous coating on nanoparticles synthesized from Met (Figure 5B).
Spectroscopic properties of nanoparticles produced by P. fragi GC01 after 1 and 2 h of incubation under biosynthesis conditions with Cys (green and yellow nanoparticles, respectively) and after 72 h of incubation with Met (red nanoparticles) were evaluated. The absorbance spectra of the purified nanoparticle fractions showed a peak with maximum absorption at 360 nm for green nanoparticles, 370 nm for yellow nanoparticles and 380 nm for red nanoparticles (Figure 6A). This is in agreement with previous reports of biosynthesized CdS nanoparticles (Mi et al., 2011; Yang et al., 2015; Plaza et al., 2016; Bruna et al., 2019). Regarding the emission spectra of purified samples, emission peaks between 470 and 530 nm, 490 and 550 nm and 550 and 620 nm were determined for green, yellow and red nanoparticles, respectively, (Figure 6B). As expected, different emission spectra were observed for Cys green (1 h) and yellow (2 h) CdS QDs, with maximum fluorescence peaks at 500 and 530 nm, respectively, (Figure 6B). Additionally, red nanoparticles (Met 72 h) showed an emission spectrum with maximum fluorescence peaks at 570 nm (Figure 6B). The quantum yields (QY) of the CdS QDs biosynthesized from Cys and Met were obtained by comparison with the QY of fluorescein in ethanol (standard). The quantum yields for the CdS QDs with Cys (2 h) and Met (72 h) were 21.04 and 7.81%, respectively.
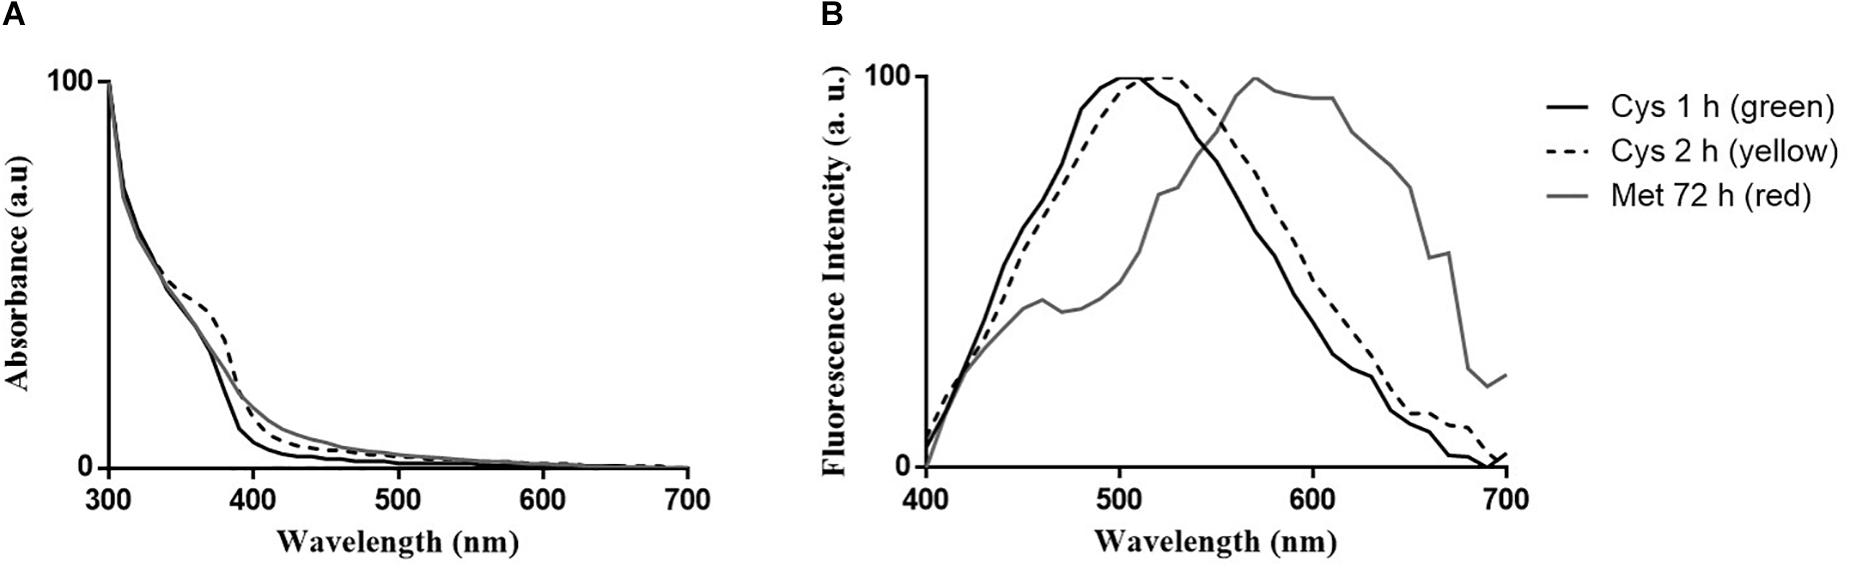
Figure 6. Optical properties of CdS QDs biosynthesized by P. fragi GC01. (A) UV-vis absorption spectra of purified QDs and (B) fluorescence emission spectra (λexcitation = 360 nm).
The composition of biosynthesized nanoparticles was determined by EDS. QDs obtained after 3 h (orange) of biosynthesis with Cys (Supplementary Figure S2) showed Cd and sulfur (S) element signals. In addition, signals corresponding to oxygen (O) and carbon (C) were also detected, probably as part of the organic cover of QDs. It should be noted that C signal could come from both the coating of the nanoparticle or from the carbon tape used in the SEM sample holder. This result was observed in all the nanoparticles biosynthesized in the presence of Cys (Supplementary Figure S2).
Production of VSCs by P. fragi GC01
Pseudomonas fragi GC01 was able to produce intracellular CdS QDs when grown on different sulfur compounds and extracellular QDs when Cys and Met were used as sole sulfur sources (see above). However, it was not possible to relate the formation of CdS nanoparticles to the production of H2S under the conditions tested. Therefore, to elucidate the source of S–2 involved in QD biosynthesis by P. fragi GC01, we analyzed the VSCs produced by this strain. Specifically, the ability of P. fragi GC01 to release H2S, MeSH, DMS and DMDS was evaluated when SO42–, Cys or Met were used as sole sulfur source for bacterial growth and CdS biosynthesis. As shown in Figure 7A, P. fragi GC01 produced H2S, MeSH and DMS in the presence of SO42–, Cys and Met, with concentrations of MeSH between 2- to 600-fold and 6- to 28-fold higher than those of H2S and DMS, respectively. Moreover, cells grown with sulfate or Cys produced low levels of VSCs, even at high concentrations of substrate (below 42 mmol per mg protein) (Figure 7A). Finally, maximal formation of DMS and MeSH was observed when Met was used as sole sulfur source (190 and 5400 mmol per mg protein), and this was the only condition in which DMDS was detected (Figure 7A).
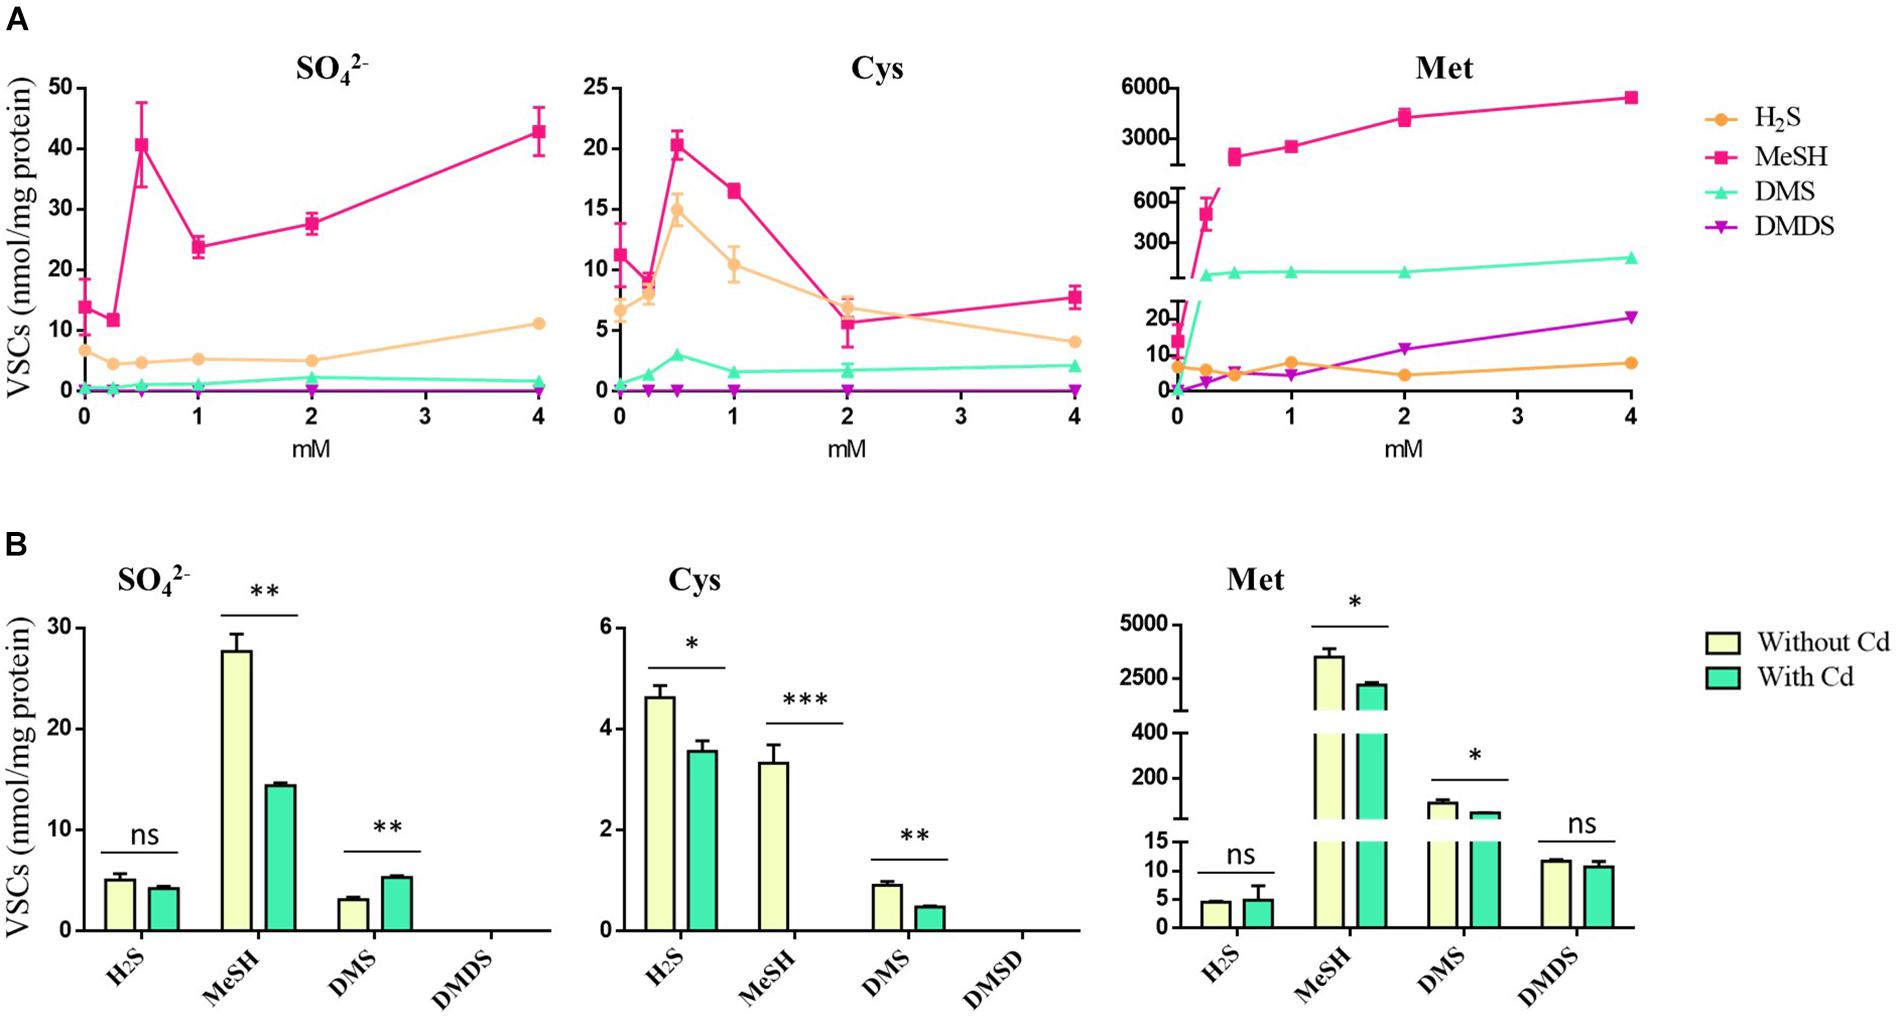
Figure 7. VSCs produced by P. fragi GC01 from SO42–, Cys and Met under biosynthesis conditions. (A) VSC production from sulfur sources with concentrations ranging from 0 to 4 mM after 48 h of incubation. (B) VSC production under biosynthesis conditions with different sulfur sources in the presence or absence of CdCl2 (20 μg mL–1) after 48 h. Results represent the average of three biological replicates with their respective standard deviations. Student’s t-test (P < 0.05): Comparison between treatments with and without cadmium (Cd). Statistically significant differences are shown as: ∗∗∗P < 0.001, ∗∗P < 0.01, *P < 0.05.
The production of VSCs by P. fragi GC01 under QDs biosynthesis conditions (presence of sulfur source 2 mM and 20 μg mL–1 CdCl2) after 48 h of incubation was also tested (Figure 7B). This selection was based on the ability to biosynthesize extracellular QDs when this strain was supplemented with Cys (2 mM) after 1 h, and intracellular biosynthesis from Met and SO42– (2 mM) after 48 h. Low levels of H2S were determined in all sulfur sources analyzed, and a decrease in H2S was observed after Cd exposure (biosynthesis conditions) when Cys was used as a sulfur source (Figure 7B). MeSH production from all sulfur compounds decreased in the presence of Cd, suggesting that this gas could be a source of S2– that interacts with Cd2+. In addition, DMS levels decreased in incubations with Cd and the sulfur sources Cys or Met. Finally, no statistically significant differences (ns, P > 0.05) in DMDS production were determined between treatments with and without Cd (Figure 7B). These results suggest that H2S and MeSH are involved in the generation of CdS QDs, providing directly or indirectly the S2– that interacts with Cd2+ to form the nanocrystal seed.
VSC Catabolic Pathways Associated to Biosynthesis of CdS QDs in Pseudomonas deceptionensis
Pseudomonas deceptionensis M1T was used to study the possible relationship between nanoparticle biosynthesis and VSC catabolism, since its genome has been sequenced and the pathways of DMS and MeSH production elucidated (Carrión et al., 2015). Specifically, Carrión et al. (2015) showed that MeSH was synthesized in this strain from Met in a reaction catalyzed by methionine gamma lyase (encoded by megL). In turn, MeSH was converted into DMS via a methyltransferase termed MddA. P. deceptionensis M1T wild type, P. deceptionensis M1T megL– (unable to produce MeSH from Met) and P. deceptionensis M1T mddA– (unable to synthesize DMS from MeSH) (Carrión et al., 2015) were used to study the production of extra- and intracellular nanoparticles in the presence of Cys or Met, using the same conditions as in P. fragi GC01 (Cys or Met 2 mM and CdCl2 20 μg mL–1). Extracellular biosynthesis was detected in the three P. deceptionensis M1T strains after 1 h incubation with Cys (Supplementary Figure S3A). As expected, all the strains produced H2S, although lower concentrations were observed in the presence of Cd2+ (Supplementary Figure S3B). These results suggest that QDs production is mediated by H2S as it has been reported in other bacterial strains (Bai et al., 2009a; Ulloa et al., 2016; Bruna et al., 2019). Finally, P. deceptionensis M1T produced higher levels of H2S than P. fragi GC01 (Supplementary Figure S3), a phenomenon that could be explained by the presence of Cys desulfhydrase, which converts Cys into H2S.
The results shown in Figure 8 suggest that QDs biosynthesis from Met is mainly associated to the production of MeSH in P. deceptionensis M1T wild type and mddA– strains. In support of this hypothesis, P. deceptionensis M1T megL–, which does not produce MeSH from Met (Carrión et al., 2015), did not generate fluorescent nanoparticles or pellets under biosynthesis conditions (Figure 8). Finally, P. deceptionensis M1T mddA–, although it does not synthesize DMS, was able to produce CdS QDs in the presence of Met, discarding DMS as a substrate for nanoparticle biosynthesis (Figure 8).
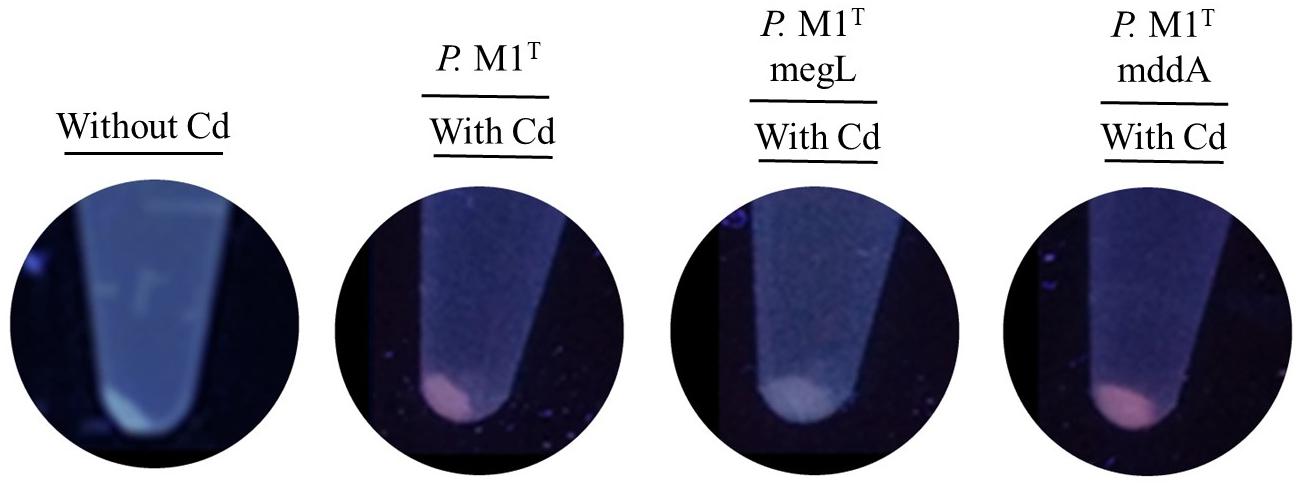
Figure 8. Biosynthesis of CdS QDs by P. deceptionensis M1T strains in the presence of Met as sole sulfur source. Fluorescence of supernatants of P. deceptionensis M1T strains under biosynthesis conditions after UV light exposure. Bacterial strains were grown in M9 medium with 2 mM Met, in presence or absence of CdCl2 20 μg mL–1 for 48 h.
Discussion
The use of bacteria as cell factories to produce nanoparticles with great economic and technological value has increased in the past few years as a safe and eco-friendly alternative, but it also provides the possibility to manufacture nanoparticles with new properties and applications. In a previous work, we reported the use of different Antarctic Pseudomonas spp., resistant to oxidative stress, to biosynthesize CdS QDs (Gallardo et al., 2014). The synthesis of CdS QDs was intracellular and it was performed at low temperatures (15°C). However, it was not possible to associate the CdS nanoparticles biosynthesis in P. fragi GC01 to the use of sulfur-containing molecules with affinity to Cd as a precursor to their biosynthesis, such as antioxidant thiols and volatile sulfur compounds as H2S (Holmes et al., 1997; Bai et al., 2009b; Monrás et al., 2012; Gallardo et al., 2014). Consequently, we decided to study the ability of P. fragi GC01 to use different sulfur sources to grow, to biosynthesize CdS QDs and to produce VSCs.
In this work, we study the link between CdS QDs biosynthesis and production of VSCs from different sulfur sources, focusing on Cys and Met, in P. fragi GC01. We showed that this strain can grow on a wide variety of sulfur sources such as sulfate, sulfite, sulfide, thiosulfate, Met and Cys, as well as produce intracellular nanoparticles from them. Sulfur is an essential element for cell growth, but it can only be assimilated as S2– in its fully reduced state. The sulfur required by bacteria can be obtained in both inorganic and organic forms (Kertesz, 2001). Inorganic sulfate is the most abundant sulfur source in the environment and the main metabolic pathway by which bacteria assimilate this element (Kertesz, 2001). Sulfate assimilation occurs by active transportation of the substrate into the cell by an ABC-type transporter and is subsequently reduced to S2– before being assimilated into organic material (Kertesz, 2000, 2004). However, bacteria can also use other inorganic sulfur sources to grow such as sulfite, thiosulfate and sulfide. Sulfite and sulfide can enter the sulfate assimilation pathway, where sulfite is reduced to sulfide by the enzyme sulfite reductase (Kredich, 2008). Moreover, thiosulfate is incorporated into Pseudomonas cells through an ABC-type transporter for sulfate/thiosulfate (Kertesz, 2004) and can be assimilated after being reduced to sulfide by the enzyme thiosulfate reductase (Barton et al., 2017). In addition, Cys can be assimilated directly by bacteria via a transsulfuration pathway with subsequent formation of Met, or can be used by cysteine desulfhydrase to produce sulfide (Awano et al., 2003, 2005). Finally, Met can be used as sole sulfur source by some bacteria. Met may be provided to the cells by desulfurization to yield inorganic sulfate or by a reverse transsulfuration pathway, which converts Met to Cys. This pathway has been reported in bacteria from the Pseudomonas genus (Vermeij and Kertesz, 1999).
In the study of the intracellular biosynthesis of CdS nanoparticles from different sulfur sources by P. fragi GC01, Cd+2 was exogenously provided as a substrate, with bacterial metabolism being responsible for providing the S–2 needed for the formation of CdS QDs. However, several metabolic pathways can be involved in the synthesis of CdS QDs through the generation of S–2, due to its incorporation into organic material as the final product of sulfur assimilation metabolism in bacteria (Kertesz, 2001, 2004; Awano et al., 2005; Kredich, 2008; Barton et al., 2017). No H2S was produced by P. fragi GC01 at detectable levels under any condition tested. Although H2S could be formed at concentrations below the detection limit, it is also possible that the absence of this VSC in P. fragi GC01 samples could be due to the lack or reduced activity of enzymes involved in the reduction of sulfur compounds to sulfide.
Conversely, extracellular biosynthesis of CdS QDs was only observed when Cys and Met were used as sole sulfur sources. The nanoparticles obtained with Cys showed several fluorescent colors of the supernatants (between green and orange) depending on the incubation time and Cys concentrations. This optical property is a unique and characteristic phenomenon of QDs, which emit different colors of fluorescence according to the nanocrystal size (Yang et al., 2016; Ulloa et al., 2018; Bruna et al., 2019). Nevertheless, the optical properties of fluorescence emission also can be affected by the surface defects decorating the nanoparticles, as has been reported by Bruna et al. (2019) in the biosynthesis of QDs of CdS by halophilic bacteria. Additionally, bacterial supernatants incubated with Met showed red fluorescence, the color of which did not vary over time. This observation strongly suggests that the nanoparticles produced by the extracellular biosynthesis of CdS QDs, when using Met as the sole sulfur source, could have different properties from the nanoparticles produced from Cys either because the S2– as precursor of the QDs biosynthesis could be provided by different bacterial metabolic pathways or because other reduced sulfur anions are involved in CdS QDs biosynthesis when interacting with Cd.
Therefore, in this study we have established that P. fragi GC01 biosynthesize CdS QDs from Cys and Met through several characterization methods. CdS nanoparticles produced by this Antarctic strain showed a zeta potential value (lower than −20 mV) indicative of high stability in aqueous solutions, with nanocrystals produced with Met being the most stable (Kuznetsova and Rempel, 2015). The average size of the nanoparticles produced with Cys (∼2 nm) and Met (∼16 nm), determined from TEM images, were consistent with the size of QDs biosynthesized by other microorganisms (Chen et al., 2009; Khachatryan et al., 2009; Syed and Ahmad, 2013; Wu et al., 2015; Al-Shalabi and Doran, 2016; Tandon and Vats, 2016; Wang et al., 2018; Bruna et al., 2019). TEM as a technique for characterizing nanomaterials enables the visualization of the shape and size of the nanoparticles by providing direct images of nanomaterials at a spatial resolution (Lina et al., 2014). The results obtained with TEM showed mainly the diameter of the core (Kale et al., 2013), which explains the great discrepancy in the particle sizes observed between TEM (size < 17 nm), AFM (size in the range of 15–29 nm) and DLS (size in the range of 24–36 nm), because the latter two techniques might be considering the organic layer of the nanoparticles as well as presenting a greater aggregation of particles in the samples. In this context, the average hydrodynamic size of the nanoparticles estimated by DLS was larger than in AFM. DLS is based on the particle behavior in aqueous medium and hydrodynamic size is measured through Brownian motion, which considers both the size of the particle and the solvation layer, resulting in larger average diameters. On the other hand, AFM is commonly used to determine particle size distribution in solid state by the interaction between the sample and tip, where the tip is either repelled or attracted. Thus, AFM average diameter tends to present lower values when compared to DLS, as it represents only the particle size and does not consider the solvating layer (Hoo et al., 2008). The elemental analysis, the crystalline shape and surface composition of the nanoparticles by EDS, XRD and XPS confirm the formation of CdS QDs. Specifically, EDS analysis of the nanoparticles obtained from Cys showed signals associated to Cd and S elements, while the XRD taken from the nanoparticles synthesized from Cys and Met as sole sulfur source, indicated the formation of cubic nanocrystals of CdS, which are related to the diffraction of the crystalline planes (111), (220), and (311). The same XRD pattern has been reported for the CdS QDs obtained via chemical (Waly et al., 2017; Bharti et al., 2018; Wang et al., 2018) and biological synthesis (Sankhla et al., 2016; Chakraborty et al., 2018). XPS analysis was developed in the 1960 by Siegbahn’s research group and, since then, it has been widely used to determine the chemical composition and state of elements present on a sample surface (Siegbahn et al., 1967). To perform the measurements, an external X-ray beam is injected, commonly reaching 10 nm depth on the sample. The incident X-ray is able to eject electrons from core levels (1s, 2s, 2p…), and these photoelectrons have characteristic Kinect energies, which enables the differentiation of each element and their respective chemical state (Baer and Engelhard, 2010). In this work, the XPS analysis was carried out to study the surface composition of the nanocrystals. The XPS analysis of the surface composition of the nanocrystals produced with Cys and Met, presented signals in the C 1s, Cd 3d, Na 1s, O 1s, P 2p and S 2p region. The presence of N and S suggest that Cys and Met are part of the organic coating of the QDs surface, indicating that these sulfur compounds could be stabilizing the QDs. The Cd 3d spectrum deconvoluted peaks indicated binding energies of 412 and 405 eV, corresponding to Cd3/2 and Cd5/2, respectively, (Marusak et al., 2016; Richards et al., 2016). Furthermore, the intensity ratio of the Cd3/2 and Cd5/2 peaks was 2:3, confirming that Cd was obtained in the state of Cd2+, which is in accordance to what has been previously reported for CdS QDs (Bag et al., 2017). It was not possible to identify the Cd 3d peaks in the spectra of CdS QDs produced using Met, despite similar elements having been observed on the surface composition of the nanocrystals. This could be due to the different organic compounds of a thick (>10 nm) surface coating of the nanoparticle produced with Met, whereby the Cd may not be detected in this technique. Additionally, the presence of an amorphous coating on the nanoparticles obtained with Met was also determined by XRD (Muntaz Begum et al., 2016), a technique that confirmed the formation of cubic CdS QDs.
The absorbance spectra of green and yellow CdS nanoparticles produced with Cys and red nanoparticles from Met synthesized by P. fragi GC01 showed peaks at 360, 370 nm and 380, respectively. This is in agreement with the typical characteristic of CdS QDs, a plasmon resonance absorption with maximum absorption below 400 nm (Liu et al., 2014), in comparison with the absorption of bulk CdS nanoparticles at 515 nm (Song et al., 2014). The corresponding fluorescence emission peaks were observed at 500, 530 and 570 nm for green, yellow and red nanoparticles, respectively. Both peaks (absorbance and fluorescence) of QDs obtained from Cys progressively shifted to longer wavelengths over time, changing from green (1 h) to yellow (2 h) fluorescence color. This phenomenon can be explained by the different sizes of the purified nanoparticles (Yang et al., 2015; Dunleavy et al., 2016). The absorbance and fluorescence properties are in agreement with previous reports of biological synthesis of CdS nanoparticles, where the nanoparticles display maximal absorbance peaks between 360 and 380 nm and fluorescence emission peaks between 470 and 600 nm (Gallardo et al., 2014; Yang et al., 2015; Dunleavy et al., 2016; Plaza et al., 2016; Ulloa et al., 2016; Venegas et al., 2017; Glatstein et al., 2018). In addition, the quantum yields for both nanoparticles solutions obtained from Cys (yellow) and Met (red) were 21.04 and 7.81%, respectively. Interestingly, a high quantum yield (21.04%) was determined in QDs produced from Cys (Venegas et al., 2017; Bruna et al., 2019) in comparison to those generated from biosynthesis with Met. These results could be due to the size differences observed between nanoparticles, where the nanoparticles obtained from Cys (yellow) have a size of ∼2 nm and the nanoparticles from Met (red) have a size of ∼16 nm. Nevertheless, quantum yield (7.81%) determined in QDs produced from Met are high when compared to other reported biological syntheses (Yang et al., 2015; Jang et al., 2015; Al-Shalabi and Doran, 2016).
In this study, we have also shown that P. fragi GC01 can produce H2S, MeSH and DMS in the presence of SO42–, Cys and Met. However, DMDS was only detected when Met was used as sole sulfur source. It has been reported that many bacterial strains from different environments can release VSCs such as H2S, MeSH, DMS, and DMDS among others, as a result of a sulfur assimilation process involved in the synthesis of amino acids or from biological degradation of sulfur-containing compounds (Lomans et al., 2002; Schulz and Dickschat, 2007; Korpi et al., 2009). Specifically, Met yielded the highest concentrations of MeSH and DMS, although it generated low concentrations of DMDS and H2S. MeSH is the main VSC released by P. fragi GC01 from all sulfur sources tested. Met has been described as a major precursor of VSC biosynthesis, especially of MeSH (Vermeij and Kertesz, 1999; Lu et al., 2013; Carrión et al., 2015), which, in turn, is a precursor of DMS and DMDS (Lu et al., 2013). The formation of MeSH from Met is catalyzed by methionine ɣ-lyase (Vermeij and Kertesz, 1999). Additionally, MeSH can be produced by methylation of H2S in a reaction catalyzed by a thiol S-methyltransferase enzyme. On the other hand, the production of DMS by methylation of MeSH is mediated by the methyltransferase MddA, which uses S-adenosyl-L-methionine (Ado-Met) as methyl donor (Carrión et al., 2015). However, DMDS can be produced by chemical oxidation of MeSH (Chin and Lindsay, 1994; Lu et al., 2013). Besides, Cys has been described as the main precursor of H2S, through a reaction catalyzed mainly by Cys desulfhydrase (Awano et al., 2003, 2005). Additionally, Cys can be incorporated into the cell directly via trans-sulfuration to form Met, which in turn is the precursor of the rest of the volatiles detected (Vermeij and Kertesz, 1999). When SO42– is used as sole sulfur source, it is reduced to sulfide (S–2), which leads to the production of Cys and Met (Kertesz, 2004).
Volatile sulfur compounds production by P. fragi GC01 under biosynthesis conditions (presence of Cd+2) with Cys and Met was tested. The main results obtained showed a significant statistical decrease of H2S between the treatment with and without Cd in presence of Cys (P < 0.05). By the other hand, the production of MeSH significatively decreased when Cd+2 (CdCl2) was added in presence of all sulfur sources tested (P < 0.05). Although the production of several VSCs has been reported in bacteria, only H2S has been associated with the biosynthesis of CdS nanoparticles (Bai et al., 2009a; Gallardo et al., 2014; Yang et al., 2016). The production of VSCs by P. fragi GC01 under biosynthesis conditions showed higher H2S and MeSH production from Cys and Met. In addition, a statistically significant reduction of both VSCs (P < 0.05) was observed when samples were treated with Cd. Decreased H2S production in the Cd treatment suggests that the production of QDs is mediated by H2S, as has been previously reported in other bacteria (Bai et al., 2009a; Yang et al., 2015). In general, different authors have suggested that the mechanism of cadmium-based nanoparticle formation was the generation of H2S (as sulfide source) from Cys in a reaction mediated by Cys desulfhydrase (Holmes et al., 1997; Bai et al., 2009a) or cystathionine γ-lyase (Dunleavy et al., 2016). Both enzymes catalyze the formation of pyruvate, ammonia and hydrogen sulfide from Cys. Therefore, the fluorescence in the bacterial supernatant indicated extracellular CdS QDs formation by the reaction of Cd2+ added into the system with S2– provided by the bacterial metabolism, likely through the H2S production as a result of enzymatic degradation of Cys (Bai et al., 2009a; Yang et al., 2016). In addition to being a sulfur source, the amino acid Cys could also act as a capping agent in CdS nanoparticles formation (Dunleavy et al., 2016).
The importance of Met in the biosynthesis of CdS QDs and the role of VSCs’ catabolic pathways were studied using different strains of P. deceptionensis M1T. Carrión et al. (2015) described a novel pathway of DMS production from MeSH, which in turn is a product of Met catabolism. Intracellular biosynthesis of CdS QDs was observed in all P. deceptionensis M1T strains except for P. deceptionensis M1T megL–, which cannot form MeSH from Met. In addition, the fact that deceptionensis M1T mddA– was able to synthesize nanoparticles discards DMS as a substrate in this process, since this strain cannot produce DMS from MeSH. These results strongly suggest that MeSH could act as a source of S2– to synthesize CdS QDs when Met is added to the medium as sole sulfur source.
Conclusion
In conclusion, here we establish that P. fragi GC01 is able to biosynthesize extracellular CdS QDs in the presence of the amino acids Cys and Met. The bioproduction of these nanoparticles is linked to the ability of this strain to form the volatile sulfur compounds H2S and MeSH from Cys and Met, respectively. Both VSCs produced by P. fragi GC01 act as a source of S2– in the biosynthesis of CdS QDs. Interestingly, the biosynthesis of Cd-based nanoparticles from Met has not been previously described, nor has the participation of volatile organic compounds such as MeSH in the biosynthesis process. Therefore, this study constitutes the first report correlating the production of the VSC MeSH and the biosynthesis of CdS QDs.
Data Availability
The datasets generated for this study are available on request to the corresponding author.
Author Contributions
CG-B, JP-D, and AQ conceived and designed the study, analyzed the data and prepared the manuscript. CG-B performed the experiments. JP contributed to performing the experiments of characterization of nanoparticles. JP, AS, ND, and OR analyzed the data and discussion regarding the characterization of nanoparticles. OC and JT designed, analyzed the data and discussion regarding the Volatile Sulfur Compounds. All authors commented on or contributed to the manuscript.
Funding
This work was supported by CONICYT scholarship 21151066 (CG-B), Fondecyt 1151255 (JP-D), Fondecyt 1181697, INACH DT_05_16 (CG-B, AQ), INACH RT-25_16 (JP-D), FAPESP (2018/08194-2 and 2018/02832-7) and CNPq (404815/2018-9). Funding from the Natural Environment Research Council (NE/M004449) supported the OC and JT work.
Conflict of Interest Statement
The authors declare that the research was conducted in the absence of any commercial or financial relationships that could be construed as a potential conflict of interest.
Acknowledgments
We thank Dr. Elena Mercade from University of Barcelona for kindly providing Pseudomonas deceptionensis M1T wild type strain.
Supplementary Material
The Supplementary Material for this article can be found online at: https://www.frontiersin.org/articles/10.3389/fmicb.2019.01866/full#supplementary-material
References
Ali, J., Hameed, A., Ahmed, S., and Ali, M. I. (2016). Role of catalytic protein and stabilizing agents in transformation of Ag ions to nanoparticles by Pseudomonas aeruginosa. IET Nanobiotechnol. 10, 295–300. doi: 10.1049/iet-nbt.2015.0093
Alivisatos, A. P. (1996). Perspectives on the physical chemistry of semiconductor nanocrystals. J. Phys. Chem. 100, 13226–13239. doi: 10.1021/jp9535506
Al-Shalabi, Z., and Doran, P. M. (2016). Biosynthesis of fluorescent CdS nanocrystals with semiconductor properties: comparison of microbial and plant production systems. J. Biotechnol. 223, 13–23. doi: 10.1016/j.jbiotec.2016.02.018
Awano, N., Wada, M., Kohdoh, A., Oikawa, T., Takagi, H., and Nakamori, S. (2003). Effect of cysteine desulfhydrase gene disruption on L-cysteine overproduction in Escherichia coli. Appl. Microbiol. Biotechnol. 62, 239–243. doi: 10.1007/s00253-003-1262-2
Awano, N., Wada, M., Mori, H., Nakamori, S., and Takari, H. (2005). Identification and functional analysis of Escherichia coli cysteine desulfhydrases. Society 71, 4149–4152. doi: 10.1128/AEM.71.7.4149
Ayano, H., Kuroda, M., Soda, S., and Ike, M. (2015). Effects of culture conditions of Pseudomonas aeruginosa strain RB on the synthesis of CdSe nanoparticles. J. Biosci. Bioeng. 119, 440–445. doi: 10.1016/j.jbiosc.2014.09.021
Baer, D. R., and Engelhard, M. H. (2010). XPS analysis of nanostructured materials and biological surfaces. J. Electron Spectros. Relat. Phenomena 17, 415–432. doi: 10.1016/j.elspec.2009.09.003
Bag, P. P., Wang, X. S., Sahoo, P., Xiong, J., and Cao, R. (2017). Efficient photocatalytic hydrogen evolution under visible light by ternary composite CdS@NU-1000/RGO. Catal. Sci. Technol. 7, 5113–5119. doi: 10.1039/c7cy01254c
Bai, H. J., Zhang, Z., Guo, Y., and Jia, W. (2009a). Biological synthesis of size-controlled cadmium sulfide nanoparticles using immobilized Rhodobacter sphaeroides. Nanoscale Res. Lett. 4, 717–723. doi: 10.1007/s11671-009-9303-0
Bai, H. J., Zhang, Z. M., Guo, Y., and Yang, G. E. (2009b). Biosynthesis of cadmium sulfide nanoparticles by photosynthetic bacteria Rhodopseudomonas palustris. Coll. Surfaces B Biointer. 70, 142–146. doi: 10.1016/j.colsurfb.2008.12.025
Baker, S., Mohan Kumar, K., Santosh, P., Rakshith, D., and Satish, S. (2015). Extracellular synthesis of silver nanoparticles by novel Pseudomonas veronii AS41G inhabiting Annona squamosa L. and their bactericidal activity. Spectrochim. Acta A Mol. Biomol. Spectrosc. 136, 1434–1440. doi: 10.1016/j.saa.2014.10.033
Barton, L. L., Ritz, N. L., Fauque, G. D., and Lin, H. C. (2017). Sulfur cycling and the intestinal microbiome. Dig. Dis. Sci. 62, 2241–2257. doi: 10.1016/j.asoc.2017.08.004
Bharti, D. B., Bharati, A. V., and Wankhade, A. V. (2018). Synthesis, characterization and optical property investigation of CdS nanoparticles. Luminescence 33, 1445–1449. doi: 10.1002/bio.3572
Bruna, N., Collao, B., Tello, A., Caravantes, P., Díaz-Silva, N., Monrás, J. P., et al. (2019). Synthesis of salt-stable fluorescent nanoparticles (quantum dots) by polyextremophile halophilic bacteria. Sci. Rep. 9:1953. doi: 10.1038/s41598-018-38330-8
Carrión, O., Curson, A. R. J., Kumaresan, D., Fu, Y., Lang, A. S., Mercadé, E., et al. (2015). A novel pathway producing dimethylsulphide in bacteria is widespread in soil environments. Nat. Commun. 6:6579. doi: 10.1038/ncomms7579
Carrión, O., Miñana-Galbis, D., Montes, M. J., and Mercadé, E. (2011). Pseudomonas deceptionensis sp. nov., a psychrotolerant bacterium from the antarctic. Int. J. Syst. Evol. Microbiol. 61, 2401–2405. doi: 10.1099/ijs.0.024919-0
Chakraborty, J., Mallick, S., Raj, R., and Das, S. (2018). Functionalization of extracellular polymers of Pseudomonas aeruginosa N6P6 for synthesis of CdS nanoparticles and cadmium bioadsorption. J. Polym. Environ. 26, 3097–3108. doi: 10.1007/s10924-018-1195-6
Chen, Y. L., Tuan, H. Y., Tien, C. W., Lo, W. H., Liang, H. C., and Hu, Y. C. (2009). Augmented biosynthesis of cadmium sulfide nanoparticles by genetically engineered Escherichia coli. Biotechnol. Prog. 25, 1260–1266. doi: 10.1002/btpr.199
Chin, H. W., and Lindsay, R. C. (1994). Ascorbate and transition-metal mediation of methanethiol oxidation to dimethyl disulfide and dimethyl trisulfide. Food Chem. 49, 387–392. doi: 10.1016/0308-8146(94)90009-4
Dunleavy, R., Lu, L., Kiely, C. J., McIntosh, S., and Berger, B. W. (2016). Single-enzyme biomineralization of cadmium sulfide nanocrystals with controlled optical properties. Proc. Natl. Acad. Sci. U.S.A. 113, 5275–5280. doi: 10.1073/pnas.1523633113
Durán-Toro, V., Gran-scheuch, A., Órdenes-aenishanslins, N., Monrás, J. P., and Saona, L. A. (2014). Quantum dot-based assay for Cu 2 + quantification in bacterial cell culture. Anal. Biochem. J. 450, 30–36. doi: 10.1016/j.ab.2014.01.001
Faraon, A., Englund, D., Fushman, I., Stoltz, N., and Petroff, P. (2007). Local quantum dot tuning on photonic crystal chips. Appl. Phys. Lett. 90:213110. doi: 10.1063/1.2742789
Gallardo, C., Monrás, J. P., Plaza, D. O., Collao, B., Saona, L. A., Durán-Toro, V., et al. (2014). Low-temperature biosynthesis of fluorescent semiconductor nanoparticles (CdS) by oxidative stress resistant Antarctic bacteria. J. Biotechnol. 187, 108–115. doi: 10.1016/j.jbiotec.2014.07.017
Glatstein, D. A., Bruna, N., Gallardo-Benavente, C., Bravo, D., Carro Pérez, M. E., Francisca, F. M., et al. (2018). Arsenic and cadmium bioremediation by antarctic bacteria capable of biosynthesizing CdS fluorescent nanoparticles. J. Environ. Eng. 144:04017107. doi: 10.1061/(ASCE)EE.1943-7870.0001293
Holmes, J. D., Richardson, D. J., Saed, S., Evans-Gowing, R., Russell, D. A., and Sodeau, J. R. (1997). Cadmium-specif ic formation of metal sulfide Q-particles’. Microbiology 143, 2521–2530. doi: 10.1099/00221287-143-8-2521
Hoo, C. M., Starostin, N., West, P., and Mecartney, M. L. (2008). A comparison of atomic force microscopy (AFM) and dynamic light scattering (DLS) methods to characterize nanoparticle size distributions. J. Nanoparticle Res. 10, 89–96. doi: 10.1007/s11051-008-9435-7
Horcas, I., Fernández, R., Gómez-Herrero, J., and Baro, A. M. (2007). WSXM: a software for scanning probe microscopy and a tool for nanotechnology. Rev. Sci. Instrum. 78:013705. doi: 10.1063/1.2432410
Jadhav, P., Bhand, G. R., Mohite, K. C., and Chaure, N. B. (2017). CdS quantum dots synthesized by low-cost wet chemical technique. AIP Conf. Proc. 1832, 1–3. doi: 10.1063/1.4980379
Jang, G. G., Jacobs, C. B., Ivanov, I. N., Joshi, P. C., Meyer, H. M., Kidder, M., et al. (2015). In situ capping for size control of monochalcogenide (ZnS, CdS and SnS) nanocrystals produced by anaerobic metal-reducing bacteria. Nanotechnology 26:325602. doi: 10.1088/0957-4484/26/32/325602
Jo, J. H., Singh, P., Kim, Y. J., Wang, C., Mathiyalagan, R., Jin, C. G., et al. (2016). Pseudomonas deceptionensis DC5-mediated synthesis of extracellular silver nanoparticles. Artif. Cells Nanomed. Biotechnol. 44, 1576–1581. doi: 10.3109/21691401.2015.1068792
Kale, A., Bao, Y., Zhou, Z., and Prevelige, P. E. (2013). Directed self-assembly of CdS quantum dots on bacteriophage P22 coat protein templates. Nanotechnology 24:045603. doi: 10.1088/0957-4484/24/4/045603
Kertesz, M. A. (2000). Riding the sulfur cycle - metabolism of sulfonates and sulfate esters in Gram-negative bacteria. FEMS Microbiol. Rev. 24, 135–175. doi: 10.1111/j.1574-6976.2000.tb00537.x
Kertesz, M. A. (2001). Bacterial transporters for sulfate and organosulfur compounds. Res. Microbiol. 152, 279–290. doi: 10.1016/s0923-2508(01)01199-8
Kertesz, M. A. (2004). Metabolism of sulphur-containing organic compounds. pseudomonas, biosynth. Macromol. Mol. Metab. 3, 323–357. doi: 10.1007/978-1-4419-9088-4_12
Khachatryan, G., Khachatryan, K., Stobinski, L., Tomasik, P., Fiedorowicz, M., and Lin, H. M. (2009). CdS and ZnS quantum dots embedded in hyaluronic acid films. J. Alloys Compd. 481, 402–406. doi: 10.1016/j.jallcom.2009.03.011
Korpi, A., Järnberg, J., and Pasanen, A. (2009). Microbial volatile organic compounds. Crit. Rev. Toxicol. 39, 139–193. doi: 10.1080/10408440802291497
Kredich, N. M. (2008). Biosynthesis of cysteine. EcoSal Plus 3, 1–30. doi: 10.1128/ecosalplus.3.6.1.11
Kumar, C. G., and Mamidyala, S. K. (2011). Extracellular synthesis of silver nanoparticles using culture supernatant of Pseudomonas aeruginosa. Coll. Surfaces B Biointer. 84, 462–466. doi: 10.1016/j.colsurfb.2011.01.042
Kuznetsova, Y. V., and Rempel, A. A. (2015). Size and zeta potential of CdS nanoparticles in stable aqueous solution of EDTA and NaCl. Inorg. Mater. 51, 215–219. doi: 10.1134/S0020168515020119
Lina, P.-C., Lina, S., Paul, C. W., and Rajagopalan, S. (2014). Techniques for physicochemical characterization of nanomaterials. Biotechnol. Adv. 31, 711–726. doi: 10.1038/mp.2011.182
Liu, S., Wang, X., Pang, S., Na, W., Yan, X., and Su, X. (2014). Fluorescence detection of adenosine-5 0 -triphosphate and alkaline phosphatase based on the generation of CdS quantum dots. Anal. Chim. Acta 827, 103–110. doi: 10.1016/j.aca.2014.04.027
Lomans, B. P., Van Der Drift, C., Pol, A., and Op den Camp, H. J. (2002). Microbial cycling of volatile organic sulfur compounds. C. Cell. Mol. Life Sci. 59, 575–588. doi: 10.1007/s00018-002-8450-6
Lu, X., Fan, C., He, W., Deng, J., and Yin, H. (2013). Sulfur-containing amino acid methionine as the precursor of volatile organic sulfur compounds in algea-induced black bloom. J. Environ. Sci. 25, 33–43. doi: 10.1016/s1001-0742(12)60019-9
Mal, J., Nancharaiah, Y. V., Van Hullebusch, E. D., and Lens, P. N. L. (2016). Metal chalcogenide quantum dots: biotechnological synthesis and applications. RSC Adv. 6, 41477–41495. doi: 10.1039/c6ra08447h
Marusak, K. E., Feng, Y., Eben, C. F., Payne, S. T., Cao, Y., You, L., et al. (2016). Cadmium sulphide quantum dots with tunable electronic properties by bacterial precipitation. RSC Adv. 6, 76158–76166. doi: 10.1039/c6ra13835g
McHugh, K. J., Jing, L., Behrens, A. M., Jayawardena, S., Tang, W., Gao, M., et al. (2018). Biocompatible semiconductor quantum dots as cancer imaging agents. Adv. Mater. 30, 1–18. doi: 10.1002/adma.201706356
Mi, C., Wang, Y., Zhang, J., Huang, H., Xu, L., Wang, S., et al. (2011). Biosynthesis and characterization of CdS quantum dots in genetically engineered Escherichia coli. J. Biotechnol. 153, 125–132. doi: 10.1016/j.jbiotec.2011.03.014
Monrás, J. P., Díaz, V., Bravo, D., Montes, R. A., Chasteen, T. G., Osorio-Román, I. O., et al. (2012). Enhanced glutathione content allows the in vivo synthesis of fluorescent CdTe nanoparticles by Escherichia coli. PLoS One 7:e48657. doi: 10.1371/journal.pone.0048657
Muntaz Begum, S. K., Ravindranadh, K., Ravikumar, R. V. S. S. N., and Rao, M. C. (2016). Spectroscopic studies on PVA capped ZnSe nanoparticles. Optoelectron. Adv. Mater. Rapid Commun. 10, 889–892.
Muthalif, M. P. A., Sunesh, C. D., and Choe, Y. (2019). Enhanced light absorption and charge recombination control in quantum dot sensitized solar cells using tin doped cadmium sulfide quantum dots. J. Coll. Interface Sci. 534, 291–300. doi: 10.1016/j.jcis.2018.09.035
Nguyen, N. H., Duong, T. G., Hoang, V. N., Pham, N. T., Dao, T. C., and Pham, T. N. (2015). Synthesis and application of quantum dots-based biosensor. Adv. Nat. Sci. Nanosci. Nanotechnol. 6:15015. doi: 10.1088/2043-6262/6/1/015015
Nozik, A. J., Beard, M. C., Luther, J. M., Law, M., Ellingson, R. J., and Johnson, J. C. (2010). Semiconductor quantum dots and quantum dot arrays and applications of multiple exciton generation to third-generation photovoltaic solar cells. Chem. Rev. 110, 6873–6890. doi: 10.1021/cr900289f
Oliva-Arancibia, B., Órdenes-Aenishanslins, N., Bruna, N., Ibarra, P. S., Zacconi, F. C., Pérez-Donoso, J. M., et al. (2017). Co-synthesis of medium-chain-length polyhydroxyalkanoates and CdS quantum dots nanoparticles in Pseudomonas putida KT2440. J. Biotechnol. 264, 29–37. doi: 10.1016/j.jbiotec.2017.10.013
Plaza, D. O., Gallardo, C., Straub, Y. D., Bravo, D., and Pérez-Donoso, J. M. (2016). Biological synthesis of fluorescent nanoparticles by cadmium and tellurite resistant Antarctic bacteria: exploring novel natural nanofactories. Microb. Cell Fact. 15, 1–11. doi: 10.1186/s12934-016-0477-8
Qin, Z., Yue, Q., Liang, Y., Zhang, J., Zhou, L., Hidalgo, O. B., et al. (2018). Extracellular biosynthesis of biocompatible cadmium sulfide quantum dots using trametes versicolor. J. Biotechnol. 284, 52–56. doi: 10.1016/j.jbiotec.2018.08.004
Rengers, C., Nikolai, G., and Eychmüller, A. (2019). “Quantum dots and quantum rods,” in Biological Responses to Nanoscale Particles. NanoScienc, eds P. Gehr and R. Zellner (Cham: Springer).
Richards, S., Baker, M. A., Wilson, M. D., Lohstroh, A., and Seller, P. (2016). Femtosecond laser ablation of cadmium tungstate for scintillator arrays. Opt. Lasers Eng. 83, 116–125. doi: 10.1016/j.optlaseng.2016.03.004
Sambrook, J., and Russell, D. W. (2001). Molecular Cloning, A Laboratory Manual, 3rd Edn. Cold Spring: Cold Spring Harbor Laboratory Press.
Sanchez, F., and Sobolev, K. (2010). Nanotechnology in concrete - a review. Constr. Build. Mater. 24, 2060–2071. doi: 10.1016/j.conbuildmat.2010.03.014
Sankhla, A., Sharma, R., Yadav, R. S., Kashyap, D., Kothari, S. L., and Kachhwaha, S. (2016). Biosynthesis and characterization of cadmium sulfide nanoparticles - an emphasis of zeta potential behavior due to capping. Mater. Chem. Phys. 170, 44–51. doi: 10.1016/j.matchemphys.2015.12.017
Schulz, S., and Dickschat, J. S. (2007). Bacterial volatiles: the smell of small organisms. Nat. Prod. Rep. 24, 814–842. doi: 10.1039/b507392h
Shatalin, K., Shatalina, E., Mironov, A., and Nudler, E. (2011). H2S: a universal defense against antibiotics in bacteria. Science 334, 986–990. doi: 10.1126/science.1209855
Siegbahn, K., Nordling, C., Fahlman, A., Nordberg, R., and Hamrin, K. (1967). ESCA-atomic, molecular and solid state structure studied by means of electron spectroscopy Nova Acta Regiae Soc. Sci. Upsaliensis Ser. IV 20:84.
Solomon, A. (2018). The emergence of nanotechnology and its applications. Res. J. Nanosci. Eng. 2, 8–12.
Song, Y., Huang, M., Luo, D., Zhong, D., and Hou, H. (2014). Effect of CdS QDs linked functional groups on interaction between CdS QDs and EcoRI. Coll. Surfaces A Physicochem. Eng. Asp. 444, 299–306. doi: 10.1016/j.colsurfa.2013.12.074
Syed, A., and Ahmad, A. (2013). Extracellular biosynthesis of CdTe quantum dots by the fungus Fusarium oxysporum and their anti-bacterial activity. Spectrochim. Acta A Mol. Biomol. Spectrosc. 106, 41–47. doi: 10.1016/j.saa.2013.01.002
Tandon, S., and Vats, S. (2016). Microbial biosynthesis of cadmium sulfide (Cds) nanoparticles and their characterization. Eur. J. Pharm. Med. Res. 3, 545–550.
Ulloa, G., Collao, B., Araneda, M., Escobar, B., Álvarez, S., Bravo, D., et al. (2016). Use of acidophilic bacteria of the genus Acidithiobacillus to biosynthesize CdS fluorescent nanoparticles (quantum dots) with high tolerance to acidic pH. Enzyme Microb. Technol. 95, 217–224. doi: 10.1016/j.enzmictec.2016.09.005
Ulloa, G., Quezada, C. P., Araneda, M., Escobar, B., Fuentes, E., álvarez, S. A., et al. (2018). Phosphate favors the biosynthesis of CdS quantum dots in Acidithiobacillus thiooxidans ATCC 19703 by improving metal uptake and tolerance. Front. Microbiol. 9:234. doi: 10.3389/fmicb.2018.00234
Venegas, F. A., Saona, L. A., Monrás, J. P., Órdenes-Aenishanslins, N., Giordana, M. F., Ulloa, G., et al. (2017). Biological phosphorylated molecules participate in the biomimetic and biological synthesis of cadmium sulphide quantum dots by promoting H2S release from cellular thiols. RSC Adv. 7, 40270–40278. doi: 10.1039/c7ra03578k
Vermeij, P., and Kertesz, M. A. (1999). Pathways of assimilative sulfur metabolism in Pseudomonas putida. J. Bacteriol. 181, 5833–5837.
Wagner, A. M., Knipe, J. M., Orive, G., and Peppas, N. A. (2019). Quantum dots in biomedical applications. Acta Biomater. 94, 44–63. doi: 10.1016/j.actbio.2019.05.022
Waly, S. A., Shehata, M. M., and Mahmoud, H. H. (2017). Synthesis and characterization of CdS nanoparticles prepared by precipitation in the presence of span 20 as surfactant. Russ. J. Appl. Chem. 90, 292–297. doi: 10.1134/S1070427217020203
Wang, D., Li, X., Zheng, L. L., Qin, L. M., Li, S., Ye, P., et al. (2018). Size-controlled synthesis of CdS nanoparticles confined on covalent triazine-based frameworks for durable photocatalytic hydrogen evolution under visible light. Nanoscale 10, 19509–19516. doi: 10.1039/c8nr06691d
Wu, R., Wang, C., Shen, J., and Zhao, F. (2015). A role for biosynthetic CdS quantum dots in extracellular electron transfer of Saccharomyces cerevisiae. Process Biochem. 50, 2061–2065. doi: 10.1016/j.procbio.2015.10.005
Yang, Z., Lu, L., Berard, V. F., He, Q., Kiely, C. J., Berger, B. W., et al. (2015). Biomanufacturing of CdS quantum dots. Green Chem. 17, 3775–3782. doi: 10.1039/c5gc00194c
Yang, Z., Lu, L., Kiely, C. J., Berger, B. W., and McIntosh, S. (2016). Biomineralized CdS quantum dot nanocrystals: optimizing synthesis conditions and improving functional properties by surface modification. Ind. Eng. Chem. Res. 55, 11235–11244. doi: 10.1021/acs.iecr.6b03487
Keywords: Antarctic bacteria, quantum dot, nanoparticle biosynthesis, volatile sulfur compounds, cadmium sulfide
Citation: Gallardo-Benavente C, Carrión O, Todd JD, Pieretti JC, Seabra AB, Durán N, Rubilar O, Pérez-Donoso JM and Quiroz A (2019) Biosynthesis of CdS Quantum Dots Mediated by Volatile Sulfur Compounds Released by Antarctic Pseudomonas fragi. Front. Microbiol. 10:1866. doi: 10.3389/fmicb.2019.01866
Received: 07 March 2019; Accepted: 29 July 2019;
Published: 13 August 2019.
Edited by:
Maria Luisa Blazquez, Complutense University of Madrid, SpainReviewed by:
Lynne Elaine Macaskie, University of Birmingham, United KingdomJoaquim C. G. Esteves Da Silva, University of Porto, Portugal
Raphaël Schneider, Université de Lorraine, France
Copyright © 2019 Gallardo-Benavente, Carrión, Todd, Pieretti, Seabra, Durán, Rubilar, Pérez-Donoso and Quiroz. This is an open-access article distributed under the terms of the Creative Commons Attribution License (CC BY). The use, distribution or reproduction in other forums is permitted, provided the original author(s) and the copyright owner(s) are credited and that the original publication in this journal is cited, in accordance with accepted academic practice. No use, distribution or reproduction is permitted which does not comply with these terms.
*Correspondence: José M. Pérez-Donoso, am9zZS5wZXJlekB1bmFiLmNs; Andrés Quiroz, YW5kcmVzLnF1aXJvekB1ZnJvbnRlcmEuY2w=