 Keita Ozaki1,2
 Yuki Matsushima3Koo Nagasawa4
 Jumpei Aso5Takeshi Saraya5Keisuke Yoshihara6
 Koichi Murakami7
 Takumi Motoya8
 Akihide Ryo9Makoto Kuroda10
 Kazuhiko Katayama11*
 Hirokazu Kimura1,9*
- 1Graduate School of Health Sciences, Gunma Paz University, Takasaki, Japan
- 2Niitaka Co., Ltd., Osaka, Japan
- 3Division of Virology, Kawasaki City Institute for Public Health, Kawasaki, Japan
- 4Eastern Chiba Medical Center, Togane, Japan
- 5Department of Respiratory Medicine, Kyorin University School of Medicine, Mitaka, Japan
- 6Department of Pediatric Infectious Diseases, Institute of Tropical Medicine, Nagasaki University, Nagasaki, Japan
- 7Infectious Disease Surveillance Center, National Institute of Infectious Diseases, Musashimurayama, Japan
- 8Ibaraki Prefectural Institute of Public Health, Mito, Japan
- 9Department of Microbiology, Yokohama City University School of Medicine, Yokohama, Japan
- 10Pathogen Genomics Center, National Institute of Infectious Diseases, Shinjuku, Japan
- 11Laboratory of Viral Infection I, Graduate School of Infection Control Sciences, Kitasato Institute for Life Sciences, Kitasato University, Minato, Japan
Noroviruses are a major cause of viral epidemic gastroenteritis in humans worldwide. The protease (Pro) encoded in open reading frame 1 (ORF1) is an essential enzyme for proteolysis of the viral polyprotein. Although there are some reports regarding the evolutionary analysis of norovirus GII-encoding genes, there are few reports focused on the Pro region. We analyzed the molecular evolution of the Pro region of norovirus GII using bioinformatics approaches. A time-scaled phylogenetic tree of the Pro region constructed using a Bayesian Markov chain Monte Carlo method indicated that the common ancestor of GII diverged from GIV around 1680 CE [95% highest posterior density (HPD), 1607–1749]. The GII Pro region emerged around 1752 CE (95%HPD, 1707–1794), forming three further lineages. The evolutionary rate of GII Pro region was estimated at more than 10–3 substitutions/site/year. The distribution of the phylogenetic distances of each genotype differed, and showed genetic diversity. Mapping of the negative selection and substitution sites of the Pro structure showed that the substitution sites in the Pro protein were mostly produced under neutral selection in positions structurally adjacent to the active sites for proteolysis, whereas negative selection was observed in residues distant from the active sites. The phylodynamics of GII.P4, GII.P7, GII.P16, GII.P21, and GII.P31 indicated that their effective population sizes increased during the period from 2005 to 2016 and the increase in population size was almost consistent with the collection year of these genotypes. These results suggest that the Pro region of the norovirus GII evolved rapidly, but under no positive selection, with a high genetic divergence, similar to that of the RNA-dependent RNA polymerase (RdRp) region and the VP1 region of noroviruses.
Introduction
Noroviruses (NoVs) are a major cause of acute epidemic viral gastroenteritis worldwide (Green, 2013; Robilotti et al., 2015). In developing countries, 200,000 deaths in children less than 5 years of age are estimated to be caused by NoV infections (Patel et al., 2008). Large-scale foodborne illnesses have been caused worldwide by NoVs (Le Guyader et al., 2008; Räsänen et al., 2010; Hardstaff et al., 2018; Sakon et al., 2018). It is estimated that NoVs are responsible for 699 million gastroenteritis cases per year, costing approximately $60 billion in medical and socioeconomic costs (Bartsch et al., 2016). Thus, NoV infection is a serious disease burden in many countries (Lopman et al., 2003; Kroneman et al., 2008; Hall et al., 2013).
NoV belongs to the family Caliciviridae, genus Norovirus, and is classified into 10 genogroups (GI-GX) (Chhabra et al., 2019). The GI, GII, GIV, GVIII and GIX genogroups of NoV can infect humans (Chhabra et al., 2019). GI and GII viruses are frequently detected in humans, and are further classified into 9 and 27 genotypes, respectively, based on the capsid region sequences (Chhabra et al., 2019). Previous molecular epidemiological studies have shown that some NoV GII genotypes, including GII.2, GII.3, GII.4, GII.6, and GII.17 are prevalent in different countries (Matsushima et al., 2015; Bruggink et al., 2016, 2018; Cannon et al., 2017; Wangchuk et al., 2017).
The NoV genome is a positive-sense, single-stranded RNA composed of three open reading frames (ORFs). ORF1 encodes six non-structural proteins including protease (Pro) and RNA-dependent RNA polymerase (RdRp). Pro plays a critical role in proteolytic cleavage of a large polyprotein encoded in the ORF1 (Liu et al., 1996; Blakeney et al., 2003). Thus, Pro is one of the essential enzymes in NoV propagation in host cells. Pro could be a major target for antiviral drugs, in addition to RdRp. Many studies have been conducted into the development of drug candidates (Hussey et al., 2011; Muhaxhiri et al., 2013; Muzzarelli et al., 2019; Viskovska et al., 2019). A recent report demonstrated different effectiveness of antivirals against GI and GII NoVs, suggesting that the amino acid diversity in Pro may result in different effectiveness of drugs (Viskovska et al., 2019). It is important to understand the evolution of the Pro region of GII NoV, because this virus is the predominant genogroup in patients with NoV infection. However, to the best of our knowledge, there are no reports related to a comprehensive molecular evolutionary analysis of the GII Pro region. We conducted a detailed evolutionary analysis of the NoV GII Pro region using large numbers of strains, and using the latest bioinformatics approaches.
Materials and Methods
Strain Selection
Full-length nucleotide sequences (543 nt) of the NoV GII Pro region were collected from GenBank1 (accessed on 17 November 2018). We classified these strains according to ORF1 using a norovirus genotyping tool (Kroneman et al., 2011) and selected all the sequences of the human NoV (HuNoV) GII. Strains with an unknown collection year and ambiguous sequences with undetermined nucleotides (such as N, Y, and V) were omitted from the dataset. After these eliminations, the dataset consisted of the Pro region sequences of approximately 1,500 strains. However, because of the limitations in the software’s capacity, it could not be used for the detection of recombination. Thus, we calculated the nucleotide identity among the 1,500 Pro region sequences using Clustal Omega (Sievers et al., 2011). We randomly selected one sequence from a group of homologous sequences with identity ≥99.8% and excluded the others from the dataset to reduce the sequences in the dataset. Furthermore, to estimate the recombination of the Pro region in the present strains, recombination analyses were performed using the RDP4.95 software with seven primary exploratory recombination signal detection methods: RDP, GENECONV, BOOTSCAN/RESCAN, MAXCHI, CHIMAERA, SISCAN, and 3SEQ (Martin et al., 2015). The threshold of the p-value for significance was set to 0.001. Recombinant regions were considered to be reliable when they were detected by more than four of these methods; however, no recombinant strains in the present sequences were estimated. Finally, a total of 760 strains were used in this study (Supplementary Table S1). The sequences in the dataset were aligned using the MAFFT software (Katoh and Standley, 2013).
Construction of a Time-Scaled Phylogenetic Tree Using the Bayesian Markov Chain Monte Carlo Method
We constructed a time-scaled phylogenetic tree using the Bayesian MCMC method in the BEAST software package v2.4.8 (Drummond and Rambaut, 2007; Bouckaert et al., 2014). To estimate the phylogenetic relationships in the Pro region between distinct NoVs genogroups, we added the nucleotide sequences of human NoV GI (GI.P1), porcine GII (GII.P11 and GII.P18), bovine GIII (GIII.P1) and human GIV (GIV.P1) strains to the dataset, giving a total of 765 strains. We determined the best substitution model (GTR+I+Γ) using the jModelTest2 software (Guindon and Gascuel, 2003; Darriba et al., 2012). We then selected the best of four clock models – strict clock, relaxed clock exponential, relaxed clock log normal or random local clock – and two tree prior models, coalescent constant population and coalescent exponential population, using path sampling/stepping stone-sampling marginal-likelihood estimation (Baele et al., 2012). The dataset was analyzed using strict clock and tree prior of coalescent exponential population. The MCMC was run on chain lengths of 150,000,000 steps with sampling every 5,000 steps. The data were then evaluated for effective sample size using the Tracer2 software, and values greater than 200 were accepted. Maximum clade credibility trees were created by discarding the first 10% of the trees (burn-in) using TreeAnnotator v2.4.8 in the BEAST2 package. The time-scaled phylogenetic trees were visualized using FigTree3 v1.4.0 software. The reliability of branches was assessed using the 95% highest posterior density (HPD) interval. The evolutionary rates for the Pro region in the ORF1 genotypes of NoV GII including more than 10 strain sequences (P4, P7, P12, P16, P17, P21, and P31) were also estimated using the models determined from the datasets described above. We could not calculate the evolutionary rate for the Pro region of GII.P2 due to invalid data with a wide range of 95%HPD values.
Calculation of Phylogenetic Distances
We created phylogenetic trees for the Pro region from the datasets of the NoV GII strains and each ORF1 genotype including more than 10 strains using the maximum likelihood (ML) method in the MEGA7 software package (Kumar et al., 2016). We determined the best substitution models using jModelTest2. We calculated the phylogenetic distances between NoV GII strains from the ML distance of the ML tree using the Patristic software (Fourment and Gibbs, 2006).
Construction of Three-Dimensional Structures and Selective Pressure Analyses
We constructed structural models of the Pro proteins (GII.P1:U07611, GII.P2:DQ456824, GII.P3:KJ194500, GII.P4:AB 541272, GII.P5:KJ196288, GII.P6:AB039778, GII.P7:AB039777, GII.P8:AB039780, GII.P12:AB220922, GII.P16:KJ196286, GII. P17:AB983218, GII.P20:EU424333, GII.P21:KJ196284, GII.P24: MG495081, GII.P25:MG495083, GII.P30:AY134748, GII.P31: JX459907, GII.P32:MF405169, GII.P33:GQ845370, GII.P35:KC 576911, GII.P37:KJ194507, GII.P39:FJ537134, GII.P40:DQ3 66347, GII.P41:JX846924, GII.PNA5:MG495082, and GII.PNA7: MG557653) using the homology modeling software, MODELER v9.20 (Webb and Sali, 2014, 2016). The crystal structure of the GII.P4 Pro protein (PDB ID: 6NIR) was used as the template for homology modeling. Amino acid sequences of the template and targets were aligned using the MAFFTash software (Standley et al., 2007; Katoh et al., 2009). The constructed structures were minimized using GROMOS96 (van Gunsteren et al., 1996) implemented in Swiss PDB Viewer v4.1 (Guex and Peitsch, 1997), and structural reliability was evaluated using Ramachandran plots via the RAMPAGE server (Lovell et al., 2003). We identified favored regions of 97.49 ± 0.52%, allowed regions of 2.50 ± 0.51% and outlier regions of 0.01 ± 0.06% [mean ± standard deviation (SD)] of all residues in each structure. Non-synonymous (dN) and synonymous (dS) substitution rates at each codon were calculated to estimate the positive and negative selection sites in the NoV GII Pro regions and in the regions of each genotype including more than three strains using the Datamonkey server (Pond and Frost, 2005; Delport et al., 2010). We identified the consensus sites shown by three methods: single-likelihood ancestor counting (SLAC), fixed effects likelihood (FEL), and internal fixed effects likelihood (IFEL) using a significance level of p < 0.05. We assigned these consensus sites as sites under positive, negative or neutral selection. A two-tail extended binomial distribution was used to calculate the p-value for SLAC. The FEL and IFEL were based on a single degree of freedom likelihood ratio test using an asymptotic chi-squared distribution, in order to classify a site as positively or negatively selected. The final structural models were modified and colored using the Chimera v1.13 software (Pettersen et al., 2004). The substitution sites of the other Pro proteins were compared to a GII.P20 strain (accession no. EU424333) and negative selection at these sites was mapped onto the structure.
Bayesian Skyline Plot Analysis
We estimated the genealogical population size of the Pro region in the ORF1 genotypes of NoV GII including >10 strain sequences (P2, P4, P7, P12, P16, P17, P21, and P31) using a Bayesian skyline plot algorithm using BEAST v2.4.8. Appropriate substitution and clock models were selected as described above. The plots were visualized with 95%HPD using Tracer2.
Statistical Analyses
Statistical analyses were conducted using the EZR statistical software implementation of the Kruskal–Wallis test controlled for multiple comparisons using the Holm test for phylogenetic distances (Kanda, 2013). Detailed statistical data are presented in Supplementary Table S2.
Results
Time-Scaled Phylogenetic Tree Constructed Using the Bayesian MCMC Method
We constructed a time-scaled phylogenetic tree of the Pro region of NoV GII using a Bayesian MCMC method. The 26 ORF1 genotypes of the HuNoV GII strains were classified into three lineages by setting the cut-off value of phylogenetic distances for lineages as 0.9 substitutions/site (Figures 1, 3). With this threshold, we obtained lineage 1 (GII.P6-P8 and P20); lineage 2 (GII.P1-P5, P12, P16, P17, P21, P30–P33, P35, P37, P39, P41, and PNA7) and lineage 3 (GII.P24, P25, P40, and PNA5) (Figure 1). Strains with the GII.P4 formed many clusters of short duration.
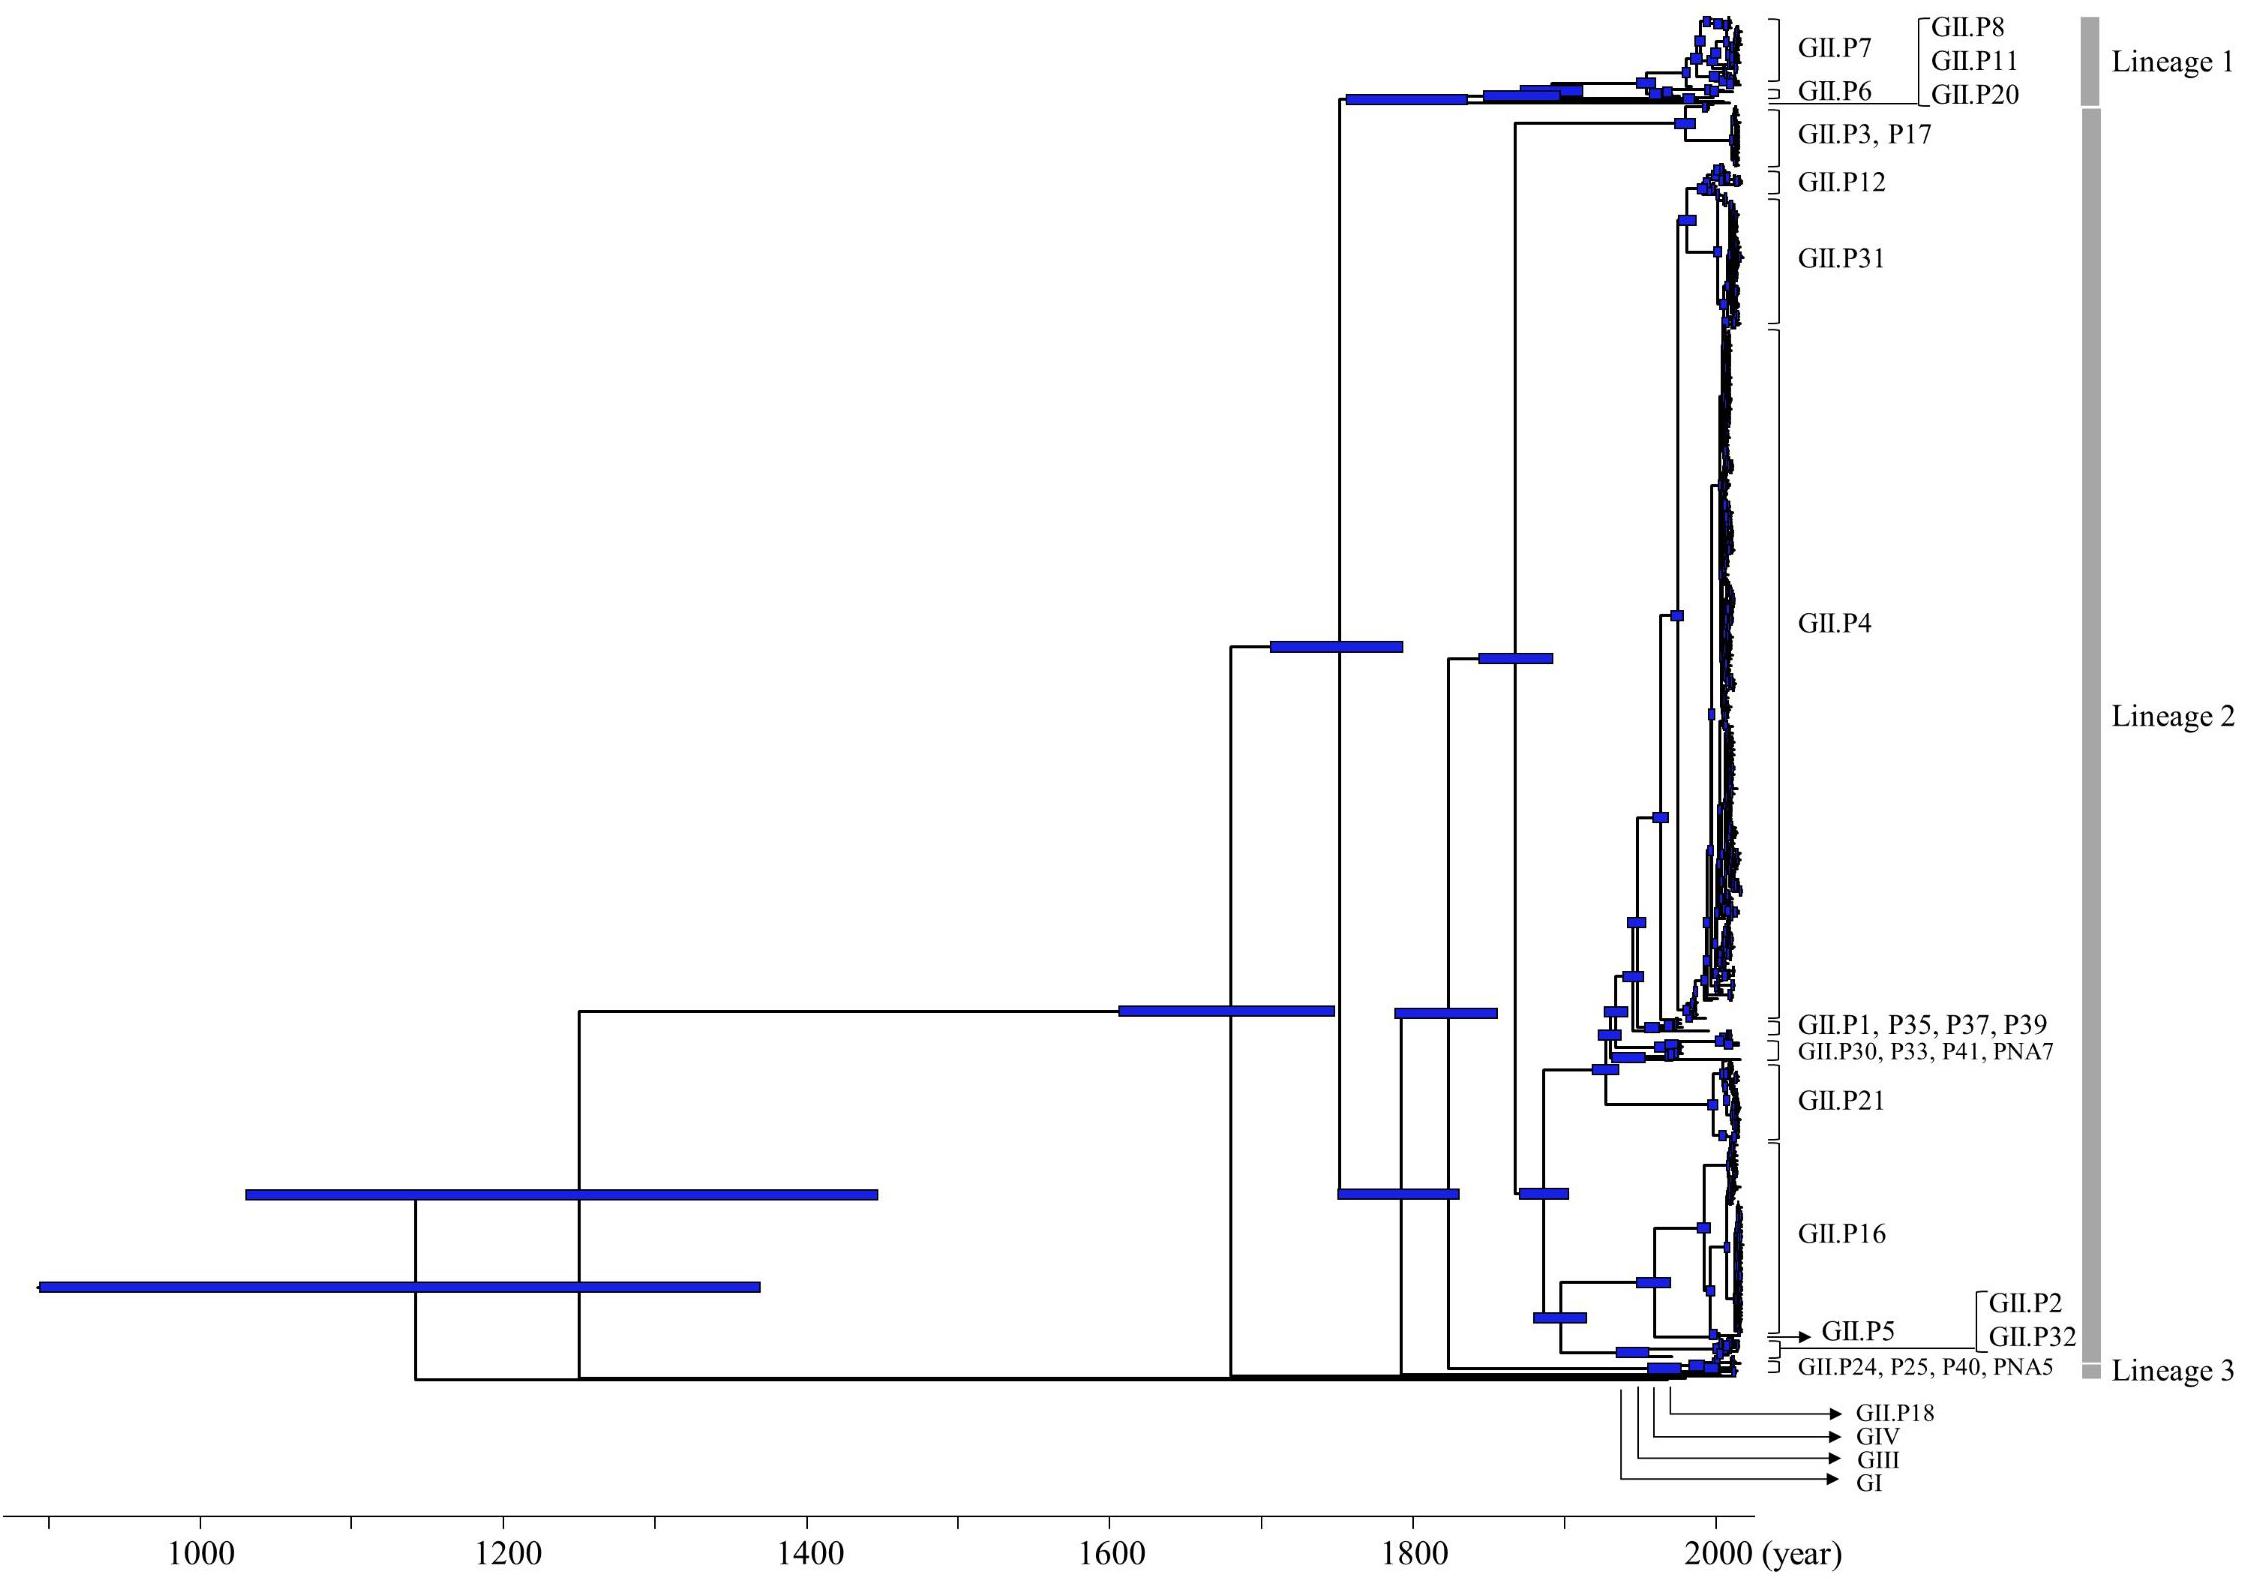
Figure 1. Time-scaled phylogenetic tree of full-length NoV Pro regions constructed using a Bayesian MCMC method. The maximum clade credibility tree of a dataset including the NoV GI, GII, GIII, and GIV genogroups is shown. Blue bars indicate the 95% HPD for each divergent year.
The phylogenetic tree indicated that GI diverged from the common ancestor of GII, GIII, and GIV in 1143 CE (95%HPD, 895–1370), and GIII diverged from the common ancestor of GII and GIV in 1250 CE (95%HPD, 1031–1447). The common ancestor of GII diverged from GIV in 1680 CE (95%HPD, 1607–1749). The common ancestor of NoV GII viruses formed three lineages after 1752 CE (95%HPD, 1707–1794). Lineage 1 diverged in 1873 CE (95%HPD, 1847–1898), lineage 2 in 1868 CE (95%HPD, 1844–1892) and lineage 3 in 1966 CE (95%HPD, 1956–1977). We show the estimated divergence year for the three lineages, and the ORF1 genotypes including two or more strains in Table 1. GII.P20 diverged first from a common ancestor with the other HuNoV GII in 1873 CE (95%HPD, 1847–1898; Supplementary Figure S1).
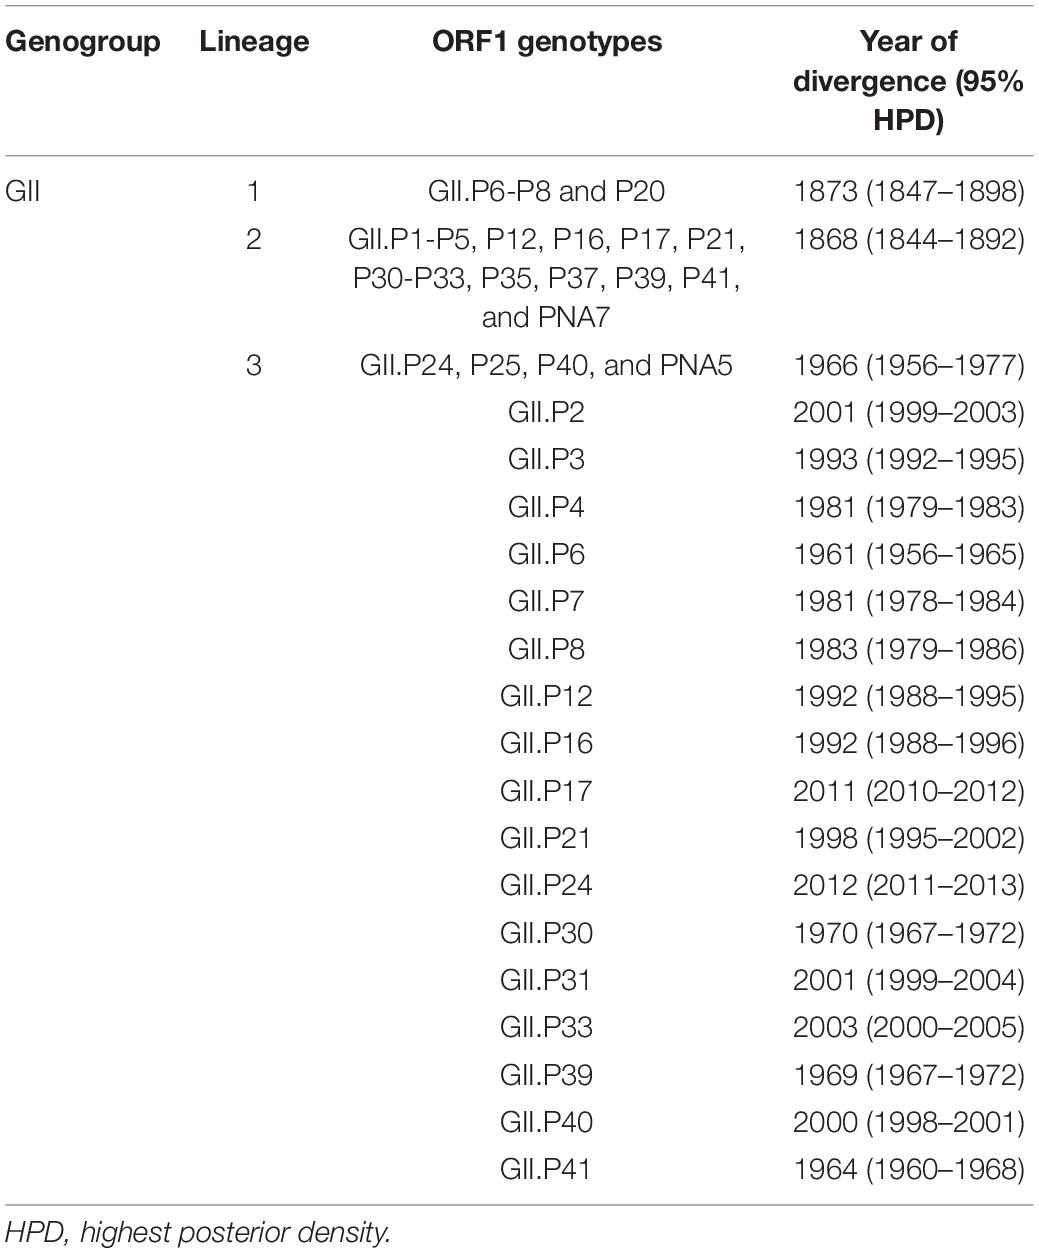
Table 1. Year of divergence of each ORF1 genotype for HuNoV GII.
We also estimated the evolutionary rates for the Pro region in HuNoV GII strains and each ORF1 genotype (Figure 2). The evolutionary rate of this region in the HuNoV GII strains (760 strains) was estimated as 3.94 × 10⁻³ substitutions/site/year (95% HPD, 3.16–4.70 × 10⁻³ substitutions/site/year). The evolutionary rate of GII.P4 was 4.41 × 10⁻³ substitutions/site/year (95% HPD, 3.71–5.12 × 10⁻³ substitutions/site/year). The evolutionary rate of GII.P7 was 3.90 × 10⁻³ substitutions/site/year (95% HPD, 2.91–4.95 × 10⁻³ substitutions/site/year). The evolutionary rate of GII.P12 was 3.85 × 10⁻³ substitutions/site/year (95% HPD, 2.45–5.31 × 10⁻³ substitutions/site/year). The evolutionary rate of GII.P16 was 4.15 × 10⁻³ substitutions/site/year (95% HPD, 3.17–5.14 × 10⁻³ substitutions/site/year. The evolutionary rate of GII.P17 was 1.89 × 10⁻³ substitutions/site/year (95% HPD, 4.99 × 10⁻⁴–3.43 × 10⁻³ substitutions/site/year). The evolutionary rate of GII.P21 was 5.27 × 10⁻³ substitutions/site/year (95% HPD, 3.18–7.51 × 10⁻³ substitutions/site/year). The evolutionary rate of GII.P31 was 4.09 × 10⁻³ substitutions/site/year (95% HPD, 2.32–6.04 × 10⁻³ substitutions/site/year). The average evolutionary rates, including 95%HPD ranges, showed no overlap between GII.P17 and GII.P4, which suggests different evolutionary rates.
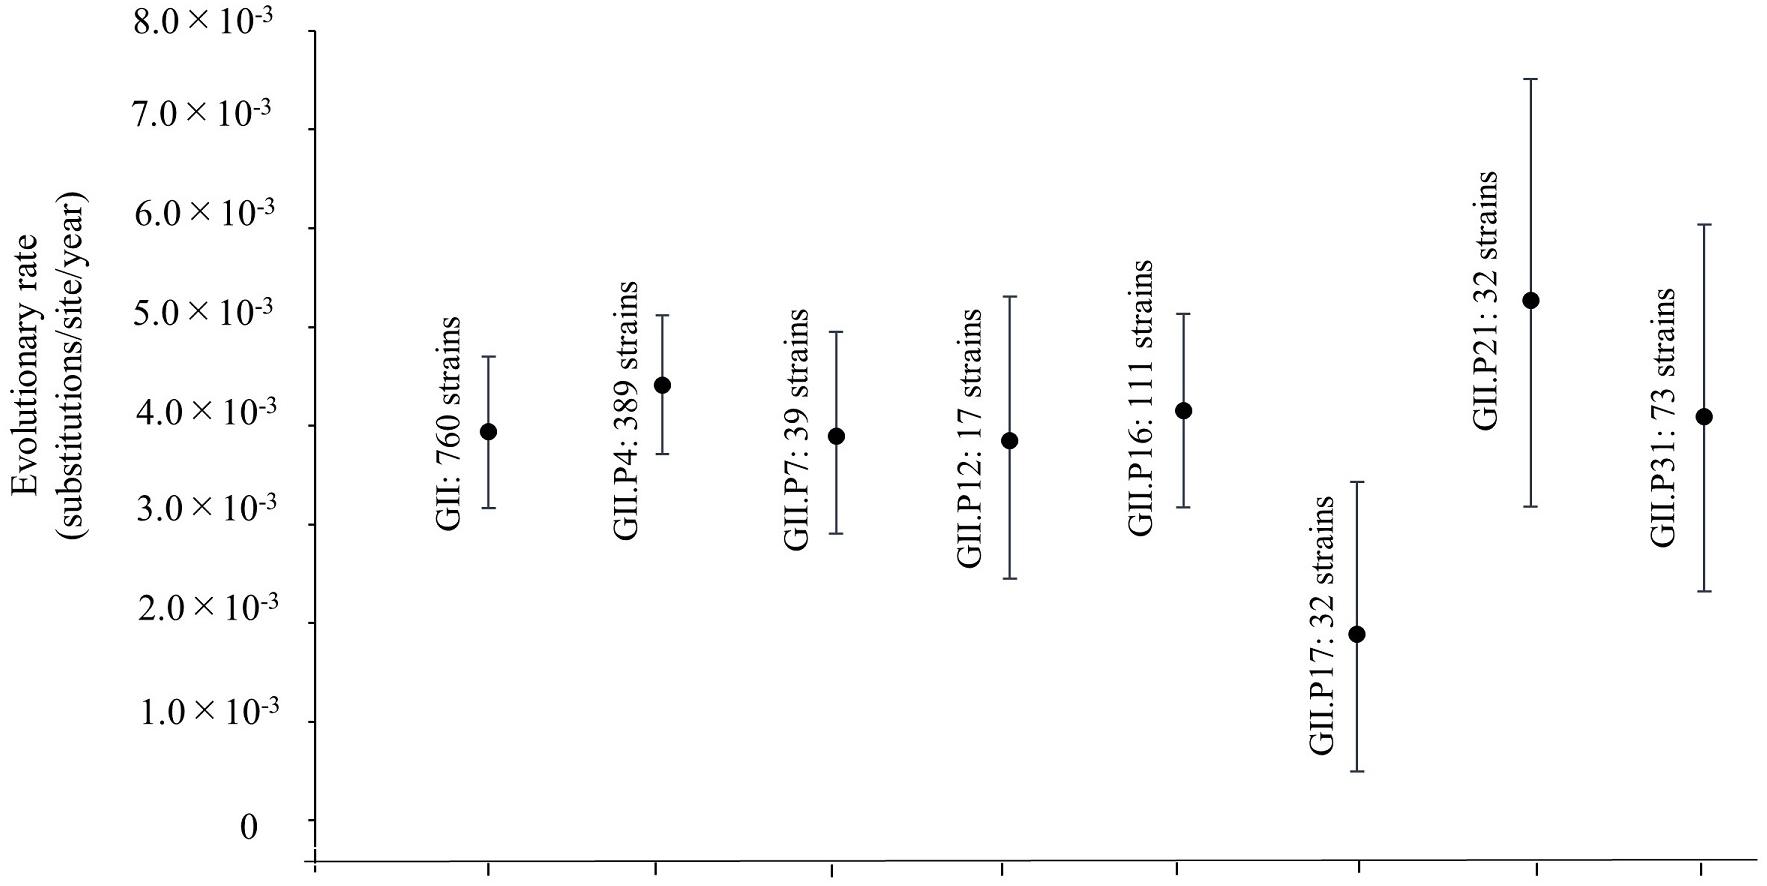
Figure 2. Evolutionary rates of the full-length nucleotide sequences of the NoV Pro regions. The y-axis represents the evolutionary rate (substitutions/site/year) and the x-axis indicates each genotype. The black circles indicate the mean and the bars indicate the interval of 95% HPD. The evolutionary rate of this region in overall HuNoV GII strains (760 strains) was estimated as 3.94 × 10⁻³ substitutions/site/year (95% HPD, 3.16–4.70 × 10⁻³ substitutions/site/year). The evolutionary rates of GII.P4 was 4.41 × 10⁻³ substitutions/site/year (95% HPD, 3.71–5.12 × 10⁻³ substitutions/site/year). The evolutionary rate of GII.P7 was 3.90 × 10⁻³ substitutions/site/year (95% HPD, 2.91–4.95 × 10⁻³ substitutions/site/year). The evolutionary rate of GII.P12 was 3.85 × 10⁻³ substitutions/site/year (95% HPD, 2.45–5.31 × 10⁻³ substitutions/site/year). The evolutionary rate of GII.P16 was 4.15 × 10⁻³ substitutions/site/year (95% HPD, 3.17–5.14 × 10⁻³ substitutions/site/year. The evolutionary rate of GII.P17 was 1.89 × 10⁻³ substitutions/site/year (95% HPD, 4.99 × 10⁻⁴–3.43 × 10⁻³ substitutions/site/year). The evolutionary rate of GII.P21 was 5.27 × 10⁻³ substitutions/site/year (95% HPD, 3.18–7.51 × 10⁻³ substitutions/site/year). The evolutionary rate of GII.P31 was 4.09 × 10⁻³ substitutions/site/year (95% HPD, 2.32–6.04 × 10⁻³ substitutions/site/year).
Phylogenetic Distances of the Pro Region in Norovirus GII Strains
We calculated the number of nucleotide substitutions per site (phylogenetic distance) among the strains and showed the distribution of the distance to estimate the genetic diversity of the ORF1 genotypes and to compare the number between the genotypes in the Pro region of NoV GII. The average number of substitutions of overall NoV GII was 0.517 ± 0.469 per site in the region (mean ± SD; Figure 3). The phylogenetic distances of GII.P4 and GII.P7 were 0.070 ± 0.041 and 0.113 ± 0.057 substitutions/site, respectively. These histograms were distributed with a broad range of distances, indicating accumulating evolution with viral detection for long periods from the emergence of common ancestors (Figures 4B,C). The phylogenetic distances of GII.P2, GII.P12, GII.P17, GII.P21, and GII.P31 were 0.046 ± 0.017, 0.062 ± 0.025, 0.015 ± 0.009, 0.045 ± 0.026, and 0.031 ± 0.024 substitutions/site, respectively. These histograms were distributions with a narrow range of distances, suggesting shorter evolutionary process from the emergence of common ancestors than GII.P4 and GII.P7 (Figures 4A,D,F–H). The phylogenetic distance of GII.P16 was 0.078 ± 0.069 substitutions/site. This histogram showed a bimodal distribution, indicating the form of genetically distant two clusters (Figure 4E). The phylogenetic distances of each ORF1 genotype differed significantly among the ORF1 genotypes in NoV GII (p < 0.001), except for some ORF1 genotypes. Detailed data are presented in Supplementary Table S2.
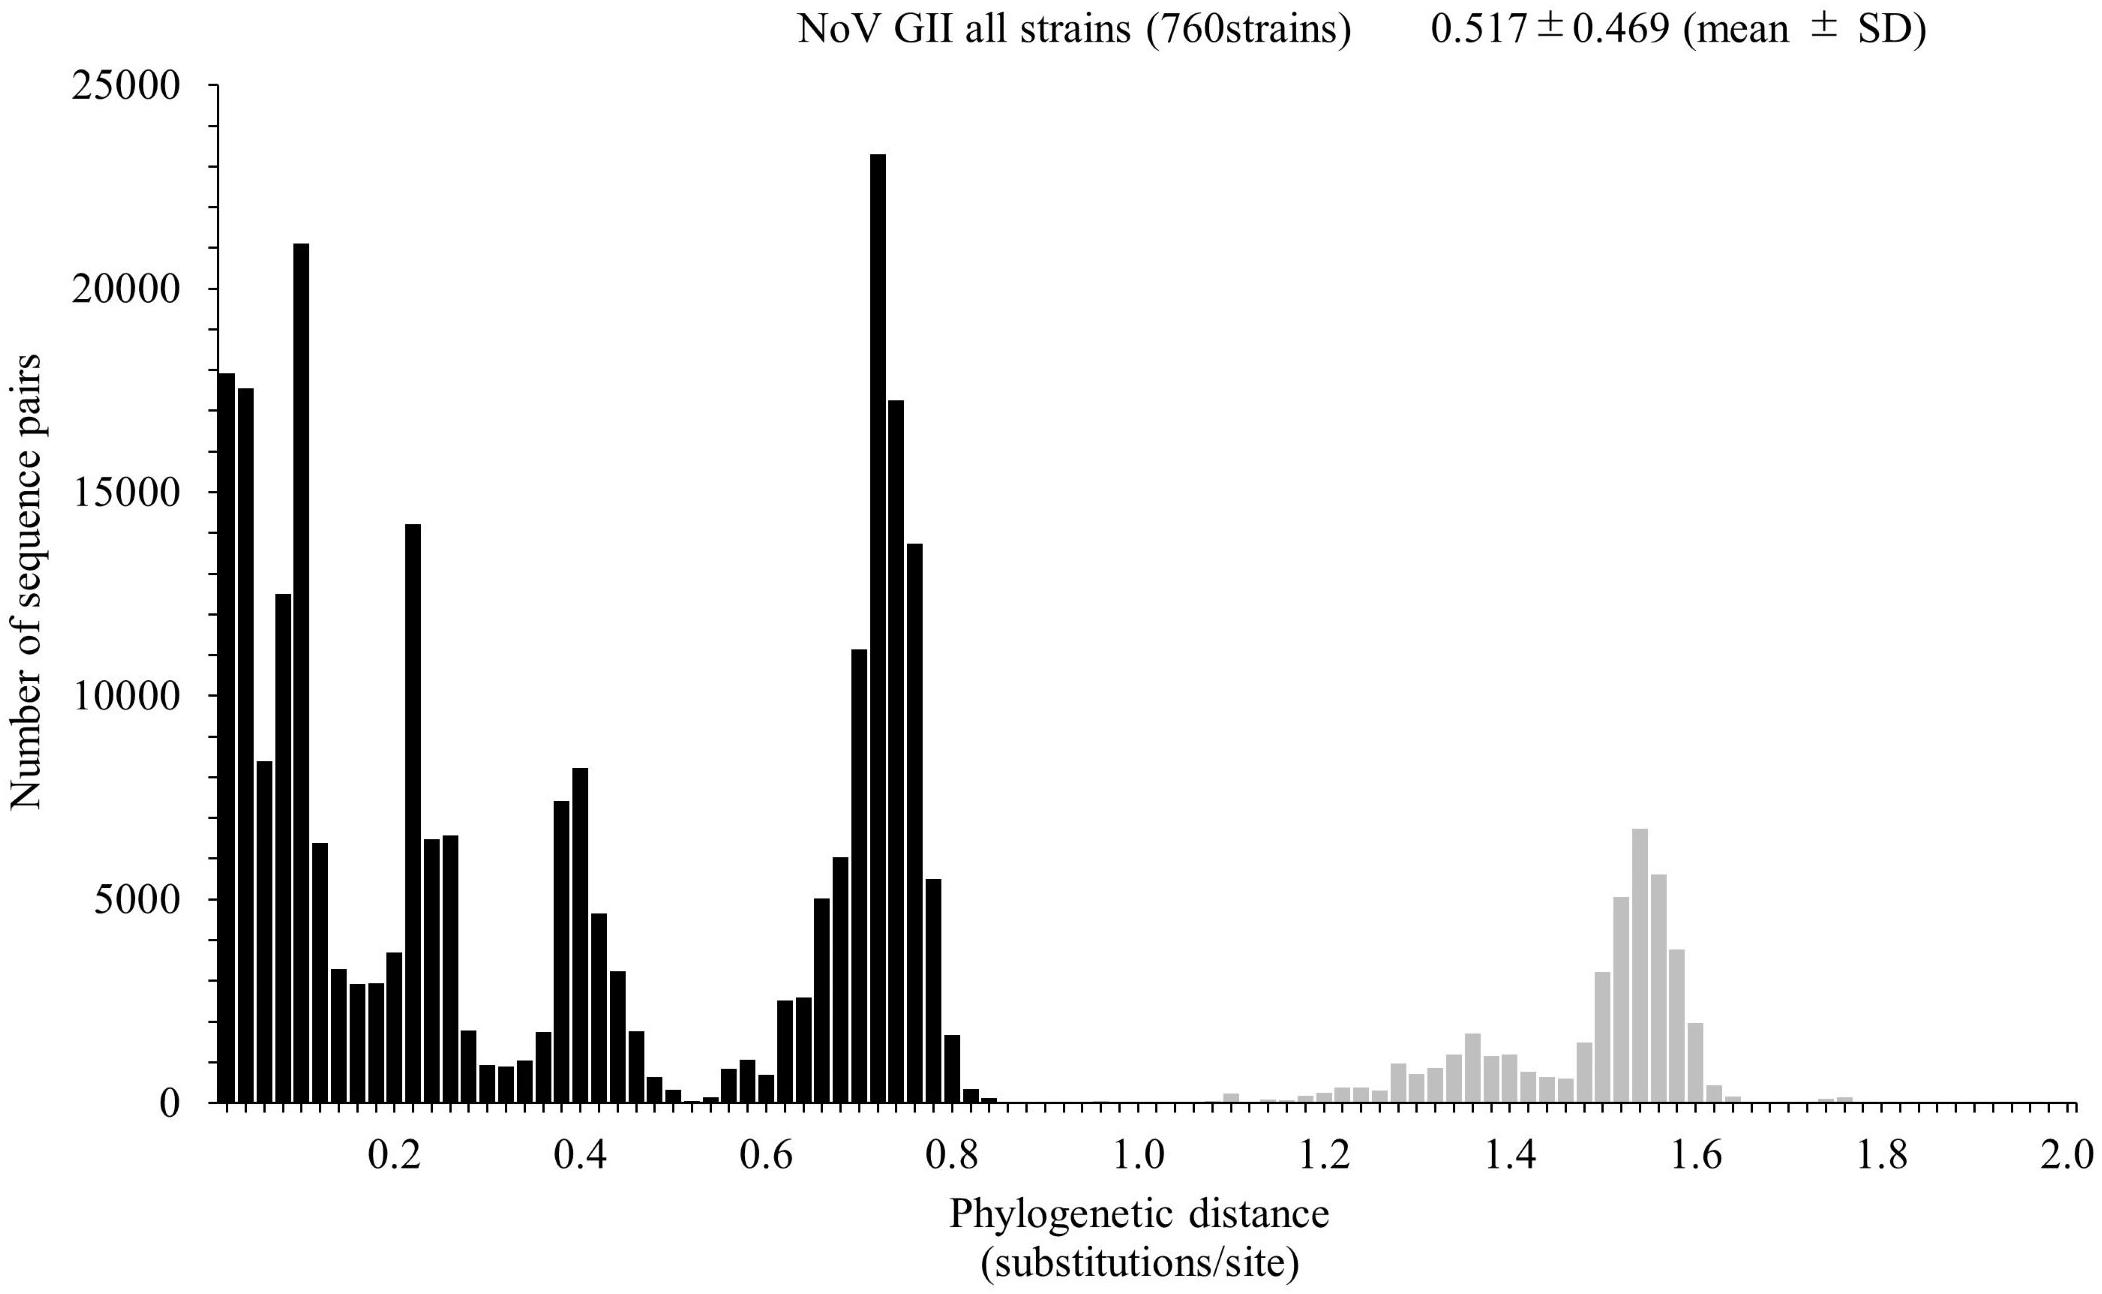
Figure 3. Distribution of phylogenetic distances of GII strains. The phylogenetic distance among NoV GII strains was calculated from the maximum likelihood (ML) tree constructed by the ML method. The y-axis represents the number of sequence pairs corresponding to each distance, and the x-axis shows the phylogenetic distance (substitutions/site). The distribution of phylogenetic distance for≥0.9 substitutions/site is shown in gray. The numbers on the histograms indicate the mean ± SD of the phylogenetic distance for GII strains.
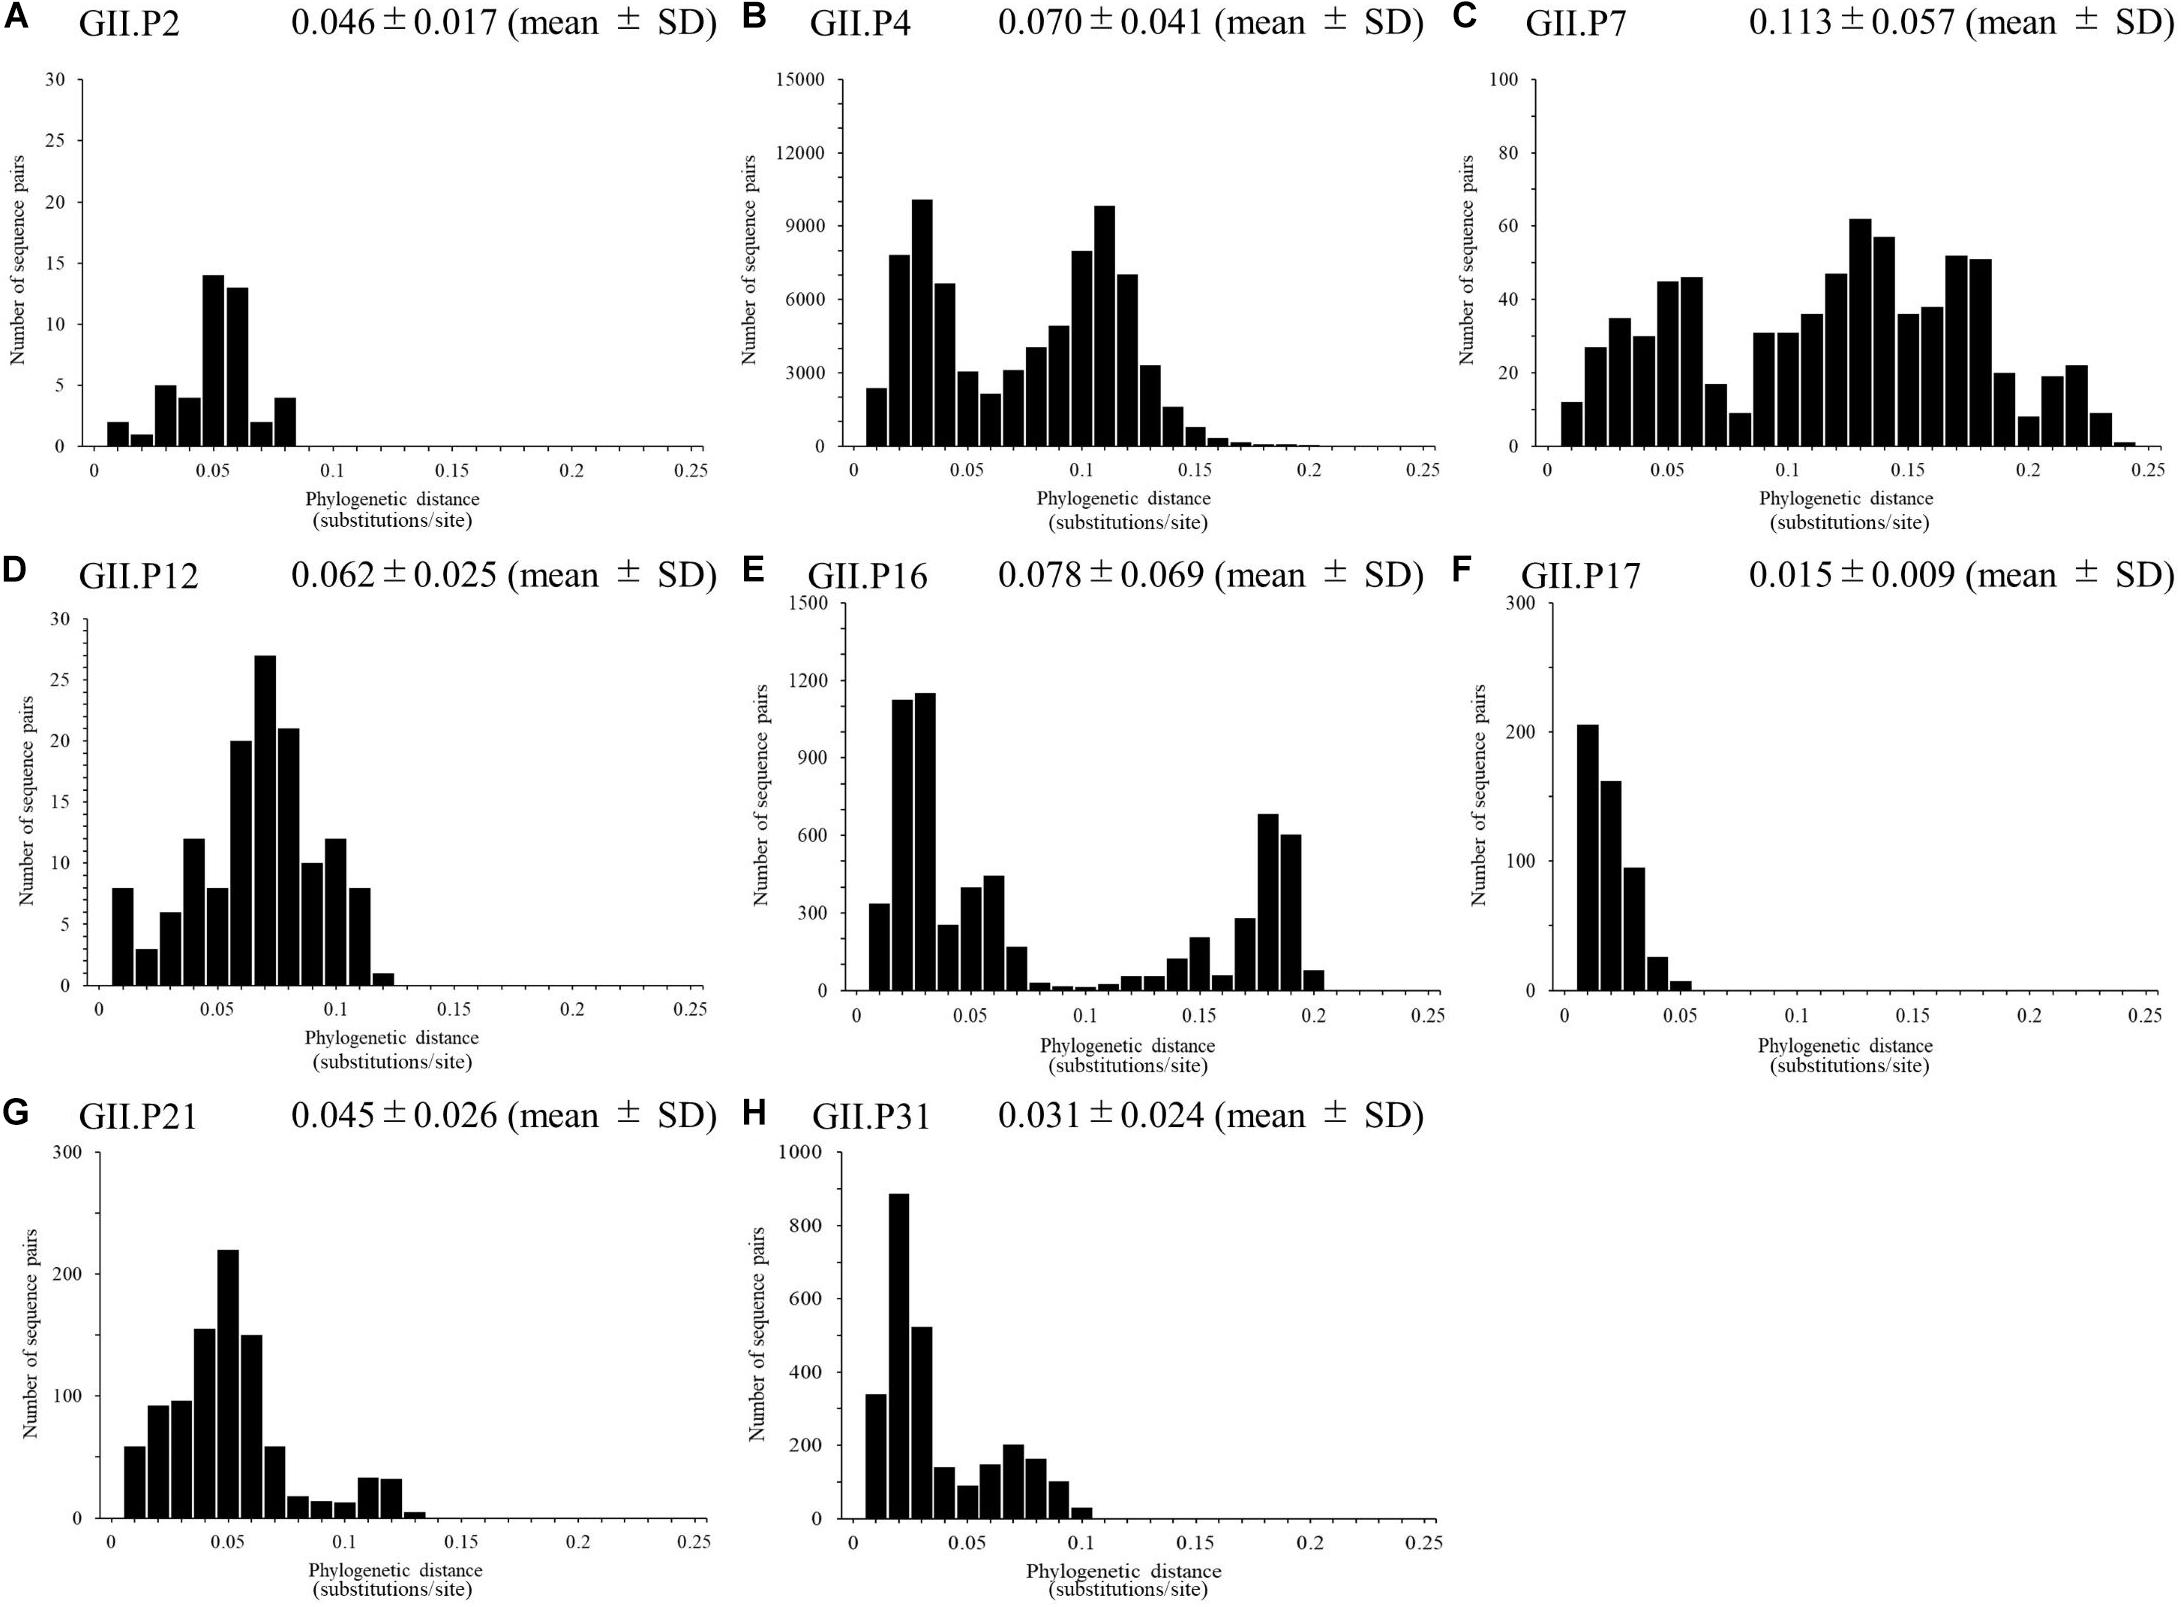
Figure 4. Phylogenetic distance between sequences of the full-length NoV Pro region. The phylogenetic distance between each genotype strain in NoV GII was calculated from the ML tree constructed by the ML method. The distributions of phylogenetic distances of NoV GII.P2 (A), GII.P4 (B), GII.P7 (C), GII.P12 (D), GII.P16 (E), GII.P17 (F), GII.P21 (G), and GII.P31 (H) are shown. The y-axis represents the number of sequence pairs corresponding to each distance, and the x-axis shows the phylogenetic distance (substitutions/site). The numbers on the histograms indicate the mean ± SD of the phylogenetic distances for each genotype (A–H). The statistical results for multiple comparisons are shown in Supplementary Table S2.
Mapping of Amino Acid Substitutions and Negative Selection Sites on the Structures of the Norovirus GII Pro Protein
The substitution sites of the other Pro proteins to GII.P20 were mapped using GII.P20 (Accession no. EU424333) as a reference strain, because GII.P20 was the first to diverge from the common ancestor of the HuNoV GII Pro region (Supplementary Figure S1). We found no substitutions on the active site (H30, H54, and C139) of the protease among GII strains. However, some amino acid substitutions were found near the active site of GII Pro proteins. These substitutions were mostly neutral selection sites (Figure 5 and Supplementary Figure S2). We also mapped the negative selection sites and amino acid substitution sites on the Pro protein structures of NoV GII. Of the substitution sites in each ORF1 genotype, the GII.P4 and GII.P16 strains contained 20 and 6 negative selection sites per monomer, respectively (Table 2), and these sites were distant from the active site (Figure 5). There were five or fewer negative selection sites per monomer in some ORF1 genotypes (GII.P7, P12, P21, and P31), while no negative selection sites were found in the GII.P1, P2, P3, P6, P17, P30, P33, P39, P40, and P41 strains (Table 2). The consensus amino acid site under negative selection among three ORF1 genotypes was 58Leu (GII.P4, P21, and P31) (Supplementary Table S3). The consensus sites between two ORF1 genotypes were 11Ser (GII.P4 and P16), 25Phe (GII.P4 and P16), 47Ile (GII.P4 and P7), 62Lys (GII.P4 and P12), 87Ile (GII.P4 and P7), 129Ser and Gly (GII.P4 and P16), 135Thr and Gly (GII.P4 and P7), 151Tyr (GII.P4 and P16) (Supplementary Table S3). These sites under the negative selection were highly conserved, except for 129 and 135 amino acid positions. No positive selection sites were predicted in all strains of NoV GII genotypes (data not shown). The residues of amino acid under neutral selection were 12Phe and Leu, 14Ser and Thr, 25Phe and Leu, 26Ile and Val, 28Ser and Thr, 32Leu and Ile, 34Ala, Lys, Gln, Pro and Ser, 35Gly and Asn (Supplementary Table S3).
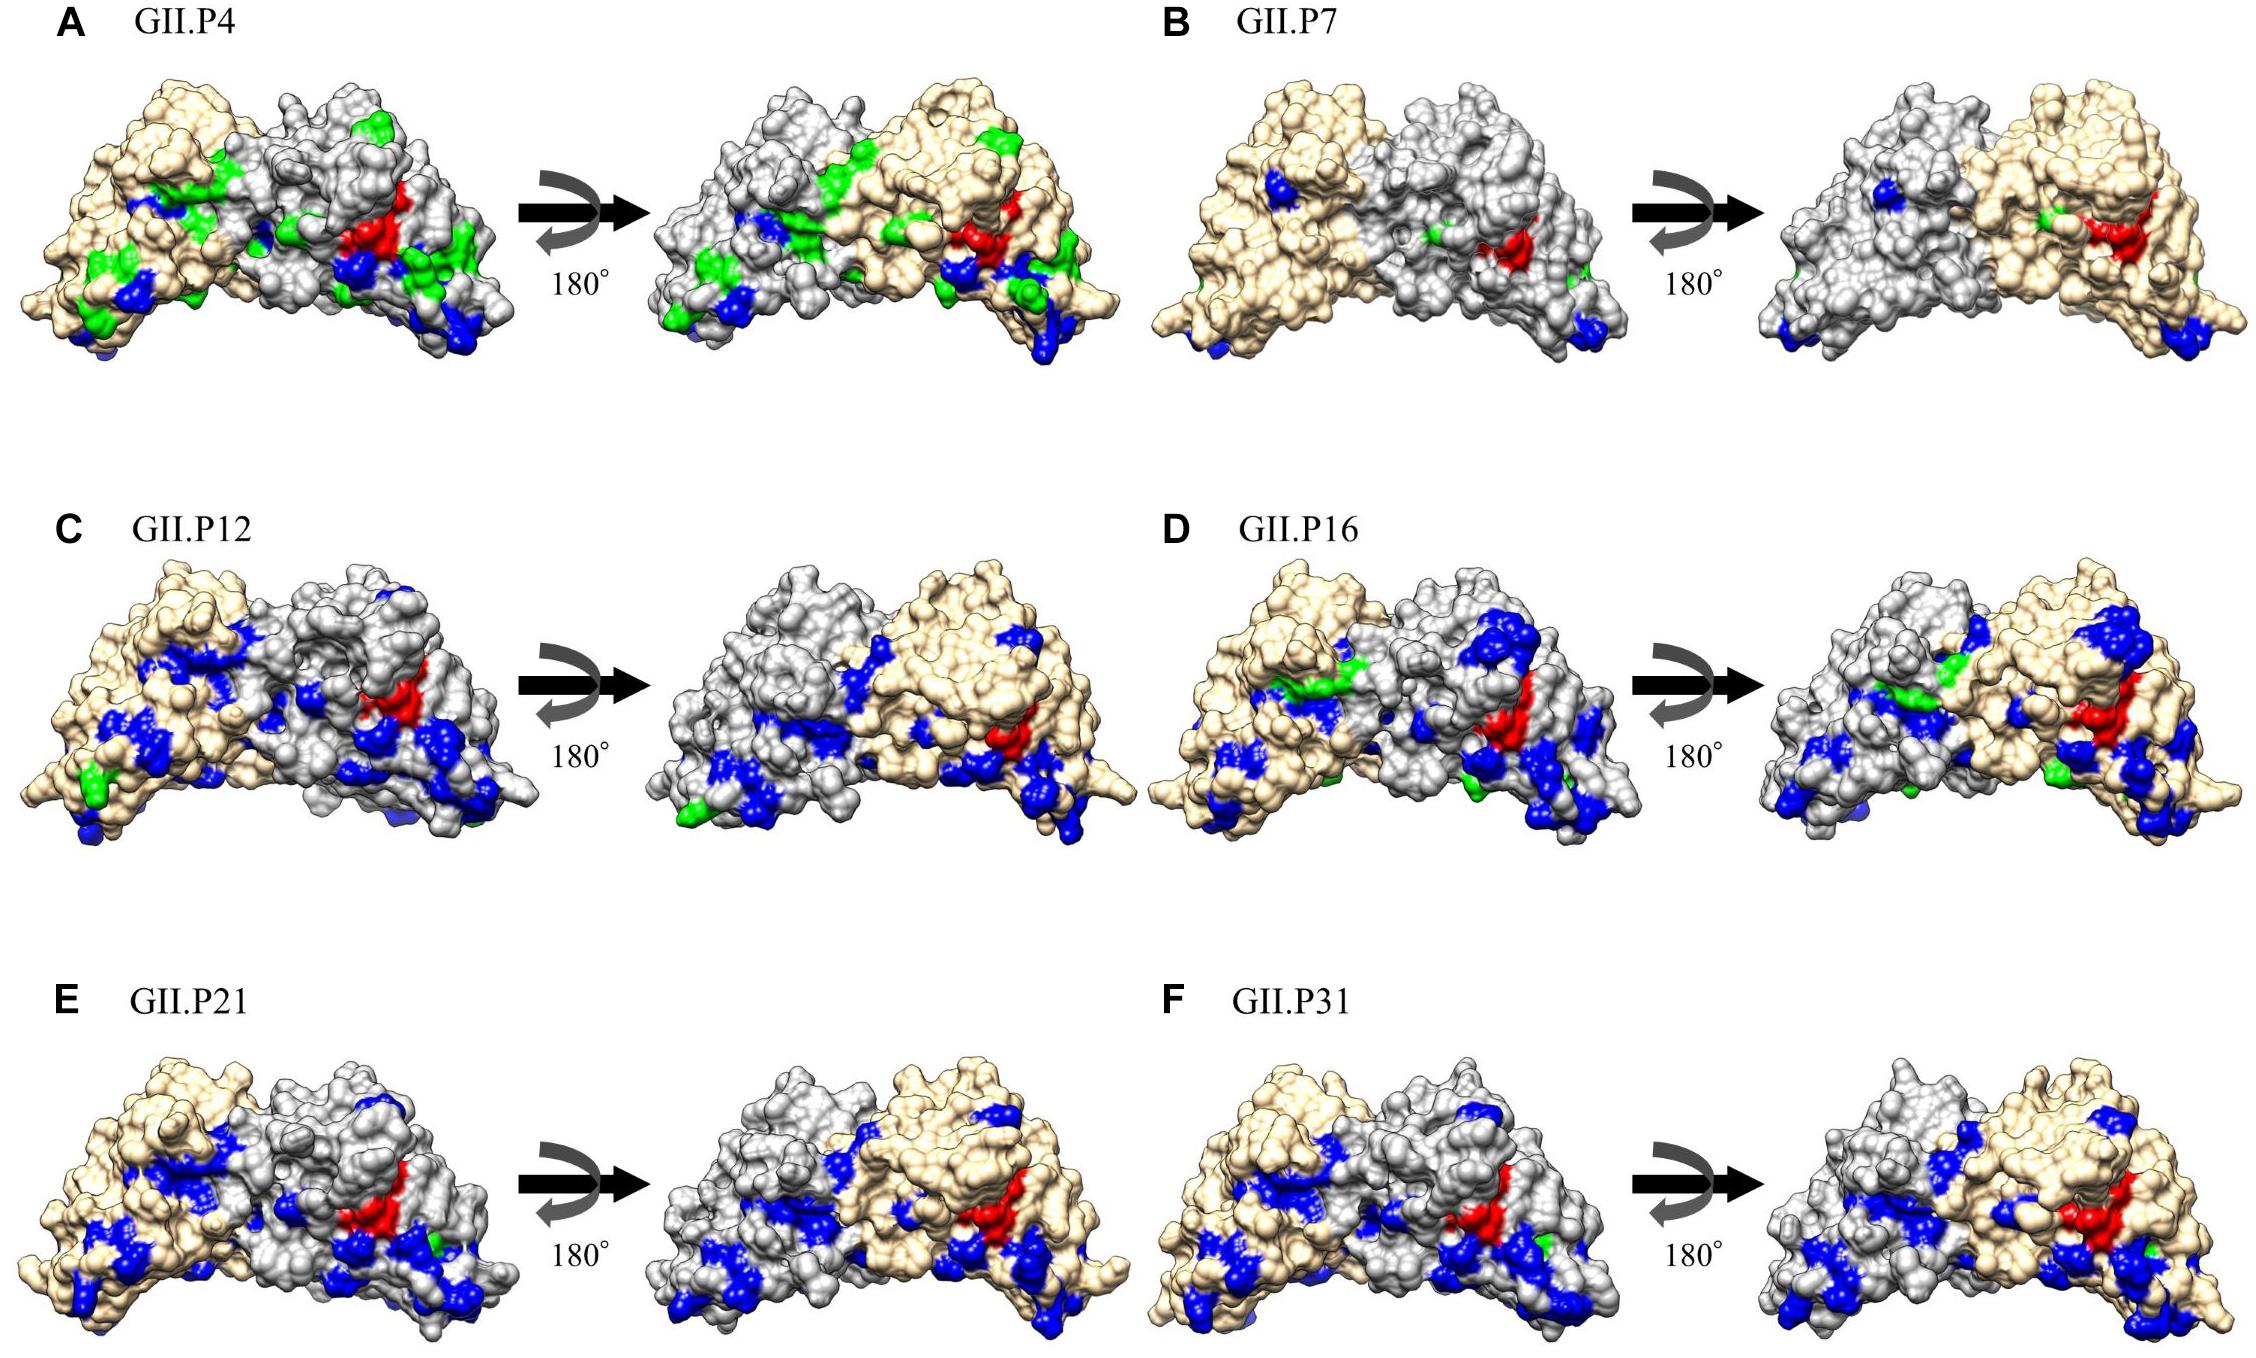
Figure 5. Structural models for the Pro protein of each genotype. Three-dimensional Pro dimer structures for GII.P4 (A), GII.P7 (B), GII.P12 (C), GII.P16 (D), GII.P21 (E), and GII.P31 (F) are shown. The chains composing the dimer structures are colored gray (chain A) and Navajo white (chain B). Negative selection sites are colored green. Amino acid substitutions of the other genotypes compared to a GII.P20 strain are colored blue. Active site residues are colored red.
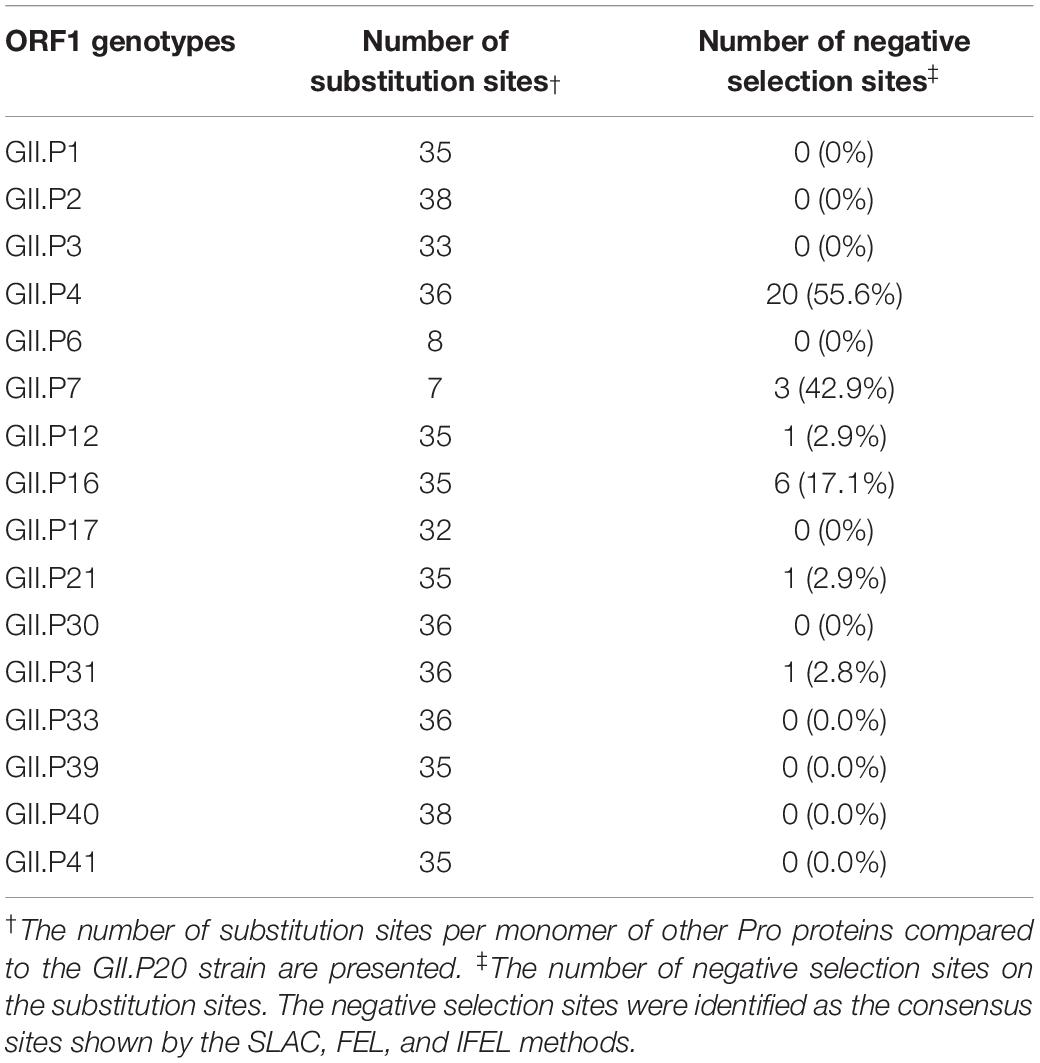
Table 2. The number of amino acid substitution sites and negative selection sites in the HuNoV GII strains.
Phylodynamics of the Pro Region in the Norovirus GII Strains Using the BSP Method
The phylodynamics of the NoV GII Pro region were analyzed using the BSP method and detailed parameters are shown in Supplementary Table S4. The mean effective population size of GII.P4 increased around 2005 and 2008 (Figure 6B). The mean effective population sizes of GII.P7, GII.P16, GII.P21, and GII.P31 increased around 2012, 2015–2016, 2014–2015, and 2011–2012, respectively, while no changes in the population size of the Pro region in other ORF1 genotypes were observed (Figures 6A,C–H).
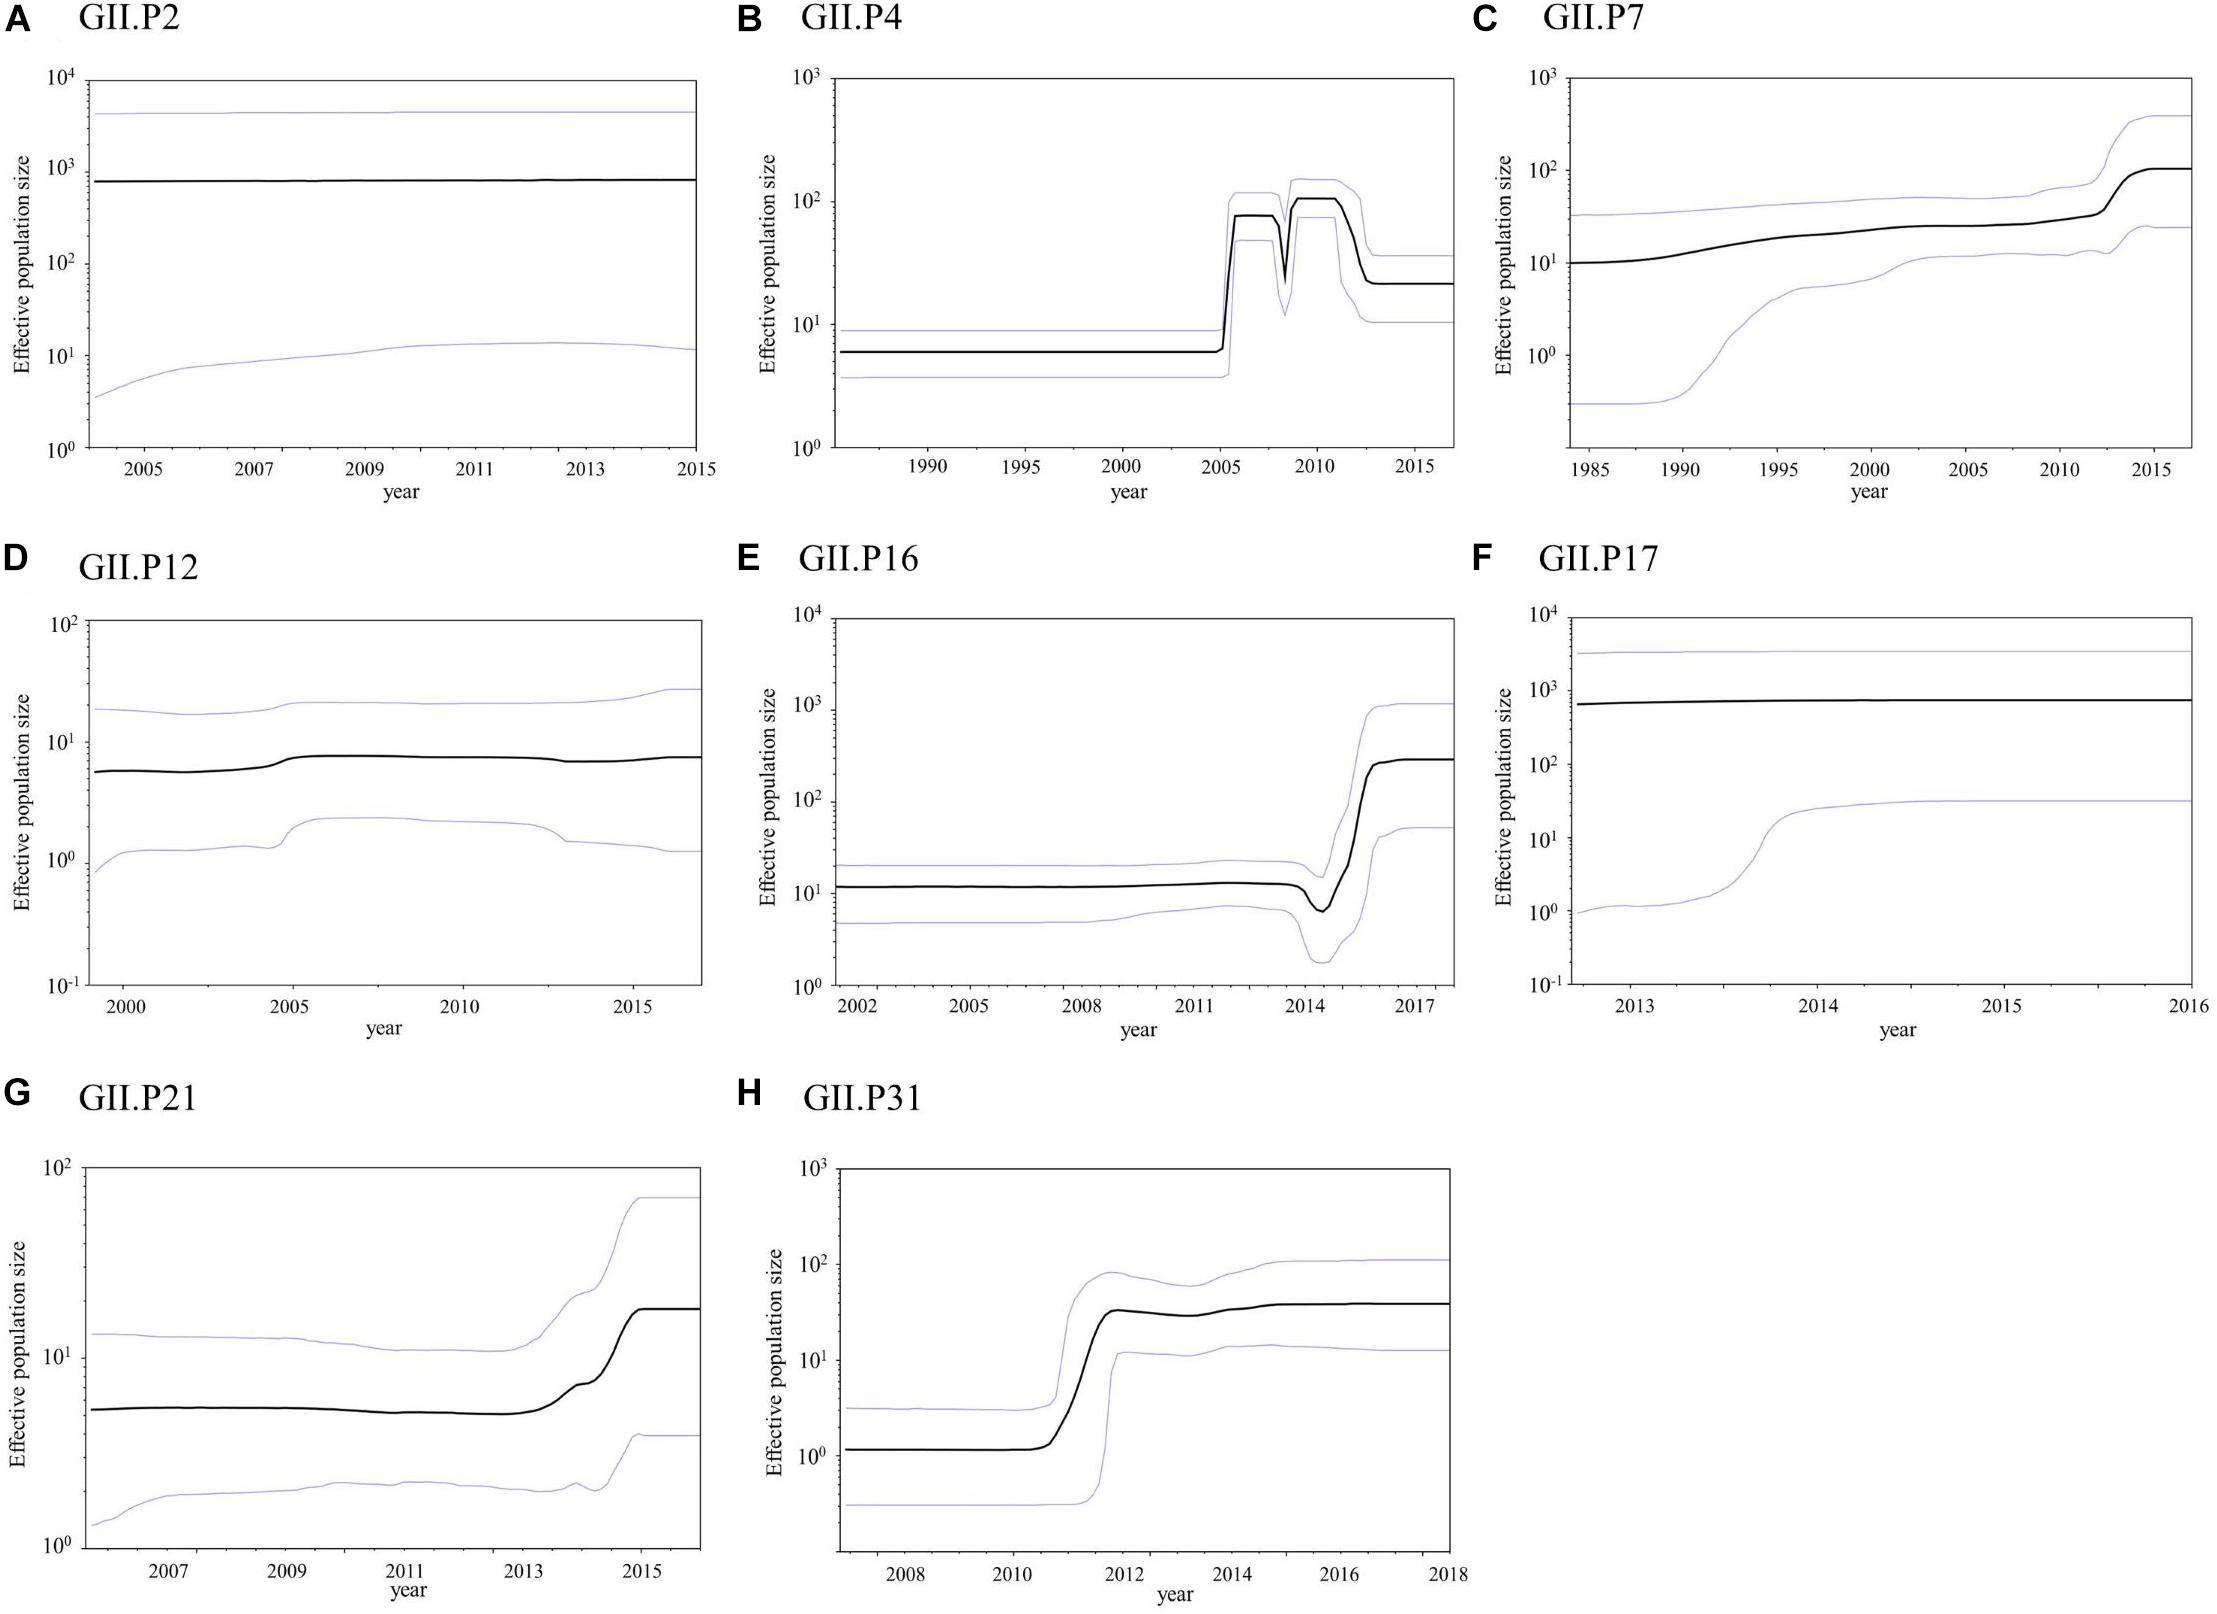
Figure 6. Bayesian skyline plot for the NoV GII strains. Plots for GII.P2 (A), GII.P4 (B), GII.P7 (C), GII.P12 (D), GII.P16 (E), GII.P17 (F), GII.P21 (G), and GII.P31 (H) are shown. The y-axis represents the effective population size on a logarithmic scale, while the x-axis denotes the time in years. The solid black line indicates the mean posterior value and intervals with 95% HPD are represented by blue lines.
Discussion
We studied the molecular evolution of the Pro regions in NoV GII. To the best of our knowledge, there is no comprehensive molecular evolutionary study focused on the NoV Pro regions. Our findings suggest that (i) the common ancestor of the Pro region of the analyzed strains, including GI, GII, GIII, and GIV, diverged around 880 years ago (1143 CE), and the GII Pro region diverged from GIV around 340 years ago (1680 CE) and formed three major lineages of NoV GII strains around 270 years ago (1752 CE); (ii) the estimated evolutionary rate of the Pro region was >10–3 substitutions/site/year, and the values for each genotype were different; (iii) several amino acid substitutions (7–38 sites per monomer) in the GII protease were detected under neutral selection proximal to the active sites and under negative selection in the distant residues from the sites, and (iv) the phylodynamics of the GII Pro region showed different patterns of fluctuation between genotypes. These results suggested that the Pro region of the NoV GII evolved rapidly with amino acid substitutions under no positive selection, and the evolutionary trends were different between the ORF1 genotypes.
A time-scaled phylogenetic tree constructed using a Bayesian MCMC method indicated that the Pro region showed similar evolutionary process to the RdRp region, but was different from the VP1 region at post emergence of the GII cluster, including the generations of three lineages (Kobayashi et al., 2016; Ozaki et al., 2018). We estimated that the Pro region, the RdRp region and the VP1 region diverged around 270 years ago (1752 CE), around 290 years ago (1731 CE) and around 390 years ago (1630 CE), respectively, to form the GII cluster. The years of divergence of the Pro and RdRp regions were very similar (270 vs. 290 years ago), whereas the year of divergence of the VP1 region was different by approximately 100 years. The year in divergence of each lineage was comparable between the Pro and RdRp regions (Ozaki et al., 2018). We estimated that in lineage 1 the Pro region diverged around 150 years ago (1873 CE) and the RdRp region around 170 years ago (1847 CE). In lineage 2, the Pro and the RdRp regions diverged around 150 years ago (1868 CE). In lineage 3, the Pro region diverged around 50 years ago (1966 CE) and the RdRp region around 80 years ago (1936 CE). Ozaki et al. (2018) recently classified 23 ORF1 genotypes in the HuNoV GII strains into three lineages: lineage 1 (GII.P6-P8, P15 and P20), lineage 2 (GII.P1-P5, P12, P16, P17, P21, P30-P33, P35, and P37), and lineage 3 (GII.P22, P23, and P24). The phylogenetic topology in the ORF1 genotypes and the year of divergence of each lineage were almost analogous between the Pro and the RdRp regions. Thus, we estimated that the Pro and RdRp regions undergo shared evolution without recombination in NoV GII. However, we found incompatibility between the topology and the divergent year between the Pro and the VP1 regions (Kobayashi et al., 2016), suggesting distinct evolutionary patterns with recombination between the Pro/RdRp region and the VP1 region in NoV GII.
Several evolutionary studies of the VP1 region and the RdRp region of NoVs have been carried out (Bok et al., 2009; Siebenga et al., 2010; Mahar et al., 2013; Kobayashi et al., 2016; Motoya et al., 2017). In a study of NoV protease, Cotten et al. (2014) estimated the evolutionary rate of the 3CL-Pro in GII.P4-GII.4 as 6.03 × 10⁻³ substitutions/site/year. However, there appears to be no comprehensive evolutionary studies using strains collected globally. This study showed that the evolutionary rate of the GII Pro region was estimated at 3.94 × 10⁻³ substitutions/site/year, and that evolution at different rates occurred between the ORF1 genotypes (Figure 2). The Pro region evolved rapidly (>10–3 substitutions/site/year) as did the VP1 region and the RdRp region (Kobayashi et al., 2016; Ozaki et al., 2018). We therefore speculate that evolutionary rates in the other regions on the NoV genome were rapid.
We analyzed the phylogenetic distances among strains of each genotype, and discovered that the distances differed among strains for each genotype (Figures 4A–H). The histograms of the distances of the GII.P4 and GII.P7 indicated a broad range of distributions, suggesting that they are more genetically diverse than the other ORF1 genotypes. The histograms of the distances of GII.P2, GII.P12, GII.P17, GII.P21, and GII.P31 showed a narrow range distribution, suggesting low genetic divergence. The histogram of the distance of GII.P16 showed a bimodal distribution, suggesting that they contain two distinct groups within the same genotype. The trends of phylogenetic distance distribution among genotypes in the GII Pro region were analogous to that of the GII RdRp region (Ozaki et al., 2018). Thus, it appears that the GII Pro and RdRp regions might co-evolve.
We also predicted negative selection sites in the Pro protein in silico, and mapped these sites (Figure 5). We identified several possible negative selection sites in the Pro proteins of each genotype. Of them, the GII.P4 Pro protein contained more negative selection sites (20 sites per monomer) at the amino acid substitution sites than other genotypes. The substitution sites under negative selection were separated from the active site of NoV GII protease (Figure 5). In general, negative selection could be important in preventing the loss of viral protein function, because a high proportion of mutations will be deleterious (Domingo, 2006). These results may suggest that the amino acid substitutions distant from the active site in the GII Pro proteins are deleterious for viral propagation, probably, due to instability of the protein structure. We also found that relatively many amino acid substitutions occurred near the active site of the GII Pro proteins (Figure 5, Supplementary Table S3 and Supplementary Figure S2). These substitutions were mostly predicted to be under neutral selection. Thus, the substitutions may not influence the loss of the GII Pro protein function but may change the cleavage activity and affect the efficiency of viral propagation. A previous study reported that the amino acids adjacent to the active sites in the Pro protein of enterovirus 71 play a crucial role in protease activity based on the reduction of activity caused by the mutations of the residues (Wang et al., 2011). Moreover, Viskovska et al. (2019) reported that the NoV GII protease showed activity in a pH-dependent manner by interactions between the residues H30 and R112. In this study, we found that these amino acids were conserved in most GII genotypes, except for GII.P25 (Supplementary Table S3). Therefore, these results suggest that the GII genotypes have a potential to exhibit pH-dependent protease activity.
The phylodynamics of each ORF1 genotype were also assessed in this study (Figure 6). The phylodyamics of GII.P4, GII.P7, GII.P16, GII.P21, and GII.P31 fluctuated at specific times. GII.P4 increased around 2005 and 2008. GII.P7, GII.P16, GII.P21, and GII.P31 increased around 2012, 2015–2016, 2014–2015, and 2011–2012, respectively. In GII.P4 and GII.P31, the collection year of GII.4 agreed with the year when the population size increased. In GII.P7 and GII.P21, the collection year of GII.6 and GII.3, respectively, was almost consistent with the year in which the population size increased. In GII.P16, the collection year of GII.2 and GII.4 corresponded with the year of increase of population size (Nagasawa et al., 2018; Barclay et al., 2019). Previous reports have shown a correlation between fluctuations in population size and the epidemiology of actual outbreaks (Motomura et al., 2008, 2010; Chen et al., 2015; van Beek et al., 2017; Nagasawa et al., 2018; Barclay et al., 2019; Brown et al., 2019). In this study, we observed similar results in the phylodynamics of NoV protease according to the VP1 and RdRp regions (Kobayashi et al., 2016; Ozaki et al., 2018). These results suggest that it is useful to analyze phylodynamics focused on the Pro region in order to investigate past epidemics of each NoV genotype. This study has a limitation, in that it used a restricted number of GII Pro sequences from the GenBank. In addition, sequences with ≥99.8% identity were omitted. These selection biases may have affected the results of the bioinformatics analyses to some extent.
Conclusion
In conclusion, we estimated that the common ancestor of the GII Pro region diverged many years ago, and NoV GII evolved rapidly. The GII Pro regions and proteins evolved with many amino acid substitutions, but no positively selective pressure was identified. The substitutions under neutral selection adjacent to the active sites of the proteins suggest that the GII genotypes have a potential to alter the protease activity. This study indicates a need to compare the efficiency of antiviral drugs for the Pro protein between NoV genotypes in conjunction with continuing investigation into the evolution of the NoV Pro region and the activity of the protein in vitro.
Data Availability Statement
All datasets generated for this study are included in the article/Supplementary Material.
Author Contributions
KO, KK, and HK designed the study. KO, YM, KN, JA, TS, KY, KM, TM, MK, and HK analyzed the data. KO, YM, AR, KK, and HK wrote and supervised the study. All authors read and approved the manuscript.
Funding
This work was supported by a commissioned project for Research on Emerging and Re-emerging Infectious Diseases from the Japan Agency for Medical Research and Development, AMED (Grant Nos. JP19fk0108033h0003 and JP19fk0108103h0201).
Conflict of Interest
KO was employed by the company Niitaka Co., Ltd.
The remaining authors declare that the research was conducted in the absence of any commercial or financial relationships that could be construed as a potential conflict of interest.
Acknowledgments
We thank Dr. Kiyotaka Fujita for valuable discussions.
Supplementary Material
The Supplementary Material for this article can be found online at: https://www.frontiersin.org/articles/10.3389/fmicb.2019.02991/full#supplementary-material
Footnotes
- ^ http://www.ncbi.nlm.nih.gov/genbank
- ^ http://tree.bio.ed.ac.uk/software/tracer/
- ^ http://tree.bio.ed.ac.uk/software/figtree/
References
Baele, G., Lemey, P., Bedford, T., Rambaut, A., Suchard, M. A., and Alekseyenko, A. V. (2012). Improving the accuracy of demographic and molecular clock model comparison while accommodating phylogenetic uncertainty. Mol. Biol. Evol. 29, 2157–2167. doi: 10.1093/molbev/mss084
Barclay, L., Canno, J. L., Wikswo, M. E., Phillips, A. R., Browne, H., Montmayeur, A. M., et al. (2019). Emerging novel GII.P16 noroviruses associated with multiple capsid genotypes. Viruses 11, E535. doi: 10.3390/v11060535
Bartsch, S. M., Lopman, B. A., Ozawa, S., Hall, A. J., and Lee, B. Y. (2016). Global economic burden of norovirus gastroenteritis. PLoS One 11:e0151219. doi: 10.1371/journal.pone.0151219
Blakeney, S. J., Cahill, A., and Reilly, P. A. (2003). Processing of Norwalk virus non-structural proteins by a 3C-like cysteine proteinase. Virology 308, 216–224. doi: 10.1016/S0042-6822(03)00004-7
Bok, K., Abente, E. J., Realpe-Quintero, M., Mitra, T., Sosnovtsev, S. V., Kapikian, A. Z., et al. (2009). Evolutionary dynamics of GII.4 noroviruses over a 34-year period. J. Virol. 83, 11890–11901. doi: 10.1128/JVI.00864-09
Bouckaert, R., Heled, J., Kühnert, D., Vaughan, T., Wu, C. H., Xie, D., et al. (2014). BEAST 2: a software platform for Bayesian evolutionary analysis. PLoS Comput. Biol. 10:e1003537. doi: 10.1371/journal.pcbi.1003537
Brown, J. R., Ryo, S., Shah, D., Williams, C. A., Williams, R., Dunn, H., et al. (2019). Norovirus transmission dynamics in a pediatric hospital using full genome sequences. Clin. Infect. Dis. 68, 222–228. doi: 10.1093/cid/city438
Bruggink, L. D., Moselen, J. M., and Marshall, J. A. (2016). The comparative molecular epidemiology of GII.P7_GII.6 and GII.P7_GII.7 norovirus outbreaks in Victoria, Australia, 2012-2014. Intervirology 59, 60–65. doi: 10.1159/000448100
Bruggink, L. D., Triantafilou, M. J., and Marshall, J. A. (2018). The molecular epidemiology of norovirus outbreaks in Victoria, 2016. Commun. Dis. Intell. 42, s2209–s6051.
Cannon, J. L., Barclay, L., Collins, N. R., Wikswo, M. E., Castro, C. J., Magaña, L. C., et al. (2017). Genetic and epidemiologic trends of norovirus outbreaks in the United States from 2013 to 2016 demonstrated emergence of novel GII.4 recombinant viruses. J. Clin. Microbiol. 55, 2208–2221. doi: 10.1128/jcm.00455-17
Chen, S. Y., Feng, Y., Chao, H. C., Lai, M. W., Huang, W. L., Lin, C. Y., et al. (2015). Emergence in Taiwan of novel norovirus GII.4 variants causing acute gastroenteritis and intestinal haemorrhage in children. J. Med. Microbiol. 64, 544–550. doi: 10.1099/jmm.0.000046
Chhabra, P., Graaf, M., Parra, G. I., Chan, M. C., Green, K., Martella, V., et al. (2019). Updated classification of norovirus genogroups and genotypes. J. Gen. Virol. 100, 1393–1406. doi: 10.1099/jgv.0.001318
Cotten, M., Petrova, V., Phan, M. V., Rabaa, M. A., Watson, S. J., Ong, S. H., et al. (2014). Deep sequencing of norovirus genomes defines evolutionary patterns in an urban tropical setting. J. Virol. 88, 11056–11069. doi: 10.1128/JVI.01333-14
Darriba, D., Taboada, G. L., Doallo, R., and Posada, D. (2012). jModelTest 2: more models, new heuristics and parallel computing. Nat. Methods 9:772. doi: 10.1038/nmeth.2109
Delport, W., Poon, A. F., Frost, S. D., and Kosakovsky Pond, S. L. (2010). Datamonkey 2010: a suite of phylogenetic analysis tools for evolutionary biology. Bioinformatics 26, 2455–2457. doi: 10.1093/bioinformatics/btq429
Domingo, E. (2006). “Virus evolution,” in Fields Virology, 5th Edn, eds D. M. Knipe, P. M. Howley, and P. A. Philadelphia, (New York, NY: Lippincott Williams & Wilkins), 389–421.
Drummond, A. J., and Rambaut, A. (2007). BEAST: bayesian evolutionary analysis by sampling trees. BMC Evol. Biol. 7:214. doi: 10.1186/1471-2148-7-214
Fourment, M., and Gibbs, M. J. (2006). PATRISTIC: a program for calculating patristic distances and graphically comparing the components of genetic change. BMC Evol. Biol. 6:1. doi: 10.1186/1471-2148-6-1
Green, K. Y. (2013). “Caliciviridae: the noroviruses,” in Fields Virology, 6th Edn, eds D. M. Knipe, and P. M. Howley, (Philadelphia, PA: Wolters Kluwer Health/Lippincott Williams & Silkins), 582–608.
Guex, N., and Peitsch, M. C. (1997). SWISS-MODEL and the Swiss-PdbViewer: an environment for comparative protein modeling. Electrophoresis 18, 2714–2723. doi: 10.1002/elps.1150181505
Guindon, S., and Gascuel, O. (2003). A simple, fast and accurate method to estimate large phylogenies by maximum-likelihood. Syst. Biol. 52, 696–704. doi: 10.1080/10635150390235520
Hall, A. J., Lopman, B. A., Payne, D. C., Patel, M. M., Gastañaduy, P. A., Vinjé, J., et al. (2013). Norovirus disease in the United States. Emerg. Infect. Dis. 19, 1198–1205. doi: 10.3201/eid1908.130465
Hardstaff, J. L., Clough, H. E., Lutje, V., McIntyre, K. M., Harris, J. P., Garner, P., et al. (2018). Foodborne and food-handler norovirus outbreaks: a systematic review. Foodborne Pathog. Dis. 15, 589–597. doi: 10.1089/fpd.2018.2452
Hussey, R. J., Coates, L., Gill, R. S., Erskine, P. T., Coker, S. F., Mitchell, E., et al. (2011). A structural study of norovirus 3C protease specificity: binding of a designed active site-directed peptide inhibitor. Biochem 50, 240–249. doi: 10.1021/bi1008497
Kanda, Y. (2013). Investigation of the freely available easy-to-use software ‘EZR’ for medical statistics. Bone Marrow Transplant. 48, 452–458. doi: 10.1038/bmt.2012.244
Katoh, K., Asimenos, G., and Toh, H. (2009). Multiple alignment of DNA sequences with MAFFT. Methods Mol. Biol. 537, 39–64. doi: 10.1007/978-1-59745-251-9_3
Katoh, K., and Standley, D. M. (2013). MAFFT multiple sequence alignment software version 7: improvements in performance and usability. Mol. Biol. Evol. 30, 772–780. doi: 10.1093/molbev/mst010
Kobayashi, M., Matsushima, Y., Motoya, T., Sakon, N., Shigemoto, N., Okamoto-Nakagawa, R., et al. (2016). Molecular ecolution of the capsid gene in human norovirus genogroupII. Sci. Rep. 6:29400. doi: 10.1038/srep29400
Kroneman, A., Vennema, H., Deforche, K. V. D., Avoort, H., Peñaranda, S., Oberste, M. S., et al. (2011). An automated genotyping tool for enteroviruses and noroviruses. J. Clin. Virol 51, 121–125. doi: 10.1016/j.jcv.2011.03.006
Kroneman, A., Verhoef, L., Harris, J., Vennema, H., Duizer, E., van Duynhoven, Y., et al. (2008). Analysis of integrated virological and epidemiological reports of norovirus outbreaks collected within the Foodborne Viruses in Europe network from 1 July 2001 to 30 June 2006. J. Clin. Microbiol. 46, 2959–2965. doi: 10.1128/JCM.00499-08
Kumar, S., Stecher, G., and Tamura, K. (2016). MEGA7: molecular evolutionary genetics analysis version 7.0 for bigger datasets. Mol. Biol. Evol. 33, 1870–1874. doi: 10.1093/molbev/msw054
Le Guyader, F. S., Le Saux, J. C., Ambert-Balay, K., Krol, J., Serais, O., Parnaudeau, S., et al. (2008). Aichi virus, norovirus, astrovirus, enterovirus, and rotavirus involved in clinical cases from a French oyster-related gastroenteritis outbreak. J. Clin. Microbiol. 46, 4011–4017. doi: 10.1128/JCM.01044-08
Liu, B., Clarke, I. N., and Lambden, P. R. (1996). Polyprotein processing in Southampton virus: identification of 3C-like protease cleavage sites by in vitro mutagenesis. J. Virol. 70, 2605–2610.
Lopman, B. A., Adak, G. K., Reacher, M. H., and Brown, D. W. (2003). Two epidemiologic patterns of norovirus outbreaks: surveillance in England and wales, 1992-2000. Emerg. Infect. Dis. 9, 71–77. doi: 10.3201/eid0901.020175
Lovell, S. C., Davis, I. W., Arendall, W. B. III, de Bakker, P. I., Word, J. M., Prisant, M. G., et al. (2003). Structure validation by Calpha geometry: phi, psi and Cbeta deviation. Proteins. 50, 437–450. doi: 10.1002/prot.10286
Mahar, J. E., Bok, K., Green, K. Y., and Kirkwood, C. D. (2013). The importance of intergenic recombination in norovirus GII.3 evolution. J. Virol. 87, 3687–3698. doi: 10.1128/jvi.03056-12
Martin, D. P., Murrell, B., Golden, M., Khoosal, A., and Muhire, B. (2015). RDP4: detection and analysis of recombination patterns in virus genomes. Virus Evol. 1:vev003. doi: 10.1093/ve/vev003
Matsushima, Y., Ishikawa, M., Shimizu, T., Komane, A., Kasuo, S., Shinohara, M., et al. (2015). Genetic analyses of GII.17 norovirus strains in diarrheal disease outbreaks from December 2014 to March 2015 in Japan reveal a novel polymerase sequence and amino acid substitutions in the capsid region. Euro. Surveill. 20:21173. doi: 10.2807/1560-7917.ES2015.20.26.21173
Motomura, K., Oka, T., Yokoyama, M., Nakamura, H., Mori, H., Ode, H., et al. (2008). Identification of monomorphic and divergent haplotypes in the 2006-2007 norovirus GII/4 epidemic population by genomewide tracing of evolutionary history. J. Virol. 82, 11247–11262. doi: 10.1128/JVI.00897-08
Motomura, K., Yokoyama, M., Ode, H., Nakamura, H., Mori, H., Kanda, T., et al. (2010). Divergent evolution of norovirus GII/4 by genome recombination from May 2006 to February 2009 in Japan. J. Virol. 84, 8085–8097. doi: 10.1128/JVI.02125-09
Motoya, T., Nagasawa, K., Matsushima, Y., Nagata, N., Ryo, A., Sekizuka, T., et al. (2017). Molecular evolution of the VP1 gene in human norovirus GII.4 variants in 1974-2015. Front. Microbiol. 8:2399. doi: 10.3389/fmicb.2017.02399
Muhaxhiri, Z., Deng, L., Shanker, S., Sankaran, B., Estes, M. K., Palzkill, T., et al. (2013). Structural basis of substrate specificity and protease inhibition in Norwalk virus. J. Virol. 87, 4281–4292. doi: 10.1128/JVI.02869-12
Muzzarelli, K. M., Kuiper, B., Spellmon, N., Brunzelle, J., Hackett, J., Amblard, F., et al. (2019). Structural and antiviral studies of the human norovirus GII.4 protease. Biochem 58, 900–907. doi: 10.1021/acs.biochem.8b01063
Nagasawa, K., Matsushima, Y., Motoya, T., Mizukoshi, F., Ueki, Y., Sakon, N., et al. (2018). Phylogeny and immunoreactivity of norovirus GII.P16-GII.2. Japan, Winter 2016-17. Emerg. Infect. Dis. 24, 144–148. doi: 10.3201/eid2401.170284
Ozaki, K., Matsushima, Y., Nagasawa, K., Motoya, T., Ryo, A., Kuroda, M., et al. (2018). Molecular evolutionary analyses of the RNA-dependent RNA polymerase region in norovirus genogroup II. Front. Microbiol. 9:3070. doi: 10.3389/fmicb.2018.03070
Patel, M. M., Widdowson, M. A., Glass, R. I., Akazawa, K., Vinjé, J., and Parashar, U. D. (2008). Systematic literature review of role of noroviruses in sporadic gastroenteritis. Emerg. Infect. Dis. 14, 1224–1231. doi: 10.3201/eid1408.071114
Pettersen, E. F., Goddard, T. D., Huang, C. C., Couch, G. S., Greenblatt, D. M., Meng, E. C., et al. (2004). UCSF Chimera–a visualization system for exploratory research and analysis. J. Comput. Chem. 25, 1605–1612. doi: 10.1002/jcc.20084
Pond, S. L., and Frost, S. D. (2005). Datamonkey: rapid detection of selective pressure on individual sites of codon alignments. Bioinformatics 21, 2531–2533. doi: 10.1093/bioinformatics/bti320
Räsänen, S., Lappalainen, S., Kaikkonen, S., Hämäläinen, M., Salminen, M., and Vesikari, T. (2010). Mixed viral infections causing acute gastroenteritis in children in a waterborne outbreak. Epidemiol. Infect. 138, 1227–1234. doi: 10.1017/S0950268809991671
Robilotti, E., Deresinski, S., and Pinsky, B. A. (2015). Norovirus. Clin. Microbiol. Rev. 28, 134–164. doi: 10.1128/CMR.00075-14
Sakon, N., Sadamasu, K., Shinkai, T., Hamajima, Y., Yoshitomi, H., Matsushima, Y., et al. (2018). Foodborne outbreaks caused by human norovirus GII.P17-GII.17-contaminated nori, Japan, 2017. Emerg. Infect. Dis. 24, 920–923. doi: 10.3201/eid2405.171733
Siebenga, J. J., Lemey, P., Kosakovsky Pond, S. L., Rambaut, A., Vennema, H., and Koopmans, M. (2010). Phylodynamic reconstruction reveals norovirus GII.4 epidemic expansions and their molecular determinants. PLoS Pathog. 6:e1000884. doi: 10.1371/journal.ppat.1000884
Sievers, F., Wilm, A., Dineen, D., Gibson, T. J., Karplus, K., Li, W., et al. (2011). Fast, scalable generation of high-quality protein multiple sequence alignments using Clustal Omega. Mol. Syst. Biol. 7:539. doi: 10.1038/msb.2011.75
Standley, D. M., Toh, H., and Nakamura, H. (2007). ASH structure alignment package: sensitivity and selectivity in domain classification. BMC Bioinformatics 8:116. doi: 10.1186/1471-2105-8-116
van Beek, J., de Graaf, M., Smits, S., Schapendonk, C. M. E., Verjans, G. M. G. M., Vennema, H., et al. (2017). Whole-genome next-generation sequencing to study within-host evolution of norovirus (NoV) among immunocompromised patients with chronic NoV infection. J. Infect. Dis. 216, 1513–1524. doi: 10.1093/infdis/jix520
van Gunsteren, W. F., Billeter, S. R., Eising, A. A., Hünenberger, P. H., Krüger, P., Mark, A. E., et al. (1996). Biomolecular Simulation: The GROMOS96 Manual and User Guide. Switzerland: Vdf Hochschulverlag AG an der ETH Zürich Press.
Viskovska, M. A., Zhao, B., Shanker, S., Choi, J. M., Deng, L., Song, Y., et al. (2019). GII.4 norovirus protease shows pH-sensitive proteolysis with a unique Arg-His pairing in the catalytic site. J. Virol. 93:e01479-e8. doi: 10.1128/JVI.01479-18
Wang, J., Fan, T., Yao, X., Wu, Z., Guo, L., Lei, X., et al. (2011). Crystal structures of enterovirus 71 3C protease complexed with rupintrivir reveal the roles of catalytically important residues. J. Virol. 85, 10021–10030. doi: 10.1128/JVI.05107-11
Wangchuk, S., Matsumoto, T., Iha, H., and Ahmed, K. (2017). Surveillance of norovirus among children with diarrhea in four major hospitals in Bhutan: replacement of GII.21 by GII.3 as a dominant genotype. PLoS One 12:e0184826. doi: 10.1371/journal.pone.0184826
Webb, B., and Sali, A. (2014). Protein structure modeling with MODELLER. Methods Mol. Biol. 1137, 1–15. doi: 10.1007/978-1-4939-0366-5_1
Keywords: molecular evolution, norovirus, GII, bioinformatics, protease, negative selection
Citation: Ozaki K, Matsushima Y, Nagasawa K, Aso J, Saraya T, Yoshihara K, Murakami K, Motoya T, Ryo A, Kuroda M, Katayama K and Kimura H (2020) Molecular Evolution of the Protease Region in Norovirus Genogroup II. Front. Microbiol. 10:2991. doi: 10.3389/fmicb.2019.02991
Received: 02 September 2019; Accepted: 10 December 2019;
Published: 14 January 2020.
Edited by:
Rosa Maria Pintó, University of Barcelona, SpainReviewed by:
Susana Guix, University of Barcelona, SpainJavier Buesa, University of Valencia, Spain
Copyright © 2020 Ozaki, Matsushima, Nagasawa, Aso, Saraya, Yoshihara, Murakami, Motoya, Ryo, Kuroda, Katayama and Kimura. This is an open-access article distributed under the terms of the Creative Commons Attribution License (CC BY). The use, distribution or reproduction in other forums is permitted, provided the original author(s) and the copyright owner(s) are credited and that the original publication in this journal is cited, in accordance with accepted academic practice. No use, distribution or reproduction is permitted which does not comply with these terms.
*Correspondence: Kazuhiko Katayama, a2F0YXlhbWFAbGlzY2kua2l0YXNhdG8tdS5hYy5qcA==; Hirokazu Kimura, aC1raW11cmFAcGF6LmFjLmpw