 Ivan P. Ishkov
 Sang-Joon Ahn
 Kelly C. Rice
 Stephen J. Hagen
- 1Department of Physics, University of Florida, Gainesville, FL, United States
- 2Department of Oral Biology, College of Dentistry, University of Florida, Gainesville, FL, United States
- 3Department of Microbiology and Cell Science, Institute of Food and Agricultural Sciences, University of Florida, Gainesville, FL, United States
The cidAB and lrgAB operons of Streptococcus mutans encode proteins that are structurally similar to the bacteriophage lambda family of holin-antiholin proteins, which are believed to facilitate cell death in other bacterial species. Although their precise function is not known, cidAB and lrgAB are linked to multiple virulence traits of S. mutans, including oxidative stress tolerance, biofilm formation, and autolysis. Here we investigate the regulation of lrgAB which in S. mutans shows a complex dependence on growth conditions that is not fully understood. By combining single-cell imaging of a fluorescent gene reporter with microfluidic control of the extracellular environment, we identify specific environmental cues that trigger lrgA expression and characterize cell-to-cell heterogeneity in lrgA activity. We find that the very abrupt activation of lrgA at stationary phase is tightly synchronized across the population. This activation is controlled by a small number of inputs that are sensitive to growth phase: extracellular pyruvate, glucose, and molecular oxygen. Activation of lrgA appears to be self-limiting, so that strong expression of lrgA is confined to a short interval of time. lrgA is programmed to switch on briefly at the end of exponential growth, as glucose and molecular oxygen are exhausted and extracellular pyruvate is available. Our findings are consistent with studies of other bacteria showing that homologs of lrgAB participate, with input from lytST, in the reimport of pyruvate for anaerobic fermentative growth.
Introduction
The oral pathogen Streptococcus mutans (Loesche, 1986) possesses two operons, designated cidAB (SMU.1701/1700) and lrgAB (SMU.575/574) (Ahn et al., 2007), that are closely homologous to the cidAB and lrgAB operons which have been extensively studied in organisms such as Bacillus subtilis and Staphylococcus aureus (Brunskill and Bayles, 1996; Groicher et al., 2000; Rice et al., 2003; Rice and Bayles, 2003; Bayles, 2007; Charbonnier et al., 2017; van den Esker et al., 2017a,b). Sequence homology indicates that cidAB and lrgAB encode membrane proteins that are similar to holin-antiholin membrane proteins of the bacteriophage lambda family (Young, 1992, 2002; Young and Bläsi, 1995; Ahn et al., 2010). These proteins control autolysis and cell death by modulating the permeability of the bacterial cell wall (Young and Bläsi, 1995; Young, 2002; Pang et al., 2013; Saier and Reddy, 2015; van den Esker et al., 2017b). In S. mutans, deletions in cidAB or lrgAB have been shown to affect virulence-related behaviors such as autolysis, genetic competence, antibiotic resistance, biofilm development, and response to heat and oxidative stresses (Ahn et al., 2010, 2012, 2017; Ahn and Rice, 2016; Rice et al., 2017). Consequently, cidAB and lrgAB have been viewed as potentially encoding an S. mutans holin-antiholin system that responds to conditions of environmental stress by triggering autolysis and cell death (Chatfield et al., 2005; Ahn et al., 2010). However, the regulation of cidAB and lrgAB in S. mutans is complex and although the operons appear linked their precise function has not yet been established (Ahn et al., 2010, 2012; Ahn and Rice, 2016). Recent investigations of the link between these operons and cell death have found evidence that lrgAB homologs in S. mutans and other organisms may be more closely linked to metabolic control – and particularly to pyruvate utilization – than to cell death (Ahn et al., 2010; Charbonnier et al., 2017; van den Esker et al., 2017a,b; Kim et al., 2019). The lrgAB homolog in B. subtilis, which encodes a hetero-oligomeric membrane complex, was recently shown to function as a pyruvate facilitated transporter and the operon was accordingly renamed pftAB (Charbonnier et al., 2017; van den Esker et al., 2017b). Also in S. mutans, lrgAB was very recently linked to the uptake of extracellular pyruvate in stationary phase (Ahn et al., 2019).
Expression of S. mutans cidAB and lrgAB responds to several two component signal transduction systems and to carbon catabolite repression, and these two operons display opposite patterns of expression during growth and maturation of a culture (Ahn et al., 2010, 2012; Ahn and Rice, 2016; Kim et al., 2019). The link to fluctuating parameters such as carbohydrate concentration and growth phase has made it difficult to identify specific cues that control the timing and extent of cidAB and lrgAB transcription. In addition, the kinetics and population heterogeneity of S. mutans cidAB and lrgAB expression have not been investigated. In this work, we use microfluidic and single-cell approaches to more precisely identify the extracellular cues that trigger lrgAB. We also characterize the temporal profile and cell-to-cell heterogeneity of lrgAB activity.
In S. mutans, the cid operon consists of cidA (342 bp) and cidB (696 bp), which overlap by four nucleotides (Ahn et al., 2010). The lrg operon includes lrgA (468 bp) and lrgB (732 bp) (Ahn et al., 2010). Both cidAB and lrgAB are sensitive to glucose availability, although the two operons behave oppositely. When S. mutans grows in limited glucose (less than 20 mM), lrgAB is not strongly expressed until the onset of stationary phase (Ahn et al., 2010; Kim et al., 2019). Higher initial glucose concentrations, exceeding 20 mM, reduce the stationary phase expression of lrgAB. By contrast, cidAB is robustly expressed during early growth in high glucose concentrations but is much less active later in growth or when initial glucose concentrations are less than about 20 mM (Ahn et al., 2010; Kim et al., 2019). Kim et al. have recently identified a catabolite responsive element (cre-site) region in the promoters of cidAB and lrgAB, indicating that the catabolite repression protein CcpA may enhance or suppress cidAB and lrgAB expression during early and late growth stages, respectively (Kim et al., 2019).
Several studies have found that cidAB and lrgAB respond to molecular oxygen and that deletions in either operon affect the ability of S. mutans to tolerate oxidative stress (Ahn et al., 2007, 2010). The ΔcidAB and ΔlrgAB deletion strains did not grow under aerobic conditions, although their anaerobic growth was reported similar to wild type (Ahn et al., 2010). Similarly, ΔcidAB and ΔlrgAB strains were unusually sensitive to superoxide anion (generated by paraquat) although not to hydroxyl radical (generated by hydrogen peroxide) (Ahn et al., 2010). Microarray experiments indicated that lrgA transcription increased in the presence of molecular oxygen during exponential growth phase (Ahn et al., 2007). A transcriptional profiling study found that lrgAB transcription at an optical density of 0.4 in a culture grown aerobically was 11-fold higher than in a culture grown in an anaerobic chamber (Ahn et al., 2007). Furthermore, lrgA and lrgB were also upregulated in thicker biofilms, perhaps suggesting sensitivity to oxygen conditions or other environmental stresses within the biofilm (Bayles, 2003, 2007, 2014; Shemesh et al., 2008).
The LytST two-component system also plays a role in lrgAB regulation in S. mutans, in which the lytST operon is located 175 nucleotides upstream of lrgAB (Ahn et al., 2010). LytST and its homologs have been closely linked to regulation of lrgAB homologs in many bacteria, including Bacillus and Staphylococcus species as well as S. mutans (Groicher et al., 2000; Kobayashi et al., 2001; Bayles, 2007; Ahn et al., 2010, 2012; van den Esker et al., 2017a). While lrgAB mRNA levels were observed to increase by 103- to 104-fold in late exponential phase of S. mutans under low glucose conditions (Ahn et al., 2010), the deletion of lytST or lytS reduced lrgAB expression throughout the growth curve. Deletion of lytST or lytS either eliminated (Ahn et al., 2010) or sharply suppressed (Ahn et al., 2012) the stationary phase rise in lrgAB mRNA levels (Ahn et al., 2010). This modulation of lrgAB induction by lytS was slightly greater at low oxygen conditions (Ahn et al., 2012), possibly indicating a link between LytST and environmental oxygen in regulation of lrgAB.
These prior findings show that growth-phase sensitive parameters such as glucose and oxygen interact to regulate lrgAB and may contribute to the suppression of lrgAB until the onset of stationary phase. Understanding this regulation in detail requires a greater degree of environmental control than is achieved through conventional, bulk culture methods. We have used microfluidics to maintain precise control of the environmental inputs that are suspected to influence S. mutans lrgAB and to explore the population profile and kinetics of lrgAB expression at the individual cell level. By imaging and quantifying activity of a green fluorescent protein reporter for the lrgAB promoter in individual S. mutans under controlled flow conditions, we were able to identify the environmental inputs that trigger activation of lrgAB.
Methods
Bacterial Strains, Plasmids, and Growth Conditions
Observing the effects of pyruvate and glucose on lrgA in S. mutans was possible through a gfp fusion to the promoter region of lrgAB, which was inserted into the pDL278 shuttle vector (carrying spectinomycin resistance) as described in Kim et al. (2019). The resulting plasmid was inserted into a wild-type UA159 and a ccpA-deficient mutant (Wen and Burne, 2002) to give the UA159/PlrgA-gfp and ΔccpA/PlrgA-gfp strains, respectively (Kim et al., 2019). S. mutans with a vicK deletion is described in (Ahn and Burne, 2007).
The Pldh-gfp reporter strain was constructed by replacing the promoter region of our previous gfp reporter strains (Son et al., 2012, 2015). The Pldh region (about 200bp) was PCR-amplified with primers, incorporated HindIII and SpeI sites, respectively, and was cloned in front of the superfolder green fluorescent protein (sGFP) gene in the shuttle vector pDL278. The resulting construct was transformed into S. mutans wild-type UA159 strain.
The lytST overexpression strain (SAB163) was constructed using the method described in (Ahn and Rice, 2016). Briefly, a fragment containing the ldh promoter region (Pldh) and a polar kanamycin resistance gene (ΩKm-Pldh) was used to replace the lytS promoter region (PlytS): For construction of the ΩKm-Pldh cassette, a ldh promotor region (Pldh) was PCR-amplified from chromosomal DNA of S. mutans UA159 cell using primers Pldh-BamHI-FW and Pldh-SphI-RV and ligated to an ΩKm gene (digested with BamHI from pVT924) using BamHI site. For replacement of PlytS, two 0.5 kb fragments flanking the −35 and −10 regions of the lytS promoter were PCR-amplified using lytS-A and lytS-BamHI-B (left arm) and lytS-SphI-C and lytS-D (right arm) primers and ligated to the ΩKm-Pldh cassette using BamHI and SphI sites designed in each primer set. The final construct was then transformed into S. mutans. Testing via real-time qPCR confirmed about a 28-fold increase in lytS expression compared to the wild type. A vicRK overexpression strain (SAB164) was constructed using this same method. The primers used for overexpression strain construction and qPCR are listed in Table 1.
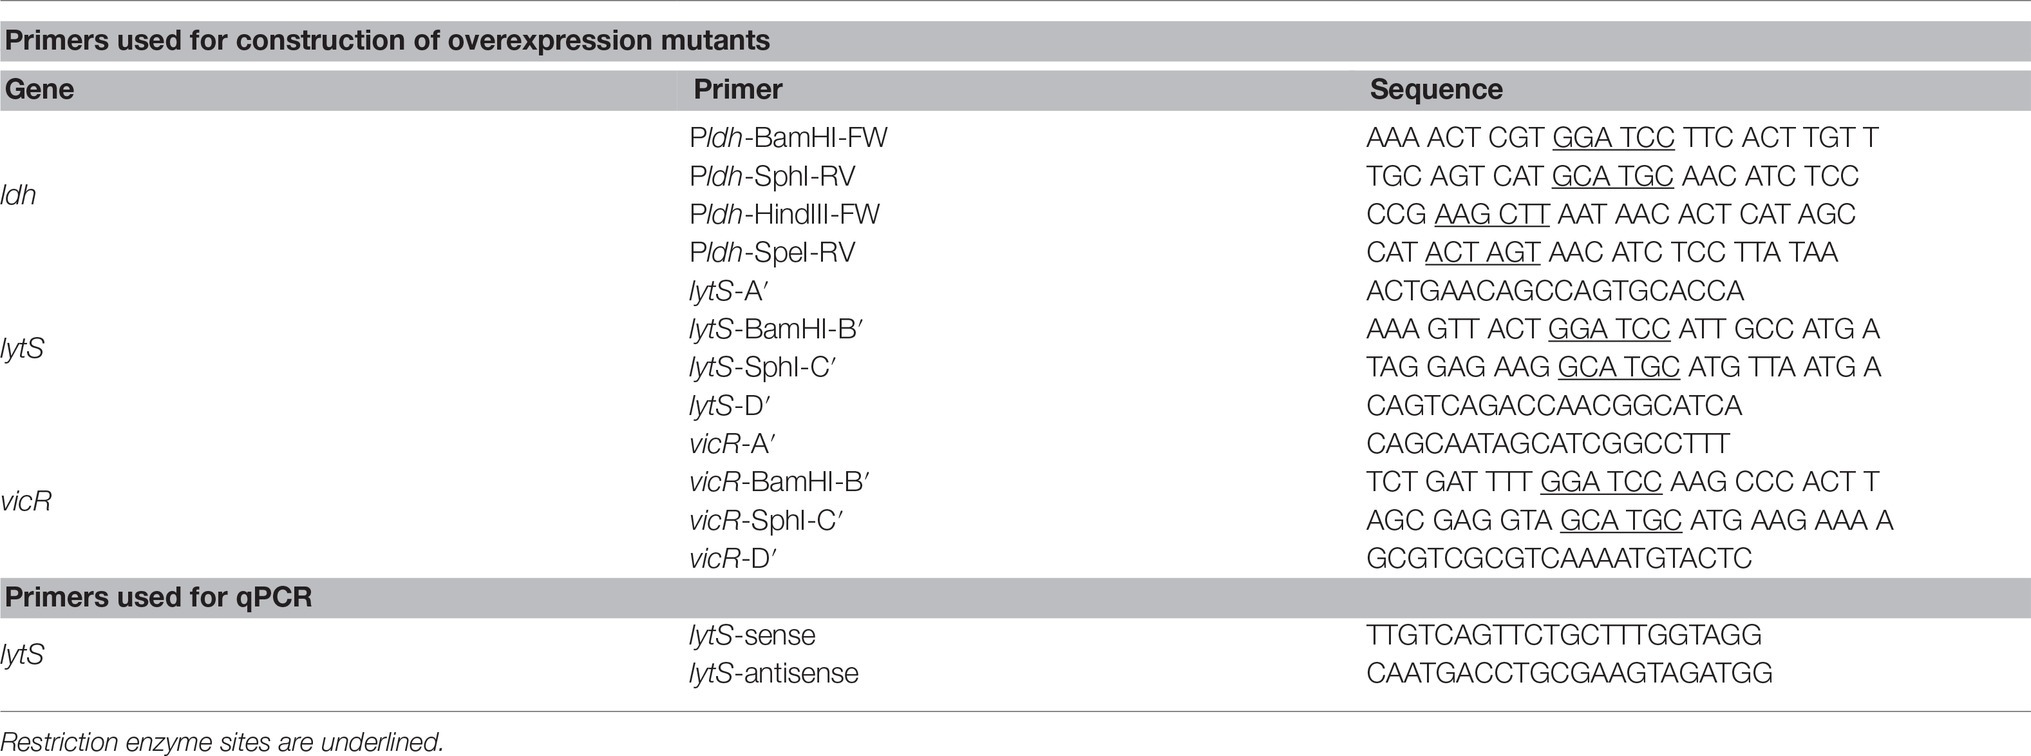
Table 1. Primers used in this study.
For studies of PlrgA activation in a well plate system, overnight cultures of S. mutans UA159 and its derivatives were incubated in complex medium BHI at a temperature of 37°C in an atmosphere composed of 5% CO2. Antibiotics were used at the following concentrations where resistance is indicated in Table 2: erythromycin (10 μg ml−1), spectinomycin (1 mg ml−1), and kanamycin (1 mg ml−1). Overnight cultures were washed twice in phosphate buffered saline (PBS) of pH 7.2. They were then diluted 1:100 into defined medium [FMC (Terleckyj et al., 1975; De Furio et al., 2017)], pH corrected to 7.0 containing final concentrations of glucose and pyruvate dictated by the experiment conducted. Fresh cultures were allowed to grow to early exponential phase with an OD600 of 0.1 before being followed by any further testing. For single-cell studies as well as studies under a flow environment, overnight cultures of S. mutans were grown in BHI supplemented with an additional 20 mM glucose to ensure no activation of lrgA. Overnight cultures were washed twice in PBS and diluted 1:35 in fresh FMC before being allowed to incubate to an OD600 of 0.1.
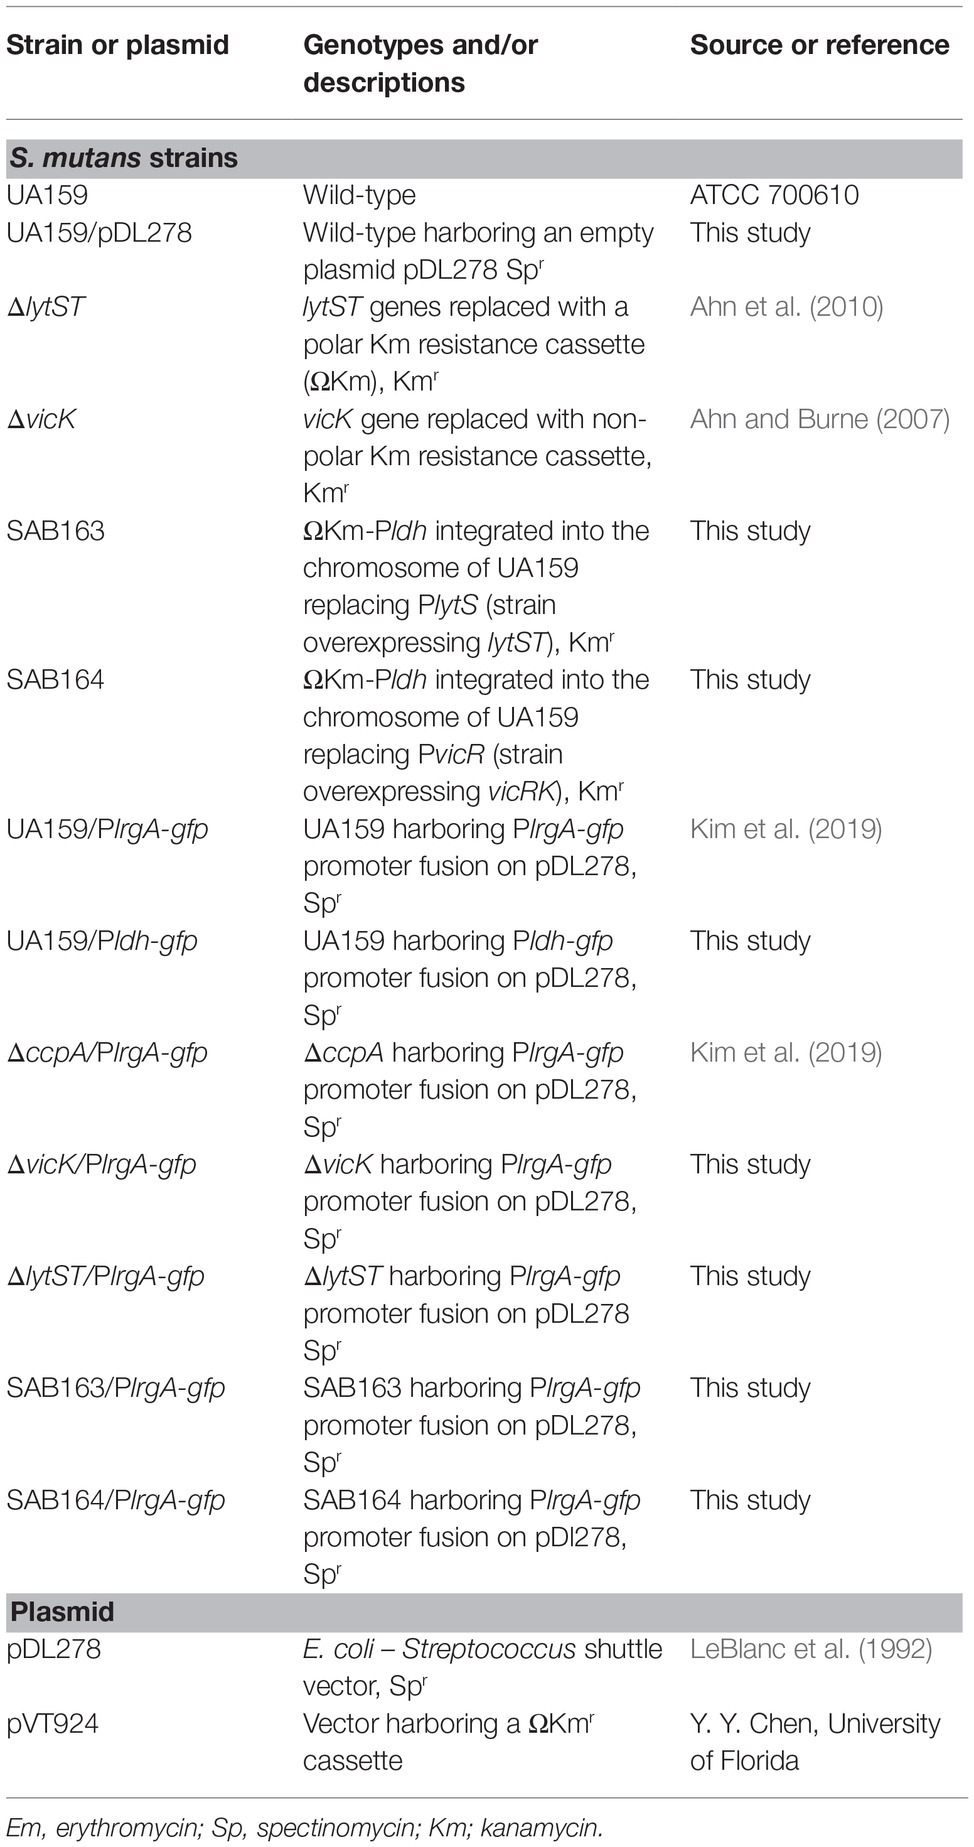
Table 2. Strains and plasmids used.
Measuring Growth and Gene Activation in Bulk
The data in Figures 1–3, 6 were collected with a BioTek Synergy 2 multimode wellplate reader. Overnight samples were first diluted 100-fold into fresh FMC media with the prepared initial carbohydrates necessary for the experiment. Samples were grown to an OD600 of 0.1 in prepared FMC media before being dispersed into 2 ml volumes (Figures 1, 2, 6) or 200 μl (Figure 3) on 24 or 96 well plates, respectively. Samples were overlaid with 410 μl mineral oil to facilitate anaerobic growth on a 24 well plate and 75 μl on a 96 well plate (Englander et al., 1987; Ahn et al., 2007, 2009, 2010; Ahn and Burne, 2007). Aerobic growth was facilitated with no mineral oil overlay and the plate was set to shake for 10 s every 2 min. Cultures grew in the well plates for 24–35 h and growth was monitored by optical density at 620 nm which was measured at 2 or 5 min intervals. Fluorescence was monitored by a green filter at 485–520 nm.
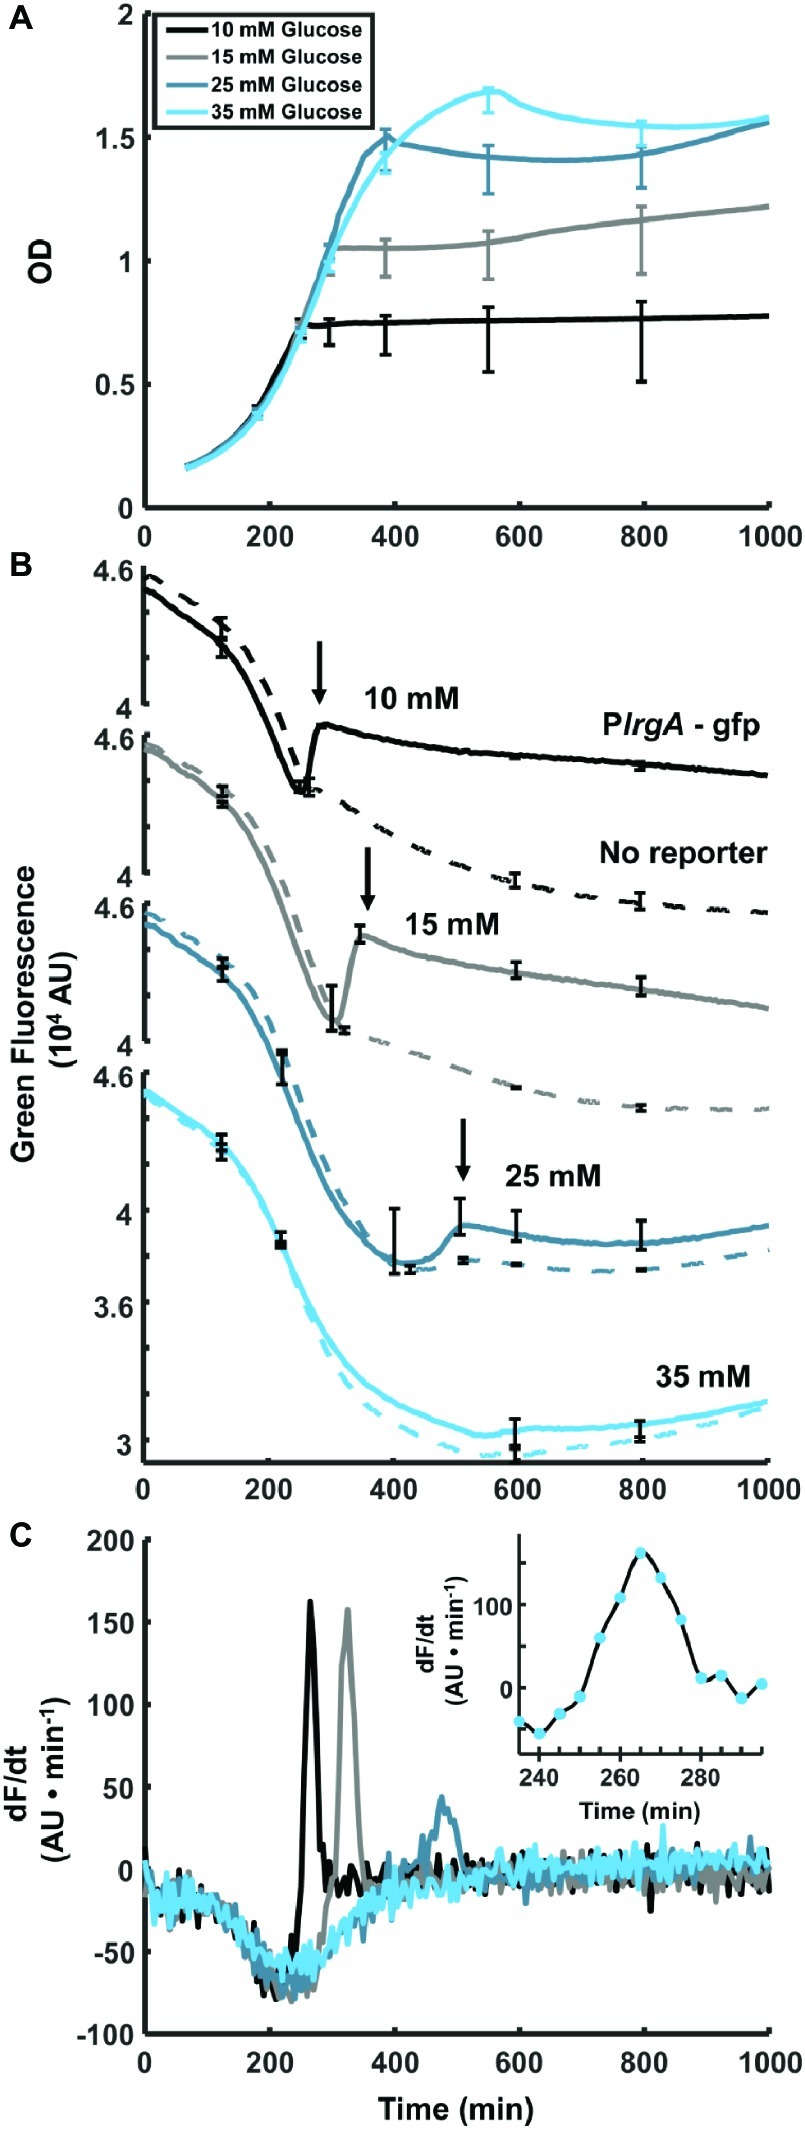
Figure 1. Observation of PlrgA-gfp fluorescence at the onset of stationary phase in S. mutans. (A) Optical density of PlrgA-gfp strain growing in defined medium at different initial glucose concentrations. (B) Green fluorescence of UA159/pDL278 (dashed curve) and PlrgA-gfp (solid curve) cultures is dominated by the steadily declining fluorescence of the medium, until about 250–300 min. Initial glucose concentrations are as indicated. The black arrows in (B) mark the abrupt burst of fluorescence in the PlrgA-gfp strain at the onset of stationary phase. (C) Comparison of the time derivatives of the green fluorescence for PlrgA-gfp shows that the burst of lrgA expression has a duration of 30–50 min. The inset in (C) shows the time derivative of reporter fluorescence in 10 mM glucose. The data shown in each panel represent one of three independent samples that were measured simultaneously. Error bars represent the standard deviation of the three independent samples.
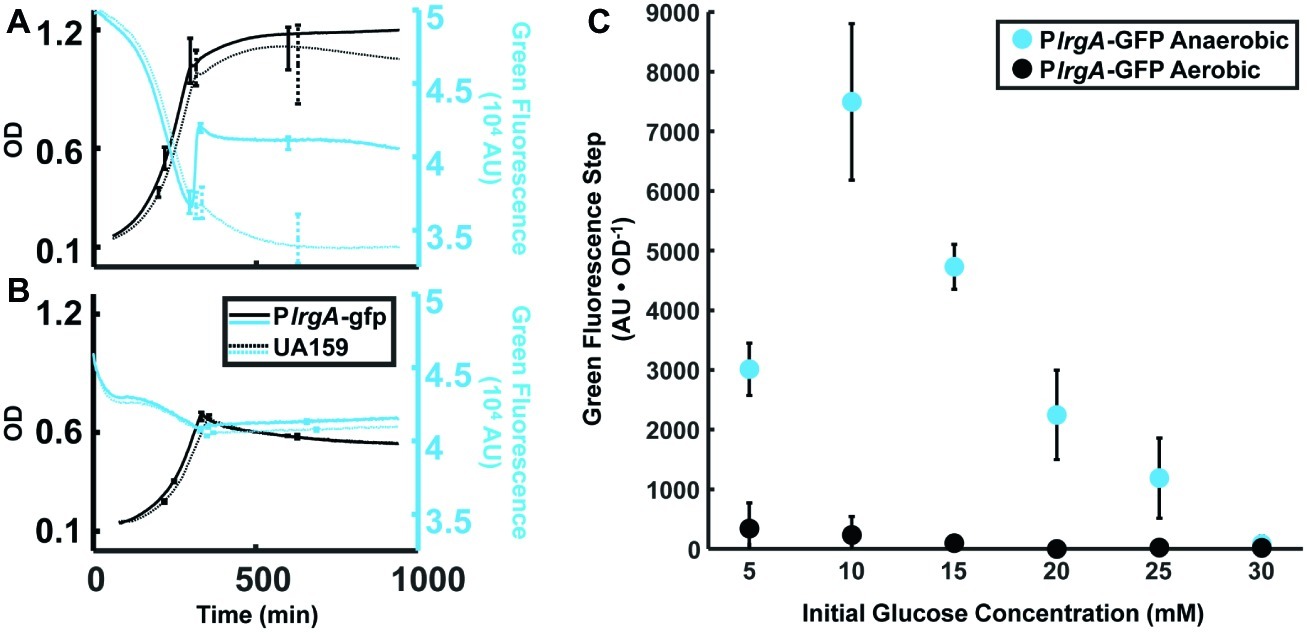
Figure 2. Effect of anaerobic (A) and aerobic (B) growth on the step increase in lrgA activity at stationary phase in static cultures of the PlrgA-gfp strain. OD (black curves) and green fluorescence (blue curves) are shown for the reporter (solid curve) and UA159/pDL278 (dashed curve) strains growing in medium supplemented with 15 mM glucose. Growth and fluorescence curves represent one of three independent samples that were measured simultaneously. Error bars represent the standard deviation of the three independent samples. Growth and fluorescence curves for all glucose concentrations used are included in Supplementary Figure S1. (C) Comparison of the step in lrgA activity for aerobic and anaerobic growth versus initial glucose concentration. The increase in lrgA activity in the reporter strain is measured as the magnitude of the fluorescence step (black arrows in Figure 1B) above background, normalized to the optical density. A small fluorescence step is detected in the aerobic cultures with low initial glucose concentration. Fluorescence steps in (C) represent the mean of three samples that were measured simultaneously. Error bars represent the corresponding standard deviations.
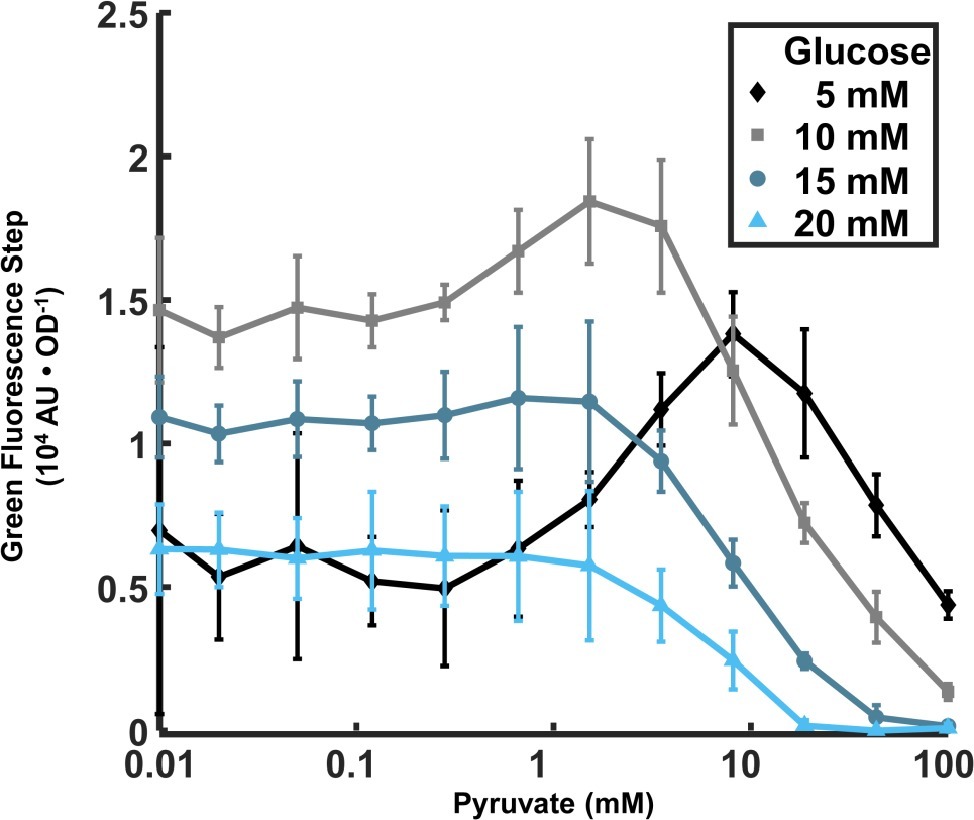
Figure 3. Dependence of lrgA expression step on initial pyruvate and glucose concentrations in cultures grown anaerobically. The increment in PlrgA-gfp reporter fluorescence (relative to baseline) at the onset of stationary phase is shown, normalized to the optical density. The data shown represent the mean of three independent samples. Error bars represent the corresponding standard deviations.
Measuring lrgA Activation From Bulk
The fluorescence increase seen at the onset of stationary phase was calculated by the time derivative (slope) of the fluorescence curve obtained from a well plate reader and the time value at maximum slope. This time value corresponds to the inflection point of the fluorescence increase. An adjacent local minimum and maximum in the fluorescence are then found from the nearby time values at which the time derivative crosses zero. The difference between these maximum and minimum values is the fluorescence step at the onset of stationary phase. We then normalized this fluorescence step, dividing it by the optical density of the culture at its entry into stationary phase.
Slide Experiments
Overnight cultures were diluted 1:35 fold into a 20 ml seed culture with a mineral oil overlay inside an incubator maintaining a 5% CO2 atmosphere at 37°C. About 3 μM propidium iodide (PI) was initially added to stain dead cells that had a weakened membrane integrity with a red fluorescent dye. To take phase and fluorescence images, a 600 μl sample was collected into a cuvette from the seed culture and an OD600 measurement was taken. The same sample was then ultra-sonicated to break up the cell chains and 4 μl deposited on a glass coverslip. Phase contrast and fluorescence images of the slide were taken on a Nikon TE2000U inverted microscope together with a Photometrics Prime camera and a green (or red for PI) filter set. Phase and fluorescence images were taken periodically throughout the full growth cycle of the culture until a stable, stationary phase optical density was reached. GFP concentration of individual cells was assessed from microscopy images using a method described previously (Kwak et al., 2012).
Microfluidic Design
An Ibidi microfluidic slide (μ-slide VI, Ibidi USA) was used to measure activation levels of PlrgA under flow of medium at set rates. The microfluidic slide consisted of six flow channels that had dimensions of 0.1 mm × 1 mm × 17 mm for a total volume of 1.7 μl. Each of these rectangular channels allowed viewing through a microscope. Each channel had an inlet and an outlet that fit a standard Luer fitting which allowed the desired media to be pumped through the flow channels. The slide was secured to the stage of a Nikon TE2000U inverted microscope that is housed inside a temperature controlled Lexan chamber. While data were collected, the chamber was maintained at a constant 37°C by an electronic temperature controller (Son et al., 2015; De Furio et al., 2017; Underhill et al., 2018).
Microfluidic Experiments
We cultured S. mutans PlrgA-gfp cells in defined (FMC) medium containing initially 10 mM glucose and grew them to 0.3–0.4 OD. We then sonicated the cells to break apart chains and loaded the cells into microfluidic flow channels. Cells were allowed to settle onto the lower window of the channel for 20 min, while the channel was mounted onto an inverted microscope in a temperature-controlled chamber. A flow of fresh medium was then supplied into the channels by a syringe pump at a rate of 1,000 μl/h for 30 min to replace and refresh the medium in the channels, connections, and fittings. After the 30 min purge, the pump rate was reduced to 20 μl/h and held constant for the duration of the experiment.
To ensure that the growth media for the microfluidic studies was sufficiently deoxygenated, we added an enzymatic oxygen scavenging system consisting of 2 U/ml glucose oxidase and 120 U/ml catalase (Englander et al., 1987). This system rapidly consumes O2 from the medium by breaking down glucose to yield gluconic acid and H2O as products. Although the glucose oxidase generates H2O2 as an intermediate product (which is then broken down by the catalase), S. mutans is tolerant of concentrations of H2O2 far higher than would be present during this reaction (De Furio et al., 2017). Formation of the mature GFP fluorophore does require molecular oxygen, and therefore, no GFP fluorescence is expected in the strict absence of oxygen (Cubitt et al., 1995). Oxygen concentrations in the range of about 5 μM, but not lower, appear sufficient for observation of fluorescence in improved GFP variants (Hansen et al., 2001; Iizuka et al., 2011). Our microfluidic system is not perfectly sealed and is somewhat permeable to atmospheric oxygen, and therefore, the glucose oxidase and catalase mixture is expected to reduce the steady state oxygen concentration to the range of 10–20 μM (Aitken et al., 2008; Baumann et al., 2008). Therefore, although the enzyme system drastically reduces molecular oxygen levels, it should allow sufficient oxygen to generate a GFP fluorescence signal (Vordermark et al., 2001; Wessel et al., 2014; Boudreau et al., 2016; Liu et al., 2017). In practice, we had no difficulty observing reporter-driven or constitutive production of GFP fluorescence in the deoxygenated growth media.
Results
A Burst of lrgA Activity Coincides With the Onset of Stationary Phase
To test our PlrgA-gfp fluorescent reporter strain and characterize lrgA expression in static cultures, we monitored the optical density and fluorescence of the reporter strain growing in well plates containing defined medium that was prepared with different initial concentrations of glucose. Figure 1A shows growth curves for the PlrgA-gfp reporting strain growing anaerobically under a layer of mineral oil (Englander et al., 1987; Ahn et al., 2007, 2009, 2010; Ahn and Burne, 2007). Figure 1B shows the green fluorescence (485 nm excitation, 528 nm emission) of PlrgA-gfp, relative to the UA159 (no reporter) background. For both strains, the growth medium contributes a large background fluorescence that declines steadily as the culture grows. In PlrgA-gfp, however, the green fluorescence increases abruptly as the culture enters stationary phase (arrows in Figure 1B), signaling a strong burst of lrgA expression. This rapid rise in green fluorescence is transient, as the green fluorescence gradually declines over longer time periods extending into stationary phase. The brief duration of the burst of lrgA expression is apparent from the time derivative of the fluorescence signal. Figure 1C shows that the fluorescent reporter for lrgAB is activated for no more than 30–50 min at the onset of stationary phase.
Figure 1B also shows that the initial glucose concentration of the medium influences the overall amount of lrgA expression that occurs during the burst. The size of the fluorescence rise in Figure 1B increases as the initial glucose is raised from 10 to 15 mM but declines as the initial glucose is further raised to 25 mM. At 35 mM initial glucose, the burst is not detected. These data are consistent with transcriptional data showing that lrgAB is upregulated 103- to 104-fold in late exponential phase, relative to early or mid-exponential phase (Ahn et al., 2010) and that very high initial glucose concentrations suppress this upregulation (Ahn et al., 2010; Kim et al., 2019).
The Burst of lrgA Expression Is Observed Only Under Anaerobic Conditions
Prior studies have found interplay between lrgAB expression and molecular oxygen or oxidative stresses (Ahn and Burne, 2007; Deng et al., 2007; Ahn et al., 2010, 2012; Senadheera et al., 2012; Ahn and Rice, 2016). To more carefully assess the relationship between aerobic or anaerobic conditions and glucose availability on lrgAB, we measured the size of the stationary phase burst of reporter fluorescence in well plates that were growing anaerobically (with a mineral oil layer) or aerobically (open to air, with shaking), with different glucose concentrations. Figure 2 shows that, under anaerobic conditions, increasing the initial glucose to about 10 mM increases the amplitude of the lrgA expression burst. However, this amplitude falls monotonically if initial glucose is further increased. In PlrgA-gfp cultures grown aerobically, we observed a small burst of lrgA expression at initial glucose concentrations of 15 mM or less. No burst of lrgA expression was observed for initial glucose concentrations above 15 mM. Therefore, the burst of lrgA expression that occurs in a static culture requires anaerobic conditions as well as a moderately low initial glucose concentration. However, lower glucose concentration does not ensure higher lrgA expression; Figure 2C shows that the amplitude of the fluorescence burst declines at initial glucose concentrations lower than about 10 mM.
Activation of lrgAB Requires the VicRK Two-Component System
The VicRK two-component system has previously been shown to alter lrgAB expression and linked to oxidative stress tolerance in S. mutans (Ahn and Burne, 2007; Deng et al., 2007; Senadheera et al., 2007; Ahn and Rice, 2016). To test whether the VicRK two-component system participates in regulation of lrgAB, we measured the activation of the PlrgA-gfp reporter in a strain (ΔvicK) carrying a deletion of vicK, which encodes the histidine kinase VicK, and in a vicRK overexpression strain (SAB164). Supplementary Figure S2 shows the growth and green fluorescence curves of these strains growing anaerobically and aerobically in 10 mM initial glucose. Under anaerobic conditions, PlrgA activity in the vicK deletion and overexpression strains is very similar to that observed in the wild type. Under aerobic condition, SAB164 showed a lack of PlrgA activity, like the wild type background. Unlike the wild type, however, the ΔvicK strain showed a modest but distinct burst of PlrgA activity at stationary phase in the aerobic medium. These data suggest that vicK has a repressing effect on lrgA under aerobic conditions.
Extracellular Pyruvate Affects Stationary Phase Expression of lrgA
Recent findings that the LytST family of two component systems, which modulate the expression of lrgA homologs, can bind and sense external pyruvate (van den Esker et al., 2017a,b; Vilhena et al., 2018), and the observation that the pyruvate dehydrogenase complex in S. mutans is upregulated in late exponential phase (Kim et al., 2019), suggest that late growth expression of lrgAB in S. mutans may be connected to the presence of external pyruvate. We monitored the PlrgA-gfp reporter strain growing anaerobically in defined medium to which different concentrations of initial glucose and pyruvate were added. Figure 3 shows that very low concentrations of pyruvate (0–0.1 mM) had little effect on the magnitude of the step increase in GFP fluorescence at the onset of stationary phase, regardless of glucose concentration. However, further increases in pyruvate to 1.5–8 mM generally enhanced the stationary phase response of lrgAB, especially for cells growing at low glucose, 10 mM or less. Higher levels of pyruvate sharply reduced the activation of lrgA, until the fluorescence burst became undetectable at 100 mM pyruvate. These data show that initial glucose and pyruvate concentrations constitute a pair of external inputs that can modulate and maximize the stationary phase burst in lrgA, although both are inhibitory at higher concentrations.
Expression of lrgA in Bulk Cultures at Stationary Phase Is Heterogeneous
The very rapid burst of PlrgA-gfp fluorescence in Figure 1C shows that the timing of lrgAB activation is highly uniform in a population of cells. To test whether the degree of activation is equally homogeneous, we measured the fluorescence of individual PlrgA-gfp cells extracted from a static, bulk culture at different times during growth. We grew cultures anaerobically in defined medium prepared with 10 mM (initial) glucose, withdrew cells periodically, dispersed them on a glass slide, and imaged them in phase contrast and GFP fluorescence on an inverted microscope. Figure 4A shows that cells showed very little fluorescence through exponential phase, up through about 6 h. At 7 h, as the cells entered stationary phase, pronounced lrgA reporter fluorescence was observed (Figure 4B).
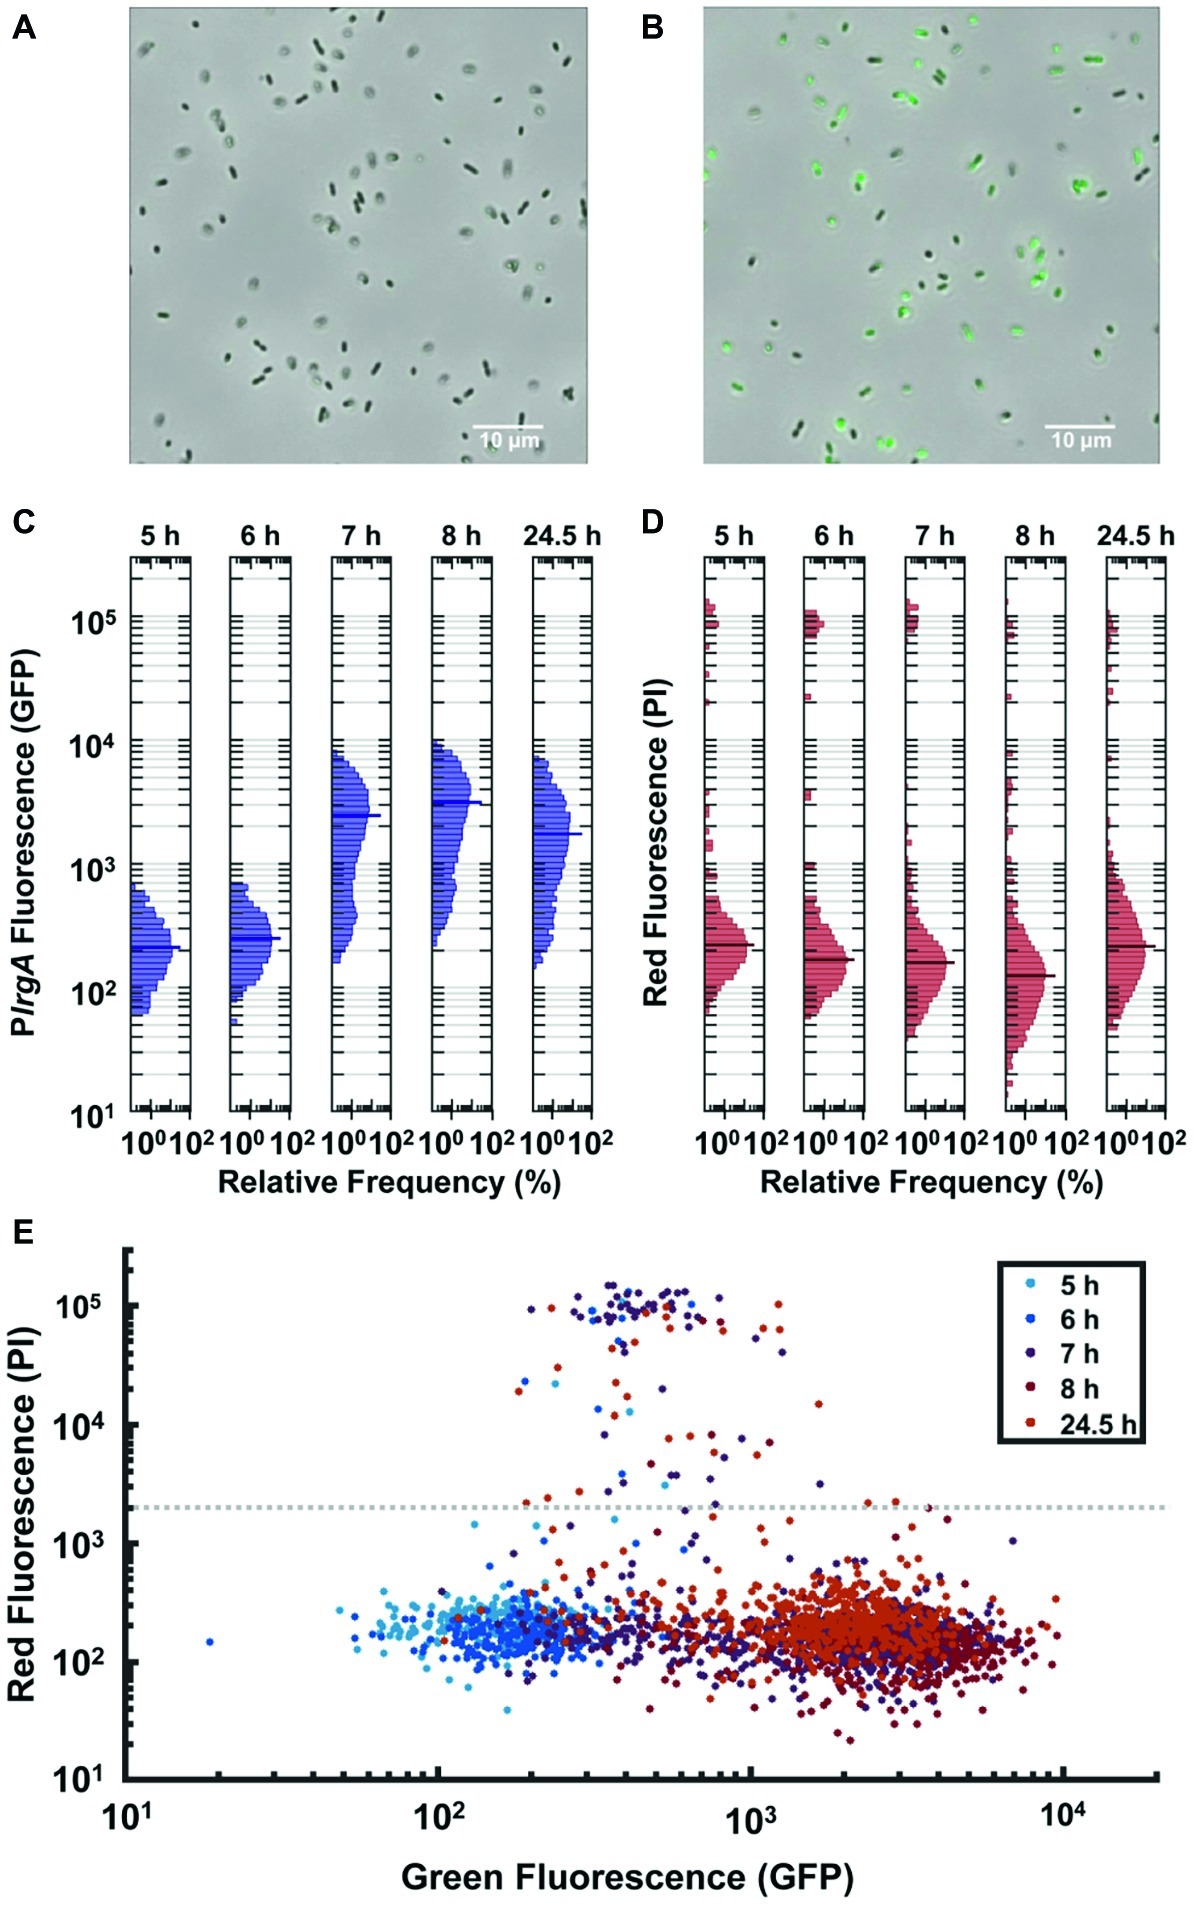
Figure 4. Observation of PlrgA-gfp reporter activity in individual cells extracted from bulk, anaerobic cultures grown in 10 mM initial glucose. Microscopy images of the reporter strain in phase-contrast (gray scale) are overlaid with GFP fluorescence (green) images at (A) 6 h and (B) 7 h of growth. (C) Histograms of individual cell GFP fluorescence measured at different times during growth. Fluorescence per cell is measured as described in (Kwak et al., 2012). (D) Histograms of propidium iodide (PI) fluorescence of the same individual cells as in (C). The length of each horizontal bar indicates the percentage of cells that fluoresced at the indicated level. The heavy horizontal line in each histogram indicates the median fluorescence of the population. (E) Scatter plot comparing GFP and propidium iodide fluorescence of individual cells at different times during growth. Gray dashed line indicates a threshold for distinguishing PI-stained from non-PI-stained cells. Five individual images were collected and analyzed for each condition shown.
The GFP fluorescence after activation was highly variable from cell to cell, as shown by the histograms of individual cell GFP fluorescence in Figure 4C. While the histograms remain generally similar through exponential phase (roughly 5–6 h following inoculation), the heterogeneity in lrgA activation at 7 h is substantially greater. The median cell fluorescence at 7 h is roughly 10-fold greater than at 6 h, while the brightest cells at 7 h are roughly 11-fold brighter than the brightest cells at 6 h. The 7 h distribution has a slightly double-peaked (bimodal) character, suggesting that a subpopulation of cells have activated PlrgA, while other cells have not. The distribution shifts only slightly by 8 h or even 24 h, indicating that GFP concentrations in the population change little during stationary phase. This finding is consistent with Figures 1B,C, where the burst of lrgA expression lasts less than 1 h. Although the tight temporal synchrony of lrgA expression suggests that a single external cue triggers lrgA throughout the culture, the population variability in the resulting level of lrg expression indicates that not all cells in the static culture were immediately induced or that the lrgAB operon is not so tightly regulated as to enforce a consistent response among cells once induced.
To test whether the heterogenous reporter activity was due to the presence of dead cells, we monitored propidium iodide (PI) fluorescence of individual cells carrying the PlrgA-gfp reporter. Figure 4D shows the histograms of the red fluorescence of cells whose green fluorescence is shown in Figure 4C: The scatter plot of Figure 4E compares the green and red fluorescence of the same cells at different times during growth. Although the green fluorescence of the population generally trends upward as the culture reaches stationary phase, relatively few cells take up the PI stain. Of all cells measured, only 3.9% show red fluorescence above the threshold that is defined by the gray dashed line in Figure 4E. Because the PI staining shows little indication of compromised cells, the heterogenous response of lrgA in Figure 4C likely indicates that as a bulk culture enters stationary phase many intact cells simply fail to activate lrgA.
Activation of lrgA in Controlled Flow Requires Pyruvate and Deoxygenation
High initial glucose concentrations suppress the activation of lrgAB at the onset of stationary phase. This finding suggests that the lrgAB expression burst may be triggered by the exhaustion of glucose from the growth medium and the alleviation of catabolite repression of lrgAB. However, Figures 2, 3 also show a role for molecular oxygen, possibly in combination with extracellular pyruvate. A difficulty with using bulk, static cultures to study these inputs is that they are altered by the growth and maturation of the culture and are poorly defined once a static culture has grown to stationary phase. To identify more precisely the factors that trigger lrgAB, we used microfluidic flow devices to apply a stable flow of fresh, defined medium to cells that were under continuous observation. We loaded PlrgA-gfp cells into microfluidic flow chambers (section “Methods”) on a microscope stage and supplied a continuous flow of fresh, defined medium through each channel. The flow rate of 20 μl/h ensured that the 1.7 μl volume of medium within each channel was replaced every 5.1 min. This flow prevented the cells adhered in the channels from modifying their chemical environment.
Figure 5A shows the response of cells that were provided an air-equilibrated (aerobic) defined medium containing 5 mM glucose and 10 mM pyruvate. Expression of lrgAB remained at basal levels, similar to the fluorescence of the UA159 (no reporter) strain (Supplementary Figure S3A). (A modest decline in the average fluorescence at 180 and 210 min is an artifact of rampant growth affecting the image analysis algorithm). Similar flow experiments using medium that was either fully aerated or partially deoxygenated by stirring in vacuum or under N2 produced GFP histograms very similar to Figure 5A (data not shown): No activation of lrgA was observed in flow experiments at any combination of glucose and/or pyruvate concentrations when the supplied media were aerobic or partially deoxygenated.
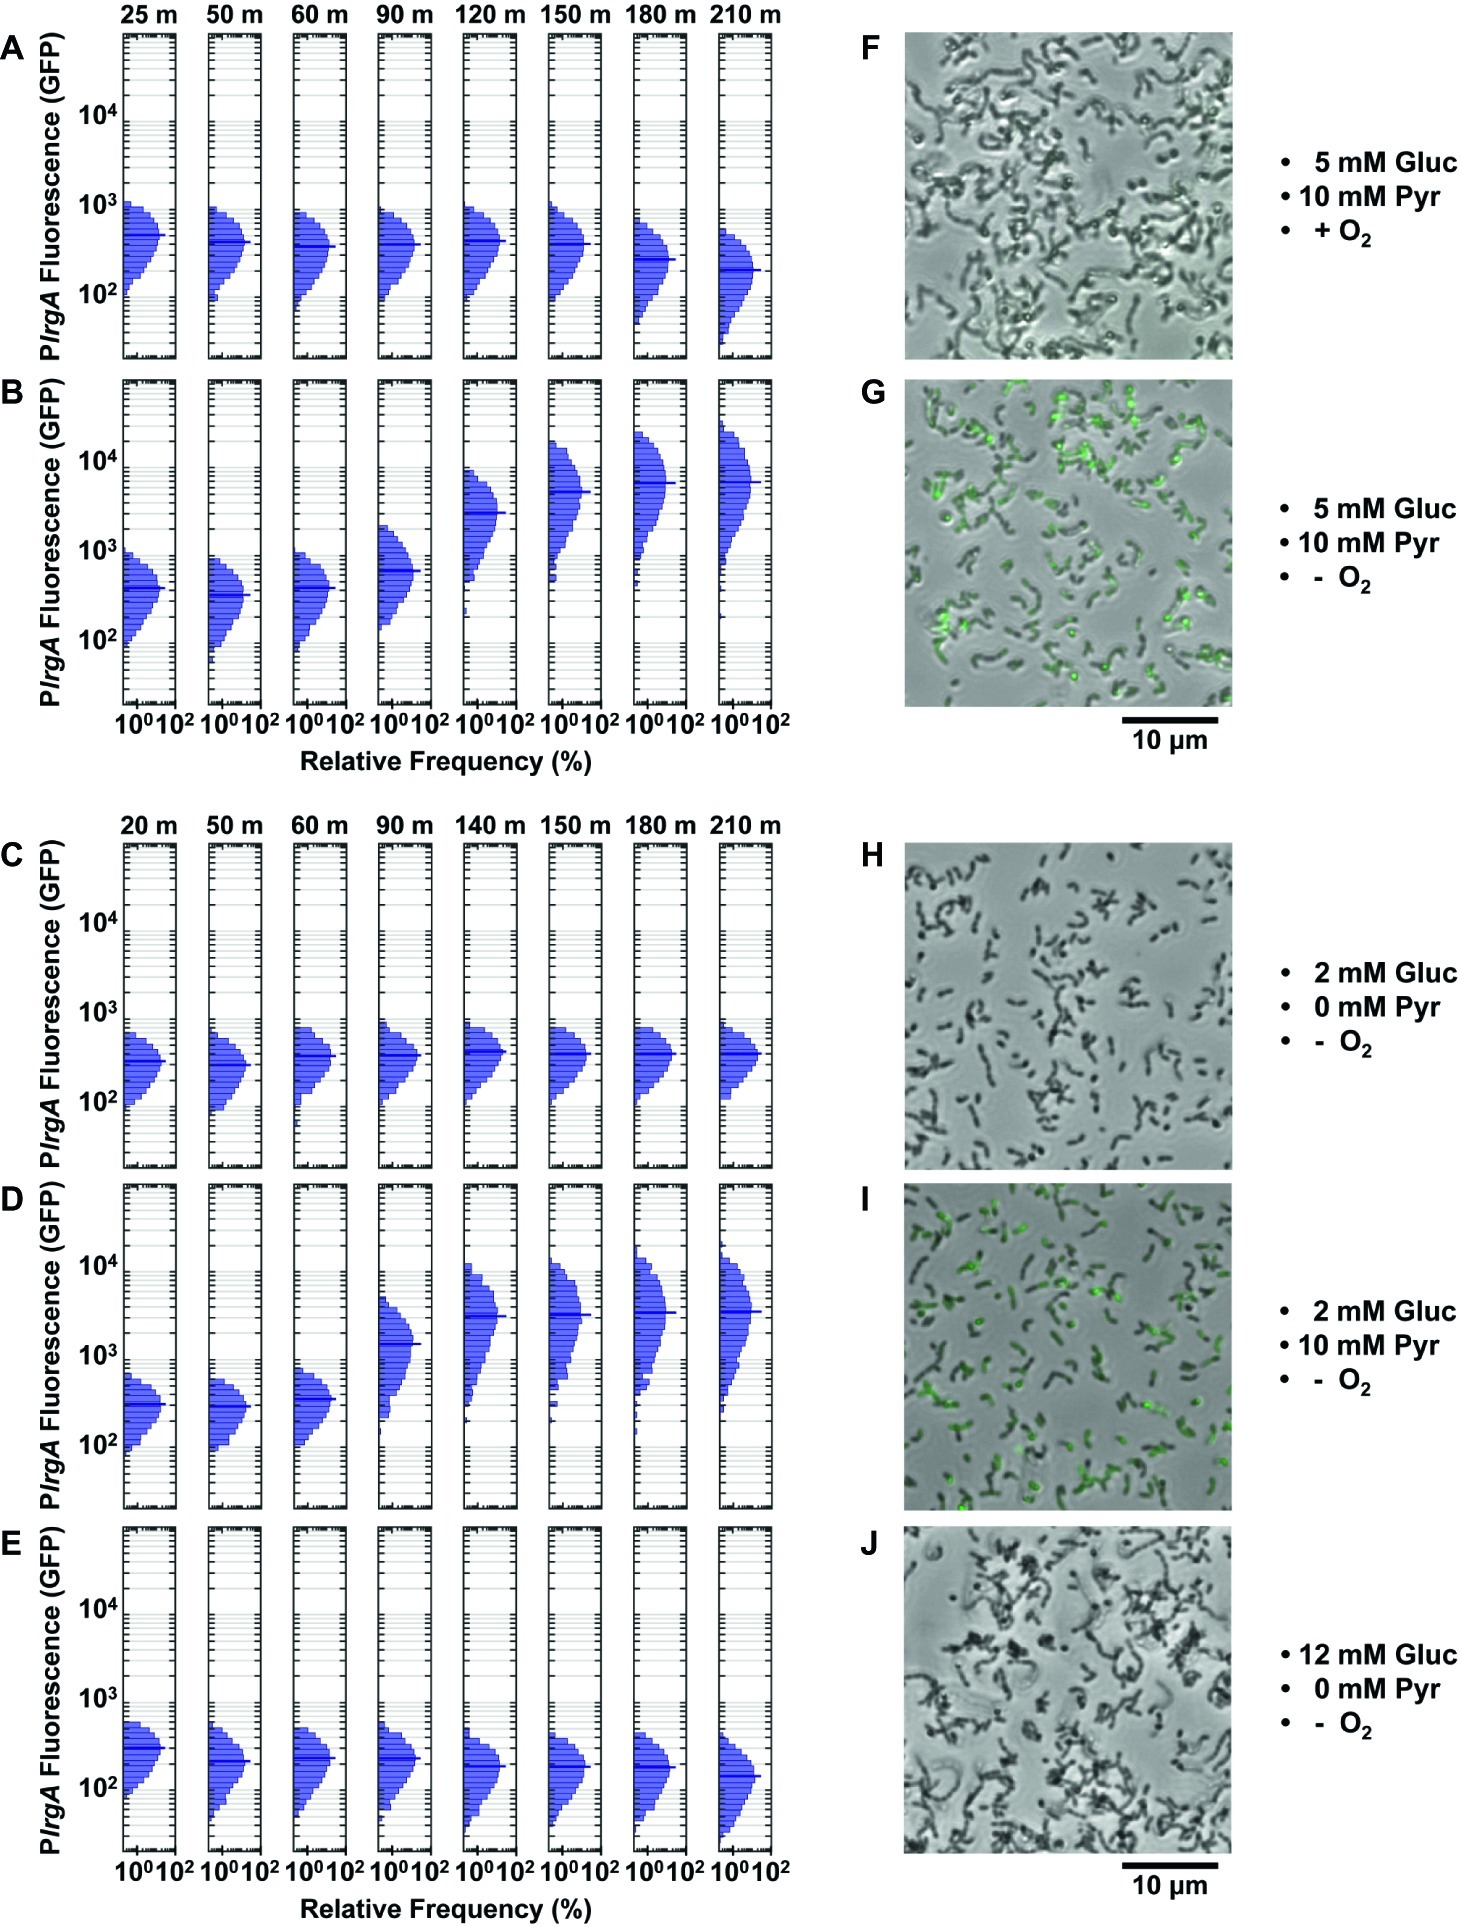
Figure 5. Effect of O2, glucose, and pyruvate on a PlrgA-gfp reporter in microfluidic flow. The histograms show the green fluorescence of individual cells adhered within microfluidic channels and subject to a steady flow of fresh, defined medium: (A) aerobic medium containing 5 mM glucose/10 mM pyruvate; (B) anoxic medium containing 5 mM glucose/10 mM pyruvate; (C) anoxic medium containing 2 mM glucose (no added pyruvate); (D) anoxic medium containing 2 mM glucose/10 mM pyruvate; (E) anoxic medium containing 12 mM glucose (no added pyruvate); (F–J) Phase microscopy images (collected at 150 min) of the reporter strain are shown in gray scale, overlaid with GFP fluorescence (green) images. Five individual images were collected and analyzed for each condition shown.
We therefore tested whether more rigorous deoxygenation was needed to mimic the conditions of a static, anaerobic (mineral oil layer) well plate and induce a response from lrgAB. Figures 5B,D show the results when the growth medium was made more stringently anoxic by the addition of an enzymatic system that scavenges molecular oxygen (“Methods” section). These anoxic media induced robust expression of lrgAB. Strong GFP production was observed after 90–120 min of flow of anoxic medium that contained 5 mM glucose and 10 mM pyruvate (Figure 5B) or 2 mM glucose/10 mM pyruvate (Figure 5D). The first 50 min of the 90–120 min delay is attributable to replacement of partially deoxygenated medium that was initially present in the flow connections.
By contrast a strain carrying gfp under control of a constitutive promoter (Pldh) was strongly activated under both aerobic and anaerobic conditions, as shown in Supplementary Figures S3B,C.
Our data therefore demonstrate that rigorous deoxygenation is a condition for the lrgAB reporter to activate in a continuous flow experiment. We then tested whether pyruvate was also required. Deoxygenated medium containing 2 (Figure 5C) or 12 mM (Figure 5E) glucose, without added pyruvate, did not activate lrgA.
In summary, strong upregulation of lrgA was only achieved under continuous flow conditions when the supplied medium was rigorously deoxygenated and contained added pyruvate. Once these conditions were present, the concentration of glucose (over the range 2–5 mM) had only modest additional effect on lrgAB activity. Microscopy images in Figures 5G,I show cells with an activated lrgAB reporter (green) after 150 min in supplied medium, distinctly brighter than cells growing in aerobic or non-pyruvate media (Figures 5F,H,J).
The activation of lrgAB in the flow conditions of Figures 5B,D was also more narrowly distributed than in the static medium study of Figure 4C. The 210 min histograms in Figures 5B,D lack the broad, heterogeneous lrgAB expression that is seen in the activated (7 h) cells in Figure 4C and suggest that the more homogeneous chemical environment of the flow conditions leads to a more uniform lrgAB response of the population.
Deletion of ccpA Does Not Eliminate Burst Expression of lrgA
The above data strongly suggest that molecular oxygen and glucose both inhibit lrgA activation until the conclusion of exponential growth. Because a cre-site for the catabolite repressor protein CcpA was recently identified (Kim et al., 2019) in the lrgA promoter region, we investigated a possible role for CcpA in suppressing lrgAB activity. We compared expression of a PlrgA-gfp reporter in the wild type background and in a ΔccpA strain, both growing anaerobically, for a range of glucose concentrations. Figures 6A,B show a similar abrupt onset of lrgAB expression at the beginning of stationary phase in the ccpA deletion. In Figure 6C the amplitude of the expression step is larger in the ccpA deletion than in UA159 background, where the relative effect is larger at low initial glucose levels. Therefore, although catabolite repression may partially inhibit the magnitude of the expression burst, it evidently does not control the timing of the burst.
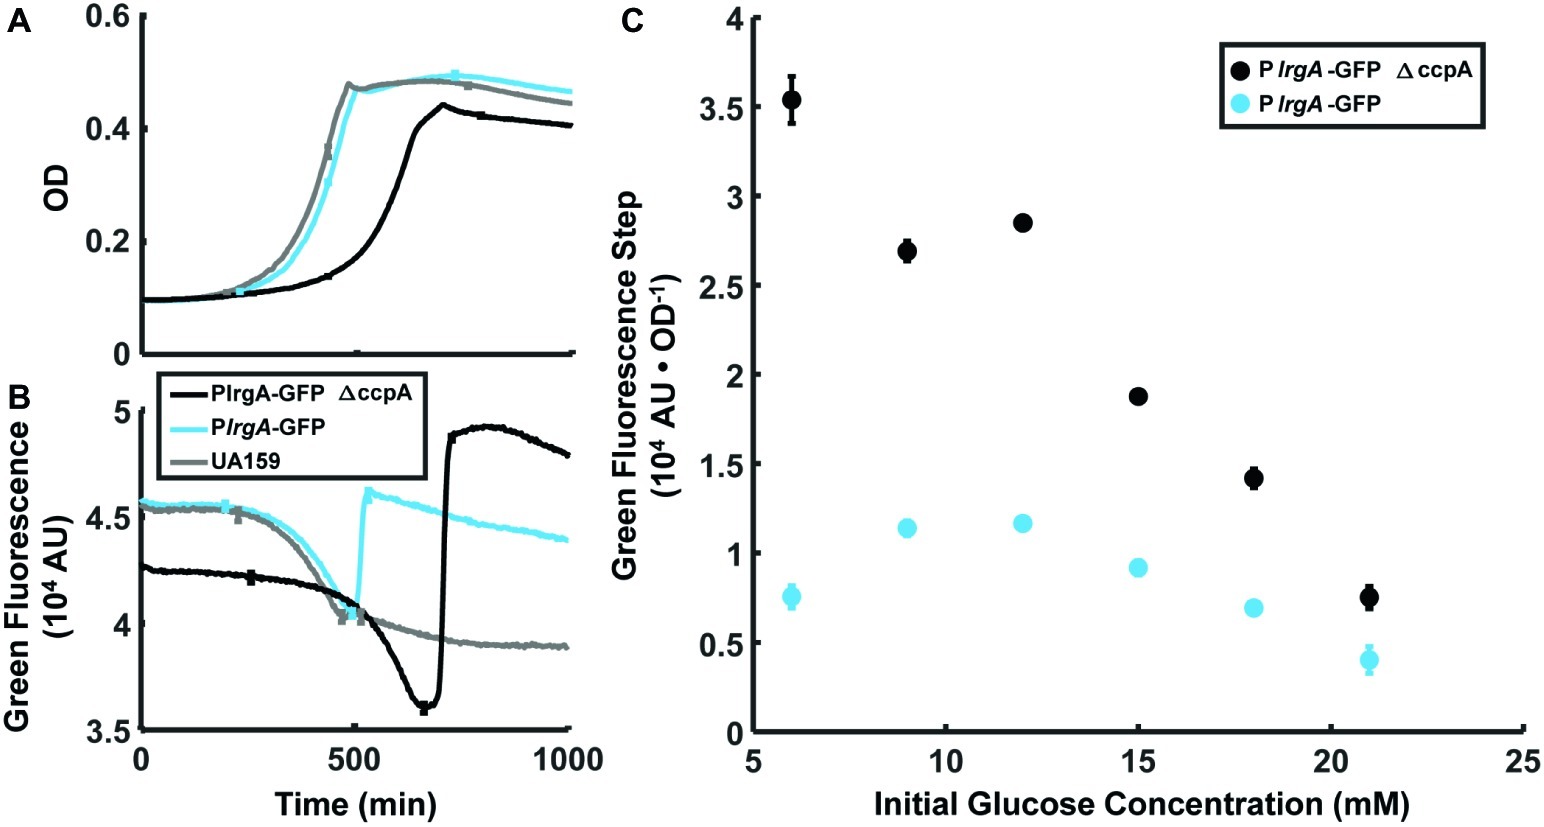
Figure 6. Effect of ccpA on the lrgA expression burst at stationary phase in static grown cultures. Growth (A) and PlrgA-gfp reporter fluorescence (B) of UA159 background (blue) and ΔccpA (black) growing anaerobically in 12 mM initial glucose. Growth and fluorescence curves represent one of three independent samples that were measured simultaneously. Error bars represent the standard deviation of the three independent samples. (C) Size of the fluorescence activation step at stationary phase, normalized to optical density. Fluorescence steps represent the mean of three samples that were measured simultaneously. Error bars represent the corresponding standard deviations.
Overexpression of lytST Permits lrgA Expression in Aerobic Media
The LytST two-component system is implicated in the regulation of lrgAB homologs, as for example, in B. subtilis where lytST was linked to pyruvate sensing and shown to be required for expression of the lrgA homolog (van den Esker et al., 2017a). Prior studies of S. mutans in static, bulk cultures showed that deletion of lytS (Ahn et al., 2012) or lytST (Ahn et al., 2010) abolished the stationary phase expression of lrgAB. Supplementary Figure S4 shows growth and fluorescence curves of strains lacking (ΔlytST) or overexpressing (SAB163) lytST, growing in 10 mM glucose. The lytST mutant showed no activation of lrgA at any point in growth. The lytST overexpressing strain showed slightly elevated fluorescence prior to stationary phase and a large burst with increasing fluorescence when transitioning to, and remaining in, stationary phase. Therefore, we did not attempt to study lrgAB of individual cells carrying a lytST deletion. However, we did examine the effect of lytST overexpression under microfluidic flow.
We loaded a lytST overexpression strain harboring the PlrgA-gfp reporter into microfluidic channels as above. Figure 7A shows the response of cells that were provided aerobic (air-equilibrated) defined medium containing 2 mM glucose and 10 mM pyruvate. Expression of lrgA remained constant throughout the experiment but with a median fluorescence nearly 1.7- to 3.4-fold greater than wild type cells in a similar but deoxygenated medium (in Figures 5B,D). Therefore, the overexpression of lytST bypasses the lrgA requirement for deoxygenation.
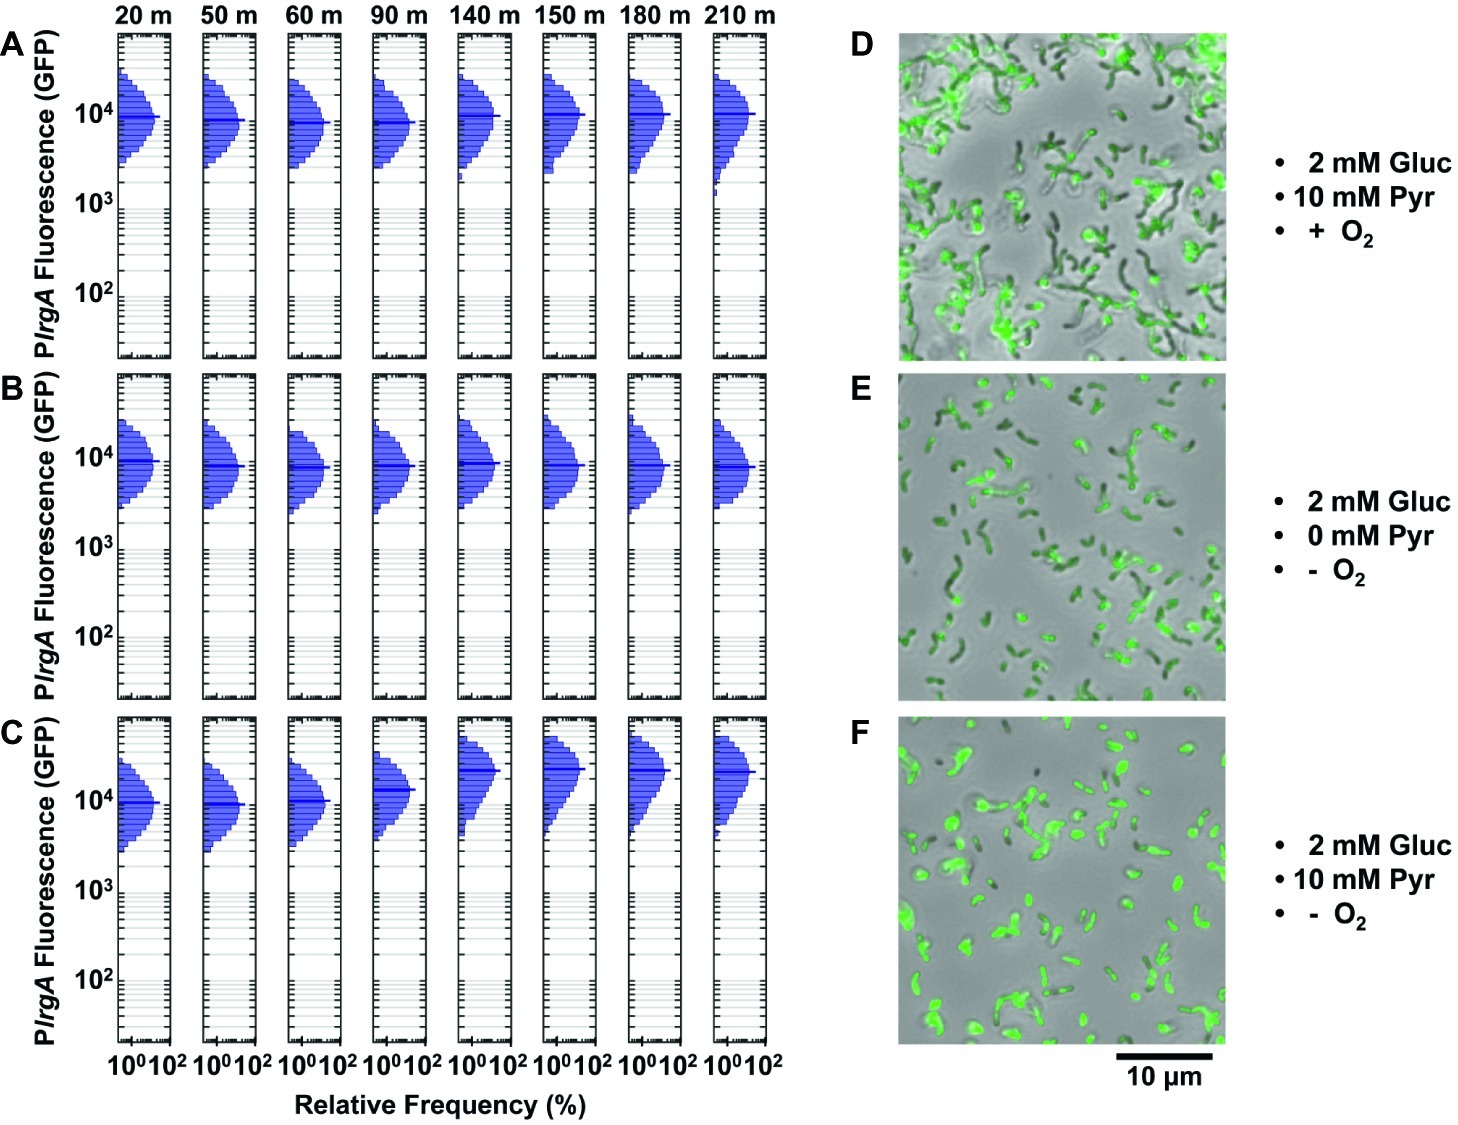
Figure 7. Effect of lytST on activation of a PlrgA-gfp reporter in flowing medium of fixed composition. The histograms show the green fluorescence of individual cells adhered within a microfluidic channel and subject to a steady flow of fresh, defined medium. Conditions are (A) aerobic medium containing 2 mM glucose/10 mM pyruvate; (B) anoxic medium containing 2 mM glucose (no added pyruvate); (C) anoxic medium containing 2 mM glucose/10 mM pyruvate. In (D–F), microscopy images of the lytST-overexpressing strain with PlrgA-gfp (SAB163/PlrgA-gfp) in phase-contrast (gray scale) are overlaid with GFP fluorescence (green) images collected at 150 min. Five individual images were collected and analyzed for each experimental condition shown.
We tested whether pyruvate was needed to activate the lrgA reporter in the lytST overexpressing strain. Figure 7B shows that lrgA activated in anoxic medium containing 2 mM glucose lacking added pyruvate. Robust expression of lrgA was nearly identical to Figure 7A. We also tested activation of lrgA in anoxic medium with 2 mM glucose and 10 mM added pyruvate (Figure 7C), which were necessary to activate lrgA in the UA159 background. After 90–140 min of flow, expression of lrgA increased to about 2-fold greater than in Figures 7A,B. Figures 7D–F show cells with activated lrgA reporters (green). These data show that although lytST overexpression alleviates the requirement for anoxic conditions in activating lrgA, it does not entirely eliminate sensitivity to external pyruvate.
Finally, the population distribution of individual cell fluorescence in the lytST overexpression strain was observed to be slightly narrower than in the UA159 background, Figures 5B,D.
Discussion
The cidAB and lrgAB operons were first identified as a putative holin-antiholin system in Staphylococcus aureus, with gene products that control extracellular murein hydrolase activity (Brunskill and Bayles, 1996; Groicher et al., 2000; Rice et al., 2003; Rice and Bayles, 2003). The S. aureus lrgAB operon is activated differentially through the growth curve, with the largest number of RNA transcripts detected during the transition from exponential to stationary phase (Brunskill and Bayles, 1996; Groicher et al., 2000). Studies of S. mutans lrgAB have found generally similar patterns of expression (Ahn et al., 2010; Kim et al., 2019), although these transcriptional studies have not yielded a precise determination of the environmental cues that control the operon. By combining a fluorescent gene reporter for lrgA with single-cell observations and microfluidic control of growth media conditions, we obtained a more detailed understanding of the environmental signals that trigger lrgAB in early stationary phase.
Several previous studies (Ahn et al., 2010; Kim et al., 2019) showed that higher glucose concentrations suppress lrgAB expression, and a recent study found a binding site for the catabolite repressor protein CcpA on the lrgA promoter region (Kim et al., 2019). The fact that lrgA, like many other virulence-linked genes in S. mutans, is regulated by catabolite repression via CcpA (Abranches et al., 2008) could potentially explain the burst of lrgA expression at the end of exponential growth. However, our data imply that an additional input also suppresses lrgA during the exponential phase. Deletion of ccpA did not affect the timing of the expression burst (Figure 6), although it did increase the level of that expression by as much as two fold (Ahn and Rice, 2016).
Molecular oxygen was found to exert more decisive control over the lrgA burst. No combination of glucose/pyruvate concentrations was found to activate lrgA in cells that grew in a continuous flow of fresh, defined medium, unless that medium was rigorously deoxygenated. In deoxygenated medium, robust lrgA expression occurred even though the composition of the medium (FMC medium containing added pyruvate) was otherwise compatible with normal, exponential growth. This finding suggests that the population-wide, tightly synchronized burst of lrgA expression observed in static, bulk cultures at stationary phase is not triggered by an internal state of the bacteria or by accumulation of pyruvate or depletion of nutrients from the media, but rather by the coincidence of oxygen depletion with availability of pyruvate. This can be seen in Figures 5C,E where both channels failed to activate lrgA in the absence of pyruvate even though the medium was anoxic. The exhaustion of oxygen, in combination with the presence of pyruvate, is an environmental condition that presumably occurs at a well-defined time point during the growth curve and can trigger PlrgA abruptly, unlike more gradual changes like the accumulation of a waste product or a quorum sensing signal.
As a facultative anaerobe, S. mutans undergoes fermentation in the absence of oxygen, converting pyruvate to lactic acid as one of its end products (Abbe et al., 1982). In the presence of oxygen, S. mutans is capable of aerobic respiration (Thomas and Pera, 1983), and so, the effect of oxygen availability on lrgAB regulation in static, aerobic cultures was previously investigated by microarray analysis (Ahn et al., 2007). Higher total lrgA RNA was found in aerobic cultures than in anaerobic cultures during mid-exponential phase (optical density of 0.4 at 600 nm) (Ahn et al., 2007). A follow-up study similarly found more pronounced lrgAB expression at stationary phase under aerobic conditions than under low-oxygen conditions (Ahn et al., 2012). Our present study differs from these prior studies in some key respects. One is that our use of a fluorescent reporter provides higher temporal resolution for detecting and probing the burst of lrgAB activity that occurs at stationary phase, which transcriptional studies may have missed. It is possible that metabolic changes in response to oxygen concentration have affected RNA stability in prior studies (Vargas-Blanco et al., 2019). Further, the low-oxygen conditions in Ahn et al. (2007) and Ahn et al. (2012) were less well defined than in the present study. For example, the low-oxygen condition in Ahn et al. (2012) consisted of growth in 5% CO2, which is not equivalent to the more anaerobic condition achieved here through the use of an enzymatic oxygen scavenger. Our data clearly show that tight control over oxygen concentration, in addition to high time resolution, are both necessary in the strong upregulation of lrgA early in stationary phase.
The mechanism by which oxygen represses lrgAB is not known, although the VicRK two component system is a potential candidate that has been shown to influence lrgAB expression (Supplementary Figure S2; Ahn and Rice, 2016). VicRK has also been linked to oxidative stress tolerance in S. mutans (Ahn and Burne, 2007; Deng et al., 2007; Senadheera et al., 2007) and VicK is regarded as a potential sensor of oxygen or redox conditions through its PAS domain (Taylor and Zhulin, 1999). A transcriptional study found that deletion of vicK led to moderate increase in early exponential phase expression of lrgA, but a nearly 100-fold decrease in late exponential phase (Ahn and Rice, 2016). In contrast, our bulk, fluorescence study did not show a decrease in lrgA activity at the transition into stationary phase (Supplementary Figure S2). Since reaching stationary phase is critical for the activation of lrgA, a transcriptional study may have been inadequate to capture lrgA activation in (Ahn and Rice, 2016). Although we did not investigate vicK effects at the individual cell level, our bulk culture data provide some support for the VicRK system as an oxygen sensing system that modulates lrgAB activity. The deletion and overexpression of vicK did not make a substantial difference in the behavior of the PlrgA reporter during anaerobic growth, but the vicK deletion strain showed modest PlrgA activity following aerobic growth, unlike either the vicK overexpression strain or wild type background. These data suggest that vicRK does not play a large role under anaerobic conditions, but that in the presence of molecular oxygen, it provides a mechanism that suppresses the onset of lrgAB expression.
LytST has also been identified as a potential intermediate between molecular oxygen and lrgA (Ahn et al., 2010, 2012). However, LytST homologs in other organisms have more recently been identified as sensors of extracellular pyruvate. In Escherichia coli, two-component systems of the LytS/LytTR family have been identified as receptors for external pyruvate (Behr et al., 2014, 2017), and a LytST-regulated system is triggered by extracellular pyruvate (Vilhena et al., 2018). In a recent study, E. coli in a viable but non-culturable state were rescued by pyruvate (Vilhena et al., 2019). In B. subtilis, both lytST and the lrgA homologs, ysbA and pftA, were shown to be essential for pyruvate utilization (van den Esker et al., 2017a). As in S. mutans, B. subtilis ysbA activates at the onset of stationary phase and decreases its expression with increasing initial glucose concentrations due to regulation by CcpA (Charbonnier et al., 2017; van den Esker et al., 2017a). The ysbAB (or pftAB) operon is induced by LytST in the presence of extracellular pyruvate (Charbonnier et al., 2017). That study reported that PftA and PftB form a hetero-oligomer that functions as a pyruvate-specific facilitated transporter and, together with LytST, help to adapt to a changing environment when the preferred carbon sources have been exhausted (Charbonnier et al., 2017).
Certainly, the LytST system is a key regulatory input to lrgAB expression in S. mutans, as deletion of lytST was previously shown to prevent stationary phase expression of lrgAB (Supplementary Figure S4; Ahn et al., 2010). In our studies, a lytST overexpressing strain readily activated lrgA, even in the absence of pyruvate and in media that were not thoroughly deoxygenated. Overexpression of lytST eliminated the bursting character of lrgA expression and caused instead generally robust expression under aerobic and pyruvate-absent conditions, where lrgA expression was absent in the wild type. These data indicate that lytST is not only required for activation of lrgA, but that it can overpower the repression signals due to molecular oxygen. Interaction of LytST with the cre1 site previously suggested that LytST may inhibit the action of CcpA and therefore partially bypass catabolite repression as well (Kim et al., 2019).
The brief duration of strong lrgA expression at stationary phase may offer an intriguing clue to the mechanism of regulation, as it suggests a self-limiting behavior. In the B. subtilis study above, induction of the lrgAB homolog ysbAB (pftAB) increased as pyruvate increased up to 1 mM but was also inhibited via LytST under excess pyruvate conditions (Charbonnier et al., 2017), suggesting that an influx of pyruvate led to inhibition. One may speculate that if expression of S. mutans lrgA triggers a pyruvate influx that suppresses further lrgA expression, then the temporal profile of lrgA activity in response to extracellular pyruvate would appear as a rapid burst as is observed here. In that case, if pyruvate can also enter the cell by another pathway (unrelated to LrgAB and LytST), then very-high concentrations of extracellular pyruvate would be expected to suppress lrgAB activity, as is observed.
It is an interesting property of lrgAB that its activation (and subsequent deactivation) in a bulk culture is tightly synchronized temporally in the population, and yet the level of expression (as indicated by GFP concentration) varies between cells. Although some of the cell-to-cell heterogeneity seen in S. mutans fluorescent protein expression can probably be attributed to the use of plasmid-based reporters (Shields et al., 2019), the heterogeneity we observe in lrgA expression cannot be due entirely to the plasmid reporter. When cells drawn from a static culture activate lrgA, the population distribution in fluorescence is broad with a strongly bimodal character (Figure 4C). This bimodality is highlighted in Figures 8A,B, which represent each of the lrgA-active, single-cell histograms as the sum of two gamma probability distributions [The gamma distribution is characteristic of stochastic gene expression (Friedman et al., 2006)]. The relative areas under the two distributions indicate that roughly 85% of cells are lrgA-active (high fluorescence) at both 7 and 8 h. By contrast, lrgA expression under microfluidic flow (Figures 5B,D) lacks this bimodal character, producing virtually unimodal histograms (≥ 98% lrgA-active) in the same mathematical representation (Figures 8C,D). This finding indicates that, when environment conditions are sufficiently uniform as in the microfluidic study, a robust and generally similar level of lrgA expression is observed population wide. Therefore, local differences or gradients in key parameters such as pyruvate, oxygen, or glucose may explain some of the heterogeneity that was observed in our static culture studies and also in the individual cell expression of the lrgA homolog ysbA in B. subtilis (van den Esker et al., 2017a). The oral biofilm presents S. mutans with a highly heterogeneous environment (Stewart and Franklin, 2008), including variable oxygen concentrations. Our data suggest that this heterogeneity could induce very diverse levels of lrgAB activation in a biofilm population, leading to a useful division in response. Cells deeper within the biofilm would encounter less oxygen while presumably receiving pyruvate via diffusion from cells nearer the surface layer and would then be significantly more likely to activate the lrgAB mechanism and utilize the pyruvate source.
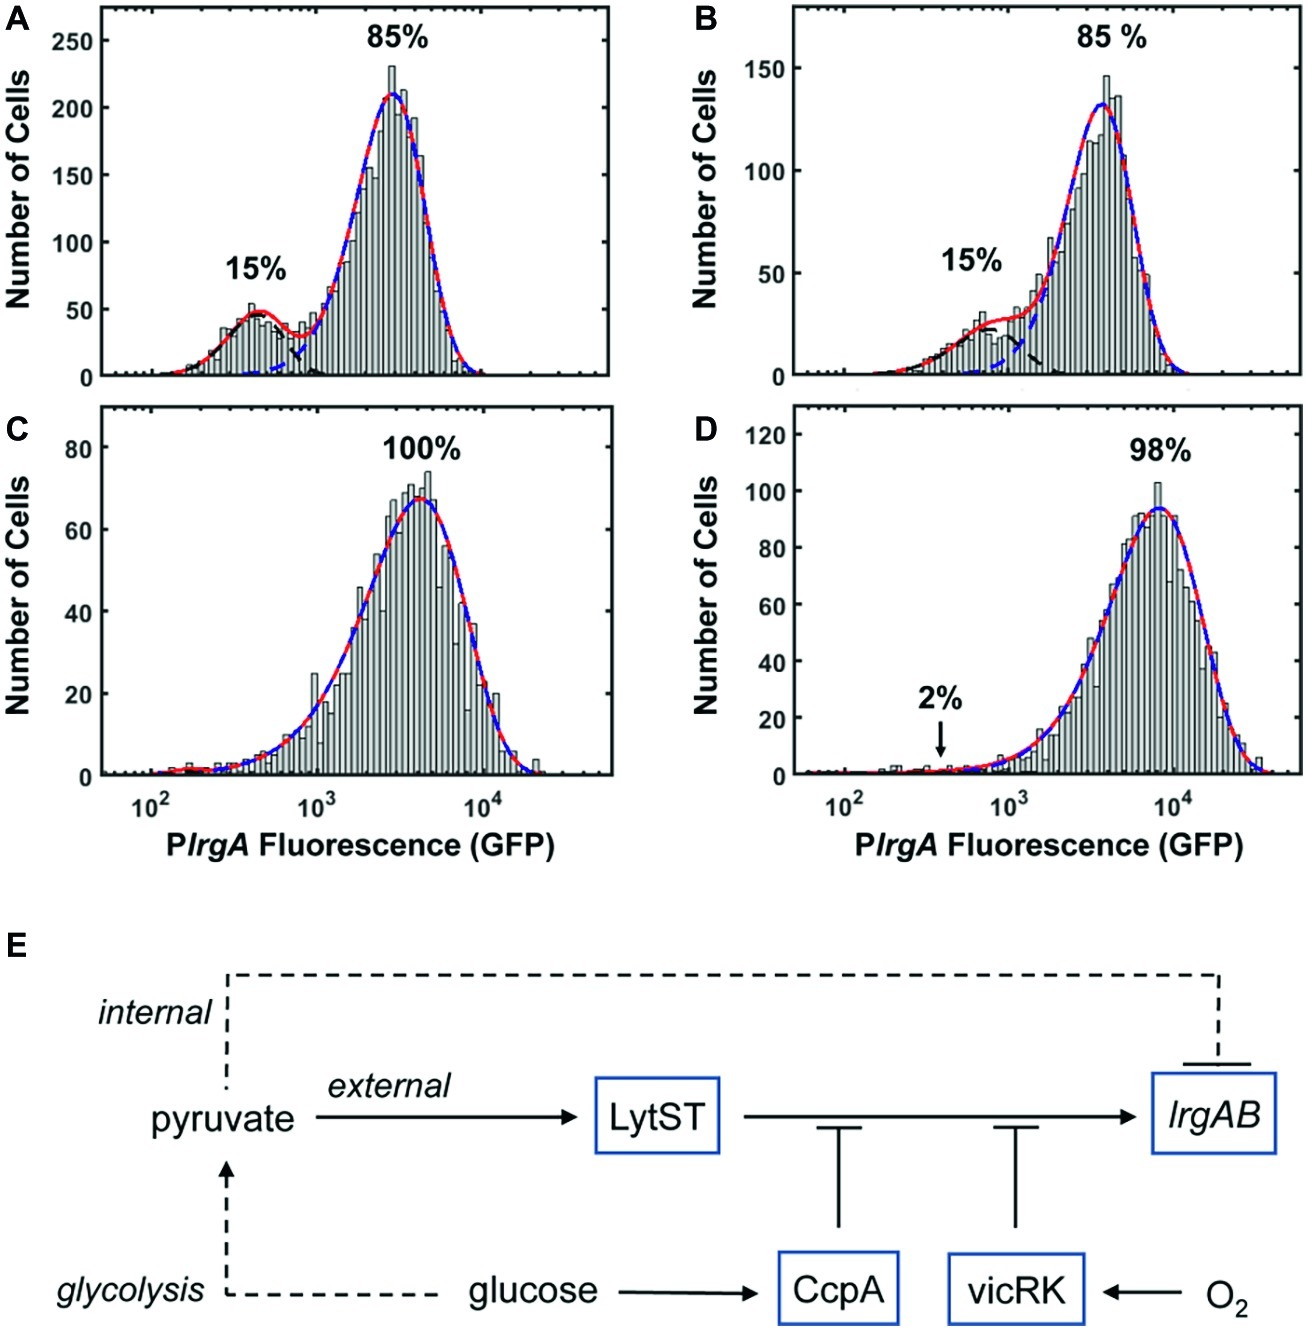
Figure 8. PlrgA-gfp reporter activity of individual cells fit to two gamma distributions representing the activated (dashed blue) and inactivated (dashed black) populations. Solid red line is the sum of both distributions. (A) 7 h sample from Figure 4C; (B) 8 h sample from Figure 4C; (C) 210 min sample from Figure 5B; (D) 210 min sample from Figure 5D. Five individual images were collected and analyzed for each experimental condition shown. (E) Schematic for control of S. mutans lrgAB by glucose, molecular oxygen, and external and internal pyruvate signals, via LytST and vicRK.
The presence of heterogeneity without bimodality in our microfluidic data also implies that lrgAB is regulated in an open-loop mechanism, without benefit of the positive transcriptional feedback that is typically associated with bimodality in gene expression (Dubnau and Losick, 2006). Rather, a mechanism of activation by LytST followed by negative feedback via intracellular pyruvate, as hypothesized above (Figure 8E), may be sufficient to control lrgAB, as it allows both an on-switch and an off-switch. Therefore, our data substantially revise the proposed model (van den Esker et al., 2017b) for lrgAB regulation in S. mutans by showing that intracellular and extracellular pyruvate modulate lrgAB expression, most likely through LytST, and that oxygen also plays a very strong repressing role that is likely facilitated by VicRK. Taken together, our model combines the three parameters studied here to illustrate their role in lrgAB activation. We note that the histogram of single-cell fluorescence is markedly narrower for the lytST overexpressing strain (Figure 7A) than for the wild type background (Figure 5D), suggesting that lytST overexpression is a strong enough stimulus that it brings lrgA expression closer to saturation and reduces the heterogeneity that is normally present.
Finally, our study has not identified a pathway by which cidAB modulates lrgAB expression. These two operons exhibit a complex pattern of transcriptional cross regulation that is growth-phase dependent, indicative of interactions between different gene products within both operons. It is likely not as simple as mutual repression (Ahn and Rice, 2016). Future studies of cidAB activation may begin to shed light on how the two operons interact.
Data Availability Statement
The datasets generated for this study are available on request to the corresponding author.
Author Contributions
II designed and performed experiments, analyzed and interpreted data, and wrote the manuscript. SH designed experiments, analyzed and interpreted data, and wrote the manuscript. KR and S-JA interpreted data and edited the manuscript. All authors gave final approval to the manuscript and agree to be accountable for all aspects of the work.
Funding
This work was supported by the NIDCR through awards R01 DE025237 and R01 DE023339.
Conflict of Interest
The authors declare that the research was conducted in the absence of any commercial or financial relationships that could be construed as a potential conflict of interest.
Supplementary Material
The Supplementary Material for this article can be found online at: https://www.frontiersin.org/articles/10.3389/fmicb.2020.00018/full#supplementary-material
References
Abbe, K., Takahashi, S., and Yamada, T. (1982). Involvement of oxygen-sensitive pyruvate formate-lyase in mixed-acid fermentation by Streptococcus mutans under strictly anaerobic conditions. J. Bacteriol. 152, 175–182.
Abranches, J., Nascimento, M. M., Zeng, L., Browngardt, C. M., Wen, Z. T., Rivera, M. F., et al. (2008). CcpA regulates central metabolism and virulence gene expression in Streptococcus mutans. J. Bacteriol. 190, 2340–2349. doi: 10.1128/JB.01237-07
Ahn, S., Ahn, S., Browngardt, C. M., and Burne, R. A. (2009). Changes in biochemical and phenotypic properties of Streptococcus mutans during growth with aeration. Appl. Environ. Microbiol. 75, 2517–2527. doi: 10.1128/AEM.02367-08
Ahn, S. J., and Burne, R. A. (2007). Effects of oxygen on biofilm formation and the AtlA autolysin of Streptococcus mutans. J. Bacteriol. 189, 6293–6302. doi: 10.1128/JB.00546-07
Ahn, S. J., Deep, K., Turner, M. E., Ishkov, I., Waters, A., Hagen, S. J., et al. (2019). Characterization of LrgAB as a stationary phase-specific pyruvate uptake system in Streptococcus mutans. BMC Microbiol. 19:223. doi: 10.1186/s12866-019-1600-x
Ahn, S. J., Gu, T., Koh, J., and Rice, K. C. (2017). Remodeling of the Streptococcus mutans proteome in response to LrgAB and external stresses. Sci. Rep. 7:14063. doi: 10.1038/s41598-017-14324-w
Ahn, S. J., Qu, M., Roberts, E., Burne, R. A., and Rice, K. C. (2012). Identification of the Streptococcus mutans LytST two-component regulon reveals its contribution to oxidative stress tolerance. BMC Microbiol. 12:187. doi: 10.1186/1471-2180-12-187
Ahn, S. J., and Rice, K. C. (2016). Understanding the Streptococcus mutans Cid/Lrg system through CidB function. Appl. Environ. Microbiol. 82, 6189–6203. doi: 10.1128/AEM.01499-16
Ahn, S. J., Rice, K. C., Oleas, J., Bayles, K. W., and Burne, R. A. (2010). The Streptococcus mutans Cid and Lrg systems modulate virulence traits in response to multiple environmental signals. Microbiology 156, 3136–3147. doi: 10.1099/mic.0.039586-0
Ahn, S. J., Wen, Z. T., and Burne, R. A. (2007). Effects of oxygen on virulence traits of Streptococcus mutans. J. Bacteriol. 189, 8519–8527. doi: 10.1128/JB.01180-07
Aitken, C. E., Marshall, R. A., and Puglisi, J. D. (2008). An oxygen scavenging system for improvement of dye stability in single-molecule fluorescence experiments. Biophys. J. 94, 1826–1835. doi: 10.1529/biophysj.107.117689
Baumann, R. P., Penketh, P. G., Seow, H. A., Shyam, K., and Sartorelli, A. C. (2008). Generation of oxygen deficiency in cell culture using a two-enzyme system to evaluate agents targeting hypoxic tumor cells. Radiat. Res. 170, 651–660. doi: 10.1667/RR1431.1
Bayles, K. W. (2003). Are the molecular strategies that control apoptosis conserved in bacteria? Trends Microbiol. 11, 306–311. doi: 10.1016/S0966-842X(03)00144-6
Bayles, K. W. (2007). The biological role of death and lysis in biofilm development. Nat. Rev. Microbiol. 5, 721–726. doi: 10.1038/nrmicro1743
Bayles, K. W. (2014). Bacterial programmed cell death: making sense of a paradox. Nat. Rev. Microbiol. 12, 63–69. doi: 10.1038/nrmicro3136
Behr, S., Fried, L., and Jung, K. (2014). Identification of a novel nutrient-sensing histidine kinase/response regulator network in Escherichia coli. J. Bacteriol. 196, 2023–2029. doi: 10.1128/JB.01554-14
Behr, S., Kristoficova, I., Witting, M., Breland, E. J., Eberly, A. R., Sachs, C., et al. (2017). Identification of a high-affinity pyruvate receptor in Escherichia coli. Sci. Rep. 7:1388. doi: 10.1038/s41598-017-01410-2
Boudreau, C., Wee, T., Duh, Y., Couto, M. P., Ardakani, K. H., and Brown, C. M. (2016). Excitation light dose engineering to reduce photo-bleaching and photo-toxicity. Sci. Rep. 6:30892. doi: 10.1038/srep30892
Brunskill, E. W., and Bayles, K. W. (1996). Identification of LytSR-regulated genes from Staphylococcus aureus. J. Bacteriol. 178, 5810–5812. doi: 10.1128/JB.178.19.5810-5812.1996
Charbonnier, T., Le Coq, D., McGovern, S., Calabre, M., Delumeau, O., Aymerich, S., et al. (2017). Molecular and physiological logics of the pyruvate-induced response of a novel transporter in Bacillus subtilis. MBio 8:e00976-17. doi: 10.1128/mBio.00976-17
Chatfield, C. H., Koo, H., and Quivey, R. G. (2005). The putative autolysin regulator LytR in Streptococcus mutans plays a role in cell division and is growth-phase regulated. Microbiology 151, 625–631. doi: 10.1099/mic.0.27604-0
Cubitt, A. B., Heim, R., Adams, S. R., Boyd, A. E., Gross, L. A., and Tsien, R. Y. (1995). Understanding, improving and using green fluorescent proteins. Trends Biochem. Sci. 20, 448–455. doi: 10.1016/S0968-0004(00)89099-4
De Furio, M., Ahn, S. J., Burne, R. A., and Hagen, S. J. (2017). Oxidative stressors modify the response of Streptococcus mutans to its competence signal peptides. Appl. Environ. Microbiol. 83:e01345-17. doi: 10.1128/AEM.01345-17
Deng, D. M., Liu, M. J., ten Cate, J. M., and Crielaard, W. (2007). The VicRK system of Streptococcus mutans responds to oxidative stress. J. Dent. Res. 86, 606–610. doi: 10.1177/154405910708600705
Dubnau, D., and Losick, R. (2006). Bistability in bacteria. Mol. Microbiol. 61, 564–572. doi: 10.1111/j.1365-2958.2006.05249.x
Englander, S. W., Calhoun, D. B., and Englander, J. J. (1987). Biochemistry without oxygen. Anal. Biochem. 161, 300–306. doi: 10.1016/0003-2697(87)90454-4
Friedman, N., Cai, L., and Xie, X. S. (2006). Linking stochastic dynamics to population distribution: an analytical framework of gene expression. Phys. Rev. Lett. 97:168302. doi: 10.1103/PhysRevLett.97.168302
Groicher, K. H., Firek, B. A., Fujimoto, D. F., and Bayles, K. W. (2000). The Staphylococcus aureus lrgAB operon modulates Murein hydrolase activity and penicillin tolerance. J. Bacteriol. 182, 1794–1801. doi: 10.1128/JB.182.7.1794-1801.2000
Hansen, M. C., Palmer, R. J., Udsen, C., White, D. C., and Molin, S. (2001). Assessment of GFP fluorescence in cells of Streptococcus gordonii under conditions of low pH and low oxygen concentration. Microbiology 147, 1383–1391. doi: 10.1099/00221287-147-5-1383
Iizuka, R., Yamagishi-Shirasaki, M., and Funatsu, T. (2011). Kinetic study of de novo chromophore maturation of fluorescent proteins. Anal. Biochem. 414, 173–178. doi: 10.1016/j.ab.2011.03.036
Kim, H., Waters, A., Turner, M. E., Rice, K. C., and Ahn, S. (2019). Regulation of cid and lrg expression by CcpA in Streptococcus mutans. Microbiology 165, 113–123. doi: 10.1099/mic.0.000744
Kobayashi, K., Ogura, M., Yamaguchi, H., Yoshida, K., Ogasawara, N., Tanaka, T., et al. (2001). Comprehensive DNA microarray analysis of Bacillus subtilis two-component regulatory systems. J. Bacteriol. 183, 7365–7370. doi: 10.1128/JB.183.24.7365-7370.2001
Kwak, I. H., Son, M., and Hagen, S. J. (2012). Analysis of gene expression levels in individual bacterial cells without image segmentation. Biochem. Biophys. Res. Commun. 421, 425–430. doi: 10.1016/j.bbrc.2012.03.117
LeBlanc, D. J., Lee, L. N., and Abu-Al-Jaibat, A. (1992). Molecular, genetic, and functional analysis of the basic replicon of pVA380-1, a plasmid of oral streptococcal origin. Plasmid 28, 130–145. doi: 10.1016/0147-619X(92)90044-B
Liu, N., Chaudhry, M. T., Xie, Z., Kreth, J., and Merritt, J. (2017). Identification of New Degrons in Streptococcus mutans reveals a novel strategy for engineering targeted, controllable proteolysis. Front. Microbiol. 8:2572. doi: 10.3389/fmicb.2017.02572
Loesche, W. J. (1986). Role of Streptococcus mutans in human dental decay. Microbiol. Rev. 50, 353–380.
Pang, T., Fleming, T. C., Pogliano, K., and Young, R. (2013). Visualization of pinholin lesions in vivo. Proc. Natl. Acad. Sci. USA 110, e2054–e2063. doi: 10.1073/pnas.1222283110
Rice, K. C., and Bayles, K. W. (2003). Death’s toolbox: examining the molecular components of bacterial programmed cell death. Mol. Microbiol. 50, 729–738. doi: 10.1046/j.1365-2958.2003.t01-1-03720.x
Rice, K. C., Firek, B. A., Nelson, J. B., Yang, S., Patton, T. G., and Bayles, K. W. (2003). The Staphylococcus aureus cidAB operon: evaluation of its role in regulation of Murein hydrolase activity and penicillin tolerance. J. Bacteriol. 185, 2635–2643. doi: 10.1128/JB.185.8.2635-2643.2003
Rice, K. C., Turner, M. E., Carney, O. V., Gu, T., and Ahn, S. (2017). Modification of the Streptococcus mutans transcriptome by LrgAB and environmental stressors. Microb. Genom. 3:e000104. doi: 10.1099/mgen.0.000104
Saier, M. H. J., and Reddy, B. L. (2015). Holins in bacteria, eukaryotes, and archaea: multifunctional xenologues with potential biotechnological and biomedical applications. J. Bacteriol. 197, 7–17. doi: 10.1128/JB.02046-14
Senadheera, D. B., Cordova, M., Ayala, E. A., Chávez de Paz, L. E., Singh, K., Downey, J. S., et al. (2012). Regulation of bacteriocin production and cell death by the VicRK signaling system in Streptococcus mutans. J. Bacteriol. 194, 1307–1316. doi: 10.1128/JB.06071-11
Senadheera, M. D., Lee, A. W. C., Hung, D. C. I., Spatafora, G. A., Goodman, S. D., and Cvitkovitch, D. G. (2007). The Streptococcus mutans vicX gene product modulates gtfB/C expression, biofilm formation, genetic competence, and oxidative stress tolerance. J. Bacteriol. 189, 1451–1458. doi: 10.1128/JB.01161-06
Shemesh, M., Tam, A., Kott-Gutkowski, M., Feldman, M., and Steinberg, D. (2008). DNA-microarrays identification of Streptococcus mutans genes associated with biofilm thickness. BMC Microbiol. 8:236. doi: 10.1186/1471-2180-8-236
Shields, R. C., Kaspar, J. R., Lee, K., Underhill, S. A. M., and Burne, R. A. (2019). Fluorescence tools adapted for real-time monitoring of the behaviors of Streptococcus species. Appl. Environ. Microbiol. 85:e00620-19. doi: 10.1128/AEM.00620-19
Son, M., Ahn, S.-J., Guo, Q., Burne, R. A., and Hagen, S. J. (2012). Microfluidic study of competence regulation in Streptococcus mutans: environmental inputs modulate bimodal and unimodal expression of comX. Mol. Microbiol. 86, 258–272. doi: 10.1111/j.1365-2958.2012.08187.x
Son, M., Ghoreishi, D., Ahn, S., Burne, R. A., and Hagen, S. J. (2015). Sharply tuned pH response of genetic competence regulation in Streptococcus mutans: a microfluidic study of the environmental sensitivity of comX. Appl. Environ. Microbiol. 81, 5622–5631. doi: 10.1128/AEM.01421-15
Stewart, P. S., and Franklin, M. J. (2008). Physiological heterogeneity in biofilms. Nat. Rev. Microbiol. 6, 199–210. doi: 10.1038/nrmicro1838
Taylor, B. L., and Zhulin, I. B. (1999). PAS domains: internal sensors of oxygen, redox potential, and light. Microbiol. Mol. Biol. Rev. 63, 479–506. doi: 10.1128/MMBR.63.2.479-506.1999
Terleckyj, B., Willett, N. P., and Shockman, G. D. (1975). Growth of several cariogenic strains of oral streptococci in a chemically defined medium. Infect. Immun. 11, 649–655. doi: 10.1128/IAI.11.4.649-655.1975
Thomas, E. L., and Pera, K. A. (1983). Oxygen metabolism of Streptococcus mutans: uptake of oxygen and release of superoxide and hydrogen peroxide. J. Bacteriol. 154, 1236–1244. doi: 10.1128/JB.154.3.1236-1244.1983
Underhill, S. A. M., Shields, R. C., Kaspar, J. R., Haider, M., Burne, R. A., and Hagen, S. J. (2018). Intracellular signaling by the comRS system in Streptococcus mutans genetic competence. mSphere 3:e00444-18. doi: 10.1128/mSphere.00444-18
van den Esker, M. H., Kovács, Á. T., and Kuipers, O. P. (2017a). YsbA and LytST are essential for pyruvate utilization in Bacillus subtilis. Environ. Microbiol. 19, 83–94. doi: 10.1111/1462-2920.13454
van den Esker, M. H., Kovács, Á. T., and Kuipers, O. P. (2017b). From cell death to metabolism: Holin-Antiholin homologues with new functions. MBio 8:e01963-17. doi: 10.1128/mBio.01963-17
Vargas-Blanco, D., Zhou, Y., Zamalloa, L. G., Antonelli, T., and Shell, S. S. (2019). mRNA degradation rates are coupled to metabolic status in Mycobacterium smegmatis. MBio 10:e00957-19. doi: 10.1128/mBio.00957-19
Vilhena, C., Kaganovitch, E., Grünberger, A., Motz, M., Forné, I., Kohlheyer, D., et al. (2019). Importance of pyruvate sensing and transport for the resuscitation of viable but Nonculturable Escherichia coli K-12. J. Bacteriol. 201:e00610-18. doi: 10.1128/JB.00610-18
Vilhena, C., Kaganovitch, E., Shin, J. Y., Grünberger, A., Behr, S., Kristoficova, I., et al. (2018). A single-cell view of the BtsSR/YpdAB pyruvate sensing network in Escherichia coli and its biological relevance. J. Bacteriol. 200:e00536-17. doi: 10.1128/JB.00536-17
Vordermark, D., Shibata, T., and Brown, J. M. (2001). Green fluorescent protein is a suitable reporter of tumor hypoxia despite an oxygen requirement for chromophore formation. Neoplasia 3, 527–534. doi: 10.1038/sj.neo.7900192
Wen, Z. T., and Burne, R. A. (2002). Analysis of cis- and trans-acting factors involved in regulation of the Streptococcus mutans Fructanase gene (fruA). J. Bacteriol. 184, 126–133. doi: 10.1128/JB.184.1.126-133.2002
Wessel, A. K., Arshad, T. A., Fitzpatrick, M., Connell, J. L., Bonnecaze, R. T., Shear, J. B., et al. (2014). Oxygen limitation within a bacterial aggregate. MBio 5:e00992. doi: 10.1128/mBio.00992-14
Keywords: Streptococcus mutans, bimodality, ccpA, fluorescence, catabolite repression, two-component systems, gamma distribution, pyruvate
Citation: Ishkov IP, Ahn S-J, Rice KC and Hagen SJ (2020) Environmental Triggers of lrgA Expression in Streptococcus mutans. Front. Microbiol. 11:18. doi: 10.3389/fmicb.2020.00018
Edited by:
Hari S. Misra, Bhabha Atomic Research Centre (BARC), IndiaReviewed by:
Jürgen Tomasch, Helmholtz Association of German Research Centers (HZ), GermanyMarlise Inez Klein, São Paulo State University, Brazil
Copyright © 2020 Ishkov, Ahn, Rice and Hagen. This is an open-access article distributed under the terms of the Creative Commons Attribution License (CC BY). The use, distribution or reproduction in other forums is permitted, provided the original author(s) and the copyright owner(s) are credited and that the original publication in this journal is cited, in accordance with accepted academic practice. No use, distribution or reproduction is permitted which does not comply with these terms.
*Correspondence: Stephen J. Hagen, c2poYWdlbkB1ZmwuZWR1