 Mengliang Shi
 Lei Chen
 Weiwen Zhang
- 1Laboratory of Synthetic Microbiology, School of Chemical Engineering & Technology, Tianjin University, Tianjin, China
- 2Frontier Science Center for Synthetic Biology and Key Laboratory of Systems Bioengineering, Ministry of Education of China, Tianjin, China
- 3Collaborative Innovation Center of Chemical Science and Engineering, Tianjin, China
- 4Center for Biosafety Research and Strategy, Tianjin University, Tianjin, China
Two-component signal transduction systems are still poorly functionally characterized in the model cyanobacterium Synechocystis sp. PCC 6803. To address the issue, a GC-MS based comparative metabolomic analysis was conducted on a library of 44 knockout mutants for the response regulators (RRs) in Synechocystis. The metabolomic profiling analysis showed that 7 RRs mutants, namely Δslr1909, Δsll1291, Δslr6040, Δsll1330, Δslr2024, Δslr1584, and Δslr1693, were significantly different at metabolomic level, although their growth patterns are similar to the wild type under the normal autotrophic growth condition, suggesting regulatory diversity of RRs at metabolite level in Synechocystis. Additionally, a detailed metabolomic analysis coupled with RT-PCR verification led to useful clues for possible function of these 7 RRs, which were found involved in regulation of multiple aspects of cellular metabolisms in Synechocystis. Moreover, an integrative metabolomic and evolutionary analysis of all RR showed that four groups of RR genes clustered together in both metabolomic and evolutionary trees, suggesting of possible functional conservation of these RRs during the evolutionary process. Meanwhile, six groups of RRs with close evolutionary origin were found with different metabolomic profiles, suggesting possible functional changes during evolution. In contrast, more than 10 groups of RR genes with different clustering patterns in the evolutionary tree were found clustered together in metabolomics-based tree, suggesting possible functional convergences during the evolution. This study provided a metabolomic view of RR function, and the most needed functional clues for further characterization of these regulatory proteins in Synechocystis.
Introduction
Cyanobacteria, as one of the primary producers for life on earth, have attracted significant attention in recent decades due to its ability to grow oxygenic photo-autotrophically. In nature, cyanobacteria are found in varying environments ranging from frigidity and torridity, alkaline and acid, saline ocean and freshwater, terrestrial, and symbiotic environments (Ashby and Houmard, 2006), probably due to their abilities to adjust cell behavior by regulating gene expression accurately and timely to adapt to various environmental perturbations. Cellular responses of cyanobacteria to various environmental factors, such as oxidative stress (Cassier-Chauvat and Chauvat, 2014), osmotic stress (Ai et al., 2014), salt (Pade and Hagemann, 2015), phosphate (Schwarz and Forchhammer, 2005), heavy metal ion (Cassier-Chauvat and Chauvat, 2014), acids (Hirani et al., 2001), nitrogen starvation (Schwarz and Forchhammer, 2005), cold stress (Sinetova and Los, 2016), heat shock (Rajaram et al., 2014), and high light stress (Muramatsu and Hihara, 2012), have been a research focus for many years. Additionally, due to its readiness for gene manipulation (Shestakov and Khyen, 1970), cyanobacteria have been recently developed as a “chassis” in synthetic biology to produce multiple biofuels and bioproducts, namely, 3-hydroxypropionic acid (Wang et al., 2016), free fatty acids (Liu et al., 2011), isoprene (Chaves and Melis, 2018), 2,3-butanediol (Oliver et al., 2013), 1-butanol (Lan and Liao, 2011), squalene (Englund et al., 2014), and sunscreen compound mycosporin-like amino acids (Singh et al., 2017), demonstrating their feasibility as a “microbial cell factories” for future large-scale biotechnology application.
As one of the critical signal transduction systems in microbes, the two-component signal transduction systems (TCSTSs) are typically composed of a histidine kinase (HK) as a transmitter sensor and a response regulator (RR) as a receiver, controlling the gene expression of microbes in response to the alterations in environments (Ashby and Houmard, 2006). HK responds to environmental signals and then its conserved histidine residue is auto-phosphorylated. The autophosphorylation then enables HK to bind and convey its specific phosphoryl group onto a conserved aspartate residue on a RR. Subsequently, the RR is phosphorylated on its conserved receiver domain, which normally results in the activation of an output domain that can alternate the expression activities in a variety of genes that allow the microbes to adapt to the external signals (Laub et al., 2007). Among the 3,725 putative genes in Synechocystis sp. PCC 6803 (hereafter Synechocystis), 45 genes on chromosome and plasmids encode putative RRs (Kaneko et al., 1996; Ashby and Houmard, 2006). Several RRs have been functionally characterized, such as Slr1909 mediating acid response network (Ren et al., 2014) and Sll0649 involved in tolerance to cadmium and several other metal ions (Chen et al., 2014b), as well as Sll0797 (rppA) and Sll0798 (rppB) controlling the expression of genes involved photosystem I and II (Li and Sherman, 2000), Slr0115, Slr0649, Sll1708, and Slr1783 involved in salt and hyperosmotic stress (Shoumskaya et al., 2005), RpaA involved in adaption to changes in light conditions (Iijima et al., 2015), RpaB repressing high light inducible genes (Kappell and Van Waasbergen, 2007), and activating PSI under low light condition (Seino et al., 2009), and Slr0115 (RpaA) and Slr0947 (RpaB) oppositely controlling the flow of energy from the light-harvesting phycobilisomes to the photosystems (Kappell and Van Waasbergen, 2007). In addition, a previous work by Murata and Suzuki indicated that multiple sets of Hik-Rre pairs work for transcriptional regulation of different sets of genes under different conditions (Murata and Suzuki, 2006), for example, Hik33-Rre26/Rre31 was identified to respond to low-temperature stress, Hik33/Hik34-Rre31, Hik10-Rre3, Hik16/Hik41-Rre17, Hik2-Rre1 were reported to respond to salt and hyperosmotic stress (Murata and Suzuki, 2006). However, in spite of all the progress, most of the RRs in Synechocystis are still functionally unknown.
Various genome-scale methodologies have recently been developed and utilized to explore gene function of TCSTSs in a variety of microbes. For example, a genome-scale transcriptomic analysis in the parental Streptomyces coelicolor strain M145 and the mutant ΔdraR-K was conducted via DNA microarray and the real-time reverse transcription quantitative polymerase chain reaction (RT-qPCR), unveiling the global function of DraR-K in regulating the differentiation of physiology and morphology (Yu et al., 2014). In our previous work, the possible connection between the small RNA CoaR and the RR Slr1037 in regulating tolerance to butanol in Synechocystis was identified and confirmed separately through quantitative proteomics and quantitative real-time PCR (qRT-PCR) (Sun et al., 2017a). Metabolomics can identify numerous small molecules in cell and show their variances in abundance, which allows it to be extensively utilized in the analysis of various microbes in responsive to alterations in environmental conditions. In a recent study, a targeted liquid chromatography-mass spectrometry (LC-MS) based metabolomic profile analysis showed a widespread crosstalk of TCSTSs in regulating central and energetic metabolism in Synechocystis (Pei et al., 2017). However, among the limited metabolites selected in this targeted LC-MS based metabolomic profile analysis, most of the metabolites were unstable in room temperature (Pei et al., 2017). Compared with LC-MS based approach, untargeted gas chromatography-mass spectrometry (GC-MS) based metabolomic analysis can detect more metabolites, which include some stable small molecules such as various organic acids, amino acids and sugars, thus provide more information on the metabolism regulation of TCSTSs. In this study, to further elucidate the functions of TCSTSs in Synechocystis, a GC-MS based metabolomic profiling was conducted for 44 knockout mutants of Synechocystis RR-coding genes under photoautotrophic growth condition. The metabolomic analysis showed that seven mutants have the greatest changes at the metabolite level compared with the wild type, indicating their differential regulatory roles. Additionally, an integrative analysis of metabolomic profiles and evolutionary trees was also conducted to reveal the functional conservation and changes of RRs during evolution process in Synechocystis.
Materials and Methods
Bacterial Growth Conditions
Synechocystis sp. PCC 6803 was attained from American Type Culture Collection (ATCC) and utilized as the wild type to construct single-gene knockout mutants of RR genes. A total of 44 knockout mutants of putative RR-coding genes were successfully constructed, confirmed and described previously (Pei et al., 2017). The mutants and the wild type grew in the normal BG11 medium (pH 7.5) in 100 mL flasks with 25 mL medium in each flask. The light intensity was generally 50 μmol photons m−2s−1 and the illumination incubator was set at 130 rpm, 30°C (HNY-211B Illuminating Shaker, Honour, China). The condition of growth was defined as the cell density measured at OD730nm by a UV-1750 spectrophotometer (Shimadzu, Japan) every 12 h, from the starting point at about OD730nm 0.1 and after 48 h at ~OD730nm 1.25. For each strain, five biological replicates were inoculated independently, and the samples were collected for the subsequent metabolomic analysis.
GC-MS Based Metabolomic Analysis
All chemicals used for metabolites isolation and GC-MS analysis were accessed from Sigma-Aldrich (Taufkirchen, Germany). For metabolomic analysis, samples of the wild type and the mutants were collected from normal BG11 medium at 48 h. For each sample, cells equivalent to 108 were collected by centrifugation at 6,000 × g for 10 min at 4°C (Eppendorf, Hamburg, Germany). The cell pellets were immediately frozen in liquid nitrogen and then stored at −80°C before use. The metabolomic analysis was performed as described previously (Zhang et al., 2015). Peak areas of all the metabolites identified in GC-MS were normalized by the peak areas of internal standard D13-sorbitol and the cell numbers of the sample, and the comparative abundances for each identified metabolite were used for future analysis. The metabolites missing in more than 50% of the samples were cut off and <50% were filled up with average in replicates.
Statistical Analysis for Metabolomic Data
The metabolomic profiles were then further standardized via dividing the relative values of mutants by that of the wild type, and taking log2 of the results. The data were applied to Principal Component Analysis (PCA) via the software SIMCA-P 11.5 (Laiakis et al., 2010). Samples with p < 0.05 displayed by hoteling t2 of were considered distinctly different.
qRT-PCR Analysis
Samples of Synechocystis mutants and the wild type were collected at 48 h. About 2 mL of samples with cell density of OD730 nm = 2 were collected by centrifugation (12,000 × g for 2 min), and immediately applied to RNA extraction procedure following the manufacturer's protocol. Total RNA extraction was achieved through a Direct-zol™ RNA MiniPrep Kit (Zymo, CA, USA). cDNAs were synthesized via RevertAid First Strand cDNA Synthesis Kit as instructed in the manufacturer's protocol (Thermo Fisher Scientific Inc., CA, USA). Then the cDNAs for each sample was diluted for 500 times and 1 μL of each was employed as the template for the subsequent qRT-PCR reaction. All the primers were designed via primer-blast in the NCBI (http://www.ncbi.nlm.nih.gov) and synthesized by GENEWIZ Inc. (Suzhou, China). Primers used in this study are listed in Table S1. The qPCR reaction was carried out in 10 μL reactions composed of 5 μL of UltraSYBR Mixture (CW Biotech, Beijing, China), 3 μL dH2O, 1 μL diluted template cDNA, and 1 μL mix of each former and reverse PCR primer diluted by 500 times, utilizing the StepOne™ Real-Time PCR System (Applied Biosystems, CA, USA) (Sun et al., 2017b). Four technical replicates were performed for each condition. Data analysis was carried out using the StepOne analytical software v2.3 (Applied Biosystems, CA, USA) and the 2−ΔΔCT method (Livak and Schmittgen, 2001). 16S rRNA was selected as a reference gene and the data were presented as ratios between the amounts of transcript in mutants and the wild type (Sun et al., 2017b).
Comparative Analysis of Metabolomic and Evolutionary Profiles
Hierarchical clustering analysis based on the metabolomic profiles between each mutant and wild type, was performed. The metabolomic data of each mutant was normalized by that of the wild type in the same batch to avoid systematic error from the cultivation. Heatmap were created by MultiExperiment Viewer software available publically (http://mev.tm4.org/) (Howe et al., 2010). Then, protein sequences and receiver domain sequences of all the 44 response regulator genes were abstracted from NCBI (http://www.ncbi.nlm.nih.gov) and SMART (http://smart.embl-heidelberg.de/) (Letunic and Bork, 2017), then aligned by MUSCLE (http://www.ebi.ac.uk/Tools/msa/muscle/). To identify possible RR subfamilies, BLAST for homology identification was employed, and only those RR with 80% aligned coverage with E-value < 1e-20 were considered as the same families. Phylogenetic tree based on the conserved receiver domain of 44 RR genes was constructed by maximum likelihood method using the software Mega-X (Kumar et al., 2018) with 1,000 bootstrap replicates.
Results and Discussion
Untargeted GC-MS Based Metabolomic Analysis of RRs
In the previous study, attempt was made to generate single gene deletion mutants for all 45 tentative RR genes in the Synechocystis genome, and the efforts led to successful completely segregated construction of 41 RR genes and 3 partially knockout mutants sll1879, sll0921, slr0947, with only one, slr6001 gene that we were not able to generate deletion mutant even after multiple attempts, implying the gene may be involved in essential cellular function under autotrophic growth condition. The growth patterns of 44 knockout mutants for RR genes in Synechocystis were compared with the wild type, and a targeted LC-MS based metabolomic analysis was conducted for their involvement in carbon and energetic metabolism under autotrophic or photomixotrophic conditions (Pei et al., 2017), where 24 chemically unstable key metabolites relative to central and energetic metabolism were selected and analyzed. However, the coverage of metabolites was significantly limiting toward metabolites in the central and energetic metabolism due to the limitation of targeted LC-MS approach. In this study, to further explore the possible functions of RRs in the metabolism regulation of Synechocystis, an untargeted GC-MS based metabolomic analysis was conducted.
To demonstrate the reliability of the GC-MS metabolomic analysis, 3 mutants were randomly selected and cultivated under identical autotrophic condition, along with 3 biological replicates of the wild type. Six technical replicates were thus generated for each of the mutant and wild type samples. In the defined analytical conditions, intracellular metabolites were well-separated on the GC column and ~51–70 metabolites were chemically identified among different samples in the MS analysis, with 51 metabolites detected in all samples, including various organic acids, amino acids and sugars identified in practically all samples. The PCA analysis of the metabolic profiles of these samples showed that the technical replicates of each of the mutants or the wild type were clustered well-together in the plot (Figure 1A), suggesting overall good reproducibility of the GC-MS technology employed in this study. In PCA, component 1 and component 2 accounted for 35.49 and 10.60% of the variation, respectively, also suggesting validity and reliability of the method (Wijit et al., 2017). In addition, three biological replicates of the wild type were also closely grouped together, while those of the mutants were well-separated from the wild type and other mutants, demonstrating that not only reproducibility but also sensitivity of the method are in general good (Aranha et al., 2017). Moreover, to demonstrate the measurement accuracy of the 51 metabolites detected in the samples described above, the relative standard deviation (RSD) of all 51 compounds were calculated for all tested samples. The results showed that, among the metabolites identified, the RSD values of most metabolites, such as pipecolic acid, D-glucose-6-phophate, D-ribose-5-phosphate, and D-erythrose-4-phosphate were extremely low around ~0.5%, suggesting the formation of trimethylsilyl derivative (TMS) of these compounds were very reproducible and stable at room temperature and readily to be detected by GC-MS (Lai and Fiehn, 2018). In contrast, several metabolites were detected with RSD values slightly >2.0%, such as phosphoric acid, porphine, glycerol 1-phosphate, isocitric acid, methyl-D-galactopyranoside, palmitic acid and sucrose, implying that these metabolites were relatively unstable in the formation of TMS, which caused larger degree of measurement variation between replicates on GC-MS analysis. Nevertheless, the GC-MS analysis data showed that the RSD values of most 51 compounds were smaller than 3.0% (Figures 1B–D), which is considered acceptable for analysis of semi-quantitation nature (Courant et al., 2013).
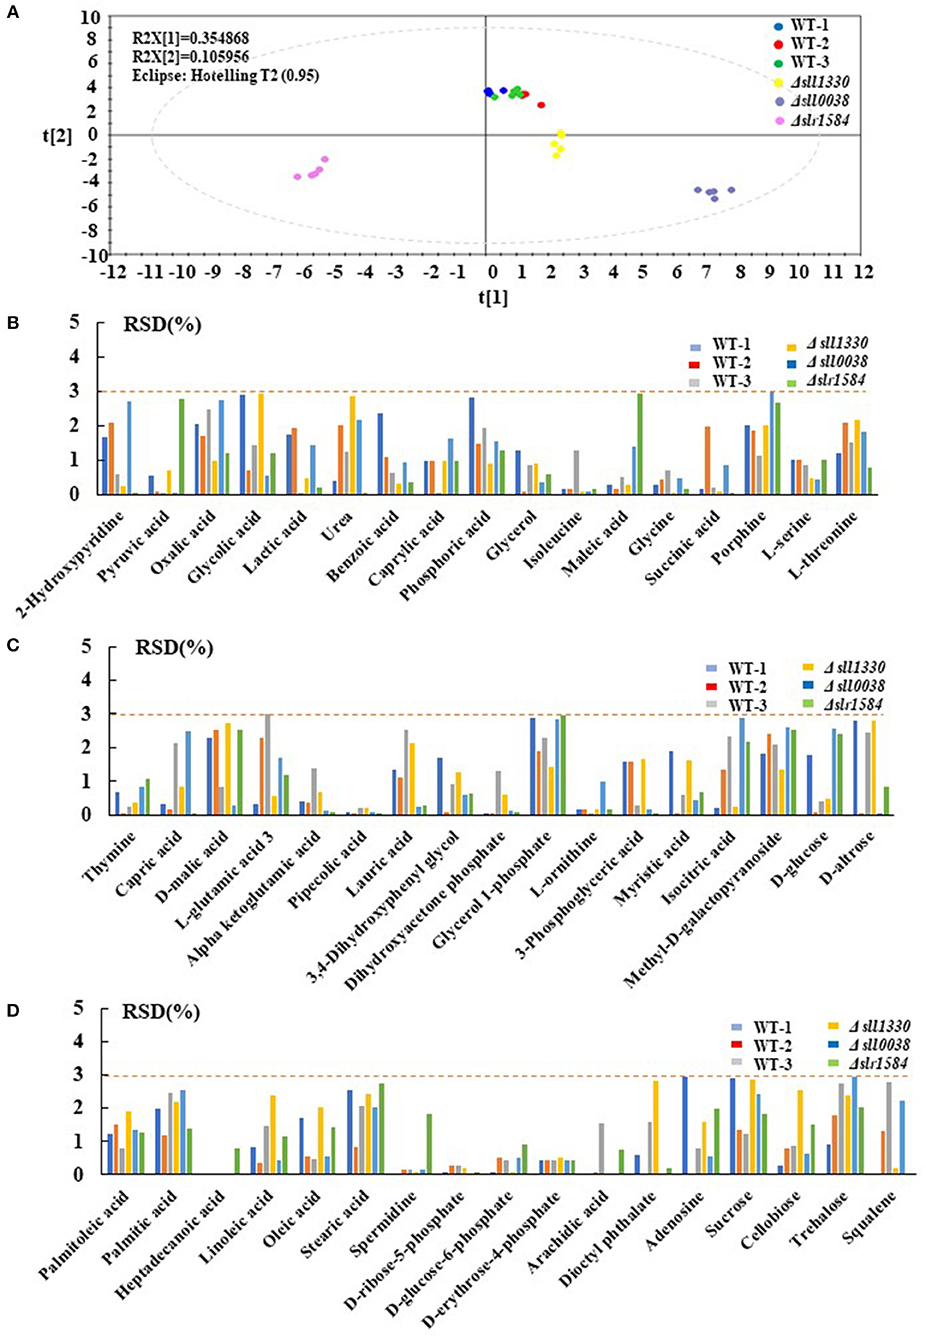
Figure 1. Repeatability analysis three different batches of the wild type and 3 randomly selected mutants. (A) PCA plots of 3 different batches wild type and three randomly selected mutants; different colors represent different samples. (B–D) RSD analysis of different metabolites detected in the wild type and the mutants; different colors represent different samples.
With the reproducibility and sensitivity of technology demonstrated, the efforts were initiated for analysis of all 44 mutants and the wild type. For the experiments, three biological replicates were prepared for each mutants and wild type samples, each with three technical replicates. Due to the large number of sample cultivation required in this comparative analysis of 44 mutants, mutant samples were cultivated, sampled and analyzed in five batches, each with in parallel cultivation of the wild type control to rectify the possible deviation caused by different cultivation batches. As shown in the PCA plot (Figure 2), the big black dots represent all five batches of the wile type samples, which were clustered well after data normalization, suggesting there was no distinct systematic error caused by experimental arrangement and different batches of cultivation. Interestingly, although the three mutants, Δslr0115, Δslr1042, and Δslr1214 showed slightly slow growth patterns under autotrophic condition when compared with the wild type, no dramatic difference of their metabolic profiles from that of the wile type was observed (Figure 2). Meanwhile, the analysis found that seven mutants, namely Δslr1909, Δsll1291, Δslr6040, Δsll1330, Δslr2024, Δslr1584, and Δslr1693, exhibited the most significant changes at the metabolomic level from the wile type, with correlation with the wild type <0.75 (Figure 2), even their growth patterns were almost identical to the wild type (Figure S1), indicating that the knockout of these seven RR genes displayed noteworthy disturbances to the cells at the metabolomic level, suggesting possible regulatory roles of theses RRs in Synechocystis grown under autotrophic condition. It worth mentioning that for the mutants without significant difference observed from the PCA plot, it is still possible that the knockout of these RR-encoding genes could cause variations at metabolic level under different cultivation conditions, which we will explore in the future. In the following analysis of this study, we will focus only on the seven mutants in details.
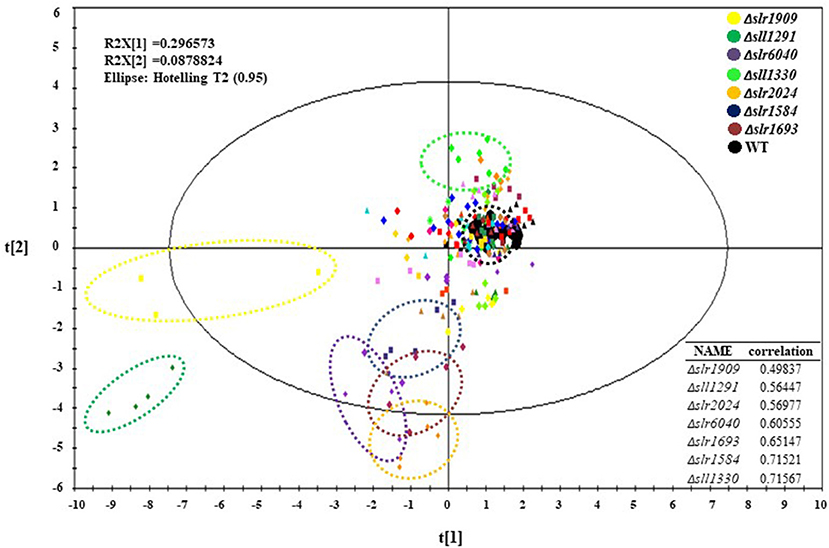
Figure 2. PCA plots of the GC-MS metabolomic profiles at 48 h. Different mutants were represented by different colors.
Integrated Analysis of GC-MS and LC-MS Metabolomic Profiles
As the LC-MS metabolomic profiles were also available for the same 44 mutants under the same autotrophic growth condition, an integrated analysis of GC-MS and LC-MS metabolomic profiles was then conducted. Among all 44 mutant, 30 mutants showed no significant changes in both GC-MS and LC-MS metabolomic profiles, suggesting the gene deletion has no visible effects on the metabolites detected under the autotrophic growth condition. Two mutants, Δslr1584 and Δslr1693, were found with significant metabolite changes in the GC-MS metabolomic profiles, but without significant variation in the LC-MS metabolomic profiles. Meanwhile, 7 mutants, Δsll0797, Δsll0921, Δsll1292, Δslr1042, Δsll1624, Δsll1879, Δslr1588, displaying obvious changes in the LC-MS metabolomic profiles showed no significant variation in the GC-MS metabolomic profiles compared with the wild type. The results also suggested the merits of using both LC-MS and GC-MS analytic platforms for better coverage of possible changes at metabolite level. Five mutants, Δsll1330, Δslr6040, Δslr2024, Δsll1291, and Δslr1909, showed significant changes identified by both the LC-MS and GC-MS analytic platforms, for which we discussed below:
For mutant Δsll1330, five differentially regulated metabolites were detected by GC-MS analysis, and six differentially regulated metabolites were detected by LC-MS analysis (Figure 3A). Among them D-glucose-6-phosphate was detected in both LC-MS and GC-MS analysis, and was consistently found down-regulated in both profiles. The decreasing amount of NADP, ATP, ADP, 3PG, and PEP observed in LC-MS profiles suggested possible reduction of glycolysis metabolism, which may be relevant to the accumulation of pyruvate and the increasing amount in L-isoleucine, threonine, and D-malic acid in cells. For mutant Δslr6040, three differentially regulated metabolites were detected by GC-MS analysis, and eight differentially regulated metabolites were detected by LC-MS analysis (Figure 3B). The decrease of D-malic acid in TCA circle may be relevant to the decreasing of pyruvate, 3PG, FBP in glycolysis. Similarly, differentially regulated metabolites were identified by both analytical platforms for mutant Δslr2024, Similarly, metabolic pathway views of the changes in Δslr2024, Δsll1291, and Δslr1909 were presented in Figures S2–S4, respectively, and available for further analysis.
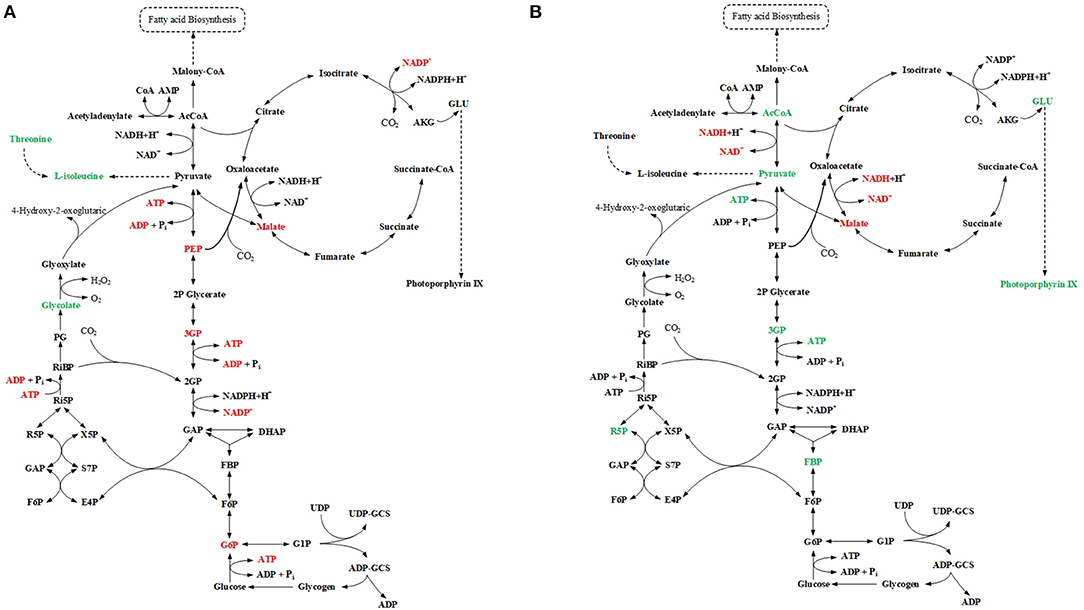
Figure 3. Integrated analysis of GC-MS and LC-MS profiles. (A) Pathway view of metabolite changes in Δsll1330, differential regulated metabolites were represented by color, red for down-regulated and green for up-regulated. (B) Pathway view of metabolite changes in Δslr6040, differential regulated metabolites were represented by color, red for down-regulated and green for up-regulated.
Metabolic Changes in Seven Most Regulated RR Mutants
Previous studies showed that Sll1330 involves regulation of the glycolysis genes in Synechocystis and the knockout mutant of sll1330 grew poorly under light-activated heterotrophic growth conditions and overexpression of sll1330 alters gene expression relevant to the metabolism involved tricarboxylic acid (TCA) cycle and pyruvate metabolism (Tabei et al., 2007; Iijima et al., 2014). In this work, the metabolomic profiling of Δsll1330 showed 17 metabolites were with distinctive variation in comparison with the wild type, among which 13 were up-regulated and 4 down-regulated, respectively (Figure 4, Table S2). Notably, intracellular abundance of isoleucine, L-serine, L-threonine, and glycine was increased up to 4-folds, suggesting possible up-regulation of the branched amino acid pathway, and the increase of threonine and serine may also result in the rise of isoleucine as isoleucine was the degradation product of serine and threonine. Like in plants, serine biosynthesis in cyanobacteria involved light-dependent photo-respiratory and light-independent phosphoserine pathways (Klemke et al., 2015). The concentration of urea was also increased 1.67-folds than that of the wild type, in accordance with the up-regulation of several amino acids such as glycine in cyanobacteria (Esteves-Ferreira et al., 2018; Watzer et al., 2019). Three monosaccharides, including D-glucose involved in glycolysis process, methyl-D-galactopyranoside and D-altrose were also up-regulated by more than 2.65-folds respective to the wild type, in line with the possible function of Sll1330 in glycolysis, which was revealed by a previous study that the knockout of sll1330 could cause the accretion of these monosaccharide (Tabei et al., 2007). Trehalose was increased by 4.40-folds compared with the wild type, its increase is considered to be related to cyanobacterial dehydration tolerance and other stress response (Hershkovitz et al., 1991), suggesting a functional relevance in osmotic tolerance of Sll1330. D-malic involved in TCA cycle was the metabolite increased the most by 7.37-folds than the wild type, suggesting an enhancing activity of the TCA circle, which were consistent with the increased NADPH and decreased phospho(enol)pyruvic acid in Δsll1330, as revealed previously in our LC-MS based analysis (Pei et al., 2017). Four fatty acids were found changed distinctively (e.g. lauric acid, archidic acid, capric acid and linoleic acid), among which the former two were up-regulated nearly 3-folds and the latter two were down-regulated almost 2-folds compared with the wild type. Linoleic acid was unsaturated fatty acid and archidic acid oxidized from unsaturated fatty acid arachidonic acid, which was produced from linoleic acid (Martin et al., 2016). Likewise, lauric acid was produced from capric acid (Sado-Kamdem et al., 2009). D-glucose-6-phosphate involved in both glycolysis and pentose phosphate pathway, was declined nearly 3-folds when compared to the wild type, consistent with our previous analysis using LC-MS which also showed a decreasing of D-glucose-6-phosphate (Pei et al., 2017). Glycolic acid was decreased 6.23-folds than the wild type, which may be due to the possible function of Sll1330 in regulating expression of glycolic acid under light-activated heterotrophic growth conditions (Tabei et al., 2007).
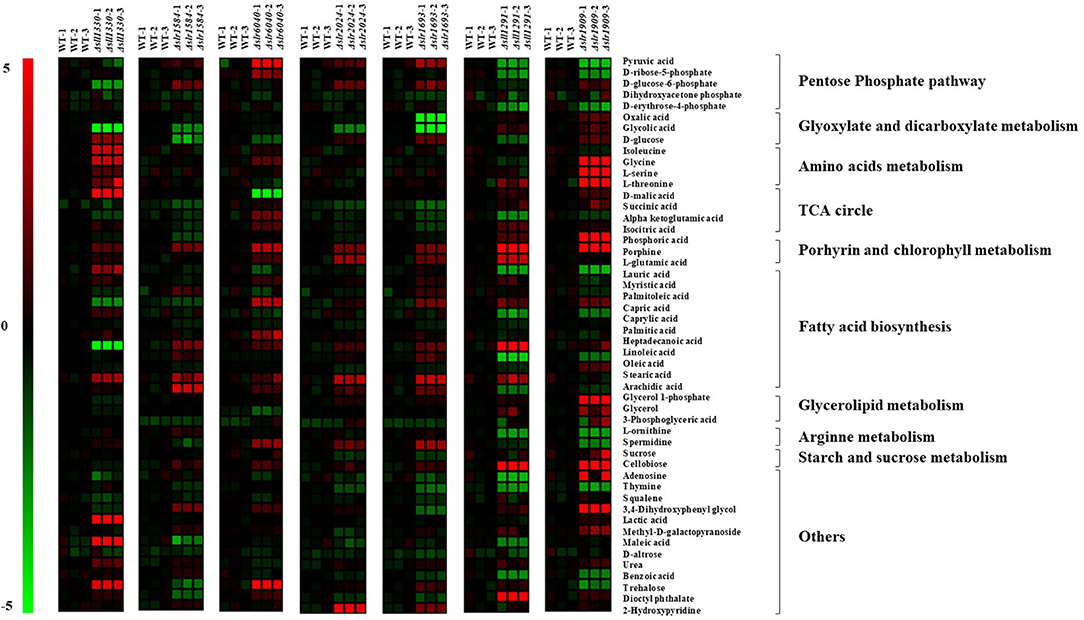
Figure 4. Heat map presentation of the metabolomic changes in 7 most regulated mutants compared with the wild type.
In Δslr1584, there were up to 12 metabolites changed significantly compared with the metabolic profile of the wild type, among which six were up-regulated and six down-regulated, respectively (Figure 4, Table S2). In an early study, the construction and introduction of a gene expression system relevant to green-light regulating from Synechocystis 6803 into the cyanobacteria Synechococcus sp. NKBG 15041c, resulted in that the expression of gfpuv as the reporter gene was successfully increased more than 10-folds under green light illumination; while the missing of either the ccaS (sll1473, sll1474, sll1475) sensor HK genes or the ccaR (slr1584) RR gene can disrupt the vectors containing gfpuv, thus displayed no detectable induction of GFPuv expression, suggesting slr1584 gene encodes a cognate RR with photo-responsive capability regulated by green-light (Hirose et al., 2010; Badary et al., 2015). Our metabolomic analysis showed that glycerol-1-phosphate was the most increased metabolite by 4-folds in Δslr1584, which was involved in glycerolipid metabolism and identified as a component of several O-polysaccharides in E. coli (Shashkov et al., 2016), and its accumulation suggested possible increased polysaccharides. In addition, lactic acid was increased by 2-folds in Δslr1584 mutant, suggesting a possible relevance of sll1584 function in lactate metabolism (Sanchez et al., 1975). D-glucose was the metabolite down-regulated the most by 3.05-folds. Succinic acid involved in TCA circle was also found decreased by 1.53-folds, in consistent with our LC-MS previous result that both α-ketoglutaric acid and oxaloacetic acid of TCA cycle intermediates were declined in Δslr1584 (Pei et al., 2017).
Slr6040 was a plasmid pSYSX-encoded RR in Synechocystis, and a previous study showed that expression of rreP (slr6040) was changed significantly over time in nitrogen-depleted ΔglgC mutant respective to the wild type (Carrieri et al., 2017). In Δslr6040, our metabolomic analysis showed that up to 15 metabolites were significantly regulated in comparison with the that of the wild type, among which 12 were up-regulated and 3 down-regulated (Figure 4, Table S2). With the highest fold increase of 5.13, the accumulation of trehalose indicated a possible relevance to osmotic response of the RR Slr6040. In addition, pyruvic acid was increased by 4.83-folds. In addition, α-ketoglutaric and D-ribose-5-phosphate were indeed increased by 2.16- and 2.58-folds, respectively, also consistent with our previous LC-MS analysis of the same mutant (Pei et al., 2017). D-malic acid was decreased the most by nearly 5-folds, suggesting a possible involvement of slr6040 in regulating TCA cycle (Yin et al., 2015).
Slr2024, a RR belonged to the CheY family, was previously found associated with thylakoid membranes by electroblotting and N-terminal sequencing (Wang et al., 2000) and was potentially involved in the redox signaling linked to the photochemistry, as slr2024 was down-regulated in response to high light (Singh et al., 2008). Compared with the metabolic profile of the wild type, 9 metabolites were found changed significantly in Δslr2024, among which 8 were up-regulated and 1 down-regulated (Figure 4, Table S2). 2-hydroxypyridine is the most increased metabolite by 4.68-folds. In addition, glycolic acid was down-regulated by 2.50-folds, implying possible regulatory roles of slr2024 in glyoxylate and diglyoxylate metabolism (Kisaki and Tolbert, 1969), in consistence with decrease of D-fructose 6-phosphate and D-fructose 1,6-bisphosphate under autotrophic condition but increase under light-activated heterotrophic condition, as revealed in our previous LC-MS analysis of the Δslr2024 mutant (Pei et al., 2017).
Previous studies showed that Slr1694 (PixD) is a blue light receptor with a BLUF (blue light sensors by a flavin chromophore) domain and the protein-protein interaction between PixD and a PatA-like RR PixE (Slr1693) is a requisite to accomplish light signal transduction process of phototaxis in Synechocystis (Tanaka et al., 2012). In Δslr1693, 14 metabolites were found displaying variation in the metabolic profile compared with that of the wild type, among which nine were up-regulated and five down-regulated (Figure 4, Table S2). As the saturated formation of eicosenoic acid (20:1Δ5) (Cahoon et al., 2000), arachidic acid (20:0) was increased the most by 3.76-folds, indicating a relevance of the slr1693 gene in fatty acid synthesis. In addition, sucrose that was increased by 3.07-folds, could work as a compatible solute to cope with salinity fluctuations and maintain the intracellular osmotic balance (Kolman and Salerno, 2016) and its declination indicated a potential response of slr1693 in salt tolerance. Moreover, glycolic acid and oxalic acid were down-regulated by 8.07- and 4.91-folds, respectively, in consistent with the decreased abundance of NADPH and oxaloacetic acid in the Δslr1693 mutant, as revealed in our previous LC-MS analysis of the same mutant (Pei et al., 2017).
A previous study showed that sll1291 gene was expressed at a lower level in the isaR1 (Iron-Stress-Activated small RNA 1) overexpressing strain, suggesting its regulatory roles in iron stress since IsaR1 plays a pivotal role in acclimation to low-iron conditions (Georg et al., 2017). In addition, studies also found that sll1291 was part of a gene cluster involved in regulating chemotaxis (Singh et al., 2010) and circadian rhythm in Synechocystis (Kucho et al., 2005). Moreover, comparative genomics analysis of NtcA predicted that the sll1291 was part of the NtcA regulon (Su et al., 2005), and sugar metabolism was motivated by the control of NtcA during nitrogen depletion thus sll1330 and sll1291 were actually induced by nitrogen depletion (Osanai et al., 2006). In this study, the metabolic profiling of Δsll1291 showed that 22 metabolites were differentially regulated compared with the wild type, among which 8 were up-regulated and 14 down-regulated (Figure 4, Table S2). Porphine was increased the most by 19.78-folds. Additionally, the amount of adenosine was up-regulated by nearly 6-folds, also in consistent with the increased intracellular abundance of ADP-glucose, ATP and ADP in the Δsll1291, as revealed in our previous LC-MS analysis (Pei et al., 2017). Moreover, with linoleic acid increased by 8.40-folds and oleic acid decreased by 3.98-folds, we speculated that sll1291 might be involved in the regulation of the metabolism of linoleic acid. α-ketoglutamic acid was decreased by 2.62-folds in the Δsll1291 mutant, which probably due to the fact that sll1291 was part of the NtcA regulon (Su et al., 2005), and cellular abundance of 2-oxoglutarate was influenced by the nitrogen source (Herrero et al., 2001).
Comparative growth analysis showed that Δslr1909 grew poorly in BG11 medium at pH 6.2–6.5 in comparison with the wild type and further analysis showed that Slr1909 was relevant to the response to acidic environment (Ren et al., 2014). Our metabolomic analysis showed that 24 metabolites were displaying distinct variances in Δslr1909 in comparison with the wild type, among which 15 were up-regulated and 9 down-regulated (Figure 4, Table S2). The metabolite with the highest increased folds was L-serine by more than 15-folds. In the absence of a complete glycolate pathway in cyanobacteria, the synthesis of serine directly from phosphoglycerate (PGA) was therefore necessary to ensure a consistent supply of this amino acid for protein synthesis, which was compatible with the increasing of 3-phosphoglyceric acid (Colman and Norman, 1997). The proliferation of serine indicated a potential connection of slr1909 in the phosphoserine pathways. Additionally, glycine and threonine that are related to serine in the metabolic pathway, were increased by 14.80- and 10.85-folds, respectively. It worth noting that porphine also showed a high increasing fold similar to that we found with Δsll1291, which may worth further investigation whether the two RR genes are functional related. Additionally, pyruvic acid, D-erythrose-4-phosphate and D-ribose-5-phosphate were declined 3.76-, 2.91-, and 2.72-folds, respectively, among which pyruvic is a crucial intermediate in glycolysis and the latter two are key components of oxidative pentose phosphate pathway and Calvin circle, implicating a possible relevance of the Sll1909 in sugar metabolism, which was also in accordance with the increasing amount of ADP-glucose, AMP, D-Glucose 6-phosphate, D-Fructose 6-phosphate, D-Ribose 5-phosphate, and DL-Glyceraldehyde 3-phosphate in the Δslr1909 mutant under photo-mixotrophic condition previously revealed by LC-MS based analysis (Pei et al., 2017).
RT-qPCR Confirmation of the Metabolic Changes
To confirm some of the findings we obtained from the comparative metabolomic analysis between the RR mutants and the wild type, RT-qPCR analysis was employed to determine expression changes of key genes involved in the differentially regulated metabolic pathways in the seven mutants. Toward the goal, differentially regulated metabolites identified by GC-MS analysis were first mapped into the metabolic pathways according to the KEGG analysis to determine the responsive metabolic pathways in each mutant, and then at least three genes were selected from the differentially regulated metabolic pathways and their expression were comparatively determined in the mutants. In total, expression of 27 genes involved in production and consumption of the differentially regulated metabolites were comparatively determined between the mutants and the wild type. As summarized in Table 1, in general good correlation was obtained for a majority of genes where the similar regulation patterns were observed in both metabolomic analysis and RT-qPCR analysis (Figure 5). In addition, we also found that the variations of metabolites were possibly resulted from the co-functioning of genes involved in production and consumption. For example, in Δsll1330, genes slr0009 (rbcL), and slr0012 (rbcS) involved in the production of glycolic acid were down-regulated 1.83- and 3.30-folds, respectively, as well as the gene sll1349 (cbbZp) involved in consumption of glycolic acid was up-regulated 7.23-folds, which together may lead to the decrease of glycolic acid. Meanwhile, the production gene slr1349 (pgi) of D-glucose-6-phosphate was up-regulated for 5.59-folds and the consumption gene slr1843 (zwf) up-regulated for 8.16-folds, respectively, which may lead to the down-regulation of D-glucose-6-phosphate for 2.97-folds in the metabolomics profile. The similar observation also applied to Δslr2024 regarding genes involved in production and consumption of L-glutamic acid. In Δslr1909, pyruvic acid was down-regulated 3.76-folds, which may be resulted from the combined effects of the down-regulated slr0721 (me) and up-regulated sll1721 (pdhB).
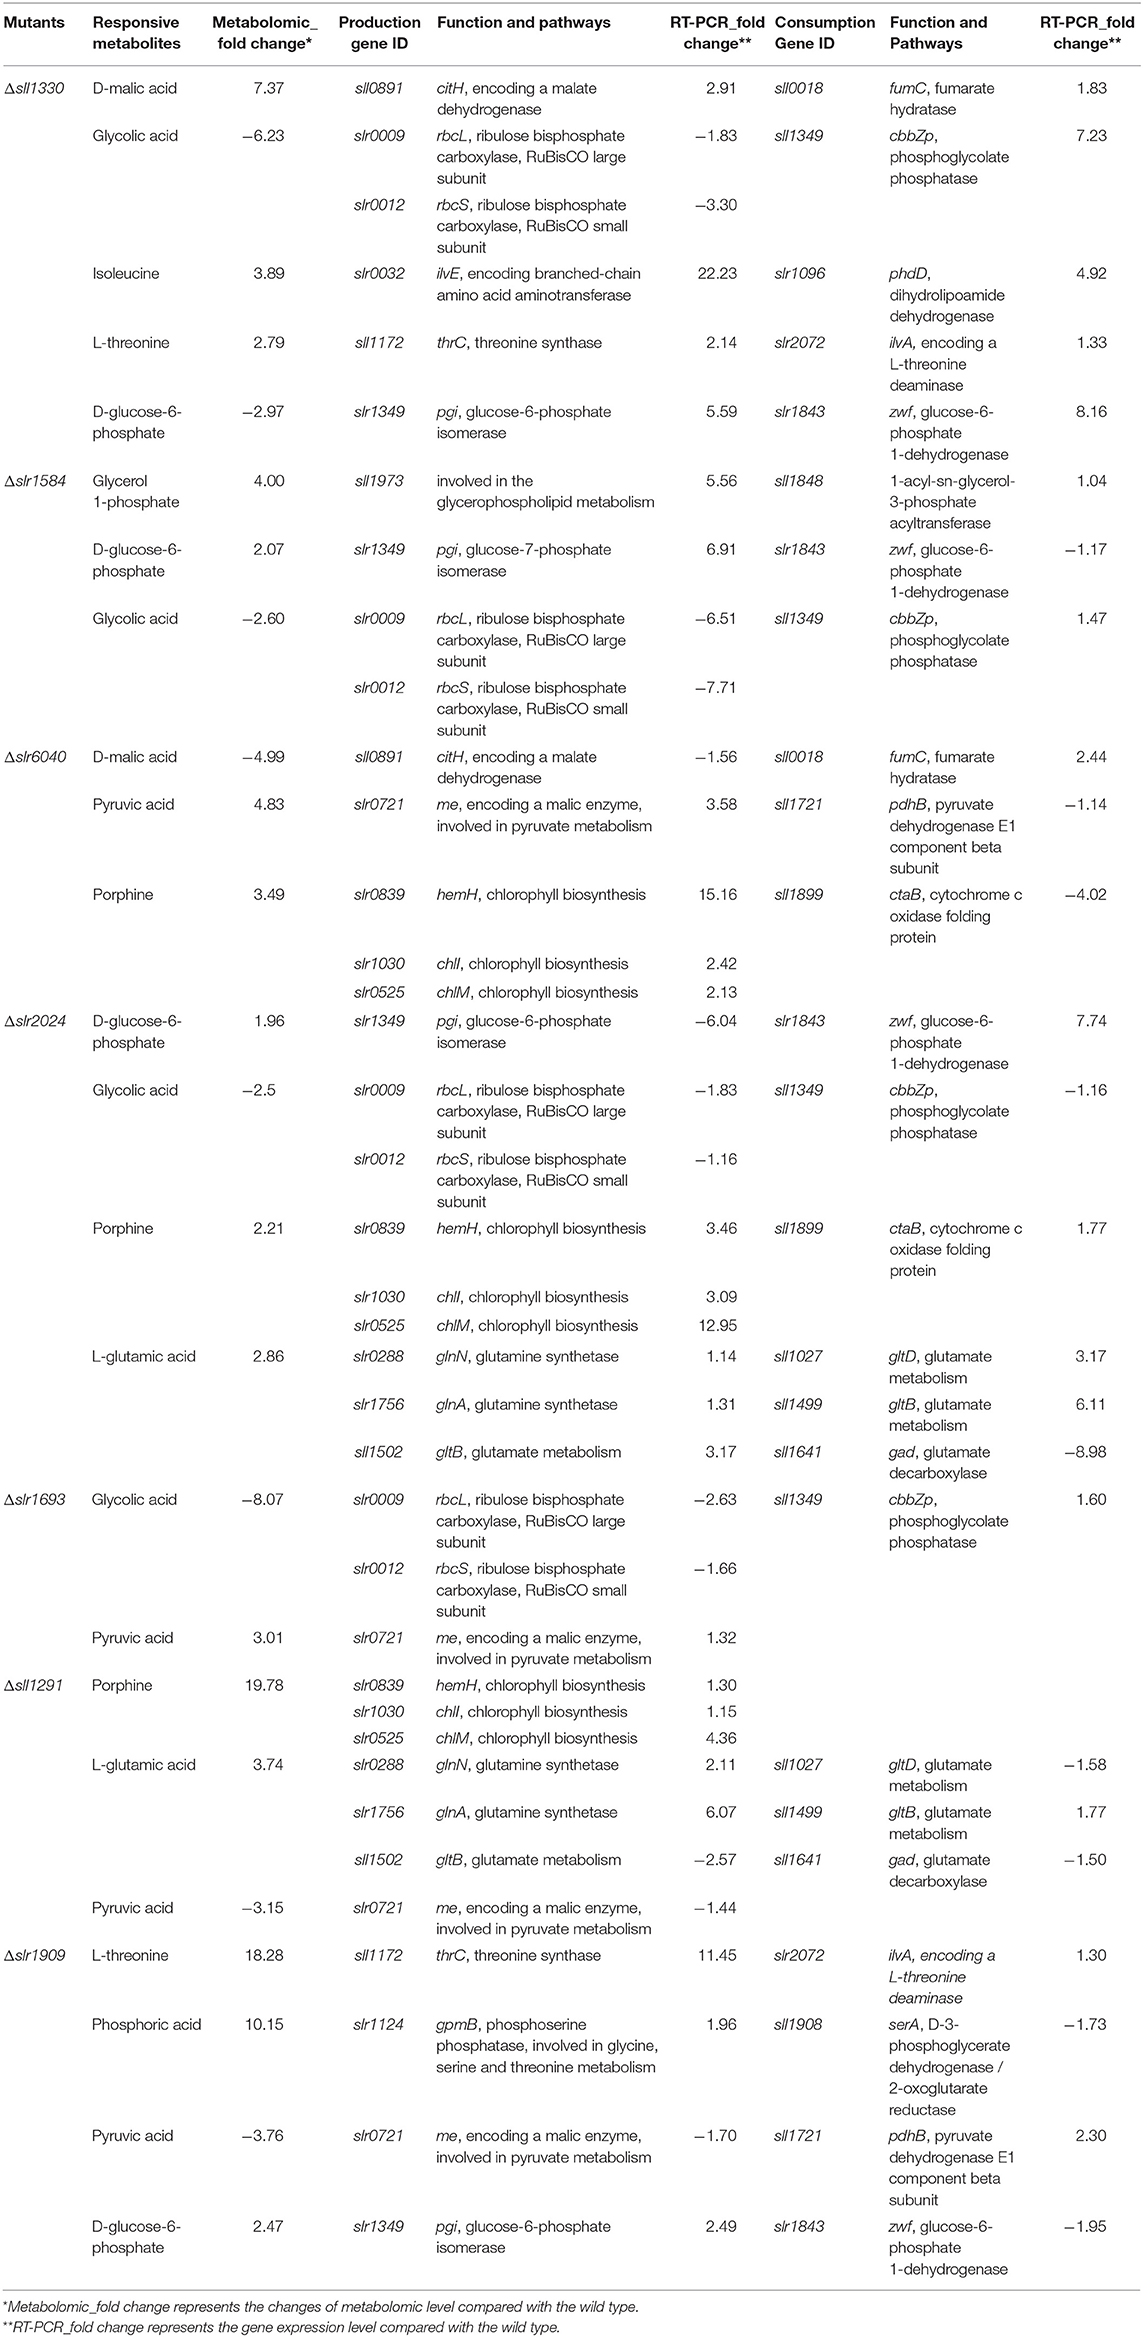
Table 1. RT-qPCR confirmation of the metabolic changes in seven most regulated RR mutants.
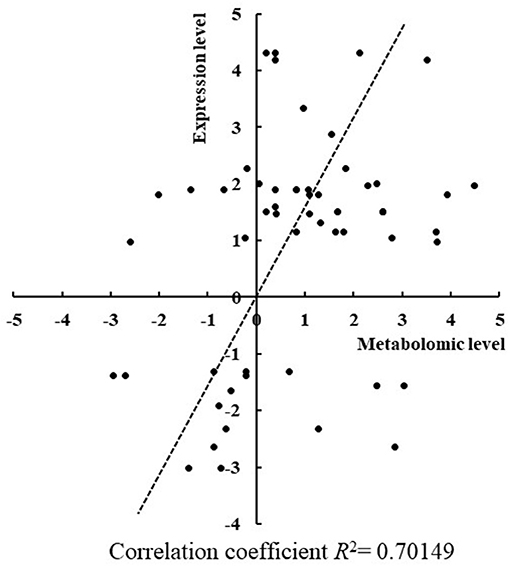
Figure 5. Correlation between changes of gene expression level and metabolomics level in mutants. The changes of gene expression level and metabolomics level showed a good correlation since R2 = 0.70.
Comparative Analysis of Metabolomic and Evolutionary Profiles
Hierarchical clustering analysis of metabolomic profiles was further performed. In addition, a phylogenetic tree based on the conserved receiver domains of the 44 RR genes was also constructed (Figure 6A). A comparison between trees constructed from metabolomic data and evolutionary relationship was then conducted (Figure 6). It was previously reported that most of RRs in Synechocystis can be grouped into a few subfamilies with output domains involved in corresponding regulatory roles, namely OmpR, NarL, CheY, and PatA subfamilies (Mizuno et al., 1996). Consistently, such clustering patterns were also observed in the phylogenetic tree we constructed using the conserved receiver domains of the 44 RR genes (Figure 6A).
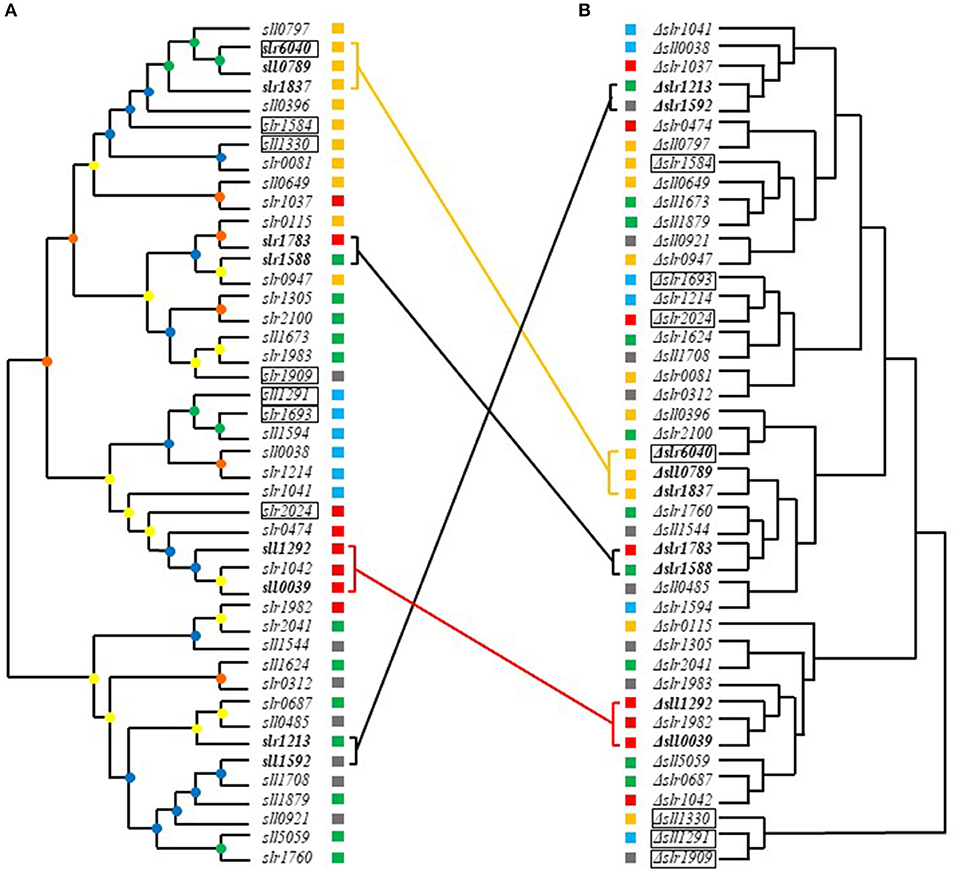
Figure 6. Comparative analysis of metabolomics- and evolution-based trees of RRs. (A) Phylogenetic analysis of RRs based on the receiver domains. Different cube colors beside the gene names and mutants represent different subfamilies: gray for NarL family, yellow for OmpR family, red for CheY family, blue for PatA family and green for others, respectively. (B) Hierarchical clustering analysis based on metabolomic profiles. Different cube colors beside the gene names and mutants represent different subfamilies: gray for NarL family, yellow for OmpR family, red for CheY family, blue for PatA family and green for others, respectively. Four groups of RR genes that shared close relationship in both phylogenetic tree and metabolomics-based tree were marked in bold. Genes clustered in both metabolomics- and evolution-based trees were linked by lines with same colors of their subfamilies. The seven most regulated mutants were marked with black frame. The bootstrap values were represented in different colors of nodes: green for 1,000–750, blue for 750–500, yellow for 500–250, and orange for 250–0.
Comparative metabolomic and evolutionary analysis first allowed identification of four groups of RR genes that not only clustered well in phylogenetic trees but also in metabolomic clustering trees, including slr6040, sll0789, and slr1837, slr1588 and slr1783, sll1292 and sll0039, sll1592 and slr1213, suggesting possible functional conservation of these RRs during evolution (Figure 6).
In group one, slr6040 was found clustered with sll0789 and slr1837 in both metabolomics- and evolution-based trees. All belong to the OmpR subfamily. Slr1837 (ManR) functioning with Slr0640 (ManS), has been previously revealed to regulate manganese homeostasis in Synechocystis (Ogawa et al., 2002). The expression of RR-HK pair Sll0789–Sll0790, which was adjacent to the gene cluster of metal resistance, downstream of ziaA in the Synechocystis genome, were declined in the Δsll0649 mutant under Cd2+ stress (Chen et al., 2014b). While the sll0788 upstream of sll0789 and sll0790, along with slr6039, slr6040, and slr6041 in endogenous plasmids pSYSX in Synechocystis, were both essential for copper resistance (Giner-Lamia et al., 2012). Interesting, our metabolomic analysis showed that D-glucose and heptadecanoic acid were regulated similarly in these 3 knockout mutants Δsll0789, Δslr6040, and Δslr1837, with the D-glucose declined more than 1.5-folds and heptadecanoic acid enhanced more than 1.5-folds, suggesting these three RR genes may function on the similar metabolism in cells.
In group two, the sll1588 gene shared high similarity in both metabolomics- and evolution-based trees with slr1783 of NarL subfamily (Figure 6). Slr1783 (Rre1) has previously been demonstrated to interact with Hik2 using a yeast two-hybrid analysis of cyanobacterial TCSTSs (Sato et al., 2007) and Hik2 was involved in a signaling pathway required in accommodation to light and salinity in cyanobacteria (Ibrahim et al., 2016), while Slr1588 was also shown relevant to salt tolerance in our previous study (Chen et al., 2014a). The metabolites decreased more than 1.5-folds in both of Δslr1588 and Δslr1783 included oxalic acid, phosphoric acid, D-glucose, D-ribose-5-phosphate, D-glucose-6-phosphate, which are related to the glycolytic pathway. Meanwhile, metabolites L-serine, 3-phosphoglyceric acid and heptadecanoic acid were increased more than 1.5-folds in both mutants, suggesting roles of slr1588 and slr1783 in branched amino acids pathway and fatty acids metabolism.
In group three, sll1292 and sll0039 both belong to CheY subfamily. In a previous study, both Slr1982 and Sll0039 were identified as proteins relevant to butanol stress (Tian et al., 2013). The co-overexpression of sll0039 and slr1037 relative to the butanol tolerance of Synechocystis (Gao et al., 2017) improves butanol tolerance nearly by 1.3-folds (Niu et al., 2015). With an early study showed that sll1292 was responsive to the deficiency of inorganic carbon (Wang et al., 2004), Sll1292 was also found down-regulated under 0.8% (v/v) hexane stress (Liu et al., 2012). Metabolites pyruvic acid, glycolic acid, maleic acid, D-malic acid, and linoleic acid were declined nearly 1.5-folds in both mutants of Δsll1292 and Δsll0039, while isocitric acid was increased more than 2-folds, suggesting the possible relevance to the TCA circle in Synechocystis.
In group four, sll1592 and slr1213, with the former belonged to NarL subfamily and the latter with no specific subfamily association also displayed similarity in both metabolomics- and evolution-based trees. The proteins Sll1590 (Hik20) and Sll1592 (Rre19) of Synechocystis are corresponding homologous to KdpD and KdpE of E. coli, respectively, which has been identified as the second TCSTS related to osmotic signals in E. coli (Paithoonrangsarid et al., 2004). slr1213 (uirR) and slr1214 (lsiR) encode a UVA-activated signaling system which was previously found essential in phototaxis (Song et al., 2011). No evidence of their similar function was previously available. In Δsll1592 and Δslr1213, the metabolite L-(+) lactic acid was increased more than 1.5-folds while D-malic acid, D-glucose and D-ribose-5-phosphate were declined more than 1.5-folds, the variations of the latter three metabolites indicated relevant role of the genes to TCA circle, glycolysis, Calvin circle, and pentose phosphate pathway, respectively.
In addition, more than 10 groups of RR genes that were clustered together in the evolution tree were found far away from each other in metabolomics-based tree (Figure 6). For example, the OmpR family genes slr1584 and sll1330 were different in terms of their metabolomic profiles, suggesting clearly different regulatory function and possible function change during the evolution of Synechocystis.
Moreover, six groups of RR genes that were clustered in metabolomics-based tree but well-separated with each other in evolution-based tree, suggesting different evolutionary origin, such as slr1909 and sll1291, slr1214, and slr2024. Although slr1909 and sll1291 belong to different clusters in evolutionary tree (slr1909 belongs to NarL and sll1291 to PatA subfamilies, respectively), metabolomic clustering analysis showed they were well-clustered together (Figure 6B), suggesting either a possible functional convergence during evolution or they were both involved in the same regulatory pathway, which worth further investigation. As a part of the NtcA regulon (Su et al., 2005), Sll1291 was previously found involved in the regulation of response to iron stress (Georg et al., 2017), while a previous study showed that slr1909 was relevant to acid response (Ren et al., 2014). In addition, sll1291 was found to be part of a gene cluster involved in chemotaxis (Singh et al., 2010). Also, as the important element of chlorophyll, porphine was increased more than 10-folds in both Δslr1909 and Δsll1291 mutants, which also suggested a high relevance in phototactic motility of the two genes.
The metabolomic profiling analysis showed that slr2024 of CheY subfamily was clustered with slr1214 of PatA subfamily in the metabolomics clustering tree, but slightly distant from slr1214 in the evolutionary trees. Slr1214 was involved in a UVA-activated signaling system that is required for negative phototaxis (Song et al., 2011), while Slr2024 was found associated with thylakoid membranes (Wang et al., 2000), and down-regulated in responsive to high light (Singh et al., 2008). The common relevance in light response may explain the high functional similarity of slr1214 and slr2024 in metabolomic profiles. Metabolites pyruvic acid and porphine were increased more than 1.5-folds while glycolic acid was decreased more than 1.5-folds in Δslr1214 and Δslr2024.
Conclusion
In this study, a GC-MS based comparative metabolomic analysis was conducted for a library of knockout mutants for 44 RRs in Synechocystis. The metabolomic profiling showed that seven RRs mutants were significantly different at metabolomic level while no distinctive variance in growth was observed under the normal autotrophic growth condition, suggesting diversity of regulation mediated by RRs in Synechocystis. Additionally, an integrative metabolomic and evolutionary analysis of all RR mutants led to the identification of four groups of RR genes which shared close relationship in both phylogenetic and metabolomics-based trees, suggesting possible function conservations of these RRs during the evolutionary process. Meanwhile, six groups of RRs with close evolutionary origin were found with different metabolomic profiles, suggesting possible functional changes during evolution. In contrast, more than 10 groups of RR genes with different clustering patterns in the evolutionary tree were found clustered together in metabolomics-based tree, suggesting possible functional convergences during the evolution. This study provided new insights into the regulation diversity and the evolution of TCSTS in Synechocystis.
Data Availability Statement
All datasets generated for this study are included in the article/Supplementary Material.
Author Contributions
MS conducts experiments and analyzes the data and writes the manuscript. LC analyzes the data and writes the manuscript. WZ designs the experiments and writes the manuscript.
Funding
This research was supported by grants from the National Key Research and Development Program of China (Grant Nos. 2018YFA0903600, 2018YFA0903000, and 2019YFA0904600) and the National Natural Science Fundation of China (Nos. 31770100, 31972931, 91751102, 21621004, 31370115, and 31470217).
Conflict of Interest
The authors declare that the research was conducted in the absence of any commercial or financial relationships that could be construed as a potential conflict of interest.
Supplementary Material
The Supplementary Material for this article can be found online at: https://www.frontiersin.org/articles/10.3389/fmicb.2020.00403/full#supplementary-material
Figure S1. Growth curves for 7 most-regulated mutants compared with the wile type.
Figure S2. Pathway view of metabolite changes in Δslr2024, differential regulated metabolites were represented by color, red for down-regulated and green for up-regulated metabolites.
Figure S3. Pathway view of metabolite changes in Δsll1291, differential regulated metabolites were represented by color, red for down-regulated and green for up-regulated metabolites.
Figure S4. Pathway view of metabolite changes in Δslr1909, differential regulated metabolites were represented by color, red for down-regulated and green for up-regulated metabolites.
Table S1. Primers used for quantitative real-time RT-PCR in this study.
Table S2. GC-MS metabolomics dataset of 44 mutants under autotrophic condition.
Abbreviations
GC-MS, gas chromatography-mass spectrometry; HK, histidine kinase; LC-MS, liquid chromatography-mass spectrometry; PCA, principal component analysis; PGA, phosphoglycerate; RR, receiver response regulator; RSD, relative standard deviation; RT-qPCR, real-time quantitative polymerase chain reaction; TCA, tricarboxylic acid cycle; TCSTSs, Two-component signal transduction systems.
References
Ai, Y., Yang, Y., Qiu, B., and Gao, X. (2014). Unique WSPA protein from terrestrial macroscopic cyanobacteria can confer resistance to osmotic stress in transgenic plants. World J. Microbiol.Biotechnol. 30, 2361–2369. doi: 10.1007/s11274-014-1661-9
Aranha, B. C., Hoffmann, J. F., Barbieri, R. L., Rombaldi, C. V., and Chaves, F. C. (2017). Untargeted metabolomic analysis of Capsicum Spp. By GC-MS. Phytochem. Anal. 28, 439–447. doi: 10.1002/pca.2692
Ashby, M. K., and Houmard, J. (2006). Cyanobacterial two-component proteins: structure, diversity, distribution, and evolution. Microbiol. Mol. Biol. Rev. 70, 472–509. doi: 10.1128/MMBR.00046-05
Badary, A., Abe, K., Ferri, S., Kojima, K., and Sode, K. (2015). The development and characterization of an exogenous green-light-regulated gene expression system in marine cyanobacteria. Mar. Biotechnol. 17, 245–251. doi: 10.1007/s10126-015-9616-1
Cahoon, E. B., Marillia, E. F., Stecca, K. L., Hall, S. E., Taylor, D. C., and Kinney, A. J. (2000). Production of fatty acid components of meadowfoam oil in somatic soybean embryos. Plant Physiol. 124, 243–251. doi: 10.1104/pp.124.1.243
Carrieri, D., Lombardi, T., Paddock, T., Cano, M., A., Goodney, G., et al. (2017). Transcriptome and proteome analysis of nitrogen starvation responses in Synechocystis 6803 ΔglgC, a mutant incapable of glycogen storage. Algae Res. 21, 64–75. doi: 10.1016/j.algal.2016.11.003
Cassier-Chauvat, C., and Chauvat, F. (2014). Responses to oxidative and heavy metal stresses in cyanobacteria: recent advances. Int. J. Mol. Sci.16, 871–886. doi: 10.3390/ijms16010871
Chaves, J. E., and Melis, A. (2018). Biotechnology of cyanobacterial isoprene production. Appl. Microbiol. Biotechnol. 102, 6451–6458 doi: 10.1007/s00253-018-9093-3
Chen, L., Wu, L., Zhu, Y., Song, Z., Wang, J., and Zhang, W. (2014a). An orphan two-component response regulator Slr1588 involves salt tolerance by directly regulating synthesis of compatible solutes in photosynthetic Synechocystis sp. PCC 6803. Mol. Biosys. 10, 1765–1774. doi: 10.1039/c4mb00095a
Chen, L., Zhu, Y., Song, Z., Wang, J., and Zhang, W. (2014b). An orphan response regulator Sll0649 involved in cadmium tolerance and metal homeostasis in photosynthetic Synechocystis sp. PCC 6803. J. Proteomics 103, 87–102. doi: 10.1016/j.jprot.2014.03.029
Colman, B., and Norman, E. G. (1997). Serine synthesis in cyanobacteria by a nonphotorespiratory pathway. Physiol. Plant. 100, 133–136. doi: 10.1111/j.1399-3054.1997.tb03463.x
Courant, F., Martzolff, A., Rabin, G., Antignac, J. P., Le Bizec, B., Giraudeau, P., et al. (2013). How metabolomics can contribute to bio-processes: a proof of concept study for biomarkers discovery in the context of nitrogen-starved microalgae grown in photobioreactors. Metabolomics 9, 1286–1300. doi: 10.1007/s11306-013-0532-y
Englund, E., Pattanaik, B., Ubhayasekera, S. J. K., Stensjö, K., Bergquist, J., and Lindberg, P. (2014). Production of squalene in Synechocystis sp. PCC 6803. PLoS ONE 9:e90270. doi: 10.1371/journal.pone.0090270
Esteves-Ferreira, A. A., Inaba, M., Fort, A., Araújo, W. L., and Sulpice, R. (2018). Nitrogen metabolism in cyanobacteria: metabolic and molecular control, growth consequences and biotechnological applications. Crit. Rev. Microbiol. 44, 541–560. doi: 10.1080/1040841X.2018.1446902
Gao, X., Sun, T., Wu, L., Chen, L., and Zhang, W. (2017). Co-overexpression of response regulator genes slr1037 and sll0039 improves tolerance of Synechocystis sp. PCC 6803 to 1-butanol. Bioresour. Technol. 245, 1476–1483. doi: 10.1016/j.biortech.2017.04.112
Georg, J., Kostova, G., Vuorijoki, L., Schön, V., Kadowaki, T., Huokko, T., et al. (2017). Acclimation of oxygenic photosynthesis to iron starvation is controlled by the sRNA IsaR1. Curr. Biol. 27, 1425–1436.e7. doi: 10.1016/j.cub.2017.04.010
Giner-Lamia, J., López-Maury, L., Reyes, J. C., and Florencio, F. J. (2012). The CopRS two-component system is responsible for resistance to copper in the cyanobacterium Synechocystis sp. PCC 6803. Plant Physiol. 159, 1806–1818. doi: 10.1104/pp.112.200659
Herrero, A., Muro-Pastor, A. M., and Flores, E. (2001). Nitrogen control in cyanobacteria. J. Bacteriol. 183, 411–425. doi: 10.1128/jb.183.2.411-425.2001
Hershkovitz, N., Oren, A., and Cohen, Y. (1991). Accumulation of trehalose and sucrose in cyanobacteria exposed to matric water stress. Appl. Environ. Microbiol. 57, 645–648. doi: 10.1128/AEM.57.3.645-648.1991
Hirani, T. A., Suzuki, I., Murata, N., Hayashi, H., and Eaton-Rye, J. J. (2001). Characterization of a two-component signal transduction system involved in the induction of alkaline phosphatase under phosphate-limiting conditions in Synechocystis sp. PCC 6803. Plant Mol Biol. 45, 133–144. doi: 10.1023/a:1006425214168
Hirose, Y., Narikawa, R., Katayama, M., and Ikeuchi, M. (2010). Cyanobacteriochrome CcaS regulates phycoerythrin accumulation in Nostoc punctiforme, a group II chromatic adapter. Proc. Natl. Acad. Sci. U.S.A. 107, 8854–8859. doi: 10.1073/pnas.1000177107
Howe, E., Holton, K., Nair, S., Schlauch, D., Sinha, R., and Quackenbush, J. (2010). “MeV: MultiExperiment viewer” in Biomedical Informatics for Cancer Research, eds M. F. Ochs, J. T. Casagrande, and R. V. Davuluri (Boston, MA: Springer US), 267–277. doi: 10.1007/978-1-4419-5714-6_15
Ibrahim, I. M., Puthiyaveetil, S., and Allen, J. F. (2016). A two-component regulatory system in transcriptional control of photosystem stoichiometry: redox-dependent and sodium ion-dependent phosphoryl transfer from cyanobacterial histidine kinase Hik2 to response regulators Rre1 and RppA. Front. Plant Sci. 7:137. doi: 10.3389/fpls.2016.00137
Iijima, H., Shirai, T., Okamoto, M., Kondo, A., Hirai, M. Y., and Osanai, T. (2015). Changes in primary metabolism under light and dark conditions in response to overproduction of a response regulator RpaA in the unicellular cyanobacterium Synechocystis sp. PCC 6803. Front Microbiol. 6:888 doi: 10.3389/fmicb.2015.00888
Iijima, H., Watanabe, A., Takanobu, J., Hirai, M. Y., and Osanai, T. (2014). Rre37 overexpression alters gene expression related to the tricarboxylic acid cycle and pyruvate metabolism in Synechocystis sp. PCC 6803. Sci. World J. 2014:921976. doi: 10.1155/2014/921976
Kaneko, T., Sata, S., Kotani, H., Tanaka, A., Asamizu, E., Nakamura, Y., et al. (1996). Sequence analysis of the genome of the unicellular cyanobacterium Synechocystis sp. strain PCC6803. II. Sequence determination of the entire genome and assignment of potential protein-coding regions. DNA Res. 3, 109–136. doi: 10.1093/dnares/3.3.109
Kappell, A. D., and Van Waasbergen, L. G. (2007). The response regulator RpaB binds the high light regulatory 1 sequence upstream of the high-light-inducible hliB gene from the cyanobacterium Synechocystis PCC 6803. Arch. Microbiol. 187, 337–342. doi: 10.1007/s00203-007-0213-1
Kisaki, T., and Tolbert, N. E. (1969). Glycolate and glyoxylate metabolism by isolated peroxisomes or chloroplasts. Plant Physiol. 44, 242–250 doi: 10.1104/pp.44.2.242
Klemke, F., Baier, A., Knoop, H., Kern, R., Jablonsky, J., Beyer, G., et al. (2015). Identification of the light-independent phosphoserine pathway as an additional source of serine in the cyanobacterium Synechocystis sp. PCC 6803. Microbiology 161, 1050–1060. doi: 10.1099/mic.0.000055
Kolman, M. A., and Salerno, G. L. (2016). Sucrose in bloom-forming cyanobacteria: loss and gain of genes involved in its biosynthesis. Environ. Microbiol. 18, 439–449. doi: 10.1111/1462-2920.13071
Kucho, K., Okamoto, K., Tsuchiya, Y., Nomura, S., Nango, M., Kanehisa, M., et al. (2005). Global analysis of circadian expression in the cyanobacterium Synechocystis sp. strain PCC 6803. J. Bacteriol. 187, 2190–2199. doi: 10.1128/JB.187.6.2190-2199.2005
Kumar, S., Stecher, G., Li, M., Knyaz, C., and Tamura, K. (2018). MEGA X: molecular evolutionary genetics analysis across computing platforms. Mol. Biol. Evol. 35, 1547–1549. doi: 10.1093/molbev/msy096
Lai, Z., and Fiehn, O. (2018). Mass spectral fragmentation of trimethylsilylated small molecules. Mass Spectrom. Rev. 37, 245–257. doi: 10.1002/mas.21518
Laiakis, E. C., Morris, G. A., Fornace A. J. Jr, and Howie, S. R. (2010). Metabolomic analysis in severe childhood pneumonia in the Gambia, West Africa: findings from a pilot study. PLoS ONE 5:9. doi: 10.1371/journal.pone.0012655
Lan, E. I., and Liao, J. C. (2011). Metabolic engineering of cyanobacteria for 1-butanol production from carbon dioxide. Metab. Eng. 13, 353–363. doi: 10.1016/j.ymben.2011.04.004
Laub, M. T., Biondi, E. G., and Skerker, J. M. (2007). Phosphotransfer profiling: systematic mapping of two-component signal transduction pathways and phosphorelays. Meth. Enzymol. 423, 531–548. doi: 10.1016/S0076-6879(07)23026-5
Letunic, I., and Bork, P. (2017). 20 years of the SMART protein domain annotation resource. Nucleic Acids Res. 46, D493–D496. doi: 10.1093/nar/gkx922
Li, H., and Sherman, L. A. (2000). A redox-responsive regulator of photosynthesis gene expression in the cyanobacterium Synechocystis sp. Strain PCC 6803. J. Bacteriol. 182, 4268–4277. doi: 10.1128/jb.182.15.4268-4277.2000
Liu, J., Chen, L., Wang, J., Qiao, J., and Zhang, W. (2012). Proteomic analysis reveals resistance mechanism against biofuel hexane in Synechocystis sp. PCC 6803. Biotechnol. Biofuels 5:68. doi: 10.1186/1754-6834-5-68
Liu, X., Sheng, J., and Curtiss, R. III. (2011). Fatty acid production in genetically modified cyanobacteria. Proc. Natl. Acad. Sci. U.S.A. 108, 6899–6904. doi: 10.1073/pnas.1103014108
Livak, K. J., and Schmittgen, T. D. (2001). Analysis of relative gene expression data using real-time quantitative PCR and the 2(-Delta Delta C(T)) Method. Methods 25, 402–408. doi: 10.1006/meth.2001.1262
Martin, S. A., Brash, A. R., and Murphy, R. C. (2016). The discovery and early structural studies of arachidonic acid. J. Lipid Res. 57, 1126–1132. doi: 10.1194/jlr.R068072
Mizuno, T., Kaneko, T., and Tabata, S. (1996). Compilation of all genes encoding bacterial two-component signal transducers in the genome of the cyanobacterium, Synechocystis sp. strain PCC 6803. DNA Res. 3, 407–414. doi: 10.1093/dnares/3.6.407
Muramatsu, M., and Hihara, Y. (2012). Acclimation to high-light conditions in cyanobacteria: from gene expression to physiological responses. J. Plant Res. 125, 11–39. doi: 10.1007/s10265-011-0454-6
Murata, N., and Suzuki, I. (2006). Exploitation of genomic sequences in a systematic analysis to access how cyanobacteria sense environmental stress. J. Exp. Bot. 57, 235–247. doi: 10.1093/jxb/erj005
Niu, X., Zhu, Y., Pei, G., Wu, L., Chen, L., and Zhang, W. (2015). Elucidating butanol tolerance mediated by a response regulator Sll0039 in Synechocystis sp. PCC 6803 using a metabolomic approach. Appl. Microbiol. Biotechnol. 99, 1845–1857. doi: 10.1007/s00253-015-6374-y
Ogawa, T., Bao, D. H., Katoh, H., Shibata, M., Pakrasi, H. B., and Bhattacharyya-Pakrasi, M. (2002). A two-component signal transduction pathway regulates manganese homeostasis in Synechocystis 6803, a photosynthetic organism. J. Biol. Chem. 277, 28981–28986. doi: 10.1074/jbc.M204175200
Oliver, J. W., Machado, I. M., Yoneda, H., and Atsumi, S. (2013). Cyanobacterial conversion of carbon dioxide to 2,3-butanediol. Proc. Natl. Acad. Sci. U.S.A. 110, 1249–1254. doi: 10.1073/pnas.1213024110
Osanai, T., Imamura, S., Asayama, M., Shirai, M., Suzuki, I., Murata, N., et al. (2006). Nitrogen induction of sugar catabolic gene expression in Synechocystis sp. PCC 6803. DNA Res. 13, 185–195. doi: 10.1093/dnares/dsl010
Pade, N., and Hagemann, M. (2015). Salt acclimation of cyanobacteria and their application in biotechnology. Life 5, 25–49. doi: 10.3390/life5010025
Paithoonrangsarid, K., Shoumskaya, M. A., Kanesaki, Y., Satoh, S., Tabata, S., Los, D. A., et al. (2004). Five histidine kinases perceive osmotic stress and regulate distinct sets of genes in Synechocystis. J. Biol. Chem. 279, 53078–53086. doi: 10.1074/jbc.M410162200
Pei, G., Niu, X., Zhou, Y., Chen, L., and Zhang, W. (2017). Crosstalk of two-component signal transduction systems in regulating central carbohydrate and energy metabolism during autotrophic and photomixotrophic growth of Synechocystis sp. PCC 6803. Integr. Biol. 9, 485–496. doi: 10.1039/c7ib00049a
Rajaram, H., Chaurasia, A. K., and Apte, S. K. (2014). Cyanobacterial heat-shock response: role and regulation of molecular chaperones. Microbiology 160, 647–658. doi: 10.1099/mic.0.073478-0
Ren, Q., Shi, M., Chen, L., Wang, J., and Zhang, W. (2014). Integrated proteomic and metabolomic characterization of a novel two-component response regulator Slr1909 involved in acid tolerance in Synechocystis sp. PCC 6803. J. Proteomics 109, 76–89. doi: 10.1016/j.jprot.2014.06.021
Sado-Kamdem, S. L., Vannini, L., and Guerzoni, M. E. (2009). Effect of alpha-linolenic, capric and lauric acid on the fatty acid biosynthesis in Staphylococcus aureus. Int. J. Food Microbiol. 129, 288–294. doi: 10.1016/j.ijfoodmicro.2008.12.010
Sanchez, J. J., Palleroni, N. J., and Doudoroff, M. (1975). Lactate dehydrogenases in cyanobacteria. Arch. Microbiol. 104, 57–65. doi: 10.1007/bf00447300
Sato, S., Shimoda, Y., Muraki, A., Kohara, M., Nakamura, Y., and Tabata, S. (2007). A large-scale protein protein interaction analysis in Synechocystis sp. PCC 6803. DNA Res. 14, 207–216. doi: 10.1093/dnares/dsm021
Schwarz, R., and Forchhammer, K. (2005). Acclimation of unicellular cyanobacteria to macronutrient deficiency: emergence of a complex network of cellular responses. Microbiology 151, 2503–2514. doi: 10.1099/mic.0.27883-0
Seino, Y., Takahashi, T., and Hihara, Y. (2009). The response regulator RpaB binds to the upstream element of photosystem I genes to work for positive regulation under low-light conditions in Synechocystis sp. Strain PCC 6803. J. Bacteriol. 191, 1581–1586. doi: 10.1128/JB.01588-08
Shashkov, A. S., Yang, B., Senchenkova, S. N., Perepelov, A. V., Liu, B., and Knirel, Y. A. (2016). Structures and genetics of biosynthesis of glycerol 1-phosphate-containing O-polysaccharides of Escherichia coli O28ab, O37, and O100. Carbohydr. Res. 426, 26–32. doi: 10.1016/j.carres.2016.03.011
Shestakov, S. V., and Khyen, N. T. (1970). Evidence for genetic transformation in the blue-green alga anacystis nidulans. Mol. Gen. Genet. 107, 372–375. doi: 10.1007/bf00441199
Shoumskaya, M. A., Paithoonrangsarid, K., Kanesaki, Y., Los, D. A., Zinchenko, V. V., Tanticharoen, M., et al. (2005). Identical Hik-Rre systems are involved in perception and transduction of salt signals and hyperosmotic signals but regulate the expression of individual genes to different extents in Synechocystis. J. Biol. Chem. 280, 21531–21538. doi: 10.1074/jbc.M412174200
Sinetova, M. A., and Los, D. A. (2016). New insights in cyanobacterial cold stress responses: Genes, sensors, and molecular triggers. Biochim. Biophys. Acta 1860, 2391–2403. doi: 10.1016/j.bbagen.2016.07.006
Singh, A., Tyagi, M. B., and Kumar, A. (2017). Cyanobacteria growing on tree barks possess high amount of sunscreen compound mycosporine-like amino acids (MAAs). Plant Physiol. Biochem. 119, 110–120. doi: 10.1016/j.plaphy.2017.08.020
Singh, A. K., Elvitigala, T., Bhattacharyya-Pakrasi, M., Aurora, R., Ghosh, B., and Pakrasi, H. B. (2008). Integration of carbon and nitrogen metabolism with energy production is crucial to light acclimation in the cyanobacterium Synechocystis. Plant Physiol. 148, 467–478. doi: 10.1104/pp.108.123489
Singh, A. K., Elvitigala, T., Cameron, J. C., Ghosh, B. K., Bhattacharyya-Pakrasi, M., and Pakrasi, H. B. (2010). Integrative analysis of large scale expression profiles reveals core transcriptional response and coordination between multiple cellular processes in a cyanobacterium. BMC Syst. Biol. 4:105. doi: 10.1186/1752-0509-4-105
Song, J. Y., Cho, H. S., Cho, J. I., Jeon, J. S., Lagarias, J. C., and Park, Y. I. (2011). Near-UV cyanobacteriochrome signaling system elicits negative phototaxis in the cyanobacterium Synechocystis sp. PCC 6803. Proc. Natl. Acad. Sci. U.S.A. 108, 10780–10785. doi: 10.1073/pnas.1104242108
Su, Z., Olman, V., Mao, F., and Xu, Y. (2005). Comparative genomics analysis of NtcA regulons in cyanobacteria: regulation of nitrogen assimilation and its coupling to photosynthesis. Nucleic Acids Res. 33, 5156–5171. doi: 10.1093/nar/gki817
Sun, T., Chen, L., and Zhang, W. (2017a). Quantitative proteomics reveals potential crosstalk between a small RNA CoaR and a two-component regulator Slr1037 in Synechocystis sp. PCC6803. J. Proteome Res. 16, 2954–2963. doi: 10.1021/acs.jproteome.7b00243
Sun, T., Pei, G., Wang, J., Chen, L., and Zhang, W. (2017b). A novel small RNA CoaR regulates coenzyme A biosynthesis and tolerance of Synechocystis sp. PCC6803 to 1-butanol possibly via promoter-directed transcriptional silencing. Biotechnol. Biofuels 10:42. doi: 10.1186/s13068-017-0727-y
Tabei, Y., Okada, K., and Tsuzuki, M. (2007). Sll1330 controls the expression of glycolytic genes in Synechocystis sp. PCC 6803. Biochem. Biophys. Res. Commun. 355, 1045–1050. doi: 10.1016/j.bbrc.2007.02.065
Tanaka, K., Nakasone, Y., Okajima, K., Ikeuchi, M., Tokutomi, S., and Terazima, M. (2012). Time-resolved tracking of interprotein signal transduction: Synechocystis PixD-PixE complex as a sensor of light intensity. J. Am. Chem. Soc. 134, 8336–8339. doi: 10.1021/ja301540r
Tian, X., Chen, L., Wang, J., Qiao, J., and Zhang, W. (2013). Quantitative proteomics reveals dynamic responses of Synechocystis sp. PCC 6803 to next-generation biofuel butanol. J. Proteomics 78, 326–345. doi: 10.1016/j.jprot.2012.10.002
Wang, H. L., Postier, B. L., and Burnap, R. L. (2004). Alterations in global patterns of gene expression in Synechocystis sp. PCC 6803 in response to inorganic carbon limitation and the inactivation of ndhR, a LysR family regulator. J. Biol. Chem. 279, 5739–5751. doi: 10.1074/jbc.M311336200
Wang, Y., Sun, J., and Chitnis, P. R. (2000). Proteomic study of the peripheral proteins from thylakoid membranes of the cyanobacterium Synechocystis sp. PCC 6803. Electrophoresis 21, 1746-1754. doi: 10.1002/(SICI)1522-2683(20000501)21:9<1746::AID-ELPS1746>3.0.CO;2-O
Wang, Y., Sun, T., Gao, X., Shi, M., Wu, L., Chen, L., et al. (2016). Biosynthesis of platform chemical 3-hydroxypropionic acid (3-HP) directly from CO2 in cyanobacterium Synechocystis sp. PCC 6803. Metab. Eng. 34, 60–70. doi: 10.1016/j.ymben.2015.10.008
Watzer, B., Spät, P., Neumann, N., Koch, M., Sobotka, R., Macek, B., et al. (2019). The signal transduction protein PII controls ammonium, nitrate and urea uptake in cyanobacteria. Front. Microbiol. 10:1428. doi: 10.3389/fmicb.2019.01428
Wijit, N., Prasitwattanaseree, S., Mahatheeranont, S., Wolschann, P., Jiranusornkul, S., and Nimmanpipug, P. (2017). Estimation of retention time in GC/MS of volatile metabolites in fragrant rice using principle components of molecular descriptors. Anal. Sci. 33, 1211–1217. doi: 10.2116/analsci.33.1211
Yin, X., Li, J., Shin, H. D., Du, G., Liu, L., and Chen, J. (2015). Metabolic engineering in the biotechnological production of organic acids in the tricarboxylic acid cycle of microorganisms: advances and prospects. Biotechnol. Adv. 33, 830–841. doi: 10.1016/j.biotechadv.2015.04.006
Yu, Z., Zhu, H., Zheng, G., Jiang, W., and Lu, Y. (2014). A genome-wide transcriptomic analysis reveals diverse roles of the two-component system DraR-K in the physiological and morphological differentiation of Streptomyces coelicolor. Appl. Microbiol. Biotechnol. 98, 9351–9363. doi: 10.1007/s00253-014-6102-z
Keywords: Synechocystis, GC-MS, metabolomics, two-component signal transduction systems, response regulators
Citation: Shi M, Chen L and Zhang W (2020) Regulatory Diversity and Functional Analysis of Two-Component Systems in Cyanobacterium Synechocystis sp. PCC 6803 by GC-MS Based Metabolomics. Front. Microbiol. 11:403. doi: 10.3389/fmicb.2020.00403
Received: 03 September 2019; Accepted: 26 February 2020;
Published: 17 March 2020.
Edited by:
Hua Xiang, Institute of Microbiology (CAS), ChinaReviewed by:
Yukako Hihara, Saitama University, JapanQiang Wang, Institute of Hydrobiology (CAS), China
Copyright © 2020 Shi, Chen and Zhang. This is an open-access article distributed under the terms of the Creative Commons Attribution License (CC BY). The use, distribution or reproduction in other forums is permitted, provided the original author(s) and the copyright owner(s) are credited and that the original publication in this journal is cited, in accordance with accepted academic practice. No use, distribution or reproduction is permitted which does not comply with these terms.
*Correspondence: Weiwen Zhang, d3d6aGFuZzhAdGp1LmVkdS5jbg==