 Tamaha Yamaguchi1,2*
 Mitsuhide Sato2,3
 Fuminori Hashihama4Haruka Kato4Takanori Sugiyama4
 Hiroshi Ogawa5Kazutaka Takahashi2Ken Furuya2,6
- 1Fisheries Resources Institute, Japan Fisheries Research and Education Agency, Yokohama, Japan
- 2Department of Aquatic Bioscience, Graduate School of Agricultural and Life Sciences, The University of Tokyo, Tokyo, Japan
- 3Graduate School of Fisheries and Environmental Sciences, Nagasaki University, Nagasaki, Japan
- 4Department of Ocean Sciences, Tokyo University of Marine Science and Technology, Tokyo, Japan
- 5Atmosphere and Ocean Research Institute, The University of Tokyo, Chiba, Japan
- 6Graduate School of Science and Engineering, Soka University, Tokyo, Japan
The labile fraction of dissolved organic phosphorus (DOP) – predominantly consisting of phosphoric esters – is an important microbial P source in the subtropical oligotrophic ocean. However, unlike phosphate, knowledge for labile DOP is still limited due to the scarcity of broad and intensive observations. In this study, we examined the concentrations and size-fractionated hydrolysis rates of labile phosphoric monoesters and diesters along a >10,000 km longitudinal transect in the North Pacific (23°N; upper 200-m layer). Depth-integrated monoesters decreased westward with a maximum difference of fivefold. Vertical profiles of monoesters in the eastern and western basins showed decreasing and increasing trends with depth, respectively. The monoester-depleted shallow layer of the western basin was associated with phosphate depletion and monoesterase activity was predominant in the large size fraction (>0.8 μm), suggesting that monoesters are significant P sources particularly for large microbes. In contrast, diester concentrations were generally lower than monoester concentrations and showed no obvious horizontal or vertical variation in the study area. Despite the unclear distribution pattern of diesters, diesterase activity in the particulate fraction (>0.2 μm) increased in the phosphate-depleted shallow layer of the western basin, suggesting that the targeted diesters in the assay were also important microbial P sources. Diesterase activities in the dissolved fraction (<0.2 μm) were not correlated with ambient phosphate concentrations; however, cell-free diesterase likely played a key role in P cycling, as dissolved diesterase activities were substantially higher than those in the particulate fraction. The horizontal and vertical variability of labile monoesters in the subtropical North Pacific were therefore predominantly regulated by P stress in particularly large microbes, whereas the distributions of labile diesters and diesterase activities were generally independent of microbial P stress, indicating a more complex regulation of diesters to that of monoesters.
Introduction
Dissolved organic phosphorus (DOP) comprises a significant portion of dissolved phosphorus (P) in the surface layer of the subtropical ocean (Paytan and McLaughlin, 2007; Karl and Björkman, 2015). Since phosphate is scarce at nanomolar levels therein (Wu et al., 2000; Hashihama et al., 2009), DOP plays an important role as an alternative P source for microbes. DOP is predominantly mediated by microbes – mainly phytoplankton – in the surface layer through processes such as cell excretion, exudation, and release from damaged cells (Kuenzler, 1970; Orrett and Karl, 1987; Young and Ingall, 2010). Thus, DOP comprises various organic P compounds involved in living organisms, including phospholipids, nucleic acids, and sugar phosphates (Karl and Björkman, 2015). Based on their chemical structures, DOP compounds are typically grouped into phosphoric esters and phosphonates and phosphoric esters contribute the highest proportion (80–85%) to the total DOP pool in various oceanic regions (Young and Ingall, 2010).
In general, microbes express alkaline phosphatases and hydrolyze phosphoric esters under P limitation to meet their cellular P demands (Kuenzler and Perras, 1965; Yentsch et al., 1972). Compiled field studies have also demonstrated a distinct elevation of monoesterase activity (MEA) under low phosphate conditions in both the Atlantic and Pacific Oceans (Mahaffey et al., 2014 and references therein). Based on these findings, the labile fraction of phosphoric monoesters has been considered as an important P source for microbes, and studies have increasingly reported the distribution of monoesters in the oligotrophic ocean (Moutin et al., 2008; Duhamel et al., 2010; Suzumura et al., 2012; Hashihama et al., 2013, 2019; Sato et al., 2013; Vidal et al., 2018; Yamaguchi et al., 2019). Although the examined oceanic regions and depths are still limited, monoester concentrations are mostly below or around the detection limit in the upper 100-m layer and contribute a small proportion of the total DOP pool.
However, the application of highly sensitive colorimetry identified significant regional variability in the vertical profiles of nanomolar monoesters. Studies have revealed increasing and decreasing trends with depth in the western North Pacific (Hashihama et al., 2013) and the central North Pacific (Yamaguchi et al., 2019), respectively. Furthermore, from a horizontal viewpoint, lower monoester concentrations in conjunction with lower phosphate concentrations were observed in the subtropical North Pacific (Hashihama et al., 2013, 2019; Yamaguchi et al., 2019), whereas higher monoester concentrations in conjunction with lower phosphate concentrations were observed in the subtropical and temperate North Atlantic (Vidal et al., 2018). These results reflect the complex regulation of labile monoesters in the global oceans. It is therefore necessary to further investigate the distribution of labile monoesters in various environmental circumstances.
Here diesters as well as monoesters are important components of the bioavailable fraction of phosphoric esters. They are an essential component of cell membranes and nucleic acids in living organisms and likely play a significant role in the biologically mediated DOP. The scarcity of diesters (Vidal et al., 2018; Yamaguchi et al., 2019) and the stimulation of diesterase activity (DEA) under phosphate-depleted conditions (Sato et al., 2013; Yamaguchi et al., 2019) suggest that diesters are also important microbial P sources. However, most studies have focused on the distributions of monoesters, while the dynamics of diesters in the subtropical ocean are still poorly understood.
Compared to studies on the distribution of labile phosphoric ester concentrations, alkaline phosphatase activities have been investigated as an indicator of microbial P stress since the early times (Perry, 1972; Hoppe, 2003; Karl, 2014). As alkaline phosphatases are expressed by all living organisms (Karl, 2014), it is ecologically important to identify the specific organisms particularly utilizing phosphoric esters. The size fractionation of samples is an effective approach to reveal this point; however, studies reporting multiple separations of particulate-associated MEA and DEA are still limited in the open ocean (Vidal et al., 2003; Hoch and Bronk, 2007; Duhamel et al., 2010). Furthermore, dissolved enzyme activities, which are discriminated from the particulate enzyme activities, provide additional information on the current or recent P-specific physiological states of microbes due to the relatively long lifetime of cell-free dissolved alkaline phosphatases (Li et al., 1998; Baltar et al., 2013). To date, the reported dissolved phosphatase activities vary considerably from 6 to 100% of the bulk phosphatase activity in the North Pacific (Hoch and Bronk, 2007; Duhamel et al., 2010, 2011; Sato et al., 2013); however, the controlling factors of this high fluctuation remain unclear.
In this study, we examined the concentrations and size-fractionated hydrolysis rates of monoesters and diesters in the subtropical North Pacific to elucidate the underlying mechanisms influencing the dynamics of labile phosphoric ester. The study area covered a distinct longitudinal gradient of ambient phosphate concentrations (Hashihama et al., 2009; Martiny et al., 2019); this enabled us to verify the ubiquity of previously reported characteristics of labile phosphoric esters under various P-specific conditions throughout the subtropical ocean.
Materials and Methods
Field Observations and Environmental Parameters
Field observations were conducted during the KH-17-4 cruise (August 12 to October 5, 2017) on-board the R/V Hakuho-Maru. Three stations were located off the California coast and 12 stations were located in the subtropical North Pacific along a 23°N transect (Figure 1). The stations along the transect were separated at intervals of approximately 10° longitude. Vertical profiles of light intensity were measured using a Hyper Profiler (Satlantic LP, Halifax, NS, Canada) and depths corresponding to 25, 10, 1, and 0.1% of the surface light intensity were determined. Depth profiles of temperature were measured using an SBE 911 plus conductivity-temperature-depth (CTD) system (Sea-Bird Electronics, Inc., Bellevue, WA, United States). Water samples were collected using an acid-cleaned bucket or 12-L Niskin-X bottles fitted with a rosette system attached to the CTD.
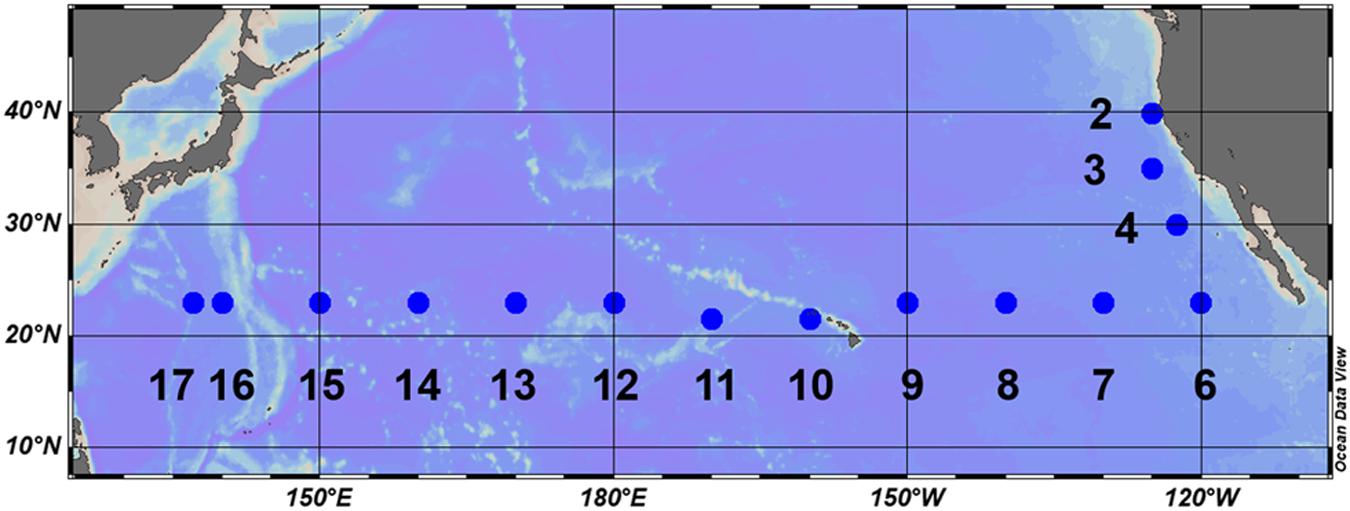
Figure 1. Location of stations during the KH-17-4 cruise (August–October 2017).
Chl a Concentrations and Microbial Community Structure
Chlorophyll a (Chl a) samples were collected from 16 layers in the upper 200-m layer, including 10 fixed depths, 5 light depths, and a subsurface chlorophyll maximum (SCM) layer. The SCM layer was determined from in situ Chl a fluorescence measurements using a fluorometer equipped to the CTD system. Samples were filtered on 25-mm GF/F filters, and Chl a concentrations were determined fluorometrically (Welschmeyer, 1994) using a fluorometer (10AU Field and Laboratory Fluorometer; Turner Design, San Jose, CA, United States) after extraction in N, N-dimethylformamide (Suzuki and Ishimaru, 1990).
Microbial community structures were determined at the same 5 light depths as the Chl a measurements. Samples were measured on-board immediately after sampling without cell fixation using a flow cytometer (CyFlow Space; Sysmex Partec, Germany). SYBR Green I was applied for staining bacterial cells, and autofluorescent cells were grouped into Prochlorococcus, Synechococcus, nanoeukaryotes, and picoeukaryotes.
Dissolved Nutrients and Data Collection
We analyzed the nanomolar level nitrate + nitrite (N+N) and phosphate at Stations 4–17 using a highly sensitive colorimetric method (Hashihama et al., 2009). Unfiltered seawater samples were collected in 30 mL polypropylene tubes (Sarstedt, Nümbrecht, Germany) and analyzed on-board immediately after sampling. The detection limit was 3 nM for both N+N and phosphate. Arsenic interference on phosphate determination was negligible because it was below the detection limit (Hashihama et al., 2013). For micromolar level analyses, samples were collected from all stations in 10-mL acrylic spitz tubes and kept at −20°C until analysis on land using an AACS-II autoanalyzer (SPX FLOW Technology, Norderstedt, Germany). Micromolar level data sets were obtained at Stations 2 and 3 and for samples exceeding 1 μM by the sensitive method. Due to the lack of nutrient data sets for several depths at Station 3, we assumed their concentration based on the interpolation of the vertical depth profiles.
As for the determination of labile monoesters and diesters, we applied an enzymatic hydrolysis method (Suzumura et al., 1998; Hashihama et al., 2013; Yamaguchi et al., 2019) on 30 mL of unfiltered seawater samples. In brief, two types of working enzyme solutions were prepared containing monoesterase (P-4252; Sigma-Aldrich) or [mono- + diesterase (Phosphodiesterase I; Worthington)] at final concentrations of 0.2 U mL–1. Samples were added with either of the working enzyme solutions, 0.5 M Tris buffer solution, and 5 M sodium azide solution. Samples were then frozen to terminate enzyme activity after 5 h of dark incubation at 30°C. Nanomolar monoester and diester concentrations were measured as phosphate concentrations increased from blank samples (Hashihama et al., 2009). Blank samples were prepared in a similar manner but without the addition of working enzyme solution and Tris buffer. Finally, the results were corrected for sample dilution by the added reagents and phosphate contamination therein. Phosphate contamination was determined using MAGIC seawater (Karl and Tien, 1992) as a phosphate-free matrix. The detection limit for monoester and diester concentrations was 3.4 nM (Yamaguchi et al., 2019), and the precision was ±1.7 nM (Hashihama et al., 2013). The hydrolysis efficiency of this determination method was previously evaluated using several known phosphoric esters (Hashihama et al., 2013; Yamaguchi et al., 2019).
Total dissolved phosphorus (TDP) concentrations were measured by the persulfate oxidization decomposition method (Hansen and Koroleff, 1999). TDP samples were filtered through precombusted GF/F filters (450°C, 3 h) into polypropylene tubes and kept frozen at −20°C until analyses on land. Decomposed TDP concentrations were measured as phosphate at the nanomolar level when the background phosphate concentrations were below 500 nM. Therefore, the data sets were partly lacking at stations with high ambient phosphate concentrations. DOP concentrations were defined as TDP minus phosphate.
All nutrient samples were generally collected at the same 16 depths as the Chl a samples at all stations. Nutrient concentrations below the detection limit were considered 0 nM when calculating their means and integrals, and when producing plots via Ocean Data View. For convenience, the zero values were substituted by the detection limit when deriving the non-linear power function regressions.
The data and methodologies from 12 references on enzymatically hydrolyzed labile phosphoric esters in various aquatic environments are summarized in Table 1. In the absence of precise information on raw values, they were estimated from the provided graphs and bar charts using WebPlotDigitizer Version 4.2 (Ankit Rohatgi, San Francisco, CA, United States).
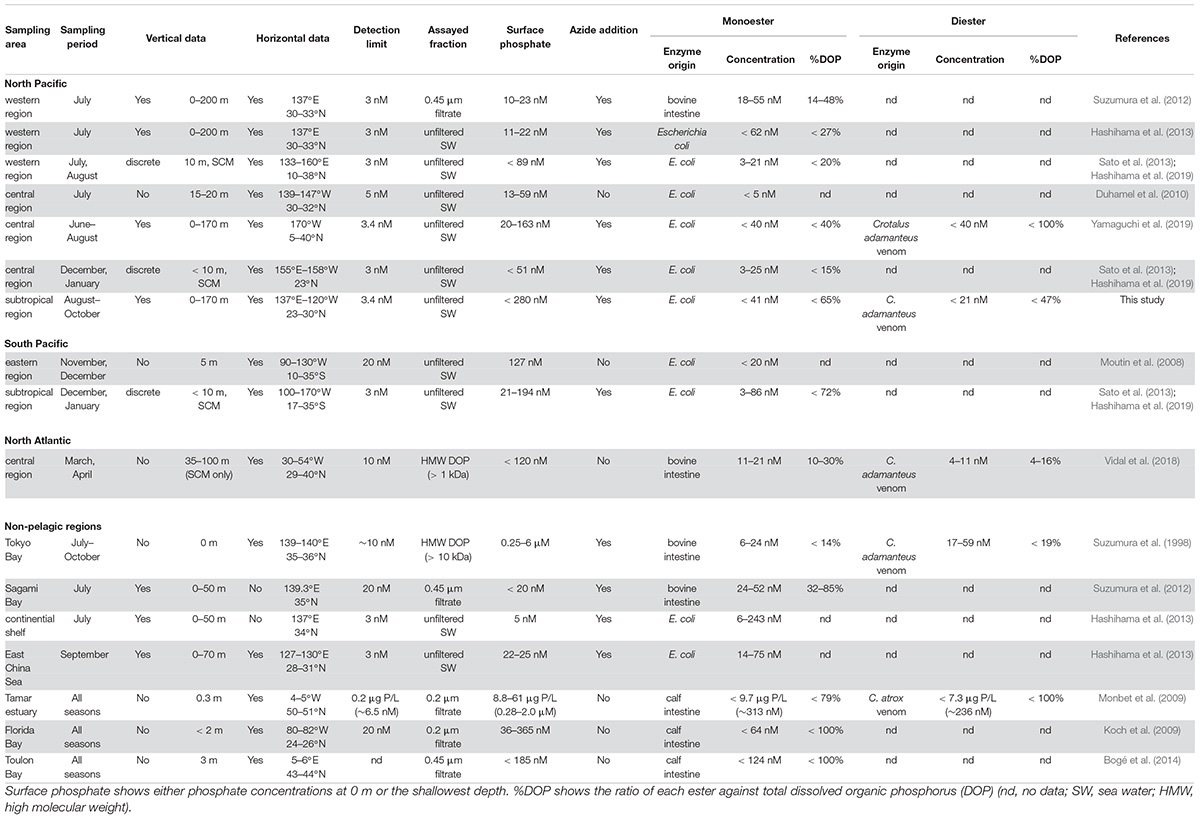
Table 1. Summary data of labile phosphoric esters.
Kinetic Parameters of Alkaline Phosphatase Activity
Samples for alkaline phosphatase activities were collected from the same 5 light depths at all stations. Potential Vmax, Km, and turnover times (Tn) of bulk MEA and DEA were determined by multiple-concentration assays (Sato et al., 2013). Two types of artificial fluorescent substrates were applied – 4-methylumbelliferyl phosphate (MUP; Thermo Fisher) and bis-MUP (Chem-Impex Int. Inc.) – and 50 μM of each stock solution was prepared separately in autoclaved 3.5% NaCl aqueous solution. The stock solutions were then kept frozen until later use. Either of these stock solutions was added separately to 2.5 mL of unfiltered seawater to final concentrations of 0.1, 0.5, 1, or 2 μM for the MEA assay and 0.1, 0.5, 1.5, 3, or 4 μM for the DEA assay. Blank samples were prepared in the same manner without the addition of fluorescent substrates.
The fluorescence intensities of hydrolyzed products (4-methylumbelliferone, MUF) were measured using a spectrofluorometer (FP-8200; JASCO, Tokyo, Japan). Measurements were taken immediately after substrate addition and several times during the 9–11 h of dark incubation at in situ temperatures to ensure linear hydrolysis rates. MUF standard solutions were prepared at each sampling station using GF/F filtered surface seawater as a solvent. The standard solutions were incubated in the same manner as the other samples, and the MUF standard curves were obtained at each measuring time point.
Based on the time-course hydrolysis rates, we calculated the Vmax and Km for MEA and DEA by curve fitting the Michaelis–Menten equation using the “Ligand binding” package in SigmaPlot 9.0 (Systat Software Inc., San Jose, CA, United States) (p < 0.05). However, the derived Vmax and Km for DEA were partly insignificant due to poor regression. Therefore, we estimated the missing DEA Vmax data from the relevant hydrolysis rates at the highest bis-MUP concentration as they showed a linear relationship with the corresponding DEA Vmax data (p < 0.001, data not shown) within the data set deriving significant regression curves. The potential Tn of MUP and bis-MUP, identified as those of in situ monoesters and diesters, were derived by dividing Km by Vmax (Labry et al., 2005).
Three size fractions of MEA and DEA were determined at all stations except for Station 17: (1) the dissolved fraction (<0.2 μm; MEAdis, DEAdis), (2) the small particulate associated fraction (0.2–0.8 μm; MEAsmall, DEAsmall), and (3) the large particulate associated fraction (>0.8 μm; MEAlarge, DEAlarge). Seawater samples were filtered through DISMIC filters (ADVANTEC, Japan), and the same fluorescent substrates were added to final concentrations of 2 and 4 μM for the MEA and DEA assay, respectively. Incubation and measurement procedures were done similarly to those above and the proportion of each fraction to the bulk hydrolysis rate was calculated. Note that the results of the size-fractionated DEA at Station 11 were excluded as outliers because they were unaccountably higher than the bulk DEA.
Results
Environmental Descriptions and Regional Divisions
The northeastern three stations off the California coast (Stations 2–4) were clearly distinguishable from other stations, showing typically low temperature (Figure 2A). Moreover, shoaling of nutriclines was notable at Stations 2 and 3, resulting in a shallow SCM above 70-m depth (Figures 2B–D). We observed a westward increase in temperature along the 23°N transect (Figure 2A), and the water column stratification was similar for all stations west of 160°W. N+N concentrations were mostly depleted (<5 nM) in the upper 100-m layer, and the concentrations around the bottom of the euphotic zone decreased westward (Figure 2C). A similar trend in the deeper layers was also observed for phosphate concentrations (Figure 2D). However, phosphate concentrations showed a distinct east-west gradient, with severe depletion (<3 nM) in the shallow layer (defined hereafter as ≤75 m) at Stations 13–17. The SCM located adjacent to the nitracline at 100 to 135-m depth (Figure 2B).
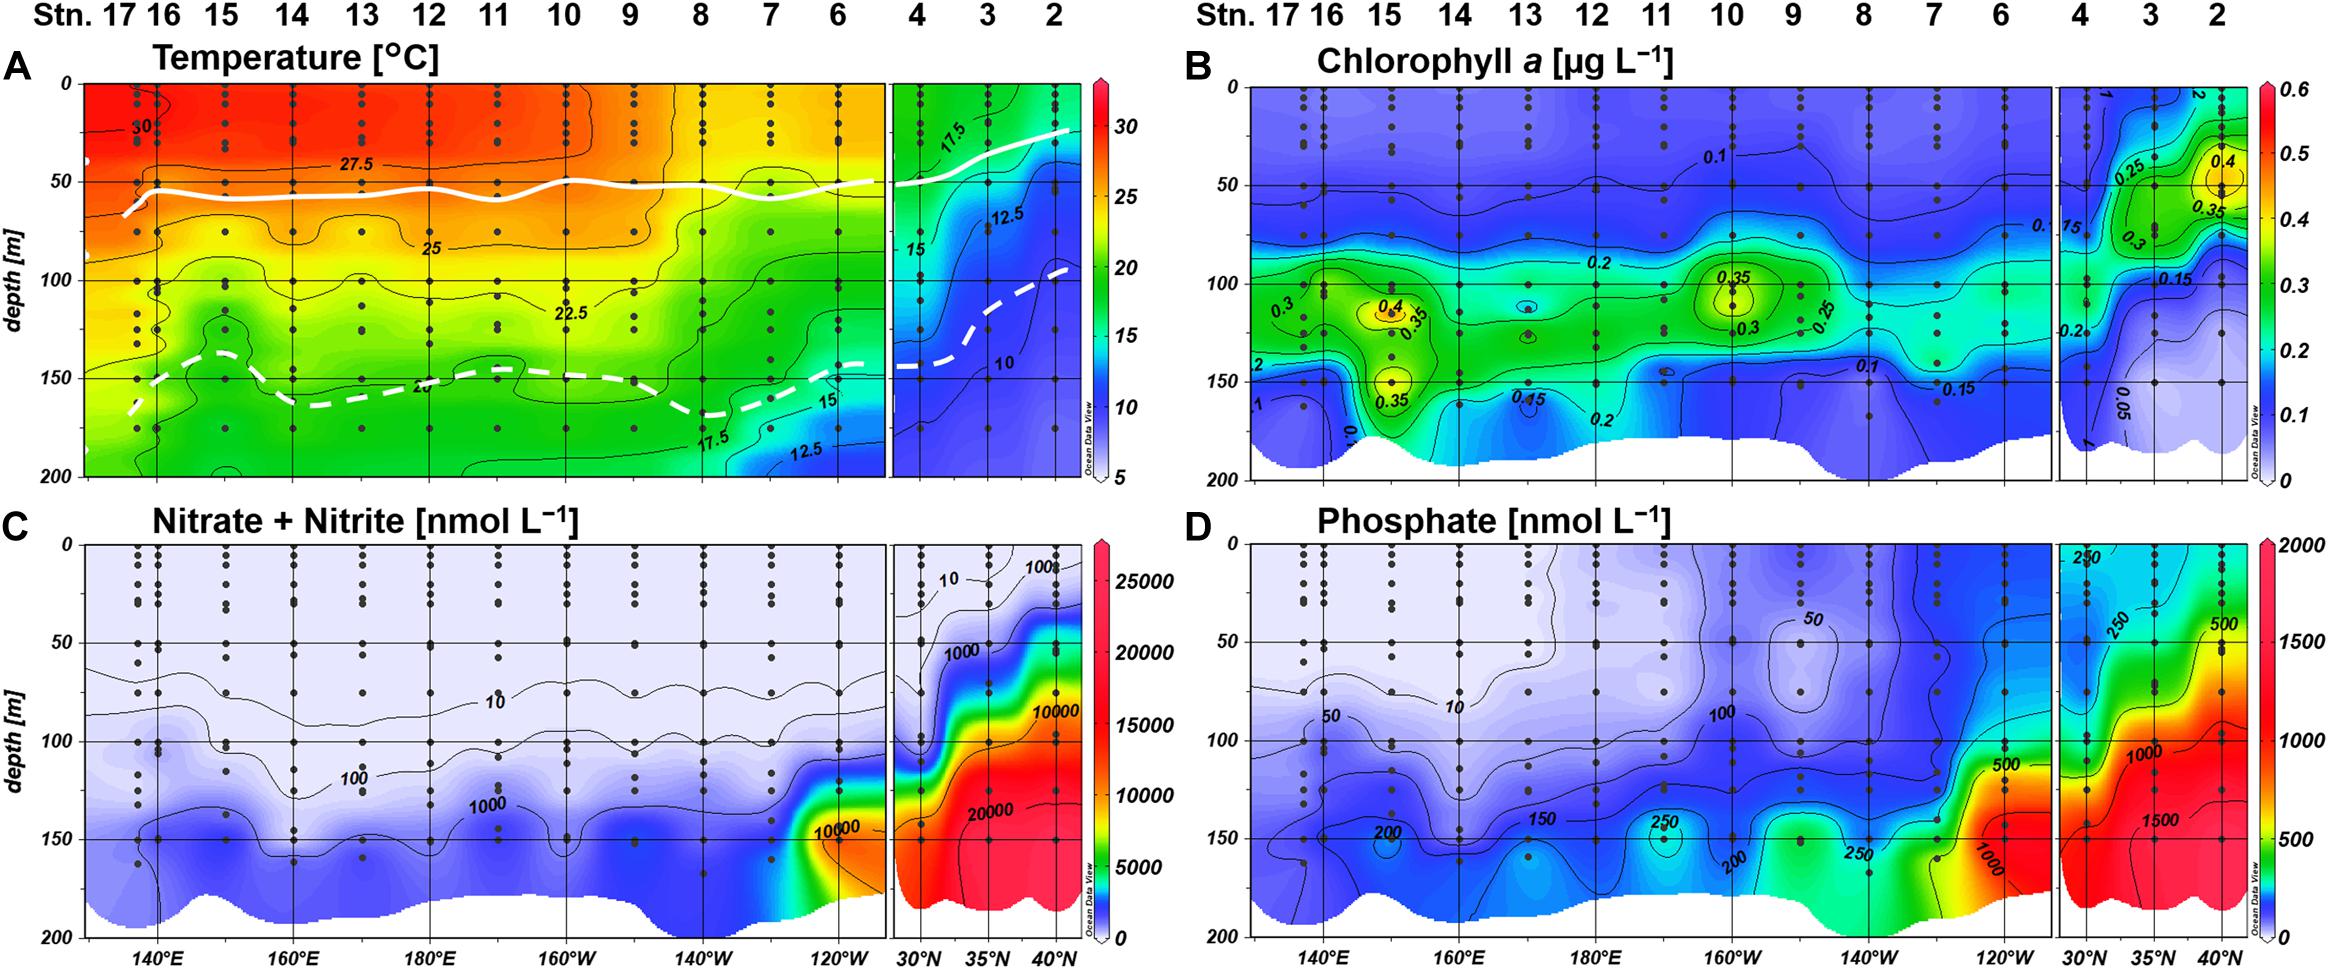
Figure 2. Distributions of (A) temperature, (B) chlorophyll a concentrations, (C) nitrate+nitrite concentrations, and (D) phosphate concentrations. Light depths of 10% and 0.1% are indicated by white bold and dashed lines, respectively.
We observed similar geographical contrasts in microbial community structure between the northeastern and the subtropical regions. Synechococcus, nanoeukaryotes, and picoeukaryotes were substantially higher in abundance among the phytoplankton community at Stations 2 and 3, whereas the proportion of Prochlorococcus abundance was higher in the subtropical region including Station 4 (Figure 3). Heterotrophic bacteria, Synechococcus, and picoeukaryotes were frequently observed in the upper euphotic zone (defined hereafter as ≥10% light intensity), while Prochlorococcus and nanoeukaryotes generally peaked at 1% light depth in the subtropical region (Figure 3). Based on the distributions of inorganic nutrients, SCM depths, and microbial community compositions, we divided the study area into the northeastern (Stations 2 and 3) and subtropical (Stations 4–17) regions.
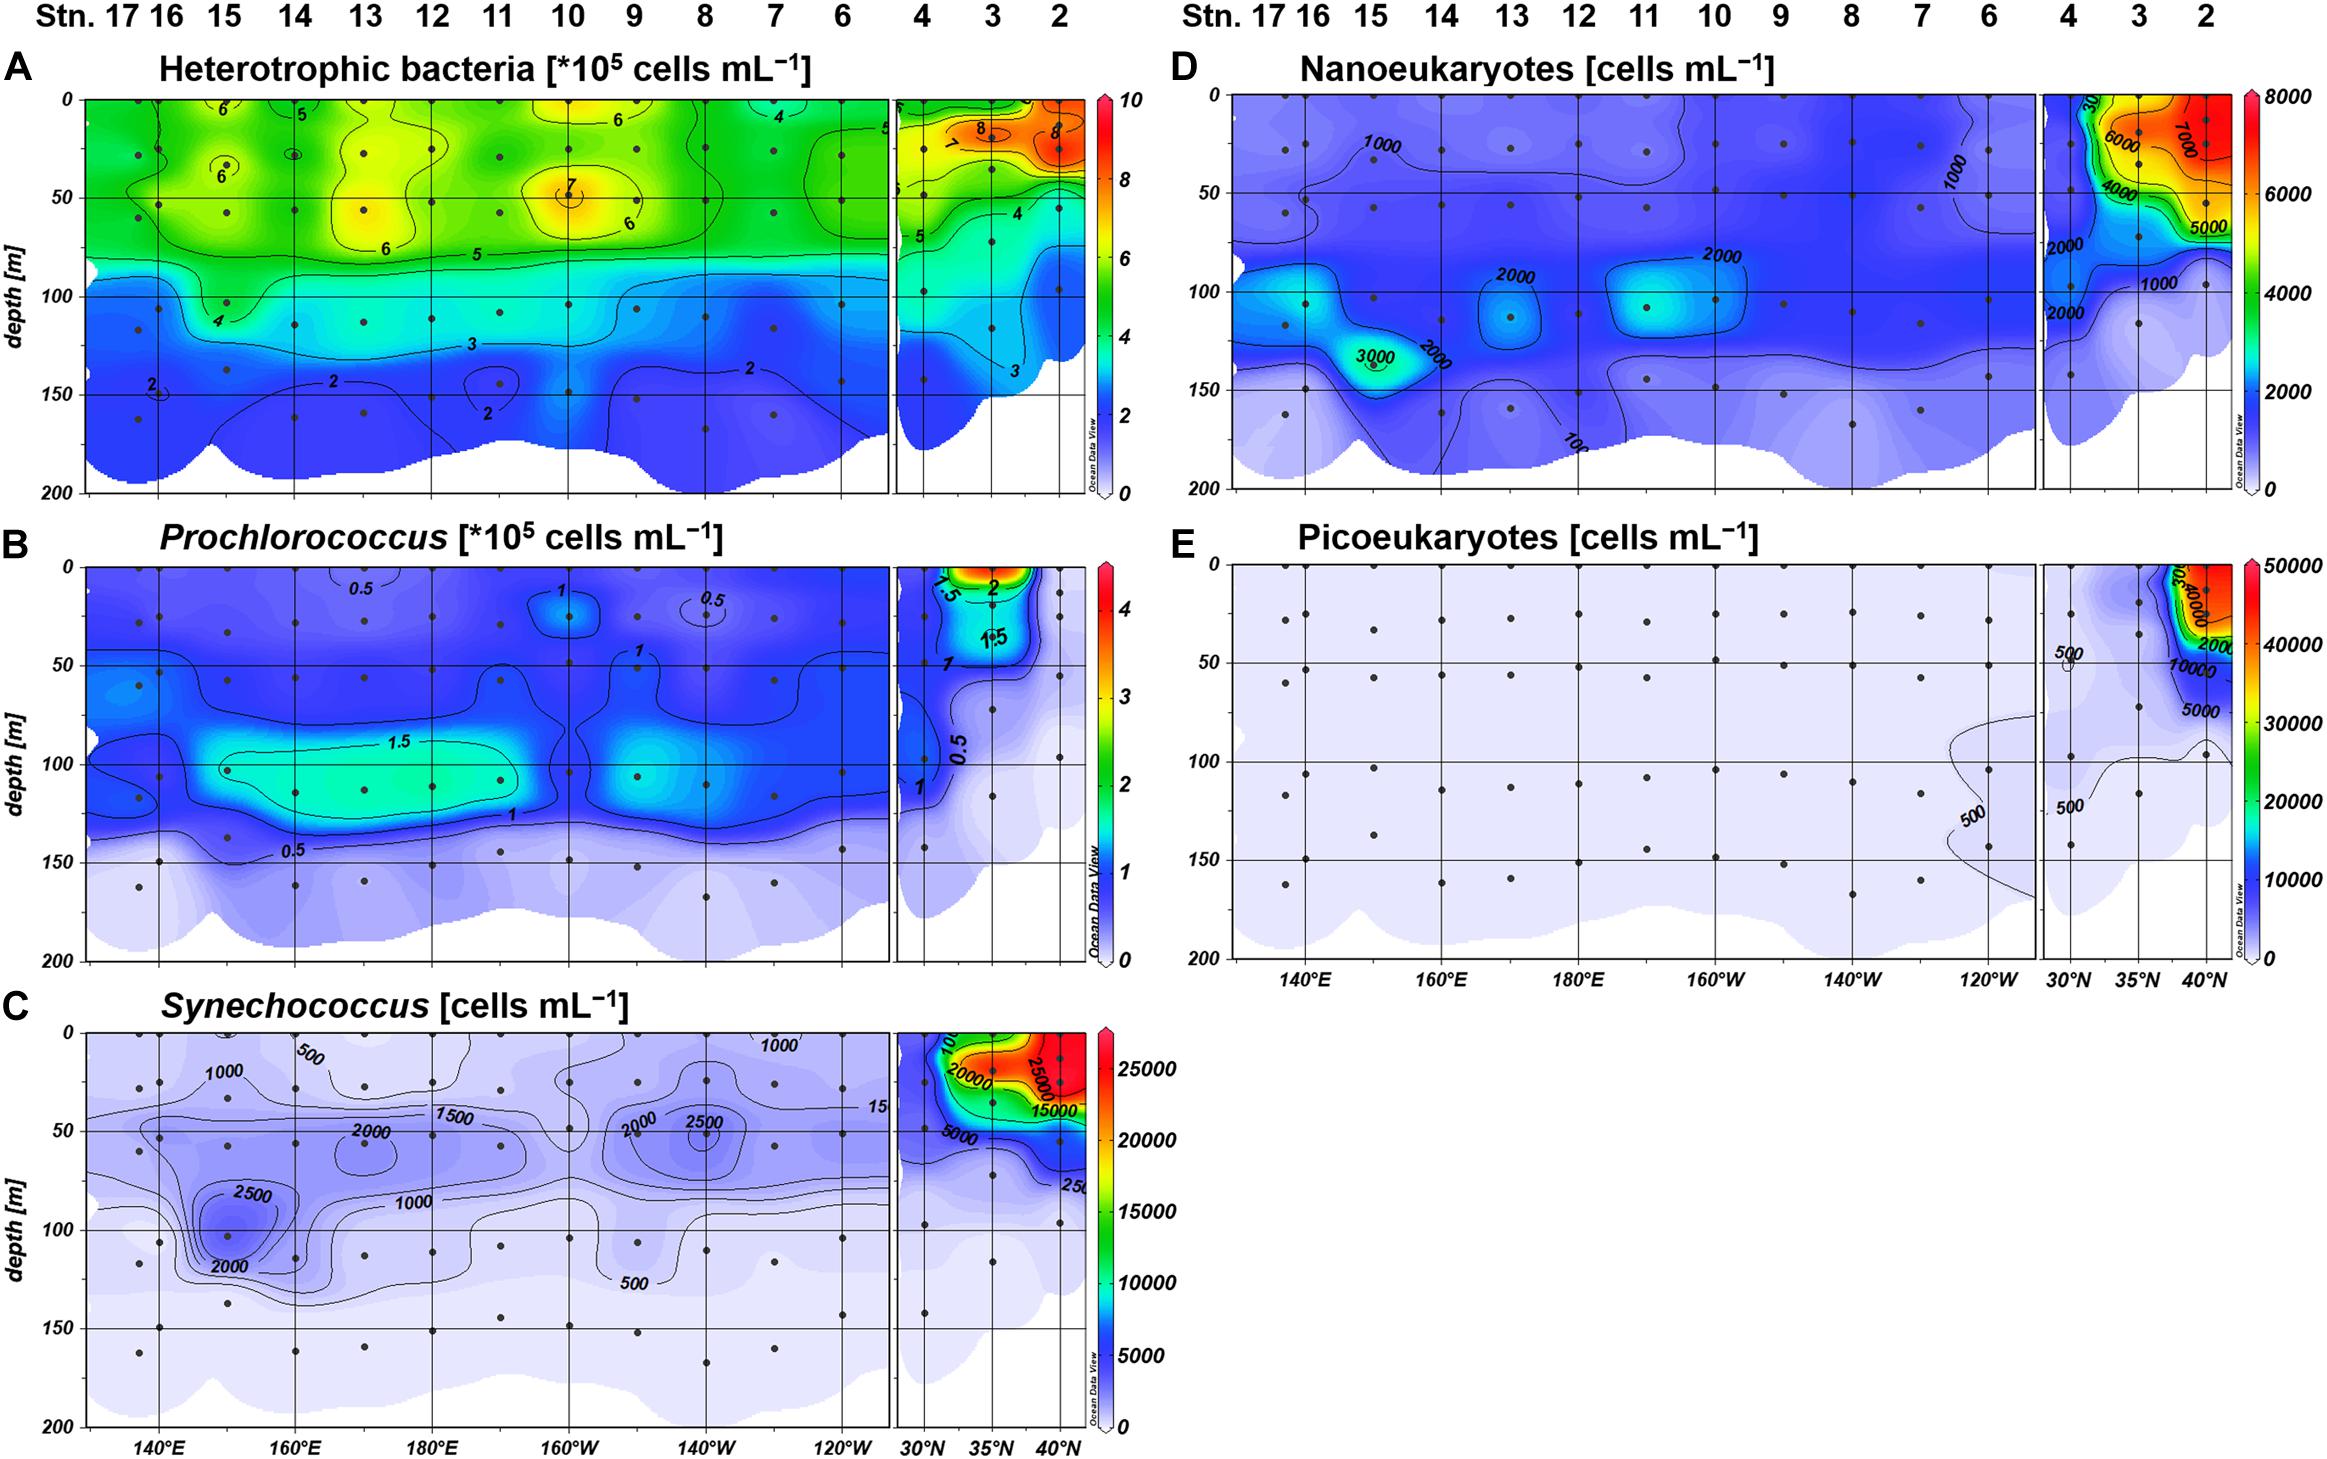
Figure 3. Distributions of the cell abundances of (A) heterotrophic bacteria, (B) Prochlorococcus, (C) Synechococcus, (D) nanoeukaryotes, and (E) picoeukaryotes.
Distributions of DOP Compounds
Labile monoester concentrations ranged from undetectable levels to 41 nM, averaging 16 ± 9 nM (n = 198) (Figure 4A). The depth-integrated monoesters above 150 m gradually decreased westward, following the east-west gradient in phosphate concentrations. We observed a maximum fivefold difference between Stations 7 and 15 (Figure 5A). As we observed no longitudinal variation in the depth-integrated monoesters below 75 m (Smirnov-Grubbs test, p > 0.05), the east-west variability likely resulted from the fluctuation of monoester concentrations in the shallow layer, whose depth-integrated values showed an increase against surface phosphate concentrations (Figure 6A). Monoester concentrations were generally below 10 nM in the shallow layer of the phosphate-depleted region (Stations 13–17) and were particularly depleted at Station 15 (Figure 4A).
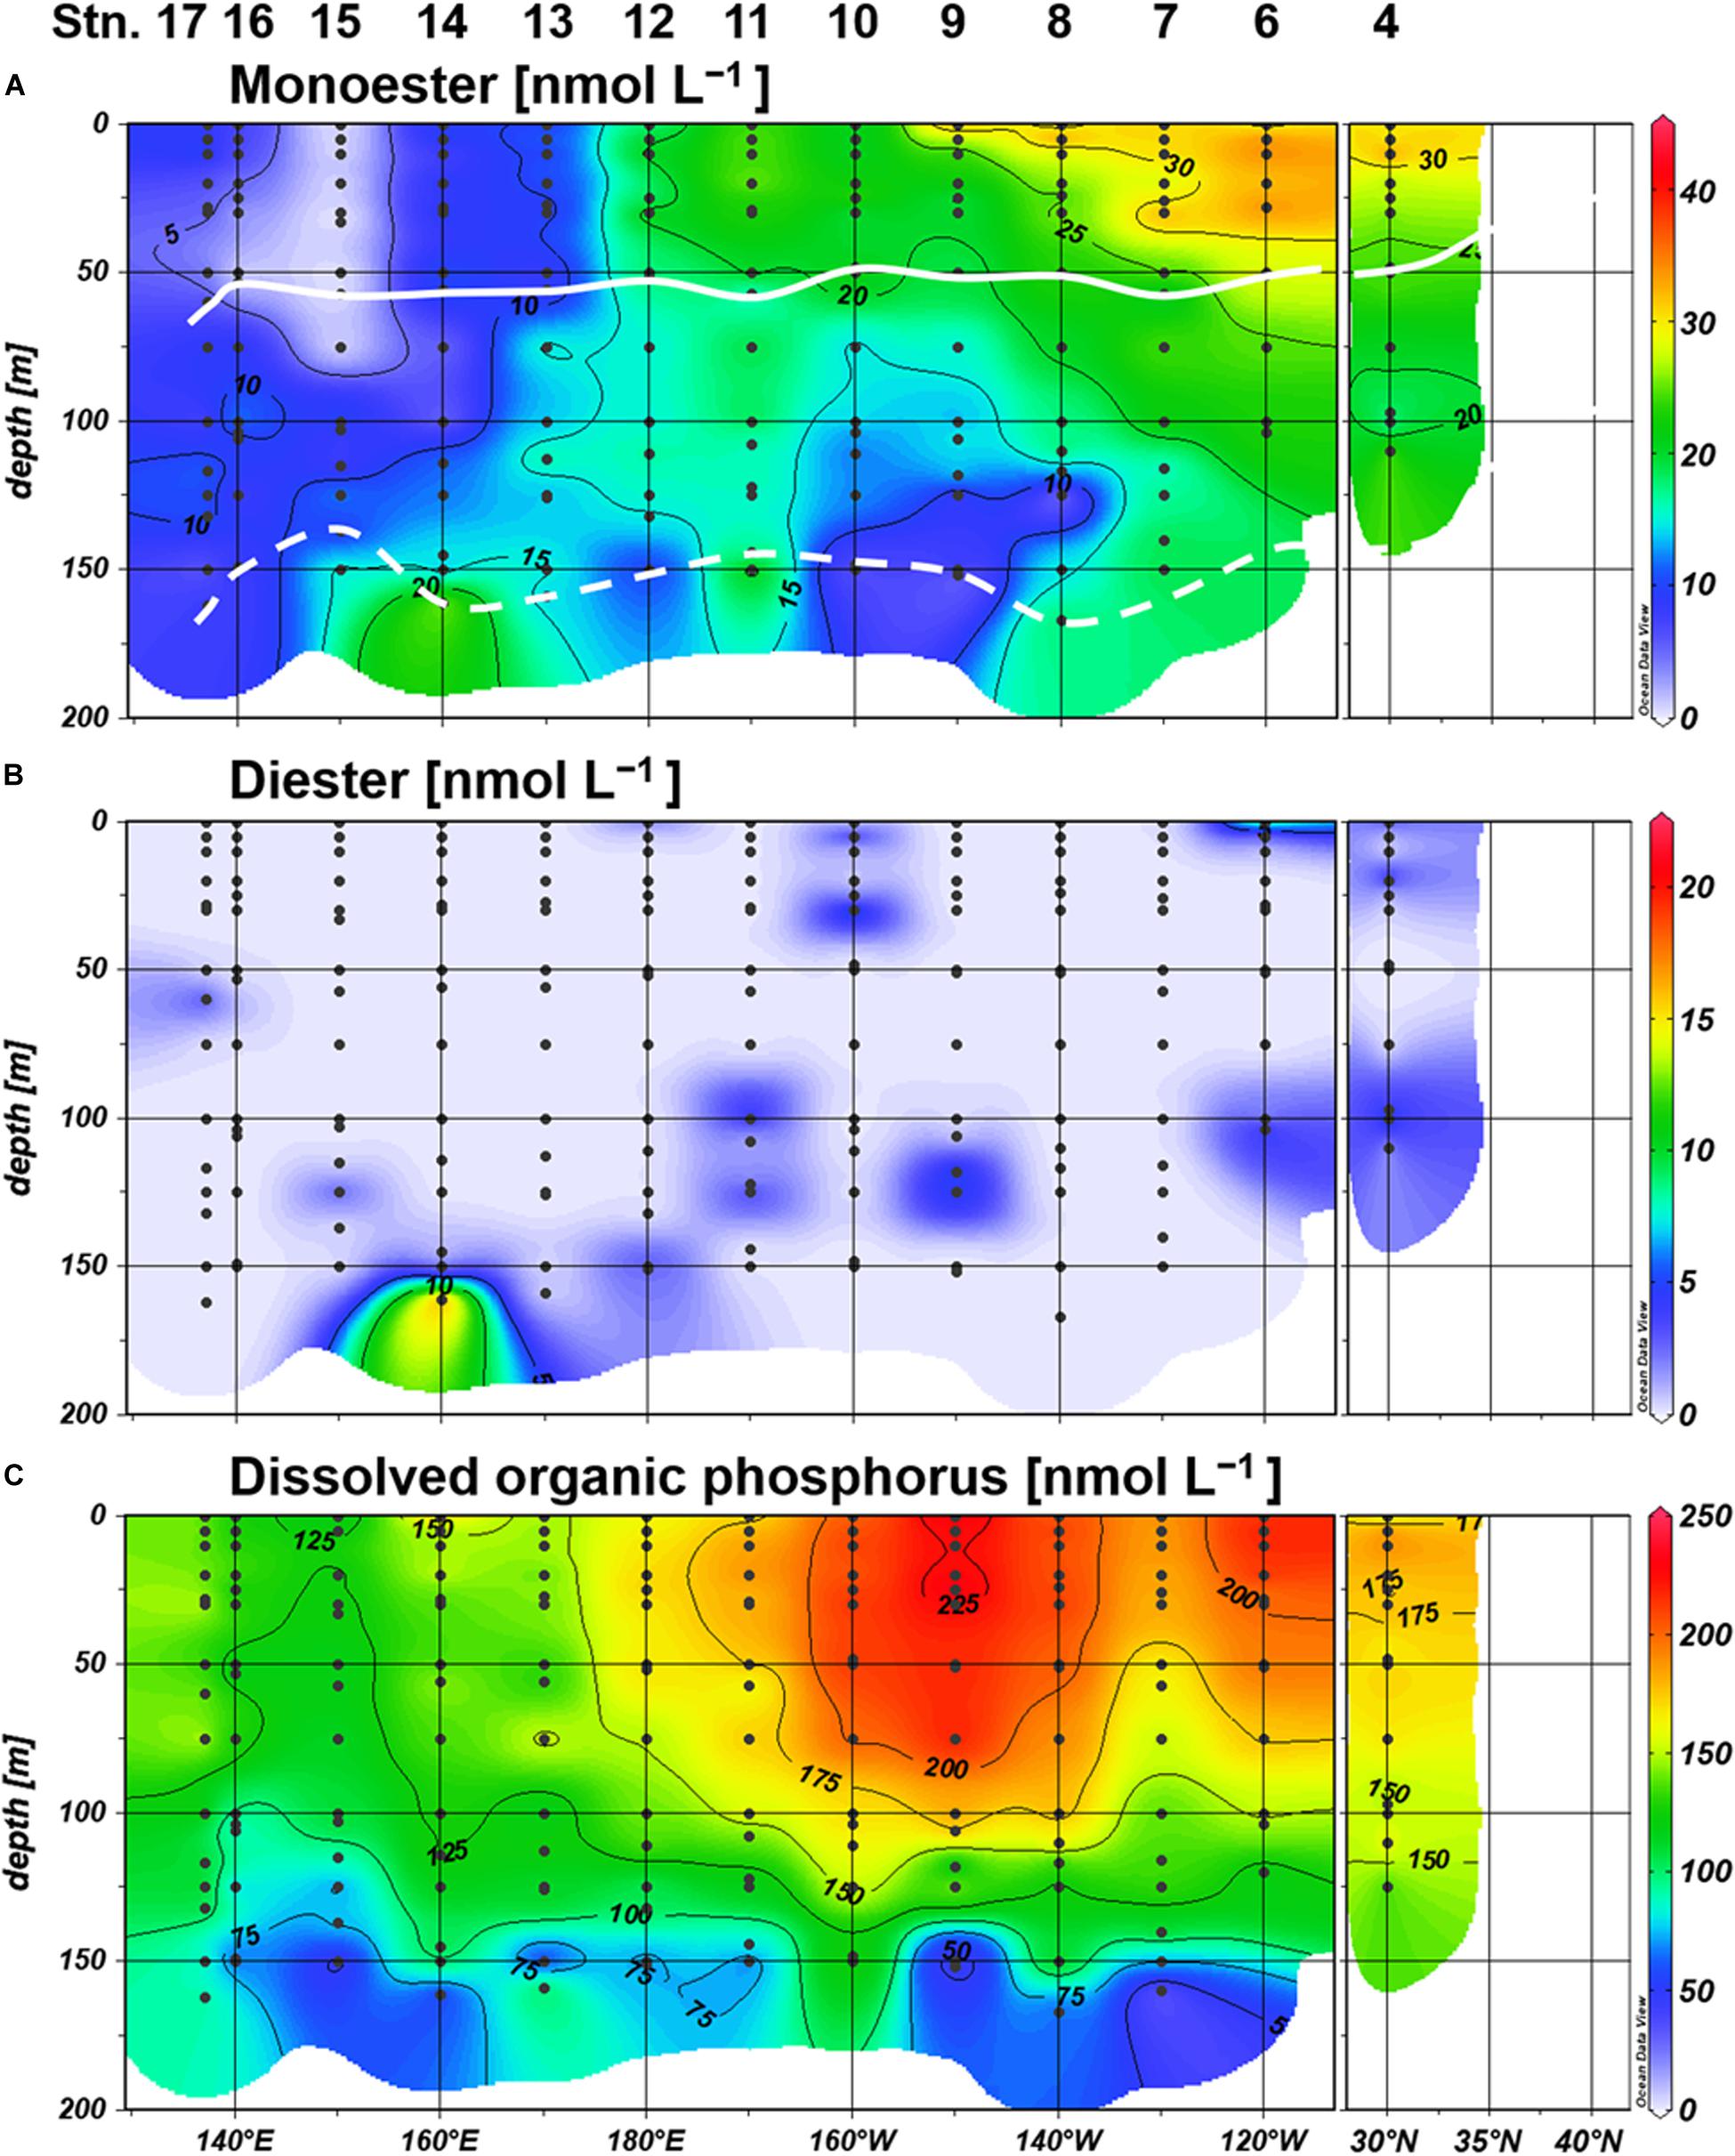
Figure 4. Distributions of (A) monoester, (B) diester, and (C) dissolved organic phosphorus (DOP) concentrations. Light depths of 10% and 0.1% are indicated by white bold and dashed lines, respectively.
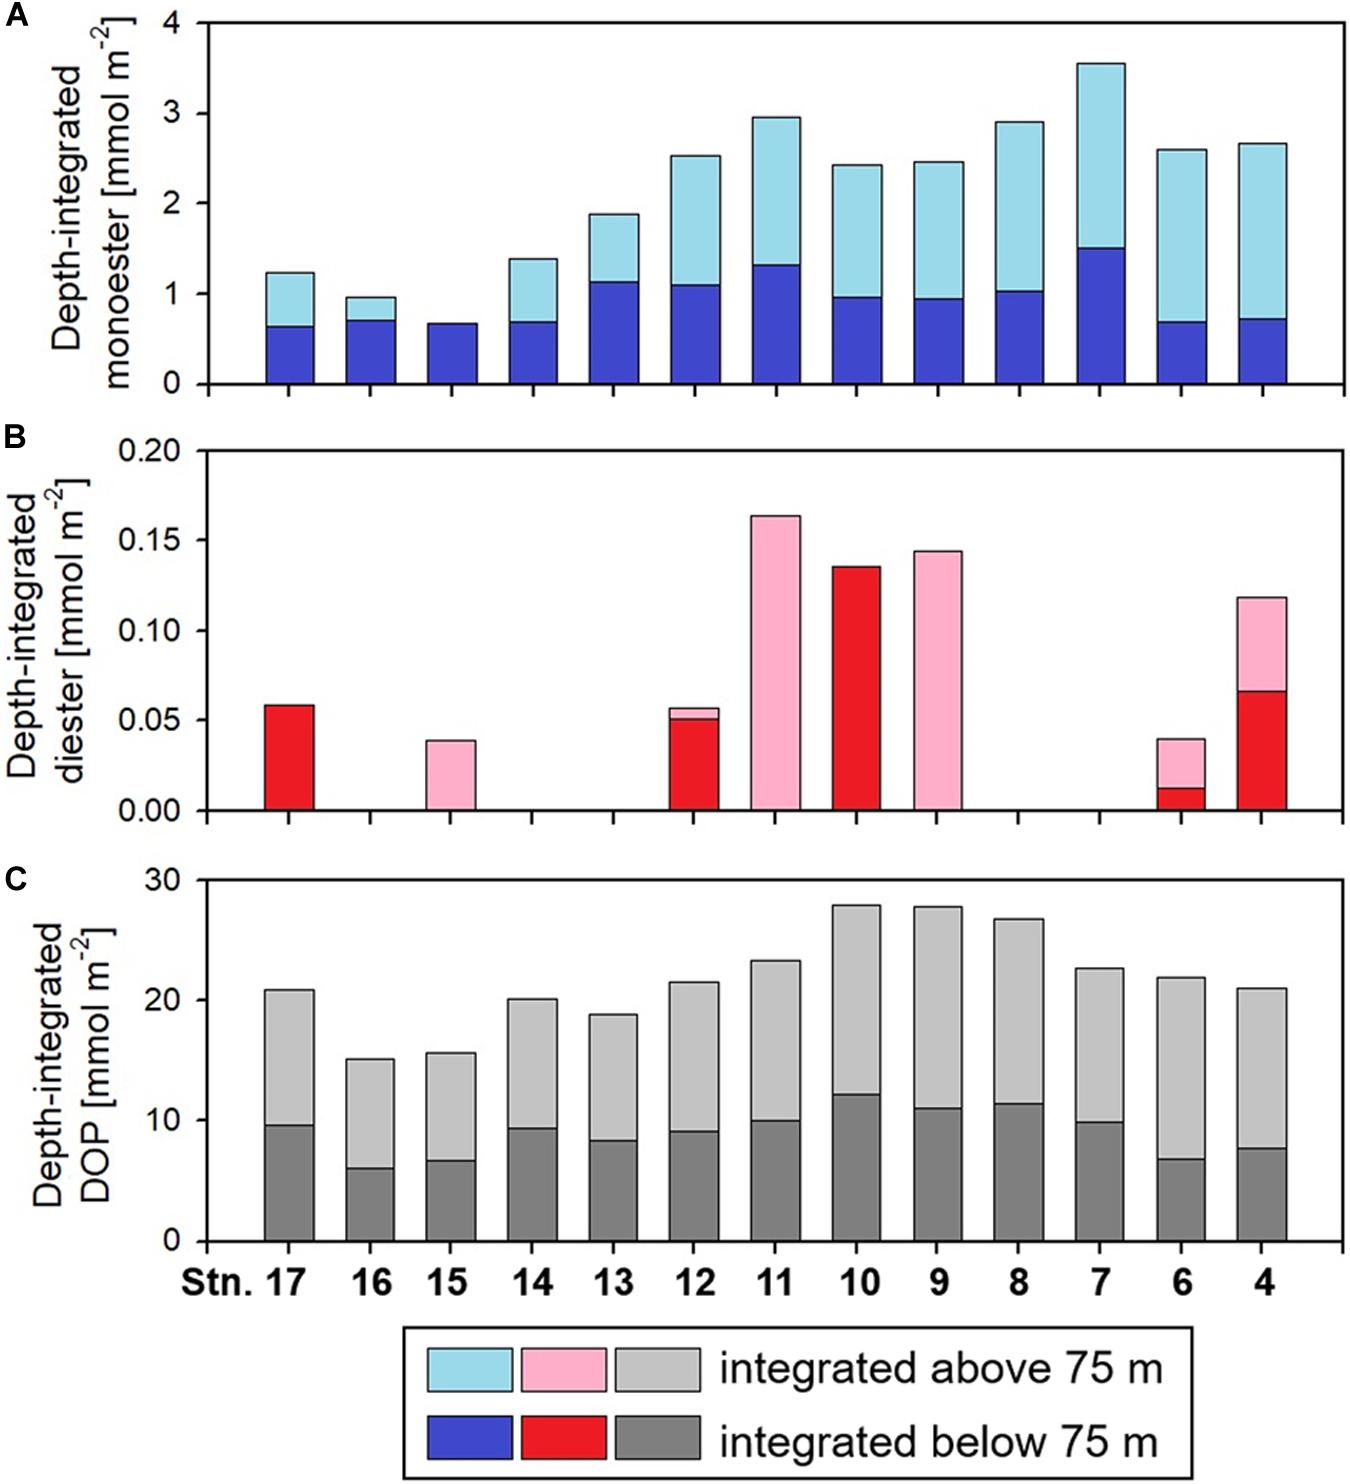
Figure 5. Distributions of the depth-integrated amount of (A) monoester, (B) diester, and (C) dissolved organic phosphorus (DOP). At the two eastern stations 4 and 6, these parameters were integrated only above 110 and 104 m, respectively, due to lacking data sets.
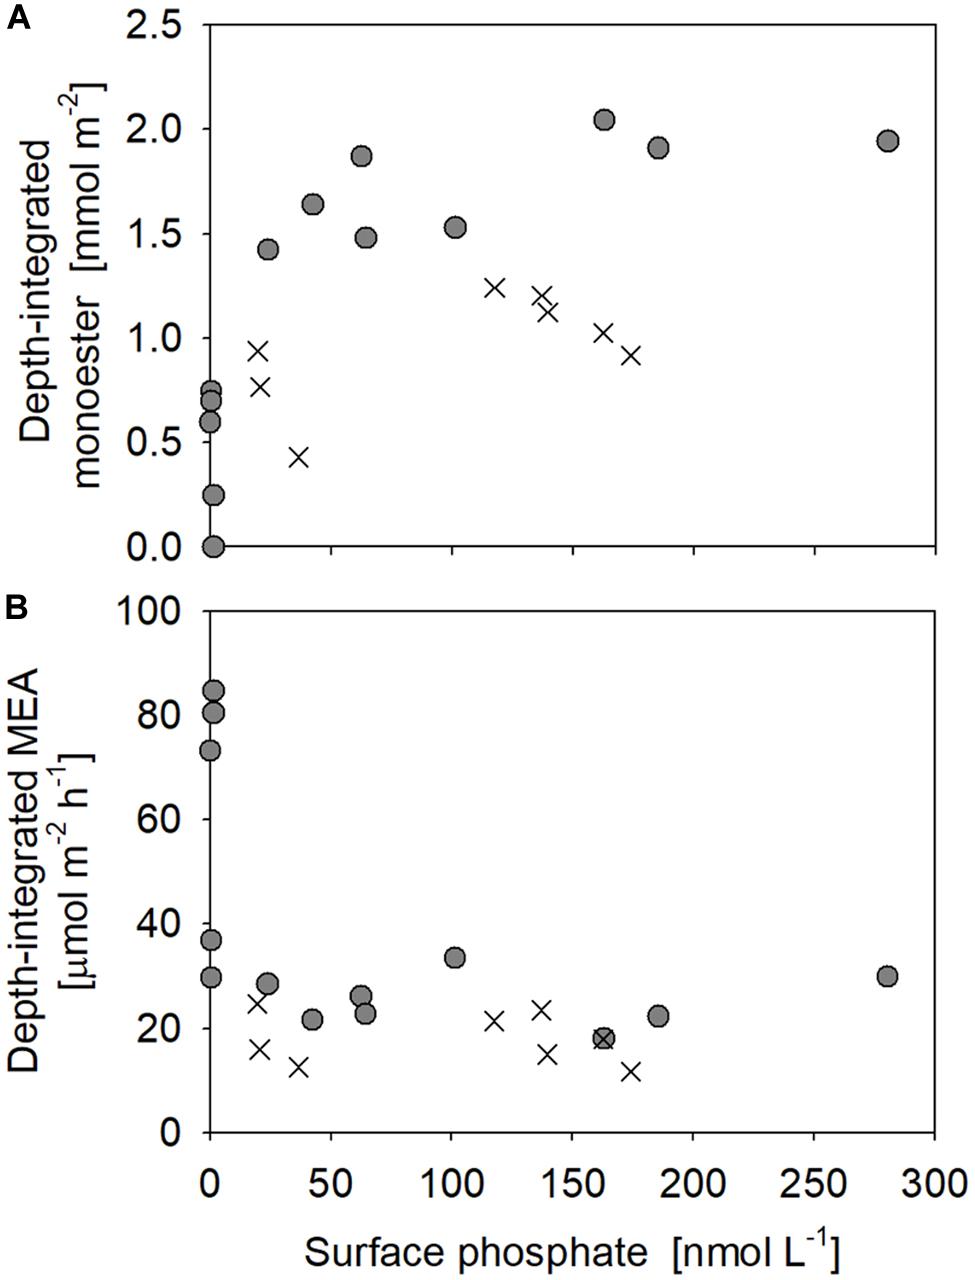
Figure 6. Relationships between surface phosphate concentrations vs. depth-integrated (A) monoester concentrations and (B) monoesterase activity (MEA) above 75 m. Filled circles represent the results obtained in this study (Stations 4–17), whereas crosses are those from Yamaguchi et al. (2019).
The vertical profiles of monoester concentrations also demonstrated longitudinal variability. Monoester concentrations were high around the sea surface and decreased with depth in the eastern half of the transect (Stations 4–12) (Figure 4). They were significantly negatively correlated with depth at each station, and these vertical profiles were opposite to those of other inorganic nutrients (Figure 2). In contrast, significant positive correlations were observed at Stations 13–15. Interestingly, the regression coefficients were significantly negatively correlated with surface phosphate concentrations (Figure 7). From this non-linear regression, the threshold surface phosphate concentration separating the depth-negative and depth-positive correlation of monoesters was 10 nM. Monoester concentrations subtly increased with depth at Stations 16 and 17, although the correlation was not significant.
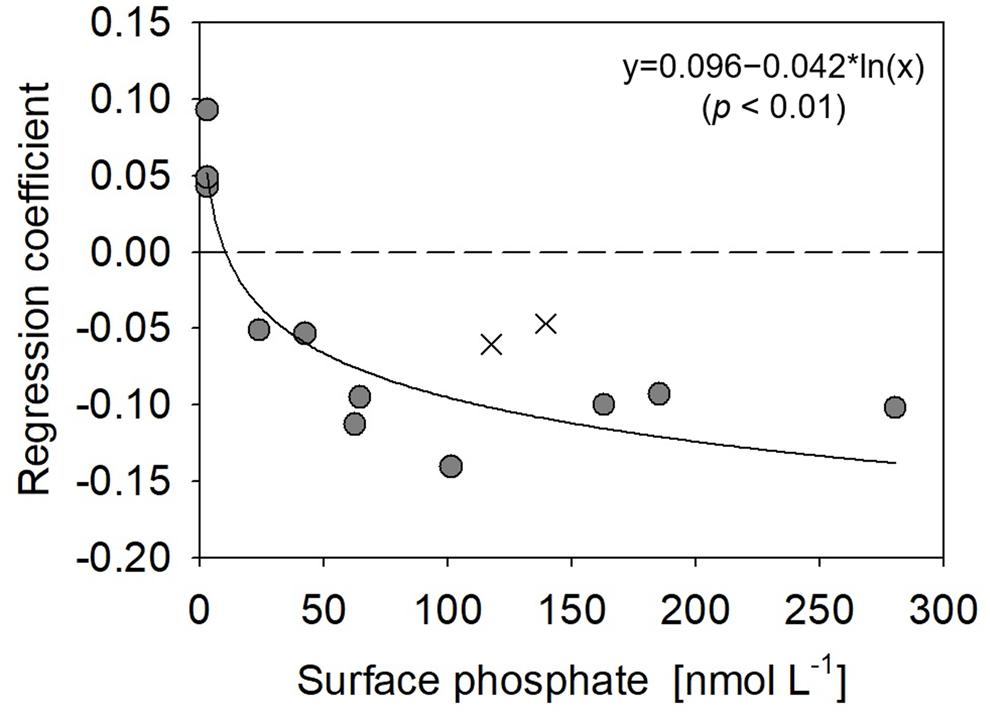
Figure 7. Relationship between surface phosphate concentrations vs. regression coefficients derived between monoester concentrations and depths at stations 4–15. Filled circles represent the results obtained in this study, whereas crosses are those from Yamaguchi et al. (2019).
Labile diester concentrations ranged from undetectable levels to 21 nM (n = 200) (Figure 4B). Over 90% of samples were under the detection limit and the average value calculated from detectable results was 8 ± 4 nM (n = 17). Due to this scarcity, the depth-integrated diesters were an order of magnitude lower than that of monoesters (Figure 5B), and the diester concentrations showed no obvious geographical variation (Figure 4B).
Dissolved organic phosphorus concentrations showed an opposite depth profile to that of phosphate (Figure 4C), and the depth-integrated concentrations were particularly high at Stations 8–10 (Figure 5C). The DOP:TDP ratio gradually increased westward, reaching above 90% in the phosphate-depleted region (Stations 13–17) (Supplementary Figure S1A). The average contribution of monoester and diester concentrations to the total DOP was 11 ± 8% and 1 ± 4%, respectively. In the shallow layer, monoester:DOP ratios were lowest in the western region (Stations 13–17), followed by the mid-region (Station 8–12), and highest in the eastern region (Station 4–7) (Kruskal–Wallis test, p < 0.01; Supplementary Figure S1B).
Distributions of Alkaline Phosphatase Activities
Monoesterase activity Vmax and Tn varied between 0.075 and 2.6 nmol L–1 h–1 (mean 0.50 ± 0.43 nmol L–1 h–1, n = 89) and 4–431 days (mean 64 ± 61 days, n = 89), respectively. MEA was generally upregulated in the upper euphotic zone of the study area (Figure 8A) and was significantly negatively correlated with phosphate concentrations (p < 0.001) (Figure 9A). The enhancement of MEA under low phosphate conditions was also notable from the depth-integrated MEA in the shallow layer (Figure 6B). MEA was particularly high exceeding 1 nmol L–1 h–1 at Stations 15–17 (Figure 8A), with a notably short Tn below 10 days. MEA was also high at Station 3, although Tn was substantially longer (>85 days) than in the phosphate-depleted region (Stations 13–17). In addition, MEA was significantly negatively correlated with monoester concentrations (Supplementary Figure S2); however, two data sets were identified as outliers due to their large residual errors exceeding 2σ.
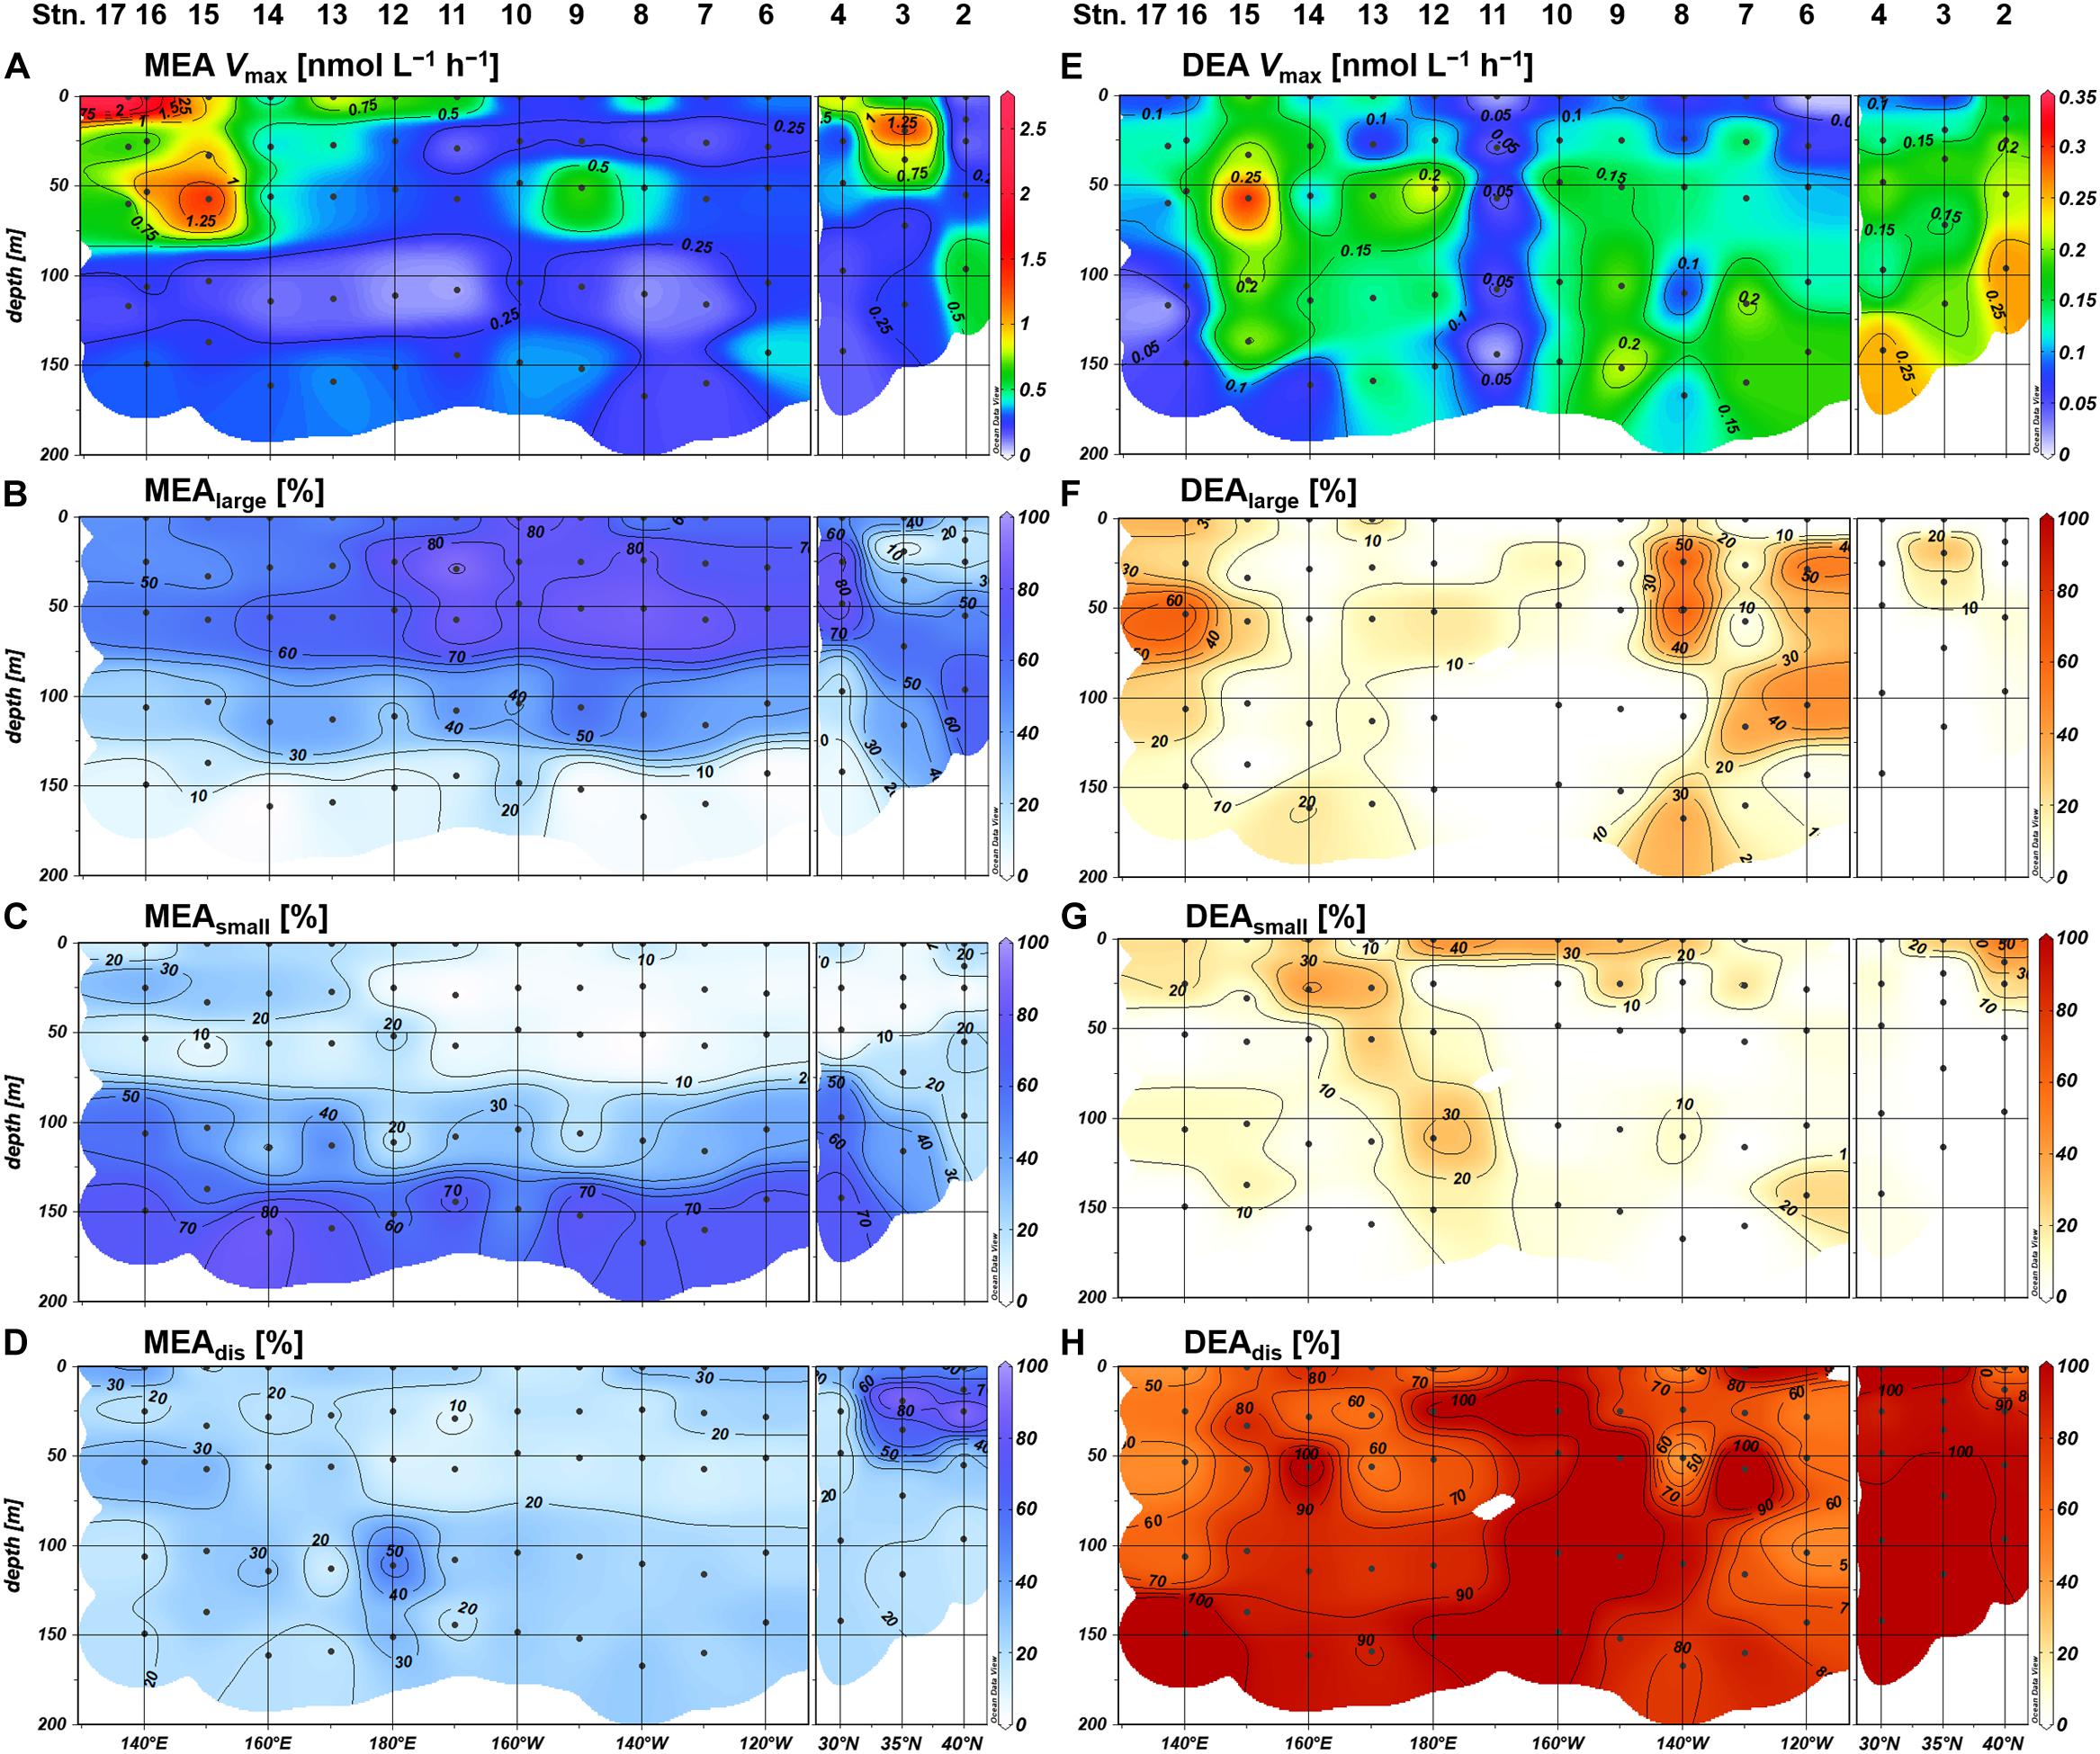
Figure 8. Distributions of monoesterase activity (MEA), diesterase activity (DEA), and the proportion of size-fractionated enzyme activities; (A,E) bulk enzyme activities in whole seawater samples, (B,F) enzyme activities in large size fraction (>0.8 μm), (C,G) enzyme activities in small size fraction (0.2–0.8 μm), and (D,H) enzyme activities in the dissolved fraction (<0.2 μm).
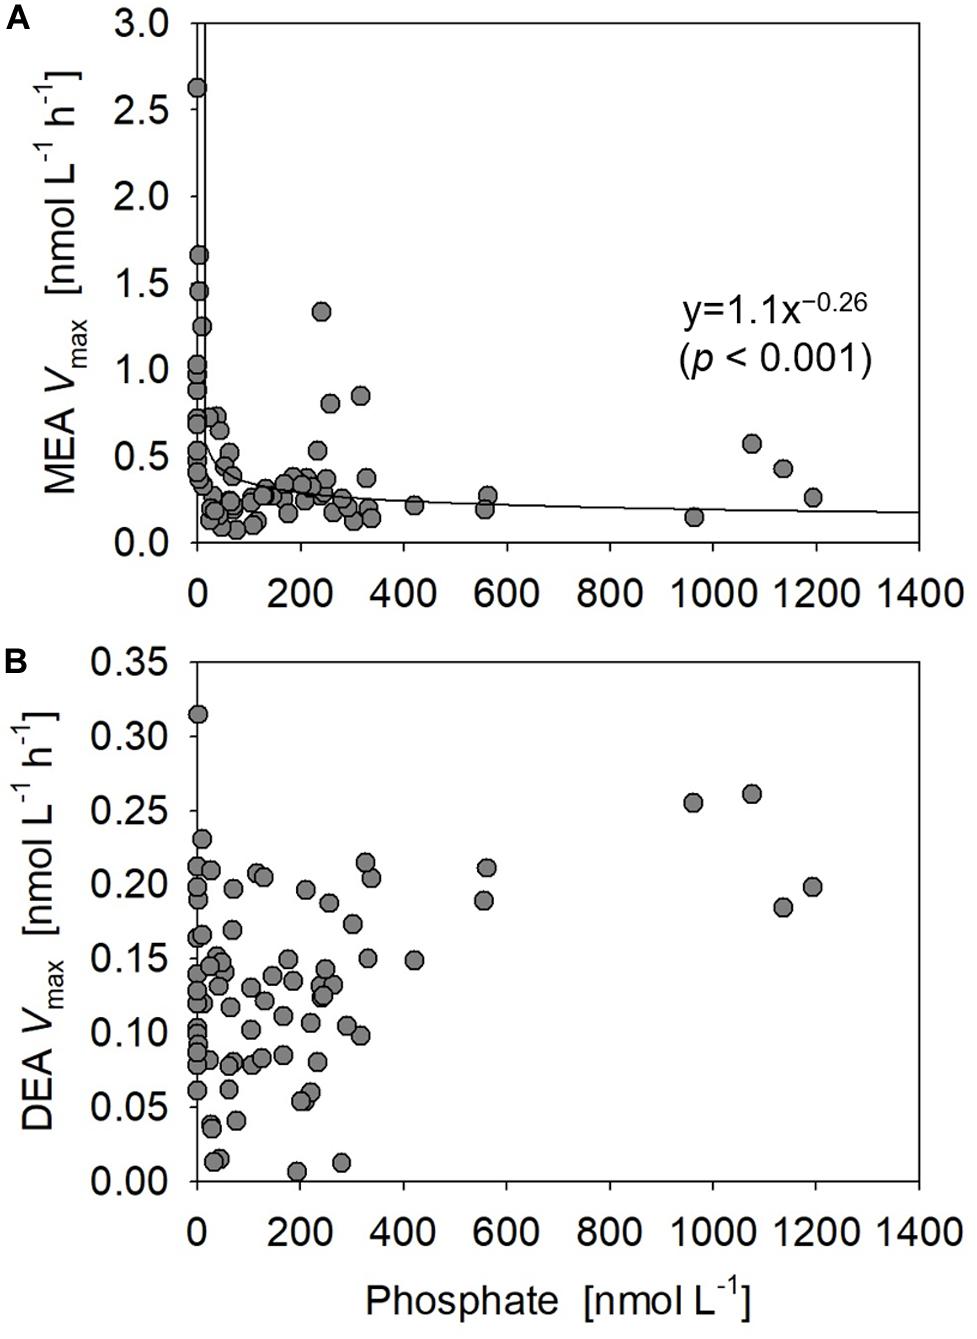
Figure 9. Relationships between phosphate concentrations vs. (A) monoesterase and (B) diesterase activities (MEA and DEA Vmax) obtained at all stations.
The size fractionation of enzyme assays revealed that MEAlarge accounted for the largest proportion of the bulk MEA on average (48 ± 26%; n = 70), whereas MEAsmall and MEAdis showed similar average contributions of 26 ± 24% and 26 ± 16%, respectively. The contributions of MEAlarge and MEAsmall showed mostly inverse vertical trends throughout the study area and dominated the bulk MEA in the upper and deeper (≤1% light intensity) euphotic zones, respectively (Figures 8B,C). Exceptions to these trends were observed in the northeastern region (Stations 2 and 3) where MEAdis showed the highest contribution in the upper euphotic zone relative to MEAlarge (Figure 8D). From a horizontal viewpoint, the MEAsmall contribution increased whereas the MEAlarge contribution decreased in the upper euphotic zone of the phosphate-depleted region (Stations 13–17) (Figures 8B,C). The MEAdis contribution was consistently low throughout the subtropical region; however, we observed a slight increase in the upper euphotic zone of the phosphate-depleted region (Figure 8D).
Diesterase activity Vmax and Tn varied between 0.006 and 0.31 nmol L–1 h–1 (mean 0.13 ± 0.064 nmol L–1 h–1, n = 89) and 956–1529 days (mean 1268 ± 210 days, n = 15), respectively. Note that DEA Tn was seldom determined due to the poor fitting of regression curves for uncertain reasons. Unlike the features of MEA, DEA was rarely upregulated at the sea surface and peaked around 10% light depth in the phosphate-depleted region (Stations 13–17) (Figure 8E). Furthermore, DEA increased with depth, particularly in the eastern half of the study area (Stations 2–10). Thus, we identified no significant relationship between the bulk DEA and phosphate concentrations (Figure 9B).
The characteristics of size-fractionated DEA were also distinct from those of MEA. Notably, DEAdis was the dominant fraction of the bulk DEA accounting for 85 ± 24% (n = 64) on average, whereas DEAlarge and DEAsmall accounted for only 13 ± 17% and 12 ± 14% on average, respectively. Both the percentage and absolute values of DEAlarge and DEAsmall were significantly negatively correlated with phosphate concentrations (Supplementary Figure S3), except for the excluded high-value DEAsmall outlier at Station 2. However, DEAlarge and DEAsmall showed different distributions in the subtropical region: DEAlarge was high at Stations 6–8 and 15–16, whereas DEAsmall was notable at Stations 9–14.
Discussion
Quantification of Bioavailable DOP
To date, several methodologies, including enzymatic degradation, photodegradation, and estimation from radiotracer uptake, have been developed to quantify the bioavailable DOP pool considering its importance to the physiological ecology and biogeochemical cycles. However, there is still a fundamental caveat in these methodologies as the components of the determined fractions are mostly unknown. This leads to a query of whether they are actually utilized in situ and to what extent they account for the genuine bioavailable DOP. Moreover, the ratios of quantified amounts of labile DOP against total DOP largely depend on their methodological definitions. For example, these ratios tend to be higher when determined by photodegradation (average: 67%, Karl and Yanagi, 1997) and radiotracer experiments (average: 24%, Björkman et al., 2000) than by enzymatic degradation (average: 12%, this study) in the North Pacific. Moreover, even though enzymatic degradation is intended for phosphoric ester detection, the substrate specificity of enzymes is inevitably involved (Turner et al., 2002; Hashihama et al., 2013); therefore, our results should be regarded as the “minimum” values of the labile phosphoric ester pool. Thus, the unidentified DOP fraction in this study cannot be recognized as completely refractory as it likely involves both refractory and undetectable labile phosphoric esters, as well as bioavailable polyphosphates and phosphonates (Björkman and Karl, 1994; Dyhrman et al., 2006).
Dynamics of Monoesters
Regulation of Monoester Distribution
Our basin-scale investigation is the first to report the geographical variations of phosphoric monoester and diester concentrations along a vast longitudinal transect in the subtropical North Pacific. Despite the narrow range and low values at nanomolar levels of monoester concentrations in our study area, we observed an obvious geographical gradient and identified novel features in the phosphate-replete eastern subtropical North Pacific. The distribution patterns were most likely regulated by ambient phosphate concentrations. Severe phosphate depletion (under ca. 10 nM) in the shallow layer of the western basin led to an extremely low level of monoesters, resulting in a depth-increasing profile. In contrast, higher phosphate concentrations in the shallow layer of the eastern basin led to higher monoester concentrations, resulting in a depth-decreasing profile.
Within our study area, Stations 13–17 were severely P-limited due to the exhaustion of phosphate in the shallow layer. This phosphate depletion was accompanied by severely low monoester concentrations below 10 nM. Simultaneously, high MEA in the upper euphotic zone (Figures 8A, 9A) clearly demonstrated the active utilization and exhaustion of monoesters as alternative microbial P sources; this most likely induced the depth-increasing trends of monoesters at Stations 13–15. The depth-increasing trend was relatively obscure in the westernmost region (Stations 16 and 17); however, we assume that these depth profiles were a derivative of the neighboring distribution patterns, as the monoester concentrations in the shallow layer were similarly low (Figure 4A).
In the eastern basin (Stations 4–12), monoester concentrations in the shallow layer increased in line with the eastward increase in ambient phosphate concentrations (Figures 2D, 4A). However, the increase in monoester concentrations cannot be simply explained by the fluctuation of total DOP alone, as we identified differences in the spatial variability of maximum DOP concentrations and monoester:DOP ratios (Figure 5C and Supplementary Figure S1B). Thus, labile monoesters were likely regulated by a different mechanism to that of the remaining fraction of total DOP. Because the standing stock of monoesters results from the equilibrium of both consumption and production processes, it is difficult to fully understand the dynamics due to lack of either data. However, when considering the significant depth-decreasing trend in monoester concentrations at all eastern stations, the relatively low MEA in the upper euphotic zone therein (Figure 8A) may have in part contributed to the possible imbalance and subsequent net accumulation of monoesters in the shallow layer.
Comparisons of Monoester Distributions Between Various Oceanic Regions
As summarized in Table 1, there have been several studies providing both vertical and horizontal distribution data of monoesters in the North Pacific (Table 1). While previous studies were limited to the central or western North Pacific, our study provides the data for the phosphate-replete eastern subtropical region. Moreover, our study covers a wider range of surface phosphate concentrations compared to previous studies, varying from undetectable levels to 280 nM (Table 1). Despite the variable range in ambient phosphate concentrations, monoester concentrations fell within the range of previous studies (Table 1); this suggests that monoester concentrations are consistently low at the nanomolar level in the subtropical ocean. In contrast, monoester concentrations are occasionally higher than 100 nM in non-pelagic regions (Table 1).
The characteristics of monoester distribution in the severely phosphate-depleted region in this study (i.e., low concentrations in shallow layers and the depth-increasing trends) were mostly consistent with those of previous studies conducted in the western North Pacific (Suzumura et al., 2012; Hashihama et al., 2013). This suggests that monoester distribution patterns are generally ubiquitous in this region. However, monoester concentrations were not completely exhausted in the findings reported by Suzumura et al. (2012) (Table 1), and their results differed to those of Hashihama et al. (2013), despite being conducted at the same sites and on the same cruise. These differences are likely due to discrepancies in their methodologies – such as applying sample filtration and monoesterase of different origins (Table 1). The origins of phosphatases are particularly essential because the pH optima and substrate specificities are known to differ among enzymes (Bünemann, 2008).
Under phosphate-replete conditions, we found an increase in the residual monoester concentrations with increasing ambient phosphate concentrations. This trend was consistent with the surface monoester concentrations reported along a longitudinal transect conducted in the winter (Sato et al., 2013; Hashihama et al., 2019; Table 1). Similar parameters were collected in these studies, and their sampling locations partly overlapped with ours which corresponded to Stations 10–14. From the paired comparisons, there was no obvious seasonality in monoester concentrations, as well as in phosphate and total DOP. MEA was significantly higher in our summer study (Wilcoxon signed-rank test, p < 0.05), although the fluctuation was within a moderate range. Therefore, the impact of MEA seasonality on the standing stock of P compounds was assumed to be small in the central North Pacific. However, because the comparable data sets were limited to particular seasons and depths, intensive seasonal investigations are recommended for further verification.
On the other hand, the coupled increase between phosphate and monoesters was not fully applicable to other previous studies in the central North Pacific and eastern South Pacific (Moutin et al., 2008; Duhamel et al., 2010; Yamaguchi et al., 2019). This was likely because the reported monoester concentrations in these studies were occasionally lower than expected when referring to our data at similar levels of surface phosphate concentrations (Table 1 and Figure 4A). Furthermore, Vidal et al. (2018) reported increasing monoester concentrations with decreasing phosphate concentrations in the North Atlantic, which is in contrast with the longitudinal trend observed in this study (Figure 4A).
However, the findings of each study cannot be adequately compared due to significant differences in the methodologies (Table 1). Firstly, for those lacking the addition of azide solution (Moutin et al., 2008; Duhamel et al., 2010), monoester concentrations are likely underestimated by bacterial uptake of released phosphate during sample incubation. This is because azide solution prevents bacterial activity (Feuillade and Dorioz, 1992) without interfering with phosphatase activities (Suzumura et al., 1998). Secondly, the sampling conditions by Vidal et al. (2018) varied significantly from those of ours, particularly with regards to limited sampling depths, the assayed fraction, and the use of monoesterases of different origins. Nevertheless, these studies provide a significant perspective on monoester dynamics, and further investigations and data collection are therefore necessary to minimize the existing methodological biases.
In contrast, our methodology was basically identical to that of Yamaguchi et al. (2019), as well as the aforementioned winter studies (Sato et al., 2013; Hashihama et al., 2019; Table 1). The horizontal and vertical characteristics of monoester distributions in both studies were partly consistent, with increasing depth-integrated monoester concentrations under phosphate-rich conditions (Figure 6A; Yamaguchi et al., 2019). Here monoesters were integrated above 75 m when considering the longitudinal variability revealed in this study (Figure 5A). From a vertical viewpoint, Yamaguchi et al. (2019) also reported higher monoester concentrations in the upper 100-m layer, and their regression coefficients against depth were plotted close to the curve obtained in this study (Figure 7). However, only 2 out of 8 stations showed significant depth regressions (Yamaguchi et al., 2019) although the surface phosphate concentrations were thoroughly above the threshold (Table 1). In addition, the depth-integrated monoesters were relatively lower than those observed in this study, despite the similar range of surface phosphate concentrations (Figure 6A). This suggests that the residual monoester concentrations in the shallow layer was not as large as expected in Yamaguchi et al. (2019). As the depth-integrated MEA above 75 m were generally similar between the two studies (Figure 6B), the obscure depth-decreasing trend of monoesters in the central North Pacific was probably caused by low monoester net production and not by their increased hydrolysis in the shallow layer.
Distribution of Size-Fractionated MEA
Based on the size fractionation of phosphatase activities, the major monoester consumers were present in the large size fraction (>0.8 μm) in the upper euphotic zone of the subtropical region (Stations 4–17). This size class most likely consists of Synechococcus, nanoeukaryotes, and others including microplankton groups and particle aggregates. The dominance of MEAlarge in the subtropical region was rather unique because MEAdis contributed over 65% of the bulk MEA in the central North Pacific (30–32°N; Duhamel et al., 2010). In contrast, MEA associated with the small size fraction (0.2–0.6 μm) contributed over 40% of the bulk MEA in the tropical North Pacific (10–17°N; Hoch and Bronk, 2007). Nevertheless, a latitudinal shift in the dominant MEA size class was reported in the Atlantic from 10° to 30° in both N and S, varying from MEAsmall to MEAlarge and then to MEAdis (Vidal et al., 2003). Therefore, the high proportion of MEAlarge in this study can be interpreted as a specific feature along the 23°N transect, although further latitudinal investigations are required.
Compared with MEAlarge, the proportion of MEAsmall – which likely consists of Prochlorococcus and heterotrophic bacteria – relatively increased in the upper euphotic zone of the western basin. This may be due to an increased abundance and/or increased P demand of these small microbes relative to larger communities. In the upper euphotic zone, the abundance of heterotrophic bacteria was mostly higher than that of Prochlorococcus in both cell counts and estimated carbon biomass at factors of 6.3 and 35.4 fg C cell–1, respectively (Kawasaki et al., 2011). Moreover, cell-specific phosphate uptake rates of heterotrophic bacteria were reported to be lower than those of Prochlorococcus in the oligotrophic ocean (Michelou et al., 2011; Björkman et al., 2012), inferring a higher sensitivity of heterotrophic bacteria to P stress. Thus, the increased proportion of MEAsmall in the upper euphotic zone indicates the preferential utilization of monoesters by heterotrophic bacteria under low phosphate conditions in the western basin.
As previously mentioned, Li et al. (1998) proposed a hypothetical model to estimate the history of microbial P limitation based on the balance of phosphatase activity between the dissolved and particulate fraction. According to their assumption, high MEAdis with low particulate MEA indicates “recent relief” from P limitation on microbes (Li et al., 1998). This is because the lifetime of dissolved monoesterase is assumed to be longer than that of microbes, lasting for more than several days and weeks (Li et al., 1998; Baltar et al., 2013). Moreover, high MEAdis with high particulate MEA indicates persisting P limitation, whereas low MEAdis with high particulate MEA indicates recent P limitation (Li et al., 1998). In this sense, the relatively low contribution of MEAdis throughout the subtropical region with a mean of 23% (Figure 8D) indicates some degree of microbial P-deficiency across the study area, including the phosphate-replete eastern basin, and the moderate increase of MEAdis in the western basin is consistent with the severe P limitation implicated from other parameters.
Despite the large geographical gradient in ambient phosphate concentrations, MEAdis seldom exceeded 50% of the bulk MEA in the subtropical region. We therefore could not explain the high variance of MEAdis reported in previous studies (Vidal et al., 2003; Hoch and Bronk, 2007; Duhamel et al., 2010, 2011; Sato et al., 2013). In particular, Vidal et al. (2003) reported a high proportion of MEAdis (40–100%) in the severely phosphate-depleted subtropical North Atlantic (Wu et al., 2000; Martiny et al., 2019). In this case, the dominance of MEAdis cannot be interpreted as recent relief from P limitation. A possible explanation is the difference in the subcellular localization of enzymes in different gene families (Luo et al., 2009), with enhanced extracellular expression of PhoX phosphatase relative to PhoA and PhoD types. Moreover, a major diazotroph Trichodesmium was reported to enrich the transcription of PhoX in the Atlantic and PhoA in the Pacific (Rouco et al., 2018). It is therefore necessary to improve our understandings of the phosphatase gene families to clarify the variability of dissolved MEA in the subtropical ocean.
The northeastern region (Stations 2 and 3) likely have different mechanism for the regulation of MEA expression from that in the subtropical region. As the northeastern region was characterized by a distinct microbial composition and a shallow SCM, the high MEAdis observed in the upper euphotic zone was likely liberated from these microbial communities. Moreover, the dominance of MEAlarge in the deeper euphotic zone may be interpreted as MEA associated with sinking particles due to the high biomass in the upper layer. When considering the relatively high ambient phosphate concentrations and the long Tn, the high bulk MEA likely resulted from the remineralization of dissolved and particulate organic matters for the acquisition of carbon rather than P. This assumption is supported by previous studies reporting high bulk MEA in nutrient-rich environments such as the deep sea (Koike and Nagata, 1997; Hoppe and Ullrich, 1999) and coastal areas (Taga and Kobori, 1978; Hoppe, 2003; Labry et al., 2016).
Dynamics of Diesters
Distribution and Regional Comparisons of Diester Concentrations
A notable limitation currently exists in the diester methodology: the DEA assay targets semi-labile diester compounds, while the determination of diester concentrations targets a different group of in situ labile diester compounds (Yamaguchi et al., 2019). This discrepancy is inevitably caused by enzyme substrate specificity, as Phosphodiesterase I cannot hydrolyze the artificial fluorescent substrate bis-MUP applied in the DEA assay (Yamaguchi et al., 2019). In contrast, Phosphodiesterase I is known to fully hydrolyze DNA (Suzumura et al., 1998; Turner et al., 2002) and p-nitrophenyl thymidine 5′−monophosphate (Yamaguchi et al., 2019). As a result, the current common enzyme assay would underestimate in situ DEA, and the determined in situ labile diester concentrations are likely to involve nucleic-acid-like diester compounds.
Unlike monoesters, labile diester concentrations were mostly below the detection limit throughout the study area, despite the longitudinal gradient in ambient phosphate concentrations. The diester distribution was therefore assumed to be independent of phosphate, monoesters, and DOP. The observed scarcity of diesters in the study area is possibly due to either or both low production rates or high consumption. Although we lack the actual flux data, diesters were at least assumed to possess potentially high bioavailability (Yamaguchi et al., 2019), based on the shorter Tn of involved nucleic acids (<1 day, Brum, 2005) relative to that of monoesters herein (>4 days). Moreover, the Tn of phosphate in the North Pacific is likely to fall below 1 day when ambient phosphate concentrations are approximately below 10 nM (Björkman et al., 2018). Therefore, labile diesters are possibly the preferential P sources across the transect, regardless of ambient phosphate concentrations.
Our results are consistent with the findings of previous studies in other pelagic regions, with diesters fluctuating at extremely low levels under 40 nM (Table 1; Vidal et al., 2018; Yamaguchi et al., 2019). Diester concentrations are higher in non-pelagic regions, reaching above 230 nM (Table 1; Suzumura et al., 1998; Monbet et al., 2009), and this trend was similar to that of dissolved DNA (Karl and Bailiff, 1989 and references therein) as well as monoesters. Diester concentrations were generally lower than monoester concentrations (Table 1), except in Tokyo Bay (Suzumura et al., 1998), despite their large variability among different aquatic environments. It is therefore necessary to obtain further data to accurately determine the distinct and common features of labile diesters between regions and elucidate the underlying mechanisms.
Distribution of Size-Fractionated DEA
The bioavailability of semi-labile diesters indicated from the DEA assay was substantially lower than those of labile diesters and monoesters, as DEA was generally an order of magnitude lower than MEA. The estimated Tn of semi-labile diesters also exceeded 950 days, which was significantly longer than those of monoesters in this study and nucleic acids (Brum, 2005). Compared with the upregulation of MEA, DEA under low phosphate conditions was considered to be moderately upregulated from the absence of a clear relationship between the bulk DEA and phosphate (Figure 9B). These characteristics as well as the low bioavailability of semi-labile diesters in this study were consistent with previous studies in the North Pacific (Sato et al., 2013; Yamaguchi et al., 2019). However, the biomass-normalized DEA from these studies and the particulate-associated DEA in this study were both stimulated under phosphate-depleted conditions. These results demonstrate the importance of semi-labile diesters as alternative P sources in the subtropical ocean.
The distribution pattern of size-fractionated DEA highlights the differences in the regulation of diesterase and monoesterase. The high dominance of DEAdis in this study suggests that they significantly contribute to the cycling of semi-labile diesters in the subtropical North Pacific. As the upregulation of particulate-associated DEA under phosphate depletion was masked by the fluctuation of DEAdis, the high proportion of DEAdis can therefore be used as a proxy for past P stress – similar to that of MEAdis (Li et al., 1998), although the lifetime of diesterase and their subcellular locations are not yet fully understood.
DEAlarge and DEAsmall were sensitive to the depletion of ambient phosphate concentrations (Supplementary Figure S3); however, their geographical variations were not coupled with those of MEAlarge and MEAsmall, respectively (Figure 8). These results are confusing, as the subsequent hydrolysis of ester bonds by monoesterase to diesterase is essential for the complete removal of P from diesters. In addition, we did not observe a coupling between the distributions of DEAlarge and DEAsmall, indicating that the utilization of semi-labile diesters benefited different microbial communities across the study area. For instance, the notable DEAsmall at Station 2 coincided with a high abundance of picoeukaryotes (Figures 3E, 8G). Although we could not provide a robust explanation for these phenomena, the diesterase regulation appears to be more complex than monoesterase regulation, and we therefore recommend the application of size fractionation in DEA assay to verify on-going P stress in the pelagic oceans and to determine the microbial communities associated with diester utilization.
Conclusion
This study revealed the geographical variability of various dissolved P compounds and alkaline phosphatase activities to assess microbial DOP utilization across a vast region covering the low latitudinal area in the North Pacific Ocean. Our basin-scale observation demonstrated a novel and fundamental characteristic of labile monoester distribution to show a longitudinal variability and depth-dependent profiles, which were most likely regulated by ambient phosphate concentrations. Monoesters were predominantly utilized by large microbes including phytoplankton, although they likely benefited heterotrophic bacteria particularly under phosphate-depleted conditions. Labile diesters were consistently scarce throughout the study area, and the cell-free DEA were significant in the remineralization of semi-labile diesters. While the regulatory mechanisms of phosphoric esters in our study may not be fully applicable to other local oceanic regions, we believe that our findings significantly contribute to the current understanding of marine P cycle and are beneficial for further laboratory and field investigations to elucidate the production processes of phosphoric esters.
Data Availability Statement
The raw data supporting the conclusions of this article will be made available by the authors, without undue reservation.
Author Contributions
TY, MS, FH, HK, TS, and HO designed and conducted the whole experiment. All authors discussed the results.
Funding
This study was funded by the MEXT Grants-in-Aid (24121001, 24121003, and 24121005) and JSPS Grants-in-Aid (16J08143 and 19K24396).
Conflict of Interest
The authors declare that the research was conducted in the absence of any commercial or financial relationships that could be construed as a potential conflict of interest.
Acknowledgments
The manuscript was considerably improved by the constructive comments from reviewers. We are grateful to the captain, crews, and all participants of the KH-17-4 cruise for their cooperation.
Supplementary Material
The Supplementary Material for this article can be found online at: https://www.frontiersin.org/articles/10.3389/fmicb.2020.570081/full#supplementary-material
References
Baltar, F., Arístegui, J., Gasol, J. M., Yokokawa, T., and Herndl, G. J. (2013). Bacterial versus archaeal origin of extracellular enzymatic activity in the northeast atlantic deep waters. Microb. Ecol. 65, 277–288. doi: 10.1007/s00248-012-0126-7
Björkman, K., Duhamel, S., and Karl, D. M. (2012). Microbial group specific uptake kinetics of inorganic phosphate and adenosine-5′-triphosphate (ATP) in the North Pacific Subtropical Gyre. Front. Microbiol. 3:189. doi: 10.3389/fmicb.2012.00189
Björkman, K., and Karl, D. M. (1994). Bioavilability of inorganic and organic phosphorus compounds to natural assemblages of microorganisms in Hawaiian coastal waters. Mar. Ecol. Prog. Ser. 111, 265–274. doi: 10.3354/meps111265
Björkman, K., Thomson-Bulldis, A. L., and Karl, D. M. (2000). Phosphorus dynamics in the North Pacific subtropical gyre. Aquat. Microb. Ecol. 22, 185–198. doi: 10.3354/ame022185
Björkman, K. M., Duhamel, S., Church, M. J., and Karl, D. M. (2018). Spatial and temporal dynamics of inorganic phosphate and adenosine-5′-triphosphate in the north pacific ocean. Front. Mar. Sci. 5:235. doi: 10.3389/fmars.2018.00235
Bogé, G., Lespilette, M., Jamet, D., and Jamet, J. L. (2014). Analysis of the role of DOP on the particulate phosphatase activity in Toulon Bay (N.W. Mediterranean Sea, France). Mar. Pollut. Bull. 86, 342–348. doi: 10.1016/j.marpolbul.2014.06.045
Brum, J. R. (2005). Concentration, production and turnover of viruses and dissolved DNA pools at Stn ALOHA, North Pacific Subtropical Gyre. Aquat. Microb. Ecol. 41, 103–113. doi: 10.3354/ame041103
Bünemann, E. K. (2008). Enzyme additions as a tool to assess the potential bioavailability of organically bound nutrients. Soil Biol. Biochem. 40, 2116–2129. doi: 10.1016/j.soilbio.2008.03.001
Duhamel, S., Björkman, K. M., van Wambeke, F., Moutin, T., and Karl, D. M. (2011). Characterization of alkaline phosphatase activity in the north and south pacific subtropical gyres: implications for phosphorus cycling. Limnol. Oceanogr. 56, 1244–1254. doi: 10.4319/lo.2011.56.4.1244
Duhamel, S., Dyhrman, S. T., and Karl, D. M. (2010). Alkaline phosphatase activity and regulation in the North Pacific Subtropical Gyre. Limnol. Oceanogr. 55, 1414–1425. doi: 10.4319/lo.2010.55.3.1414
Dyhrman, S. T., Chappell, P. D., Haley, S. T., Moffett, J. W., Orchard, E. D., Waterbury, J. B., et al. (2006). Phosphonate utilization by the globally important marine diazotroph Trichodesmium. Nature 439, 68–71. doi: 10.1038/nature04203
Feuillade, M., and Dorioz, J. M. (1992). Enzymatic release of phosphate in sediments of various origins. Water Res. 26, 1195–1201. doi: 10.1016/0043-1354(92)90180-C
Hansen, H. P., and Koroleff, E. (1999). “Determination of nutrients,” in Methods of Seawater Analysis, eds K. Grasshoff, K. Kremling, and M. Ehrhardt (Weinheim: Wiley-VCH), 159–228.
Hashihama, F., Furuya, K., Kitajima, S., Takeda, S., Takemura, T., and Kanda, J. (2009). Macro-scale exhaustion of surface phosphate by dinitrogen fixation in the western North Pacific. Geophys. Res. Lett. 36, 2–6. doi: 10.1029/2008GL036866
Hashihama, F., Kinouchi, S., Suwa, S., Suzumura, M., and Kanda, J. (2013). Sensitive determination of enzymatically labile dissolved organic phosphorus and its vertical profiles in the oligotrophic western North Pacific and East China Sea. J. Oceanogr. 69, 357–367. doi: 10.1007/s10872-013-0178-4
Hashihama, F., Suwa, S., Kanda, J., Ehama, M., Sakuraba, R., Kinouchi, S., et al. (2019). Arsenate and microbial dynamics in different phosphorus regimes of the subtropical Pacific Ocean. Prog. Oceanogr 176, doi: 10.1016/j.pocean.2019.05.007
Hoch, M. P., and Bronk, D. A. (2007). Bacterioplankton nutrient metabolism in the Eastern Tropical North Pacific. J. Exp. Mar. Bio. Ecol. 349, 390–404. doi: 10.1016/j.jembe.2007.06.003
Hoppe, H. (2003). Phosphatase activity in the sea. Hydrobiologia 493, 187–200. doi: 10.1023/A:1025453918247
Hoppe, H. G., and Ullrich, S. (1999). Profiles of ectoenzymes in the Indian Ocean: phenomena of phosphatase activity in the mesopelagic zone. Aquat. Microb. Ecol. 19, 139–148. doi: 10.3354/ame019139
Karl, D. M. (2014). Microbially mediated transformations of phosphorus in the sea: new views of an old cycle. Ann. Rev. Mar. Sci. 6, 279–337. doi: 10.1146/annurev-marine-010213-135046
Karl, D. M., and Bailiff, M. D. (1989). The measurement and distribution of dissolved nucleic acids in aquatic environments. Limnol. Oceanogr. 34, 543–558. doi: 10.4319/lo.1989.34.3.0543
Karl, D. M., and Björkman, K. M. (2015). “Dynamics of Dissolved Organic Phosphorus,” in Biogeochemistry of Marine Dissolved Organic Matter, 2nd Edn, eds D. Hansel and C. Carlson (Amsterdam: Elsevier Inc), doi: 10.1016/B978-0-12-405940-5.00005-4
Karl, D. M., and Tien, G. (1992). MAGIC: a sensitive and precise method for measuring dissolved phosphorus in aquatic environments. Limnol. Oceanogr. 37, 105–116. doi: 10.4319/lo.1992.37.1.0105
Karl, D. M., and Yanagi, K. (1997). Partial characterization of the dissolved organic phosphorus pool in the oligotrophic North Pacific Ocean. Limnol. Oceanogr. 42, 1398–1405. doi: 10.4319/lo.1997.42.6.1398
Kawasaki, N., Sohrin, R., Ogawa, H., Nagata, T., and Benner, R. (2011). Bacterial carbon content and the living and detrital bacterial contributions to suspended particulate organic carbon in the North Pacific Ocean. Aquat. Microb. Ecol. 62, 165–176. doi: 10.3354/ame01462
Koch, M. S., Kletou, D. C., and Tursi, R. (2009). Alkaline phosphatase activity of water column fractions and seagrass in a tropical carbonate estuary, Florida Bay. Estuar. Coast. Shelf Sci. 83, 403–413. doi: 10.1016/j.ecss.2009.04.007
Koike, I., and Nagata, T. (1997). High potential activity of extracellular alkaline phosphatase in deep waters of the central Pacific. Deep. Res. Part II Top. Stud. Oceanogr. 44, 2283–2294. doi: 10.1016/S0967-0645(97)00025-8
Kuenzler, E. J. (1970). Dissolved organic phosphorus excretion by marine phytoplankton. J. Phycol. 6, 7–13. doi: 10.1111/j.1529-8817.1970.tb02349.x
Kuenzler, E. J., and Perras, J. P. (1965). Phosphatases of marine algae. Biol. Bull. 128, 271–284. doi: 10.2307/1539555
Labry, C., Delmas, D., and Herbland, A. (2005). Phytoplankton and bacterial alkaline phosphatase activities in relation to phosphate and DOP availability within the Gironde plume waters (Bay of Biscay). J. Exp. Mar. Bio. Ecol. 318, 213–225. doi: 10.1016/j.jembe.2004.12.017
Labry, C., Delmas, D., Youenou, A., Quere, J., Leynaert, A., Fraisse, S., et al. (2016). High alkaline phosphatase activity in phosphate replete waters: the case of two macrotidal estuaries. Limnol. Oceanogr. 61, 1513–1529. doi: 10.1002/lno.10315
Li, H., Veldhuis, M. J. W., and Post, A. F. (1998). Alkaline phosphatase activities among planktonic communities in the northern Red Sea. Mar. Ecol. Prog. Ser. 173, 107–115. doi: 10.3354/meps173107
Luo, H., Benner, R., Long, R. A., and Hu, J. (2009). Subcellular localization of marine bacterial alkaline phosphatases. Proc. Natl. Acad. Sci. U.S.A. 106, 21219–21223. doi: 10.1073/pnas.0907586106
Mahaffey, C., Reynolds, S., Davis, C. E., and Lohan, M. C. (2014). Alkaline phosphatase activity in the subtropical ocean: insights from nutrient, dust and trace metal addition experiments. Front. Mar. Sci. 1:73. doi: 10.3389/fmars.2014.00073
Martiny, A. C., Lomas, M. W., Fu, W., Boyd, P. W., Chen, Y. L. L., Cutter, G. A., et al. (2019). Biogeochemical controls of surface ocean phosphate. Sci. Adv. 5, 1–10. doi: 10.1126/sciadv.aax0341
Michelou, V. K., Lomas, M. W., and Kirchman, D. L. (2011). Phosphate and adenosine-59-triphosphate uptake by cyanobacteria and heterotrophic bacteria in the Sargasso Sea. Limnol. Oceanogr. 56, 323–332. doi: 10.4319/lo.2011.56.1.0323
Monbet, P., McKelvie, I. D., and Worsfold, P. J. (2009). Dissolved organic phosphorus speciation in the waters of the Tamar estuary (SW England). Geochim. Cosmochim. Acta 73, 1027–1038. doi: 10.1016/j.gca.2008.11.024
Moutin, T., Karl, D. M., Duhamel, S., Rimmelin, P., Raimbault, P., Van Mooy, B. A. S., et al. (2008). Phosphate availability and the ultimate control of new nitrogen input by nitrogen fixation in the tropical Pacific Ocean. Biogeosciences 5, 95–109. doi: 10.5194/bg-5-95-2008
Orrett, K., and Karl, D. M. (1987). Dissolved Organic Phosphorus Production in Surface Seawaters Dissolved organic phosphorus production in surface seawaters1. Limnol. Oceanogr. 32, 383–395. doi: 10.4319/lo.1987.32.2.0383
Paytan, A., and McLaughlin, K. (2007). The oceanic phosphorus cycle. Chem. Rev. 107, 563–576. doi: 10.1021/cr0503613
Perry, M. J. (1972). Alkaline phosphatase activity in subtropical Central North Pacific waters using a sensitive fluorometric method. Mar. Biol. 15, 113–119. doi: 10.1007/BF00353639
Rouco, M., Frischkorn, K. R., Haley, S. T., Alexander, H., and Dyhrman, S. T. (2018). Transcriptional patterns identify resource controls on the diazotroph Trichodesmium in the Atlantic and Pacific oceans. ISME J. 12, 1486–1495. doi: 10.1038/s41396-018-0087-z
Sato, M., Sakuraba, R., and Hashihama, F. (2013). Phosphate monoesterase and diesterase activities in the North and South Pacific Ocean. Biogeosciences 10, 7677–7688. doi: 10.5194/bg-10-7677-2013
Suzuki, R., and Ishimaru, T. (1990). An improved method for the determination of phytoplankton chlorophyll using N, N-dimethylformamide. J. Oceanogr. Soc. Japan 46, 190–194. doi: 10.1007/BF02125580
Suzumura, M., Hashihama, F., Yamada, N., and Kinouchi, S. (2012). Dissolved phosphorus pools and alkaline phosphatase activity in the euphotic zone of the western North Pacific Ocean. Front. Microbiol. 3:99. doi: 10.3389/fmicb.2012.00099
Suzumura, M., Ishikawa, K., and Ogawa, H. (1998). Characterization of dissolved organic phosphorus in coastal seawater using ultrafiltration and phosphohydrolytic enzymes. Limnol. Oceanogr. 43, 1553–1564. doi: 10.4319/lo.1998.43.7.1553
Taga, N., and Kobori, H. (1978). Phosphatase activity in eutrophic Tokyo Bay. Mar. Biol. 49, 223–229. doi: 10.1007/BF00391134
Turner, B. L., McKelvie, I. D., and Haygarth, P. M. (2002). Characterisation of water-extractable soil organic phosphorus by phosphatase hydrolysis. Soil Biol. Biochem. 34, 27–35. doi: 10.1016/S0038-0717(01)00144-4
Vidal, M., Aspillaga, E., Teixidor-Toneu, I., and Delgado-Huertas, A. (2018). Lateral transport of N-rich dissolved organic matter strengthens phosphorus deficiency in western subtropical north atlantic. Glob. Biogeochem. Cycles 32, 1350–1366. doi: 10.1029/2017GB005868
Vidal, M., Duarte, C. M., Agustí, S., Gasol, J. M., and Vaqué, D. (2003). Alkaline phosphatase activities in the central Atlantic Ocean indicate large areas with phosphorus deficiency. Mar. Ecol. Prog. Ser. 262, 43–53. doi: 10.3354/meps262043
Welschmeyer, N. A. (1994). Fluorometric analysis of chlorophyll a in the presence of chlorophyll b and pheopigments. Limnol. Ocean. 39, 1985–1992. doi: 10.1111/j.1540-5931.2009.00571.x
Wu, J., Sunda, W., Boyle, E. A., and Karl, D. M. (2000). Phosphate depletion in the western North Atlantic Ocean. Science 289, 759–762. doi: 10.1126/science.289.5480.759
Yamaguchi, T., Sato, M., Hashihama, F., Ehama, M., Shiozaki, T., Takahashi, K., et al. (2019). Basin-scale variations in labile dissolved phosphoric monoesters and diesters in the central North Pacific Ocean. J. Geophys. Res. Ocean 124, 3058–3072. doi: 10.1029/2018JC014763
Yentsch, C. M., Yentsch, C. S., and Perras, J. P. (1972). Alkaline phosphatase activity in the tropical marine blue-green alga, Oscillatoria erythraea (“Trichodesmium”). Limnol. Ocean 17, 772–774. doi: 10.4319/lo.1972.17.5.0772
Keywords: subtropical ocean, dissolved organic phosphorus, monoesters, diesters, alkaline phosphatase activity
Citation: Yamaguchi T, Sato M, Hashihama F, Kato H, Sugiyama T, Ogawa H, Takahashi K and Furuya K (2021) Longitudinal and Vertical Variations of Dissolved Labile Phosphoric Monoesters and Diesters in the Subtropical North Pacific. Front. Microbiol. 11:570081. doi: 10.3389/fmicb.2020.570081
Received: 06 June 2020; Accepted: 30 October 2020;
Published: 20 January 2021.
Edited by:
Federico Baltar, University of Vienna, AustriaReviewed by:
Karin M. Björkman, University of Hawai‘i, United StatesDavid Michael Karl, University of Hawai‘i, United States
Johanna Sjöstedt, Lund University, Sweden
Copyright © 2021 Yamaguchi, Sato, Hashihama, Kato, Sugiyama, Ogawa, Takahashi and Furuya. This is an open-access article distributed under the terms of the Creative Commons Attribution License (CC BY). The use, distribution or reproduction in other forums is permitted, provided the original author(s) and the copyright owner(s) are credited and that the original publication in this journal is cited, in accordance with accepted academic practice. No use, distribution or reproduction is permitted which does not comply with these terms.
*Correspondence: Tamaha Yamaguchi, eWFtYWd1Y2hpdEBhZmZyYy5nby5qcA==