 Maria Barbara Pisano1
 Antonella Rosa2*
 Danilo Putzu2
 Flaminia Cesare Marincola3*
 Valentina Mossa1
 Silvia Viale1
 Maria Elisabetta Fadda1
 Sofia Cosentino1*
- 1Department of Medical Sciences and Public Health, University of Cagliari, Cagliari, Italy
- 2Department of Biomedical Sciences, University of Cagliari, Cagliari, Italy
- 3Department of Chemical and Geological Sciences, University of Cagliari, Cagliari, Italy
The present study was undertaken to produce probiotic Caciotta cheeses from pasteurized ewes’ milk by using different combinations of autochthonous microbial cultures, containing putative probiotic strains, and evaluate their influence on gross composition, lipid components, sensory properties and microbiological and metabolite profiles of the cheeses throughout ripening process. A control cheese was produced using commercial starter cultures. The hydrophilic molecular pools (mainly composed by amino acids, organic acids, and carbohydrates) were characterized by means of 1H NMR spectroscopy, while the cholesterol, α-tocopherol and fatty acid composition by HPLC-DAD/ELSD techniques. Conventional culturing and a PCR-DGGE approach using total cheese DNA extracts were used to analyze cheese microbiota and monitor the presence and viability of starters and probiotic strains. Our findings showed no marked differences for gross composition, total lipids, total cholesterol, and fatty acid levels among all cheeses during ripening. Differently, the multivariate statistical analysis of NMR data highlighted significant variations in the cheese’ profiles both in terms of maturation time and strains combination. The use of autochthonous cultures and adjunct probiotic strains did not adversely affect acceptability of the cheeses. Higher levels of lactobacilli (viability of 108–109 cfu/g of cheese) were detected in cheeses made with the addition of probiotic autochthonous strains with respect to control cheese during the whole ripening period, suggesting the adequacy of Caciotta cheese as a carrier for probiotic bacteria delivery.
Introduction
A “Functional Food” may be defined as any food with a positive impact on the consumer’s health, physical performance or state of mind in addition to its nutritious value (Karimi et al., 2012). The concept of biofunctional foods is generally used when the beneficial physiological effects are conferred by microorganisms (Gobbetti et al., 2010). These effects may derive from the interactions of ingested living microorganisms with the host (probiotic effect), and/or the ingestion of the microbial metabolites produced during fermentation (bioactive effect) (Linares et al., 2017). Lactic acid bacteria (LAB) play a multifunctional role in fermented foods that is not limited to the transformation of substrate and product preservation, but it is also related to the improvement of nutritional value and organoleptic characteristics as well as functional properties because of bioactive molecule production. LAB are generally considered beneficial microorganisms with some strains considered “probiotics.”
Probiotics, as part of functional foods, are a growing area of scientific interest for their role in maintaining a healthy intestinal ecosystem. They are bacteria, generally lactobacilli and bifidobacteria, but also enterococci and yeasts, associated with a plethora of health beneficial effects (Franz et al., 2011; Albenzio et al., 2013; Saad et al., 2013; Perotti et al., 2014; Merchàn et al., 2020). Probiotic food is a processed product which contains in a suitable matrix and in sufficient concentration viable probiotic microorganisms that must be able to survive in the gastrointestinal tract (Saxelin et al., 2003). Populations of at least 107 CFU/g in the final product have been suggested as therapeutic quantities of probiotic cultures in different processed foods (Talwalkar and Kailasapathy, 2004; Karimi et al., 2012).
In the last decade, the interest in dairy products containing specific microbial strains with potential health-promoting properties has heightened. Cheese is one of the most common carriers used to efficiently deliver living probiotic microorganisms because it shows a good buffering capacity, generating a more favorable environment for probiotic survival throughout gastric transit (Castro et al., 2015; Homayouni et al., 2020). Several studies have addressed the development of probiotic cheeses including Cheddar (Zhang et al., 2013), Argentinean ovine cheese (Perotti et al., 2014) Scamorza (Albenzio et al., 2013) and Ricotta (Sameer et al., 2020).
Among the major challenges associated with the use of probiotic cultures for the production of functional cheeses are their ability to survive the technological hurdle during processing and ripening and their safety for human (Karimi et al., 2012; Castro et al., 2015). Furthermore, their introduction should not negatively affect the expected sensory characteristics (flavor, texture, and appearance) and biochemical composition of cheeses (Karimi et al., 2012; Sabikhi et al., 2014). In general, the incorporation of probiotic bacteria should not imply a loss of overall quality of the product.
Lactobacillus strains used as probiotics are generally of human or animal origin. However, several studies showed that strains with potential probiotic properties are also found in dairy products and other non-dairy fermented foods (Zielińska and Kolożyn-Krajewska, 2018). So far, many lactobacilli isolated from good quality artisanal raw milk cheeses have been selected on the basis of their functional properties and used along with standard or autochthonous starter cultures in the manufacturing process of different cheese types to improve and enhance their sensory quality (Randazzo et al., 2008; Guarrasia et al., 2017).
Presently, the use of probiotic yeasts is still scarce, despite their common presence in several fermented foods where they are actively involved in the production of aroma components and inhibition of spoilage bacteria (Fleet, 2007; Tofalo et al., 2019). On this basis, several yeast species have been extensively used as adjunct cultures to enhance flavor formation in certain cheese varieties (Centeno et al., 2017). The most important role of yeasts in cheese ripening is related to the increase of pH due to the metabolization of lactate and alkaline metabolite formation.
The technological, probiotic and bioactive potential of these putative probiotic strains should be evaluated in situ by analyzing their interactions in terms of cheese composition, physical chemical characteristics, nutrient availability, viability and biomolecules production.
Caciotta is as a semi-soft cheese with a short-medium ripening time produced from pasteurized whole cow’s, ewe’s or goat’s milk, and represent one of the most common traditional Italian cheese variety. “Caciotta sarda” is produced from December to July throughout the Sardinian territory using Sardinian sheep’s milk. The shape is cylindrical and the weight varies from 1 to 2.2 Kg. The milk is pasteurized, cooled to 36°C and coagulated with the addition of calf rennet and commercial microbial starter.
The organoleptic characteristics of this cheese type can vary as a function of the production area, the ripening time and the milk used (Gobbetti et al., 2018). Since the ripening time generally varies from 15–20 days to 2–6 months, milk pasteurization is needed to eliminate any pathogenic bacteria possibly present in raw milk (Aquilanti et al., 2011). On the other hand, pasteurization causes the loss of indigenous LAB species relevant for fermentation and ripening process. Therefore, in order to standardize the production while preserving at the same time the unique characteristics of this typical cheese variety, the addition of selected autochthonous adjunct cultures appears as a most efficient tool, as reported in other studies (Fusco et al., 2019; Bancalari et al., 2020; Calasso et al., 2020). The use of autochthonous starter cultures has already been proved to be an effective mean for standardizing the production of raw milk cheeses at the same time positively affecting their quality (Silvetti et al., 2017; De Pasquale et al., 2019; Dolci et al., 2020). When applying pasteurization to reduce cheese defects, the addition of selected LAB strains is of particular relevance for reconstituting the original microflora responsible for the typicality of traditional products, as shown by other authors for Caciotta cheese (Turchi et al., 2011; Bancalari et al., 2020).
In this work, we used a multidisciplinary approach to investigate the influence of adjunct cultures, containing autochthonous putative probiotic Lactobacillus and yeast strains, on the chemical and microbiological composition and sensory properties of industrially produced ewe’s milk Caciotta cheese throughout a ripening period of 60 days. For the sake of comparison all analyses were performed also on Caciotta made with commercial starter cultures used as control.
Materials and Methods
Microbial Strains and Cheese Manufacture
As reported in Table 1, three types of experimental Caciotta cheeses (C1, C2, C3) were made using three different combinations of autochthonous adjunct cultures, containing putative probiotic Lactobacillus and yeast strains coupled with starter cultures represented by autochthonous L. lactis subsp. lactis or Enterococcus faecalis strains, selected on the basis of their technological characteristics and safety properties needed for the application as functional starter cultures (Cosentino et al., 2002, 2004; Pisano et al., 2015). The Lactobacillus and yeasts strains used in this study were previously tested for some in vitro functional properties associated with probiotic features in view of their use in cheese production as adjunct cultures (Pisano et al., 2008, 2014; Fadda et al., 2004, 2017). The main features of the autochthonous strains used in this study have been reported in Supplementary Table 1 in Supplementary Material. A control cheese (CC) was produced using a commercial starter culture (L. lactis Lyoto MO540 and MO536, Sacco, Italy). All cheeses were manufactured by a dairy plant (Argiolas Formaggi, Dolianova, Cagliari, Italy) according to their Caciotta production protocol.
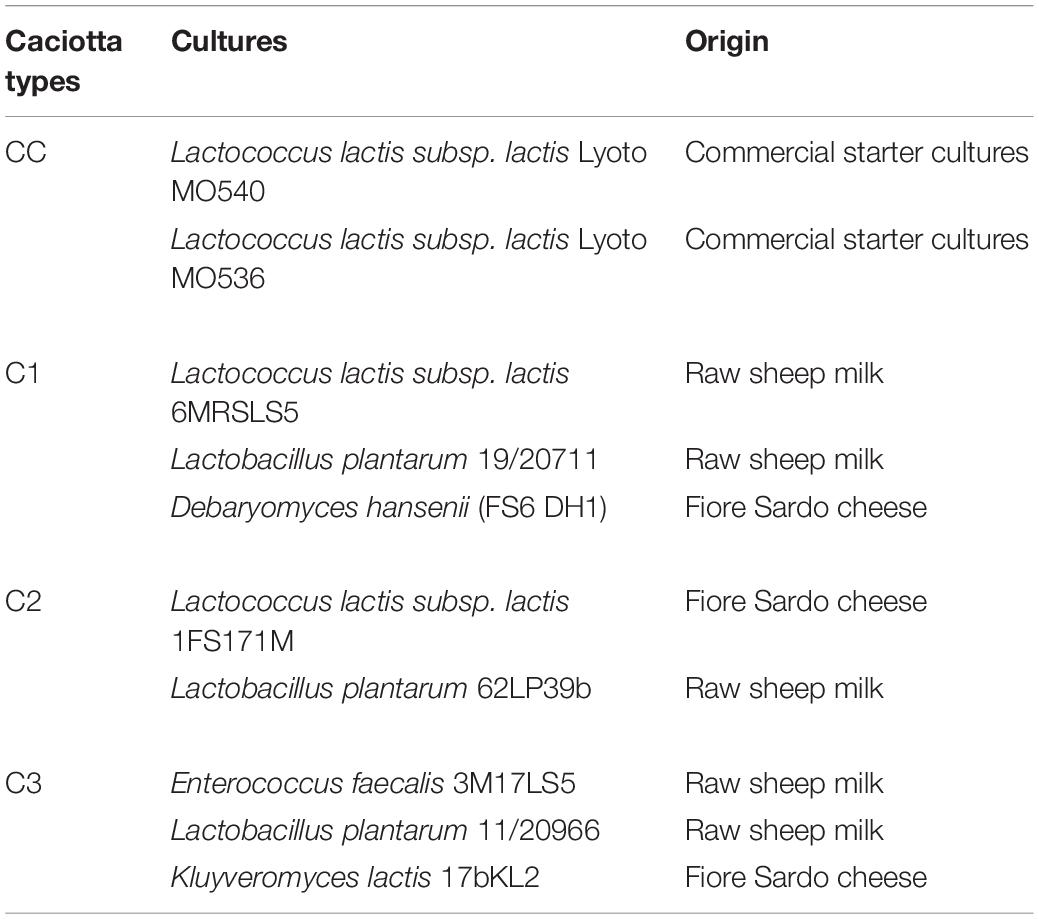
Table 1. Starter and putative probiotic cultures used in the manufacturing of ovine Caciotta cheeses.
The autochthonous LAB strains were maintained at −20°C in MRS or M17 broth (Microbiol, Cagliari, Italy) with sterile 15% (v/v) glycerol (Microbiol) as cryoprotector in the microbial collection of the Department of Medical Sciences and Public Health. Fresh cultures were prepared in autoclaved sterile skimmed milk after two consecutive transfers in MRS or M17 broth (1% inoculum) incubated at 30°C in aerobic conditions for 18 h. Yeasts strains were maintained in YEPD (Yeast Extract Peptone Dextrose, Microbiol) with 20% (w/v) glycerol. The strains used in combination did not produce antibacterial substance against each other (data not shown).
Overall, four Caciotta cheese-making trials were carried out in four different days. In each trial two cheese batches were simultaneously produced from two vats of the same pasteurized ewes’ milk using two different starter combinations (commercial starter or autochthonous starter containing putative probiotic strains as adjunct) for a total of eight cheeses batches, so two independent experiments were made in different days for each strains combination (Supplementary Figure 1 in Supplementary Material). To prepare the inoculum for cheese making, the strains were inoculated in pasteurized ovine milk incubated at 30°C for 18–24 h and added to vat milk at a level of 107, 105 and 104 cfu/mL for LAB, Kluyveromyces and Debaryomyces species, respectively.
The chemical composition of raw ewe’s milk used for cheese-making was 6.43% fat, 5.58% protein, 4% lactose, and the pH measured at 6.7. After pasteurization (72°C for 20 s), milk in each vat (150 L) was cooled at 37°C and inoculated with starter and adjunct cultures. After 30 min of resting time, rennet was added to the milk (1:50000) and coagulation took place at 37°C within 20 min. The curds were cut and left to rest for 10 min. Then, the curd pieces were hand pressed into molds for whey drainage (30°C, 85–90% of humidity). After brine salting for 12–16 h (23% °Be), the cheeses were transferred to a ripening chamber and stored 2 months at 12–15°C and 85% relative humidity. The weight of the cheeses was about 1.5 kg, diameter was 20 cm, and height was 15 cm. Samples were taken for all analysis at 1, 15, 30, and 60 days after production. The cheeses were sent to the laboratory under refrigeration (ca. 4°C) and were either analyzed immediately or frozen, depending on the assays.
Compositional Analysis
Chemical composition (fat (wet weight), fat (dry weight), protein, salt and moisture) was determined by a FoodScanTM Lab Dairy Analyser type 78810 (Foss, Hillerød, Denmark) by the dairy plant laboratory. The pH of the milk and the homogenized cheese samples (10 g in 10 ml of distilled water) was measured with a HI8520 pH meter (Pool Bioanalysis Italiana, Milan, Italy). Water activity (aw) was determined using a PAWKIT water activity meter (Decagon Devices, Pullman, WA, United States) in accordance with the manufacturer’s instructions. All determinations were made in duplicate.
Microbiological Analyses
At each sampling point a slice from a full piece of cheese (ca. 200 g) was sampled, then triplicate aliquots of 10 g were added to 90 mL of 2% (w/v) sodium-citrate sterile solution and homogenized in a Stomacher Laboratory Blender (Pool Bioanalysis Italiana, Milan, Italy) for 2 min at normal speed. Decimal dilutions were prepared in sterile 0.1% (w/v) peptone solution and spread onto the surface of the different agar media. Total mesophilic aerobic microbiota was enumerated using the pour plate method on Plate Count agar (PCA, Microbiol, Cagliari, Italy) incubated at 30°C for 48–72 h. Enterobacteriaceae and E. coli were determined on Violet Red Bile Glucose agar (VRBGA, Microbiol) and Triptone Bile X-gluc agar (TBX, Microbiol), respectively, using the pour plate method. VRBG and TBX plates were covered with a layer of the same culture medium before incubation at 37°C and 44°C for 24 h, respectively. Lactococci and enterococci were counted in M17 and KF agar (Microbiol) supplemented with 1% TTC, incubated at 30 and 37°C for 48 h, respectively. For the enumeration of lactobacilli, MRS agar acidified at pH 5.4 with glacial acetic acid incubated at 30°C in microaerophilic conditions for 48 h was used. Coagulase positive staphylococci were counted on Baird-Parker egg-yolk-tellurite agar (Microbiol) incubated at 37°C for 48 h. Black colonies with or without the typical clearing of the egg yolk were tested for catalase-positivity, mannitol fermentation and coagulase production by the tube coagulase test. Yeasts and molds were enumerated in Potato Dextrose agar (PDA, Microbiol) plates containing 0.1 g/L cloramphenicol incubated at 25°C for 5 to 20 days.
DNA Extraction From Cheese Samples
Total DNA was extracted directly from samples collected during cheese making and ripening. At each sampling point a slice from a full piece of cheese (ca. 200 g) was sampled and a 25 g aliquot was homogenized in 225 mL of sodium citrate (pH 7.5), using a Stomacher for 3 min, then 1 mL of the homogenate was incubated for 30 min at 45°C in a dry Thermo-block heater (Asal, Milan, Italy). After the addition of equal volume of absolute ethanol, the samples were centrifuged at 10000 × g for ten min. The pellets were resuspended in 200 μL lysis buffer (200 mM Tris–HCl, pH 8.0, 250 mM NaCl, 25 mM EDTA, SDS 0.5% w/v) and 18 μL of proteinase K solution (2 mg/mL, Sigma) were added. The sample was vigorously vortexed and incubated for 60 min at 65°C before addition of 20 μL 2.5 M potassium acetate (Sigma). The resulting mixture was placed on ice for 2 h before centrifugation at 12.000g for 30 min. Two hundred microliters of the supernatant were transferred to a new tube and an equal volume of 2-propanol (Sigma) was added to precipitate nucleic acids. Nucleic acids were extracted in the aqueous phase by centrifugation at 12000 × g (5′, 4 °C) by adding 750 μL of SEVAG (Chloroform: isoamilic alcohol 24:1). The resulting DNA solution was precipitated with 70% ethanol by centrifugation at 12000 (4°C, 30 min), air-dried and resuspended in 100 μL of TE (10 mMTris–Cl, pH 8.0, 1 mM EDTA). DNA concentration and purity were checked by optical density at 260 nm and ratio O.D. 260 nm/280 nm determinations, respectively.
PCR Amplification of 16S and 26S rDNA Sequences and DGGE Analyses
For DGGE analysis, the universal primers F357 (5′-TACGGGAGGCAGCAG -3′) with the GC clump and R 518 (5′-ATTACCGCGGCTGCTGG-3′) (Muyzer et al., 1993) were used to amplify the V3 region of 16S rRNA. Yeast DNA amplifications were carried out using primers NL1 (5′-GCA TAT CAA TAA GCG GAG GAA AAG-3′), with the GC clamp and LS2 (5′-ATT CCC AAA CAA CTC GAC TC-3′) (Cocolin et al., 2000). Amplification reactions were performed in a Mastercycler gradient 5331 (Eppendorf) in a final 50 μL reaction mixture volume each containing 1 × PCR buffer, 2.5 mM MgCl2, 200 μM dNTPs, 0.2 mM primer, 2.5 U of Taq DNA polymerase (Sigma), and 10 μL of template DNA. PCR products were routinely checked for positive amplification on 1.8% w/v agarose gels prior to further DGGE analysis.
PCR products were analyzed by DGGE using a Bio-Rad D-codeTM apparatus (Bio-Rad Laboratories) on 20 cm × 20 cm × 1 mm gel. Parallel electrophoresis was performed in 1 × TAE at 60 °C, employing 8% polyacrylamide gels with a denaturing range of 40–60%. The gels were run for 16 h at 75 V. Bands were visualized under UV light after staining with ethidium bromide (0.5 mg mL–1), and photographed under UV trans-illumination. A ladder consisting of an amplicon mix of the different species used as starter and adjunct probiotic cultures in the manufacturing of caciotta cheeses was created in order to monitor their presence throughout ripening.
Sensory Analysis
Descriptive sensory profile of 60 days-ripened cheeses was carried out by a panel of six assessors trained in the sensory analysis of Caciotta cheeses produced in Sardinia. The experimental and control cheeses were evaluated for their general appearance, odor intensity, taste (acid, sweet, bitter, salty) aroma intensity, texture (intensity of elasticity, firmness, solubility, granularity) and overall acceptability, using 7-point category scale, ranging from 1 (low or poor) to 7 (high or excellent). The panelist had no information about the experimental design. All cheeses were kept at 20°C for 1 h before starting the test, coded with a three-digit code number and presented in random order.
Extraction and Saponification of Caciotta Cheeses Lipids
Total lipids (TL) were extracted from portions of grated cheese samples (100 mg, in triplicate) by the Folch procedure (Folch et al., 1957), using the mixture chloroform:methanol:water 2:1:1 (v/v/v) as previously reported (Rosa et al., 2015). The chloroform fraction (lipid extract) from each sample was separated from the methanol/water mixture and dried down under vacuum. The dried lipid fractions, dissolved in ethanol, were subjected to mild saponification as previously reported (Rosa et al., 2015, 2017) for the separation of lipid components. The unsaponifiable (total cholesterol and α-tocopherol) and saponifiable (FA) fractions were collected, the solvent evaporated, and a portion of the dried residues was injected into the high-performance liquid chromatograph (HPLC) (Rosa et al., 2015, 2017). An external standard mixture (containing 1 mg of triolein, trilinolein, and cholesterol) was processed as samples to calculate the fatty acid and cholesterol recovery during saponification.
Analyses of Fatty Acids, Cholesterol, and α-Tocopherol in Caciotta Cheeses
Analytical standards of FA, cholesterol, trilinolein, triolein, α-tocopherol, conjugated (9Z,11E)-linoleic acid (CLA), and all solvents used, of high purity, were purchased from Sigma–Aldrich (Milan, Italy). All the chemicals used in this study were of analytical grade.
Analyses of lipid components were carried out with a 1100 liquid chromatograph (Agilent Technologies, Palo Alto, CA, United States) equipped with a diode array detector (DAD) and an Infinity 1260 evaporative light scattering detector (ELSD). Total cholesterol (detected at wavelength of 203 nm) and α-tocopherol (at 292 nm) were measured with an Inertsil ODS-2 column and methanol as the mobile phase (at flow rate of 0.7 mL/min) as previously reported (Rosa et al., 2015, 2017). Analyses of FA (unsaturated were detected at 200 nm and with ELSD, saturated with ELSD) were carried out with a XDB-C18 Eclipse, with a mobile phase of acetonitrile/water/acetic acid (75/25/0.12, v/v/v), at a flow rate of 2.3 mL/min as previously reported (Rosa et al., 2015, 2017). The temperature of the column was maintained at 37°C. ELSD detector settings were: evaporator temperature 40°C, nebulization temperature 40°C, with nitrogen as the nebulizing gas at a flow of 1 L/min. The FA identification and quantification were performed using standard compounds and the Agilent OpenLAB Chromatography data system as previously described (Rosa et al., 2015, 2017). Calibration curves of the lipid compounds were found to be linear (DAD) and quadratic (ELSD), with correlation coefficients > 0.995.
NMR Analysis
A total of 96 samples were prepared for metabolomics analysis (2 trials × 4 added culture mixtures × 4 time points × 3 replicates). At each ripening time, a slice of cheese (ca. 300 mg) was sampled. Cheese was removed from 1 cm of the crust, freeze dried and then powdered in a ceramic mortar with a pestle. A methanol-chloroform-water extraction was performed for each cheese sample in triplicate as previously reported (Piras et al., 2013). The methanol/water fraction was separately collected, dried in vacuum at room temperature by using an Eppendorf concentrator 5301 (Eppendorf AG, Hamburg, Germany), and then stored at −80 °C. Prior to 1H NMR analysis, the hydrophilic metabolites were dissolved in 700 μL of a D2O solution containing 0.80 mM sodium 3-trimethylsilyl-(2,2,3,3-d4)-1-propionate (TSP) used as internal standard. The pH of the final sample was adjusted to 4.00 ± 0.05 by adding small amounts of NaOD or DCl. Then, an aliquot of 650 μL was transferred into a 5 mm NMR tube.
1H NMR spectra were recorded on a Varian UNITY INOVA 500 spectrometer operating at 499.839 MHz. Experiments were carried out using the standard Varian PRESAT pulse sequence. For each experiment, 256 scans were collected into 32 k data points at 300 K over a spectral width of 6000.6 Hz with a 90° pulse, an acquisition time of 2.5 s, and a relaxation delay of 4 s. A presaturation technique with low power radiofrequency irradiation for 2 s was applied to suppress the residual water signal. The FIDs were multiplied by an exponential weighting function equivalent to line broadening of 0.3 Hz prior to Fourier transformation. 1H NMR chemical shifts were referenced to TSP (δ 0.0 ppm). The assignment of NMR peaks was performed according to literature data (Piras et al., 2013), the Food Database,1 and Chenomx NMR suite 8.1 software (evaluation version, Chenomx, Edmonton, AB, Canada).
All spectra were phased and baseline corrected using MestReNova (Version 14.0, Mestrelab Research SL, Santiago de Compostela, Spain). Correction for minimal misalignments in chemical shift, mainly due to pH-dependent signals, was done before deleting the regions containing the residual water and internal standard TSP signals, and segmenting the NMR spectra into intervals (bins) with equal width of 0.0025 ppm over a chemical shift range of 0.5–9.5 ppm. Bins were then normalized to the sum of total spectral area to compensate for the overall concentration differences.
Statistical Analyses
Data on compositional, microbiological and sensory analyses were analyzed using the software GraphPad Prism Statistics software package version 5.00 (GraphPad Prism Software Inc., San Diego, CA, United States). Means were compared by one-way analysis of variance (One-way ANOVA) using Bonferroni Multiple Comparisons Test. The data on sensory analyses were analyzed by Kruskal-Wallis test in order to detect any significant differences between the organoleptic profiles of the cheeses. A difference of P < 0.05 was considered significant.
Multivariate statistical analysis (MVA) of the NMR-data set was conducted by using SIMCA version 16.0 (Umetrics, Umea, Sweden). Prior to MVA, data were Pareto scaled. An explorative principal component analysis (PCA) was first performed to overview the variability of data and possible trends of groups (Bro and Smilde, 2014). The performance of the PCA model was evaluated using the coefficients R2 and Q2, defined as the proportion of variance in the data explained and predictable by the model, respectively. To investigate the relationship between the Nuclear magnetic resonance (NMR) spectral profile of cheeses and the ripening time, orthogonal partial least squares (OPLS) was applied (Trygg and Wold, 2002). OPLS is an extension of PLS that splits the systematic variation in the X block into two parts, one that models the correlation between X and Y (predictive) and another that shows the systematic X variation not related (orthogonal) to Y. The complexity of the model is reduced by orthogonalization since the systematic variation in the X matrix not correlated with Y is removed. Orthogonal projections to latent structure-discriminant analysis (OPLS-DA) was employed in a pair-wise comparison to discriminate groups (classes) of cheeses at 60 days of ripening (Bylesjo et al., 2006). The quality of OPLS and OPLS-DA models was evaluated by R2Y and Q2Y, i.e. the fraction of the variation of Y-variable and the predicted fraction of the variation of Y-variable, respectively. Permutation test was used to assess the reliability of models and CV-ANOVA (Cross-Validation Analysis Of Variance) test to evaluate their significance. Potential variables that are statistically significant were selected by analyzing the S-line correlation coefficient plot that is tailor-made for NMR spectroscopy data: peaks with positive (negative) intensity belong to the most abundant metabolites in the group on the right (left) side of the scores plot; peak in warm colors belong to metabolites that contribute more significantly to the class separation than do the metabolites associated with signals in cool colors. Variables were selected according to a p(corr) ≥|0.5| and p(cov) ≥|0.05| The correlation coefficient p(corr) value refers to the credibility of the contribution of the variable in the mathematical model, while p(cov) represent the modeled covariation.
Results and Discussion
Physico-Chemical Composition of Caciotta Cheese During Ripening
The physico-chemical compositions (pH, aw, moisture, fat, fat DM, salt, protein) of experimental and control Caciotta cheeses at 1, 15, 30, and 60 days of ripening are reported in Table 2. The pH evolution over the 60 day of ripening varied among cheese types: the mean values initially decreased up to 15 (in C1 and C3) or 30 (in CC and C2) days of ripening, then increased at 60 days in all cheeses. Although no significant differences were observed among cheese types, a faster increase in pH (from 30 to 60 days of ripening) was recorded in cheeses produced with adjunct probiotic strains compared to the control (ΔpH CC: 0.1; ΔpH C1, C2, C3: 0.41, 0.69, 0.91, respectively). The highest pH value observed in C3 at the end of maturation could be related to both the proteolysis during ripening and the lactic acid utilization by the yeasts strain K. lactis used as adjunct in the manufacturing of the cheese (Fadda et al., 2004). The mean water activity (aw) of all cheeses decreased during ripening, achieving values around 0.94–0.96 at 60 days, with no significant differences (P > 0.05) among the batches. Aw is a key factor in maintaining probiotic viability in the final products and the values observed in our study are unlikely to affect the viability and growth of the potential probiotic strains, since Lactobacillus, Debaryomyces hansenii and Kluyveromyces lactis species have been shown to possess stability in low water activity and maintain their viability in different low moisture foods (Tapia et al., 2007; Marcial-Coba et al., 2019).
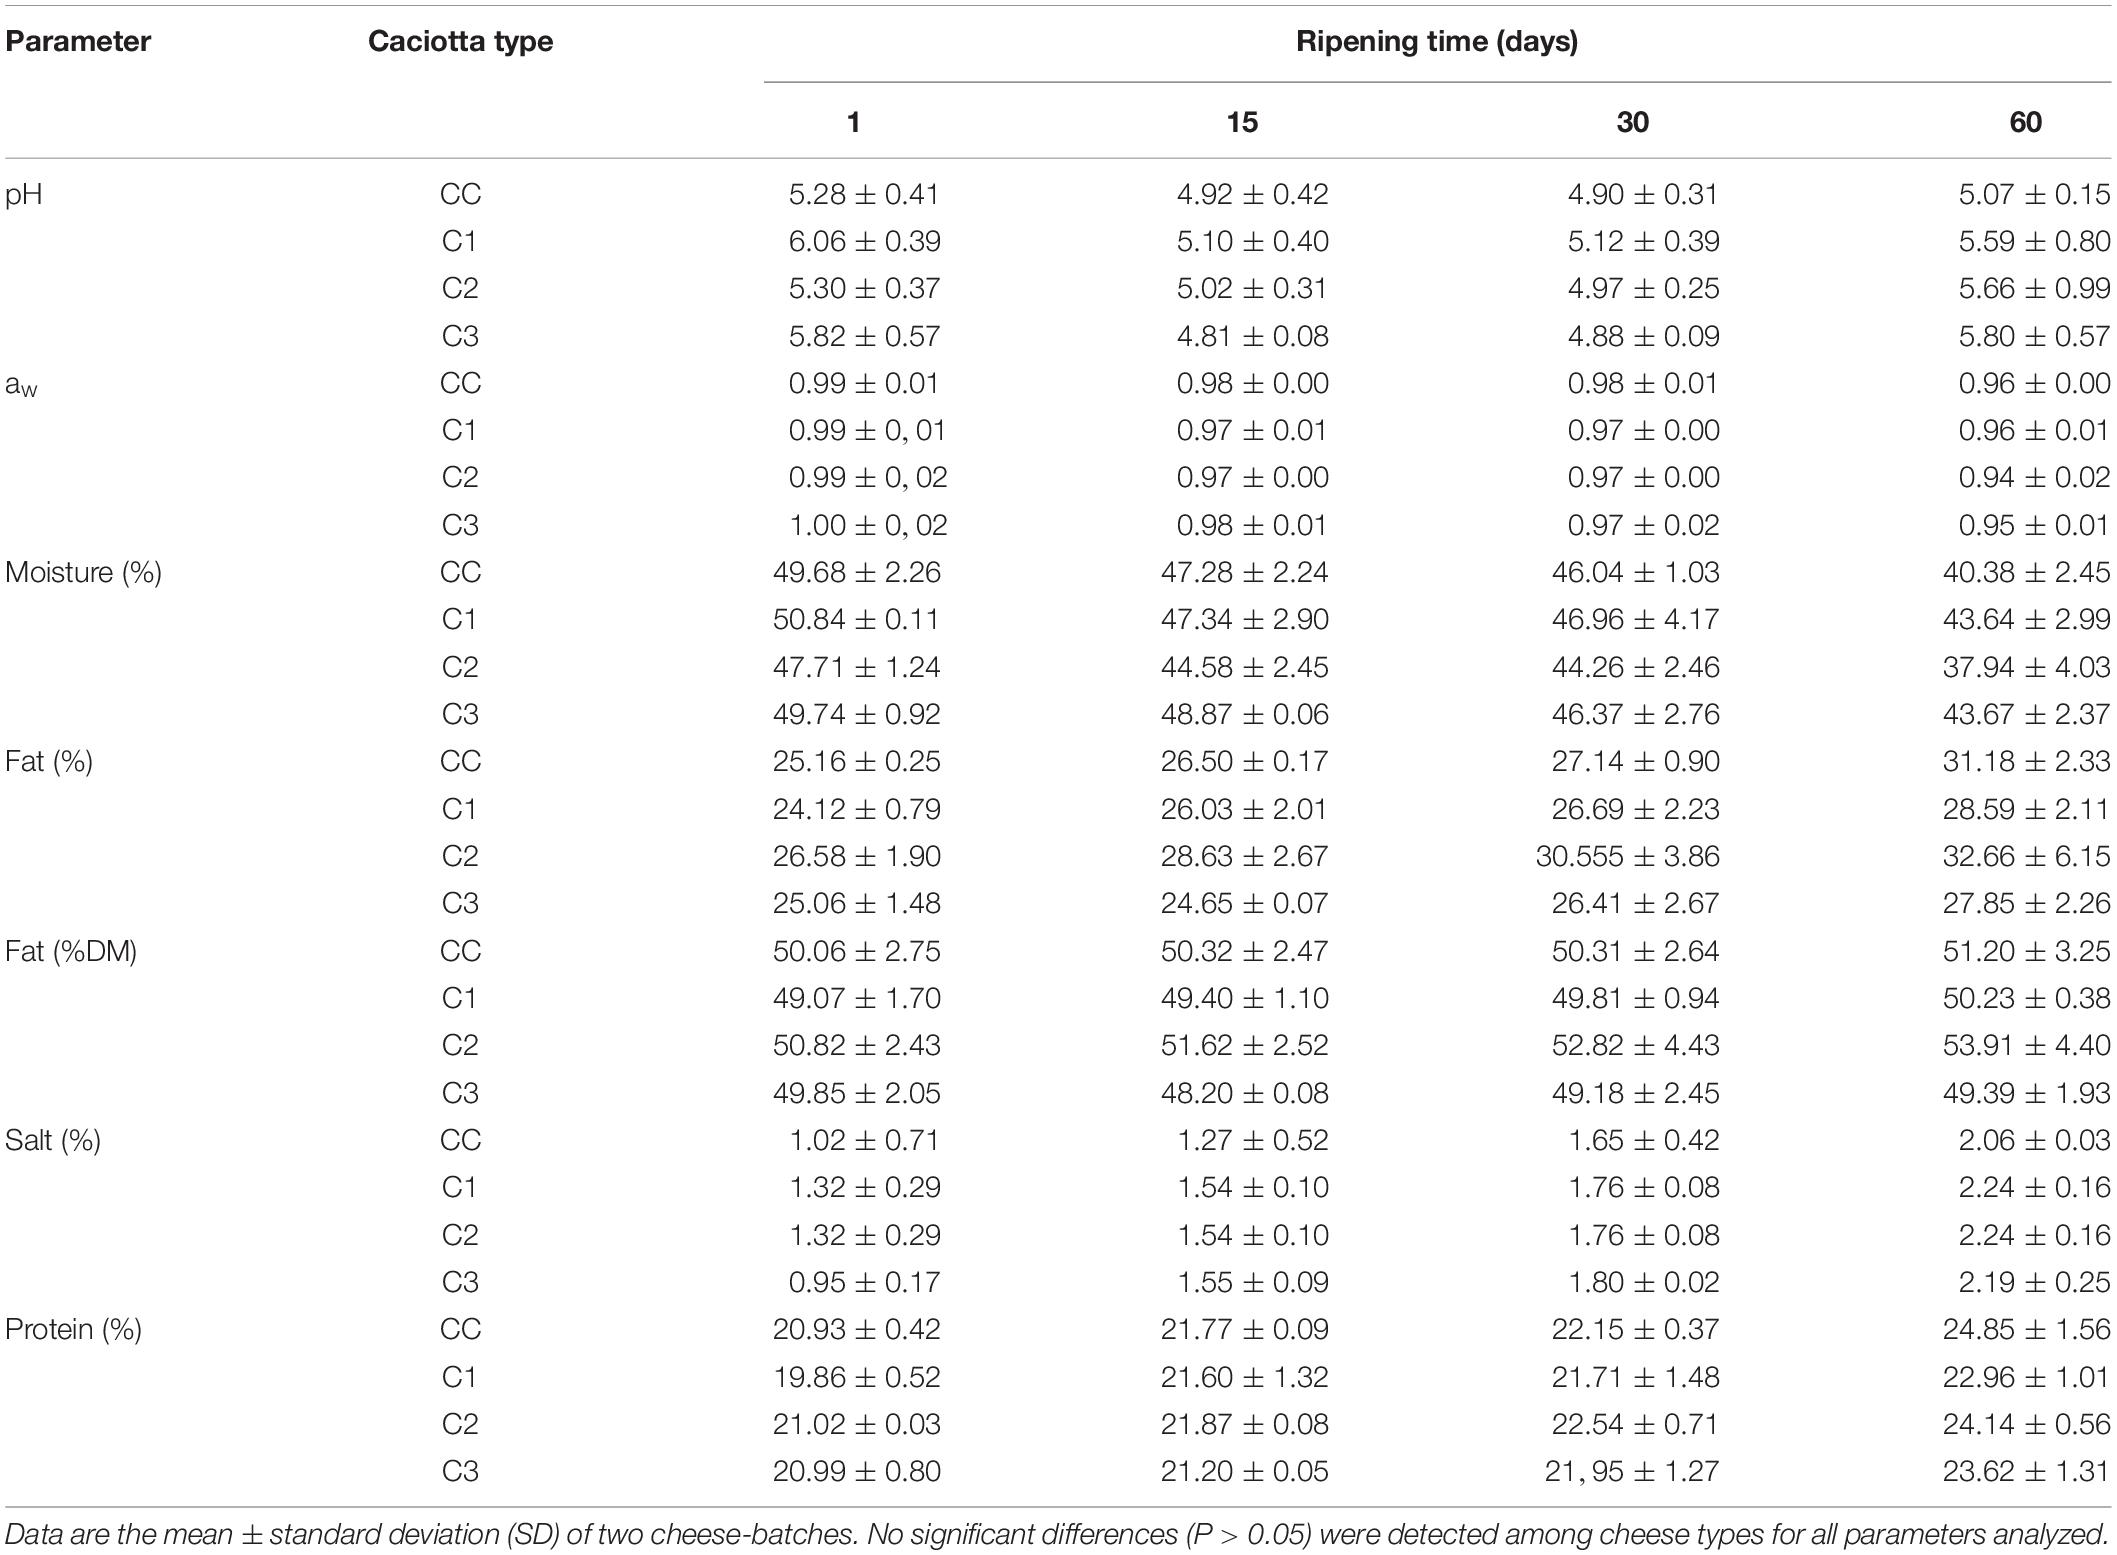
Table 2. Physico-chemical characteristics of ovine Caciotta cheeses during ripening.
With regard to the compositional parameters, no significant differences (P > 0.05) were detected between the control and the experimental cheeses. The mean values of fat, protein and salt increased during ripening, coupled with a decrease in the moisture mean content in all cheese types, in agreement with previous results (Pisano et al., 2007; Buccioni et al., 2012). At day 60, the composition of cheeses was found within the range of other Italian ewes’ milk cheeses (Coda et al., 2006). It has been previously observed that the addition of probiotic microorganisms did not affect the main compositional parameters (moisture, salt, fat and protein contents) of different cheese types (Zhang et al., 2013; Perotti et al., 2014; Terpou et al., 2018), and did not negatively influence the ripening process of Edam cheese (Sabikhi et al., 2014).
Microbiota Analysis
In all the analyzed cheese samples, the overall hygienic quality was evaluated by the determination of microbial hygiene indicators Enterobacteriaceae and coagulase positive staphylococci, which were always under the detection limit (< 10 cfu/g and < 100 cfu/g, respectively) (data not shown). It has been demonstrated that efficient starter culture and/or an enforcement by an adjunct is essential to achieve a fast pH decrease, thus contributing to control these undesired microorganisms (Terpou et al., 2018).
The viable counts of LAB and yeasts are shown in Table 3. The numbers of presumptive lactococci were high throughout the ripening and did not significantly differ (P > 0.05) among all samples, presumably due to the use of the same type and amount of starter cultures. The presence of lactococci in C3 cheeses (where no lactococcal strain was included in the starter) may be due to secondary contamination considering that they are widely used as starter in cheese productions and taking into account their ability to colonize and adapt to different substrates in the dairy plant (Calasso et al., 2016). As expected, in experimental cheeses, the use of Lactobacillus strains as adjunct cultures significantly increased the population of lactobacilli as compared to the control. Moreover, lactobacilli increased their numbers until 60 days of ripening. Similar results were observed in studies involving the use of autochthonous LAB in cheese making (Piras et al., 2013; De Pasquale et al., 2019; Fusco et al., 2019). The counts of presumptive enterococci were higher in C3 cheese, where E. faecalis strain was present in the starter culture, with mean values ranging from 105 to 107 cfu/g, while in the other cheese types they showed mean concentrations from 102 cfu/g in curd to about 105 cfu/g at the end of ripening, in agreement with other studies (Giraffa, 2003; Piras et al., 2013; Fuka et al., 2017; Hanchi et al., 2018). With respect to yeast viable counts no marked differences were observed between the cheeses with the exception of C3, produced with an adjunct autochthonous probiotic K. lactis strain, that showed during manufacturing and ripening counts higher than both CC and C2 (produced without probiotic yeast) and C1 cheese, even though the latter was produced with the addition of the yeast D. hansenii. The yeast counts found in C3 cheese throughout maturation are in line or lower than those reported in others studies where yeast strains have been used as co-starter or adjunct in the production of cheeses (Lanciotti et al., 2005; De Freitas et al., 2008; Pereira Andrade et al., 2019). The similar yeast counts observed in control, C1 and C2 cheese could be related to the addition of the species Geotrichum candidum routinely used together with Penicillium candidum by the dairy plant as protective cultures in the cheese-making, in order to prevent or limit the growth of spoilage fungi in the cheese rind. To the best of our knowledge this is the first study reporting the use of autochthonous yeast strains with potential probiotic properties as an adjunct for the production of cheese.
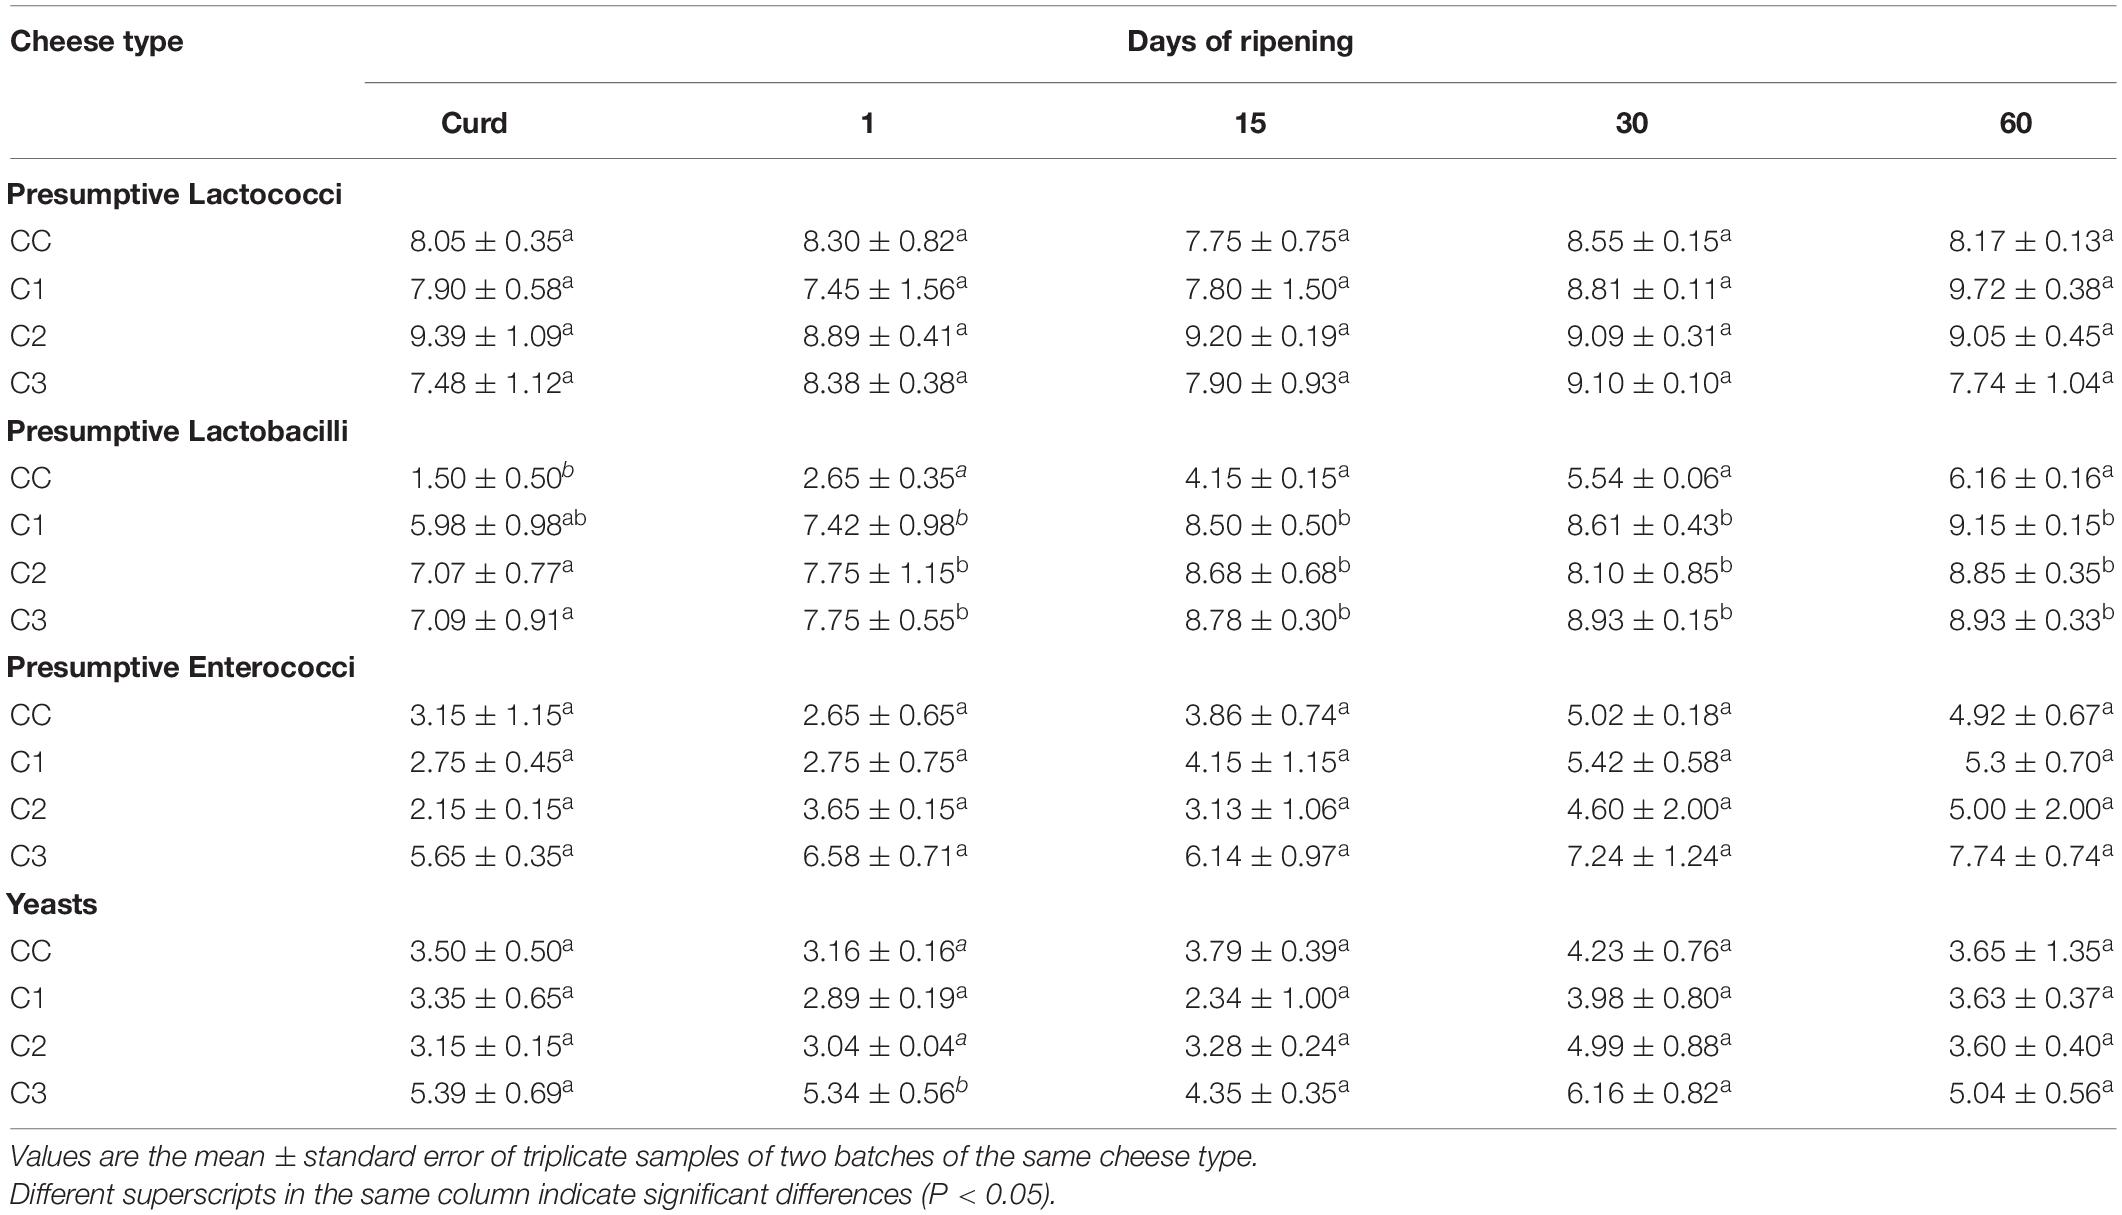
Table 3. Viable counts (Log ufc/g) of presumptive lactococci, lactobacilli, enterococci and yeasts during manufacturing and ripening of control and experimental Caciotta cheeses.
The colonies counted as presumptive lactococci, lactobacilli, enterococci and yeasts were randomly selected and identified by biochemical and molecular means, confirming their belonging to the inoculated species, the exception being D. hansenii that was not recovered in any of C1 samples and the presence of E. faecalis in CC and E. faecium in the other cheese types (data not shown). In general, the isolation of a varied microbiota in cheese is not unexpected since cheeses and related dairy environment (such as equipment, tanks, ripening rooms) are characterized by a complex microbiota that inevitably interact with the bacteria from milk and starter culture during cheese production (Montel et al., 2014).
In addition to the cultural analyses, a culture-independent approach using PCR-DGGE was used to monitor the presence of probiotic adjunct strains using the identification ladder indicated in MM (Figure 1). Although this molecular approach is not able to provide a complete picture of diversity and community composition of microbial ecosystems as that given by high-throughput sequencing methods, it can still be considered a helpful technique to monitor dominant LAB community changes in environmental and intestinal ecosystem (Yunita and Dodd, 2018).
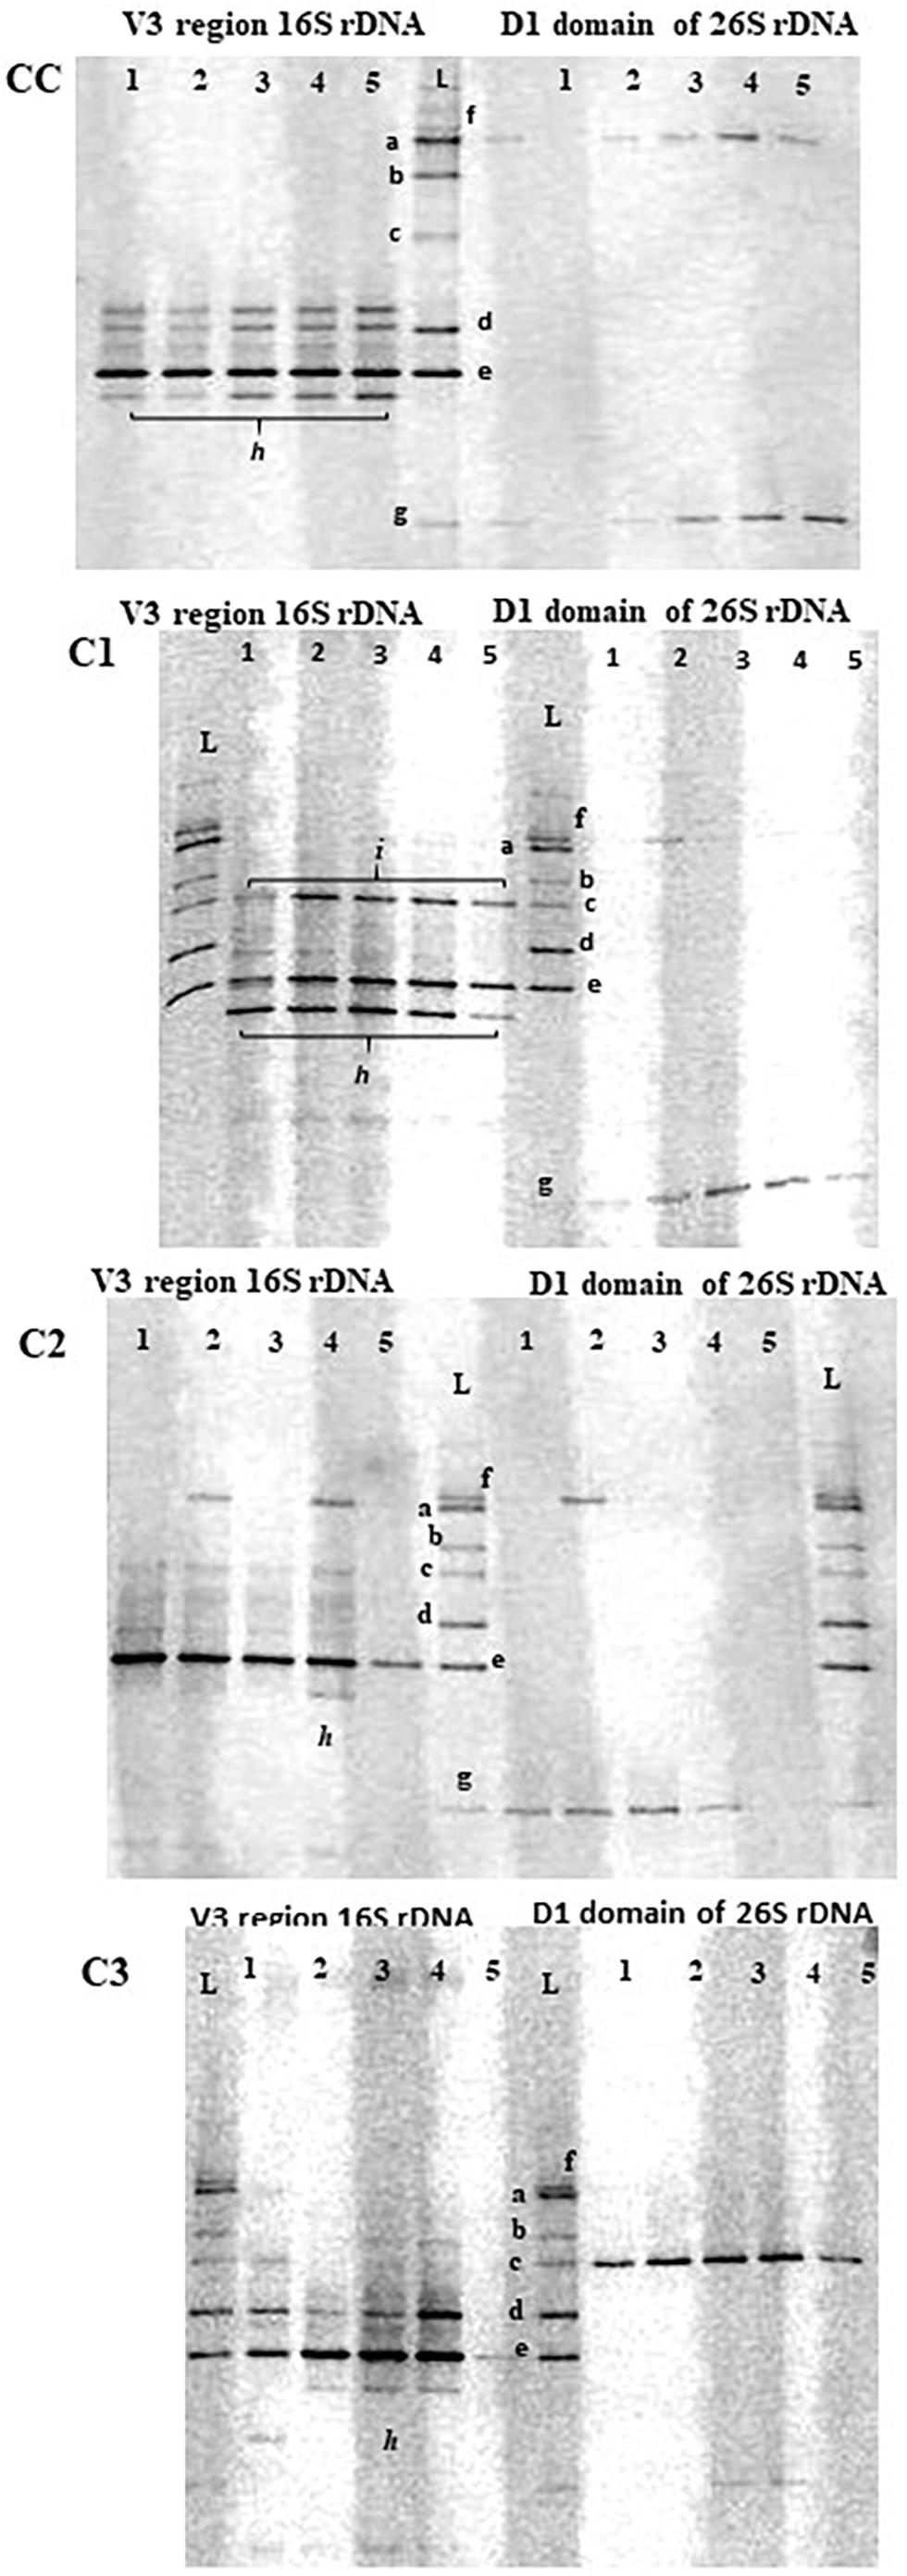
Figure 1. PCR-DGGE profiles of V3 16S and 26S rDNA regions in control (CC) and experimental (C1, C2, C3) cheese samples at different times of ripening. Lane 1, curd; lane 2, 1d-cheese; lane 3, 15d-cheese; lane 4, 30d-cheese; lane 5, 60d-cheese; L, identification ladder. a = L. plantarum ATCC 20174; b = Debaryomyces hansenii ATCC36239; c = Kluyveromyces lactis ATCC 56498; d = E. faecalis ATCC 29212; e = L. lactis ATCC 19435; f = Geotrichum candidum; g = Penicillium candidum; h = S. thermophilus; i = E. faecium.
In general, a good concordance was observed between PCR-DGGE and plate culture isolation, although a few inconsistencies were seen, as reported by other studies combining culture-dependent and –independent analyses (Pangallo et al., 2014; Silvetti et al., 2017). DGGE profiles of cheese samples consisted of just few bands mainly corresponding to the species used as starter and adjunct cultures, and they revealed the dominance of a band corresponding to L. lactis species in all cheeses throughout ripening. A weaker band corresponding to L. plantarum species was observed in all experimental probiotic cheeses. As the presence of L. plantarum probiotic strains during cheese making and maturation of probiotic cheeses was confirmed by cultural analysis and genotypic characterization by rep-PCR, the detection of weak bands in DGGE analysis could be due to different affinity of the primers to template DNA for different species, as observed by other authors (Bae et al., 2006; Mayrhofer et al., 2014). In additions to L. lactis and L. plantarum, other bands (indicated with the letter h and i in Figure 2) that could not be identified using our ladder were detected in all cheeses. These bands were excised and sequenced and were found to be homologous to St. thermophilus and E. faecium (h and i, respectively), typical adventitious LAB in cheese (Carafa et al., 2019).
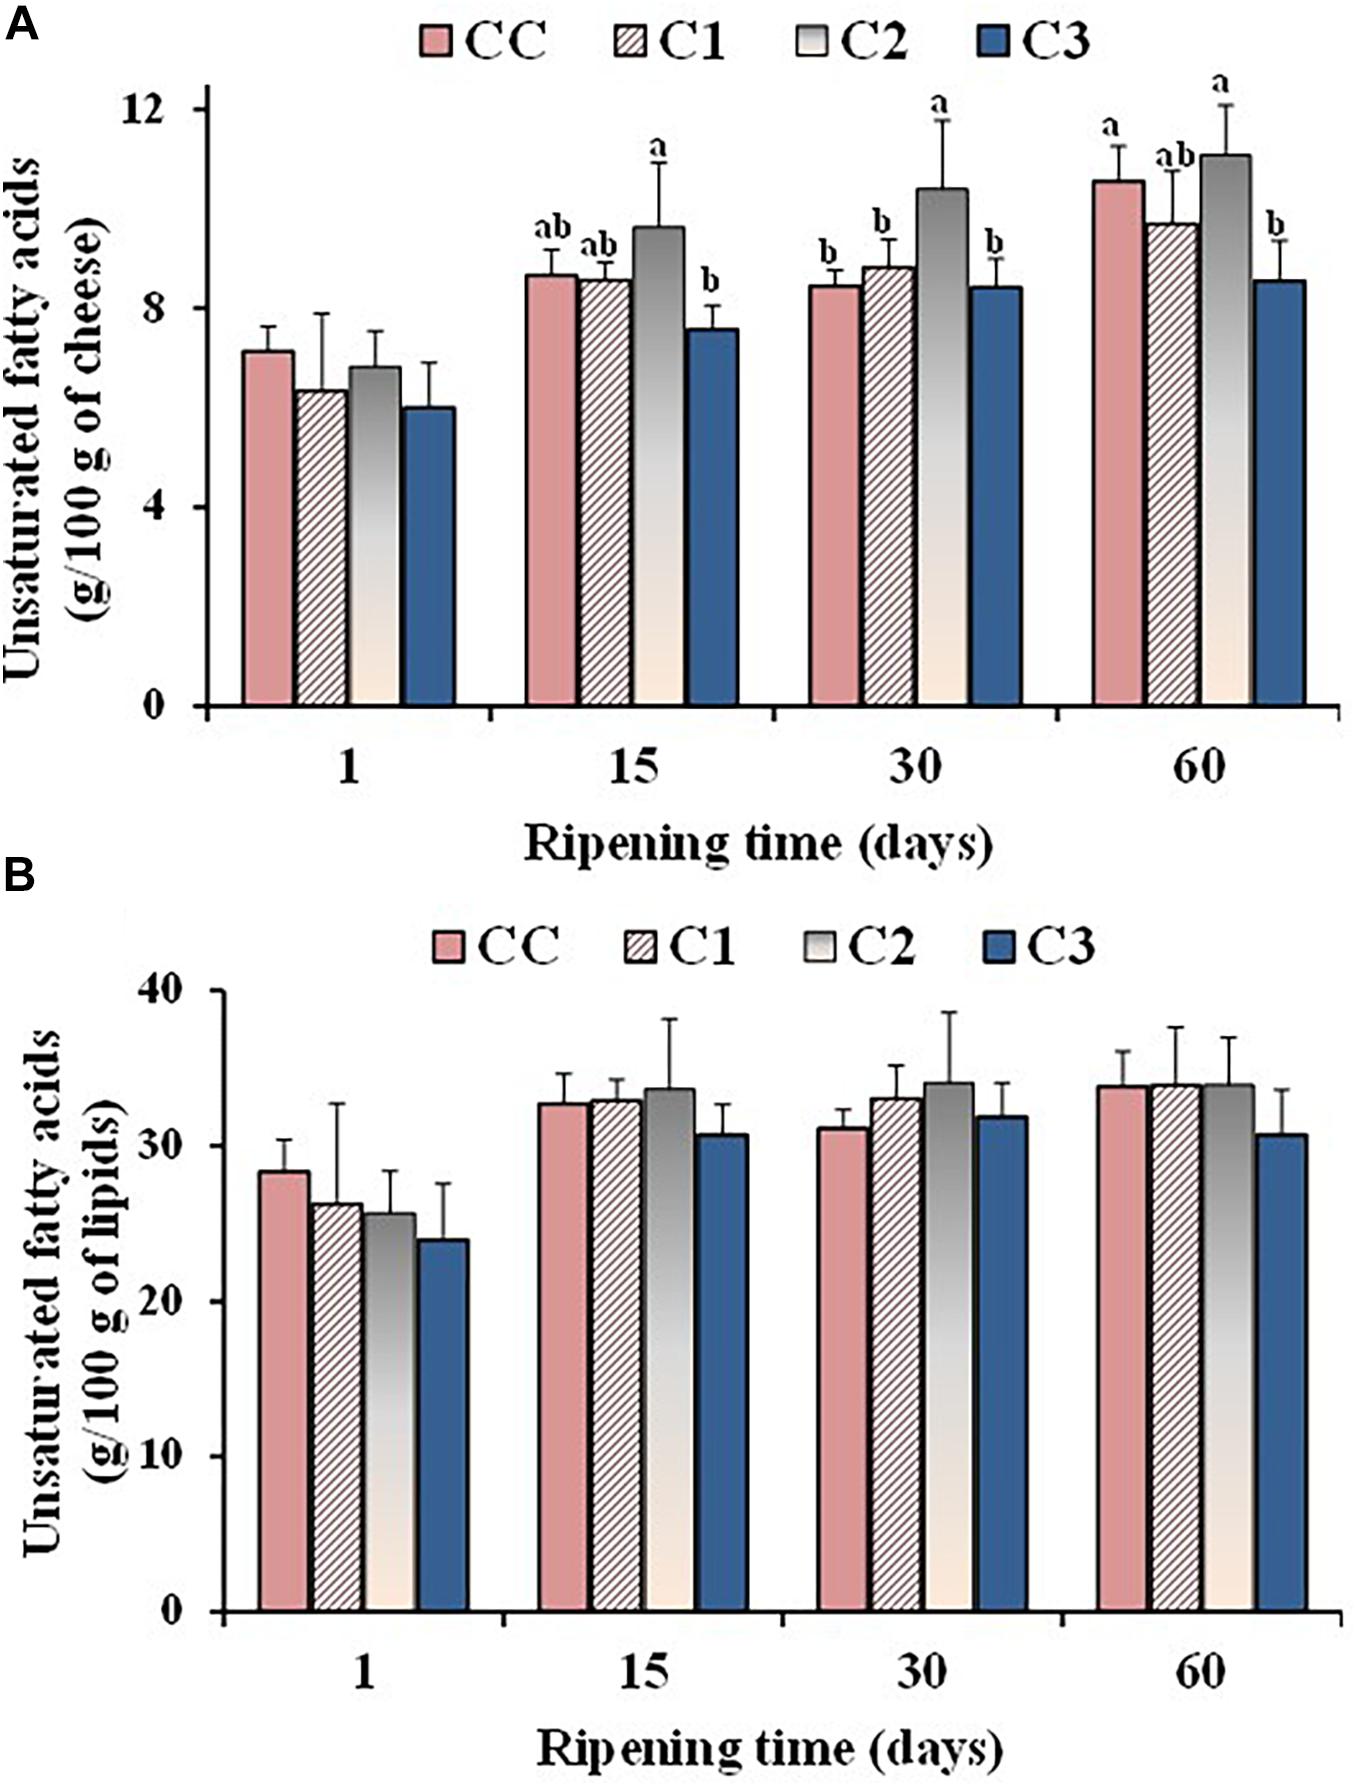
Figure 2. Values of total unsaturated fatty acids, expressed as g/100 g of cheese (A) and g/100 g of total lipids (B), measured in the control (CC) and probiotic cheeses (C1, C2, C3) at different ripening times; (n = 6). a,b,c Samples with different superscript letters, within the same ripening time, are significantly different at P < 0.05 (One-way ANOVA).
DGGE analysis of 26S rDNA was used to investigate the presence of adjunct probiotic yeast strains D. hansenii and Kl. lactis. While Kl. lactis could be clearly detected in C3 cheeses at each stage of ripening, the band corresponding to D. hansenii was not seen in the DGGE gel of C1 cheeses, confirming the result of culture analysis. Since a detection limit of 103 cfu/mL for DGGE analysis has been reported (Cocolin et al., 2000) and our cultural method has a detection limit of 102 cfu/mL, on the basis of the metabolome results (see section “Metabolic Profile of Caciotta Cheeses During Maturation”) we have speculated that D. hansenii may be present in the cheese in a viable but not detectable state. DGGE analysis of 26S rDNA also showed a constant presence of the species Geotrichum candidum and Penicillium candidum in all cheeses throughout ripening.
Sensory Analysis
A sensory evaluation of probiotic and control caciotta cheeses at 60 days of ripening was performed by six panelists. Mean ratings of descriptive attributes such as odor, aroma, basic tastes, texture and overall acceptability are documented in Table 4 and Supplementary Figure 2 in Supplementary Material. Significantly higher scores for aroma intensity were recorded in C3 cheeses with respect to C1 and C2 types, while C2 was perceived as the most bitter and acid with respect to the other groups. Furthermore, the textural parameters elasticity and solubility were significantly higher in CC and C1 cheeses. In general, the sensory profile of C1 cheese, found to be the most similar to CC cheese, and the highest scores for aroma obtained from C3 cheese may explain their slightly higher values for overall acceptability. Our results are in agreement with other studies investigating the sensory properties of Caciotta cheese produced with the addition of autochthonous LAB (Fusco et al., 2019; Bancalari et al., 2020).
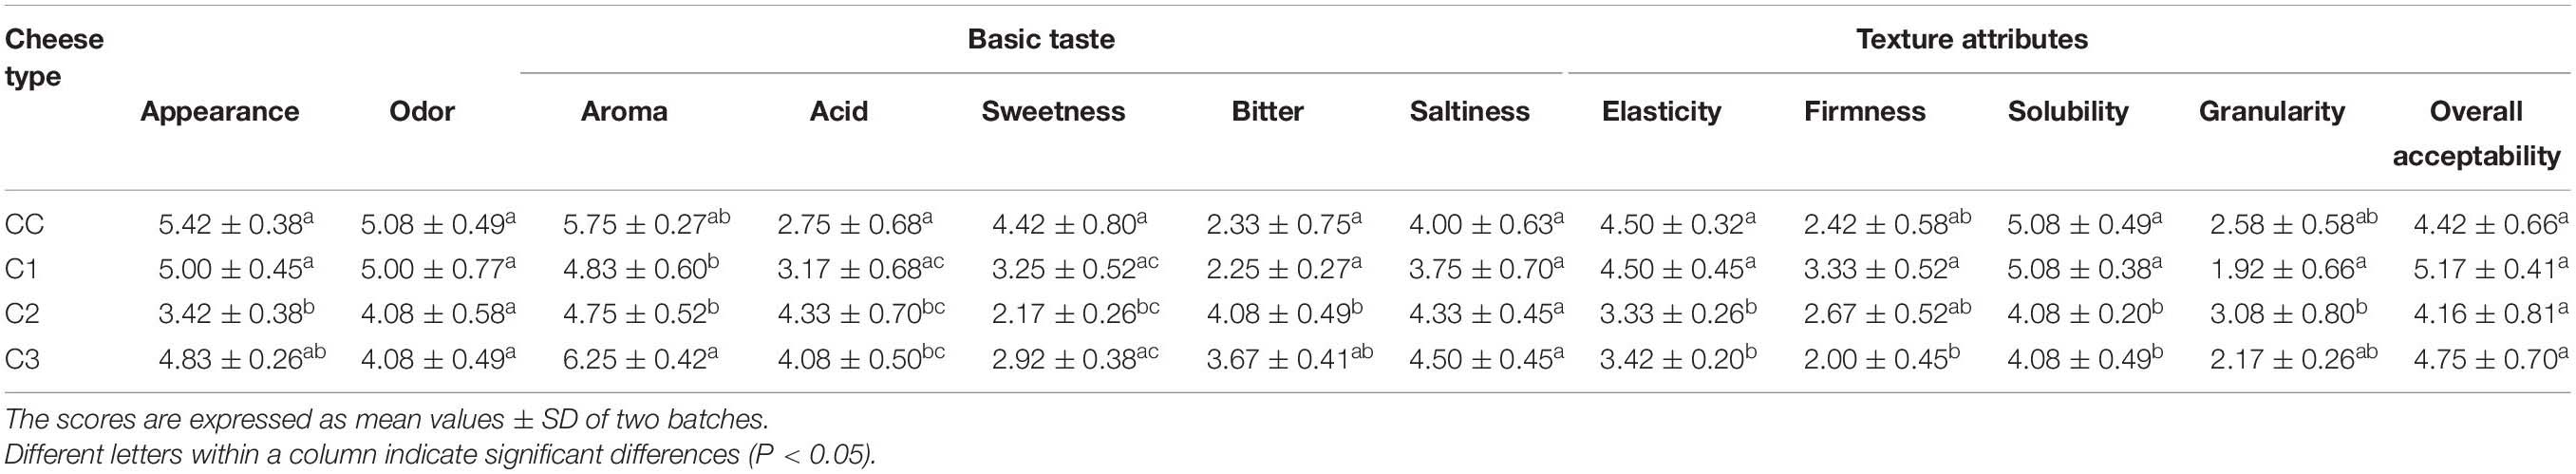
Table 4. Sensory descriptors scores obtained for the control and probiotic Caciotta cheeses. Attributes were scored on a 7-point scale.
Fatty Acid Profile of Caciotta Cheese During Ripening
Quali-quantitative information on the main saturated (SFA) and unsaturated (UFA) FA that compose the lipid classes of Caciotta cheeses was obtained by HPLC analyses with ELSD detection. HPLC-ELSD is an alternative technology to UV analysis and is often employed when compounds lack sufficient absorptivity (like saturated FA). The ELSD detector quantifies any solute less volatile than the solvents and functional groups, FA chain-length, or saturation has little or no effect on the detector response (Aradottir and Olsson, 2005). However, a non-linear ELSD response for FA and a low repeatability of ELSD response factors have been reported (Cebolla et al., 1997; Aradottir and Olsson, 2005). Therefore, for the comparative assessment of the total FA profiles of Caciotta cheese samples, FA quantification was based on the internal normalization method (Amaral et al., 2004; Rosa et al., 2017), assuming that the detector response was the same for all FA. It was based on the received peak area, the results were normalized without correction factor and the FA contents were expressed as area percentages (% area). This HPLC–ELSD analysis was set up to analyze up to 16 FA (saturated + unsaturated FA) in one single analysis without any derivatization. The ELSD is suitable for the analysis of only C12–C22 FA since those with shorter chain length are not detected being too volatile (Bravi et al., 2006). FA compositions (expressed as % of total fatty acids) in control (CC) and probiotic Caciotta cheeses (C1, C2, C3) at 1 day of production measured by HPLC-ELSD are reported in Table 5. Control Caciotta cheese showed a concentration of approximately 53.3% of SFA (mainly palmitic acid 16:0, and stearic acid 18:0, 30, and 13%, respectively), 41.6% of monounsaturated FA (MUFA, mainly oleic acid 18:1 n-9 and 18:1 trans isomers, 35.6 and 5.9%, respectively), and 4.6% of polyunsaturated FA (PUFA), mainly constituted by conjugated linoleic acid (CLA) isomers and linoleic acid 18:2 n-6, 2.5 and 1.3%, respectively. The probiotic cheeses C1-C3 showed a SFA and UFA profile similar to the that of control cheese, with values of SFA, MUFA and PUFA in the range 53–55%, 40–41% and 4.6–5%, respectively. As indicated in Table 5, the absolute content of the main UFA detected in control and probiotic Caciotta cheeses at 1 day of production by HPLC with DAD detection and values, expressed as g/100 g of Caciotta cheese on a wet basis, showed UFA amounts of experimental cheeses in line with those measured in the control. The average values for the main UFA of both control and probiotic cheeses were in the range: 3.5–4.2 g/100 g of cheese for 18:1 n-9, 1.3-1.5 g/100 g for 18:1 trans isomers, 0.4-0.5 g/100 g for 18:2 n-6, and 0.3-0.4 g/100 g for CLA isomers.
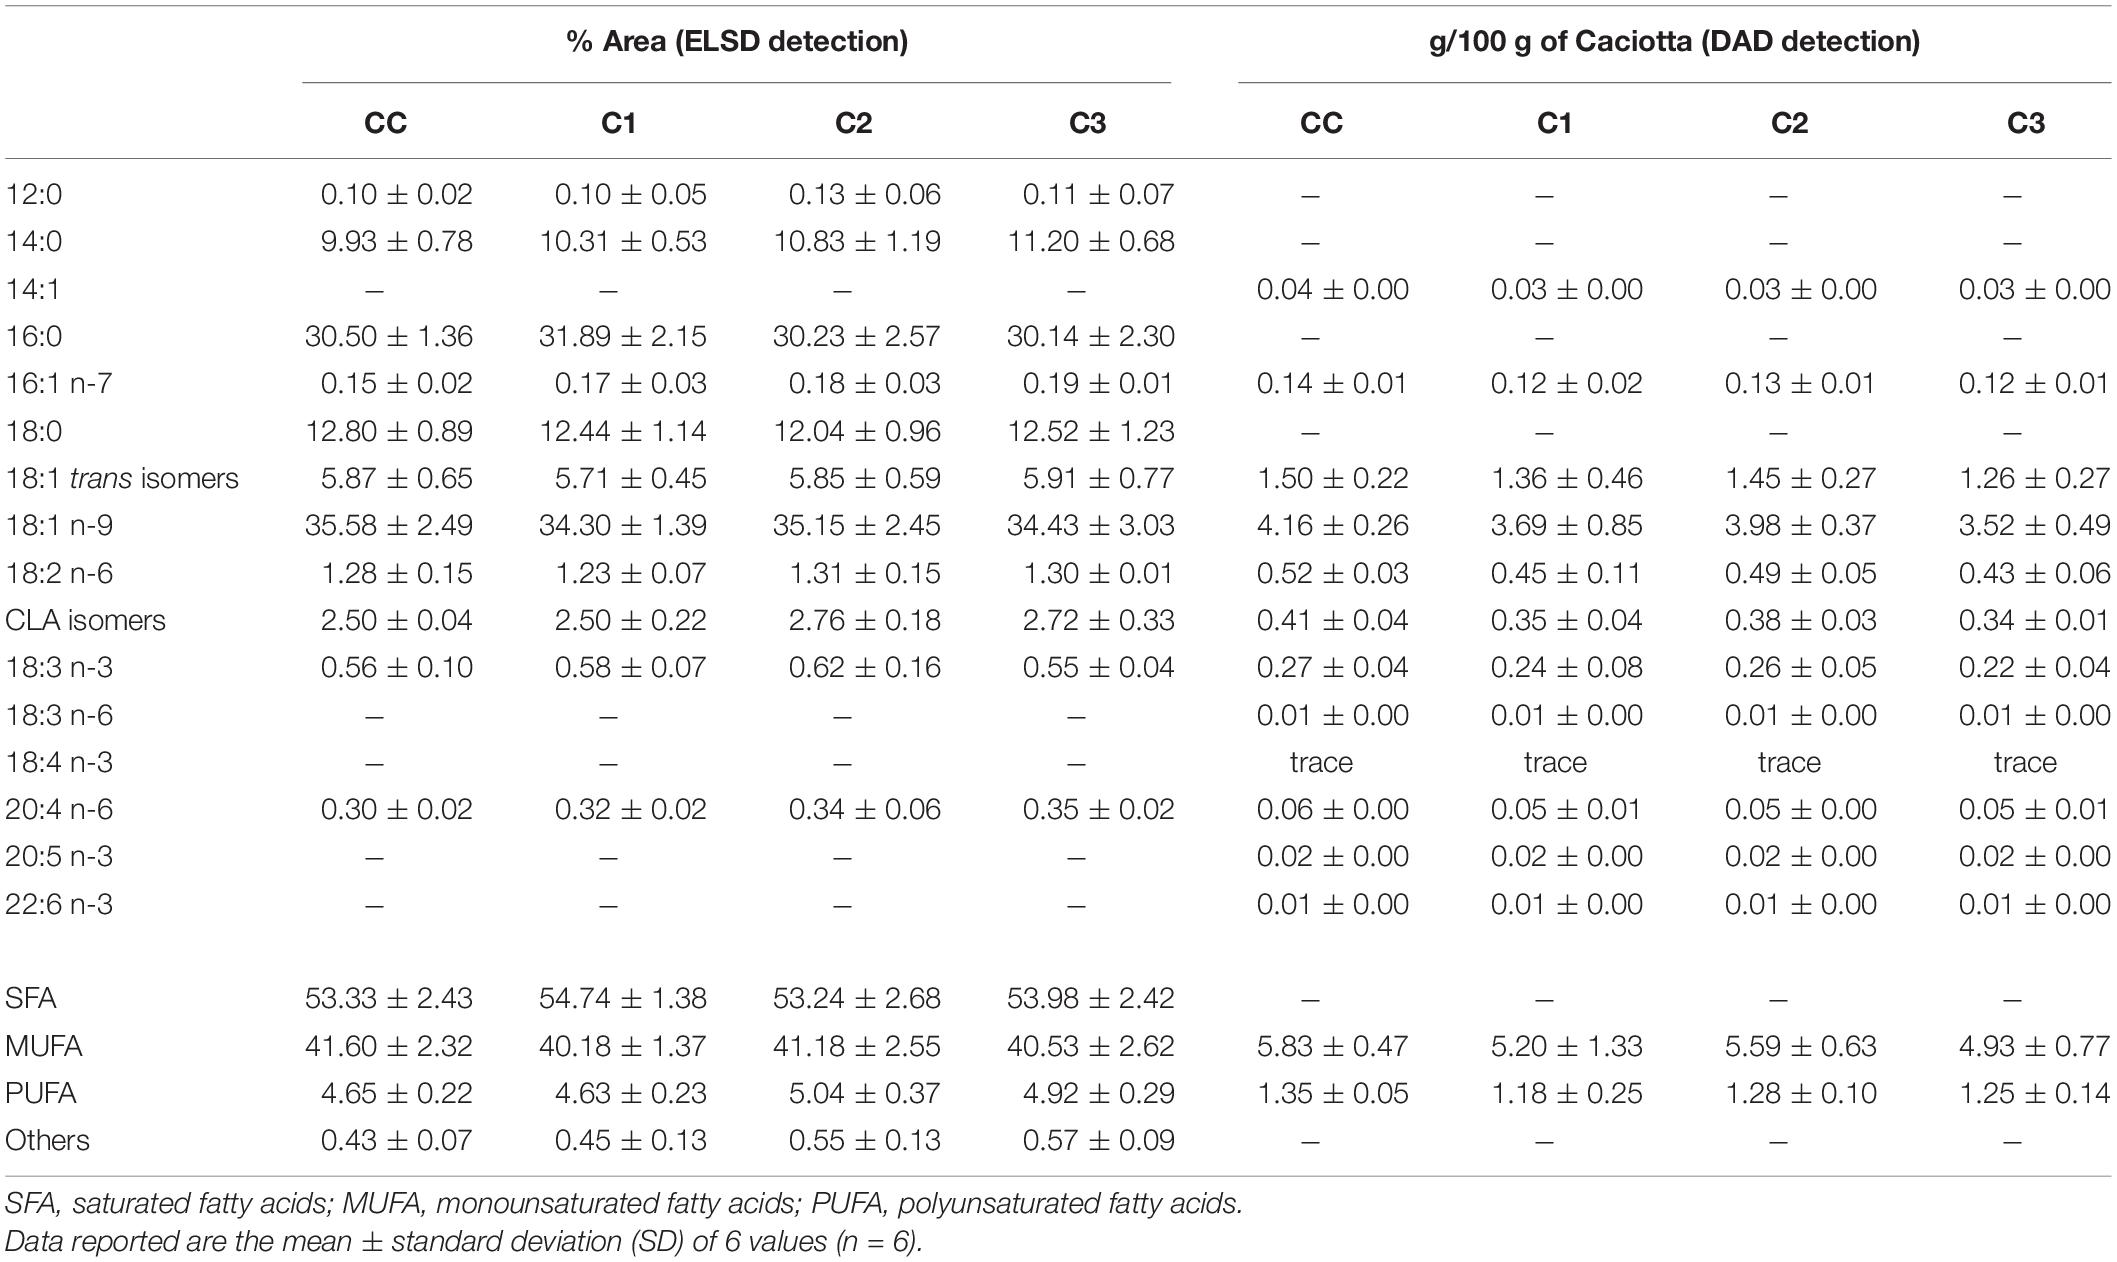
Table 5. Fatty acid profile of control (CC) and probiotic Caciotta cheese (C1, C2, C3) at 1 d of production measured by HPLC analysis with ELSD and DAD detection.
A similar trend and no significant differences were measured in the SFA, MUFA and PUFA % levels among the different batches of Caciotta cheeses at all ripening stages (Supplementary Figure 3 in Supplementary Material).
Some differences were observed in the absolute amounts of UFA during ripening. Figure 2A shows the total UFA amounts (expressed as g/100 g of cheese on a wet basis) measured in the control and probiotic cheeses at different ripening times. The absolute values of UFA increased during ripening in all cheese types mostly due to a corresponding decrease in the moisture content, as indicated by the high negative correlation coefficients measured between UFA absolute values/moisture level during ripening for CC (r = −0.9736), C1 (r = −0.9661), C2 (r = −0.8365), and C3 (r = −0.8480). Significant differences were detected in the UFA absolute values among cheese types from 15 days of ripening, with sample C2 and C3 showing the highest and the lowest UFA contents, respectively. These differences were ascribable to a different moisture level in Caciotta cheeses. In fact, no significant differences were observed between experimental and control group at the different ripening times when total UFA levels were measured as g per 100 g of lipids (Figure 2B), suggesting that the addition of probiotic bacteria did not affect the composition of FA that make up triglycerides of cheese fat. Similar results were reported by Perotti et al. (2014), who did not observe modifications in the FA composition (expressed as %, g FA/100 g of total FA) of Argentinean semi-hard ovine cheese made with a mix of probiotic microorganisms.
Isomers of conjugated linoleic acid (or CLAs) are of particular interest from a nutritional point of view, being cis-9, trans -11 CLA (rumenic acid) the most representative. Experimental evidence has suggested that CLA may have antiatherosclerotic, anticarcinogenic, antidiabetic and immunomodulanting effects (Mele et al., 2011; Prandini et al., 2011). Since CLA is naturally present in milk from ruminants, cheese represents a good source of this FA, its content in cheese being usually related to the CLA level of the unprocessed milk (Perotti et al., 2014). Sheep cheeses reported a higher level of CLA with respect to cow and goat cheeses (Prandini et al., 2011). Additional CLA quantities could be produced during manufacturing and ripening of cheeses, as some cheese-related microorganisms including probiotic bacteria have shown the ability to produce CLA (Laskaridis et al., 2013; Perotti et al., 2014). Figure 3 shows the total values of CLA isomers, expressed as g/100 g cheese (Figure 3A) and g/100 g lipids (Figure 3B), measured in the control and probiotic cheeses C1-C3 at different ripening times. In our study, the absolute values of CLA isomers, like all the others FA, increased per 100/g of cheese in control and probiotic cheeses with ripening time, and the highest values were measured at 60 days ripening in the cheese samples characterized by a lower rate of moisture (CC and C2). Similar CLA contents were measured per 100 g of lipids, among Caciotta cheese batches at all ripening stages indicating that the probiotic cultures did not affect the CLA content of cheeses with respect to the control. Similar results were reported by other authors for ovine, caprine and bovine cheeses (Gursoy et al., 2012; Perotti et al., 2014).
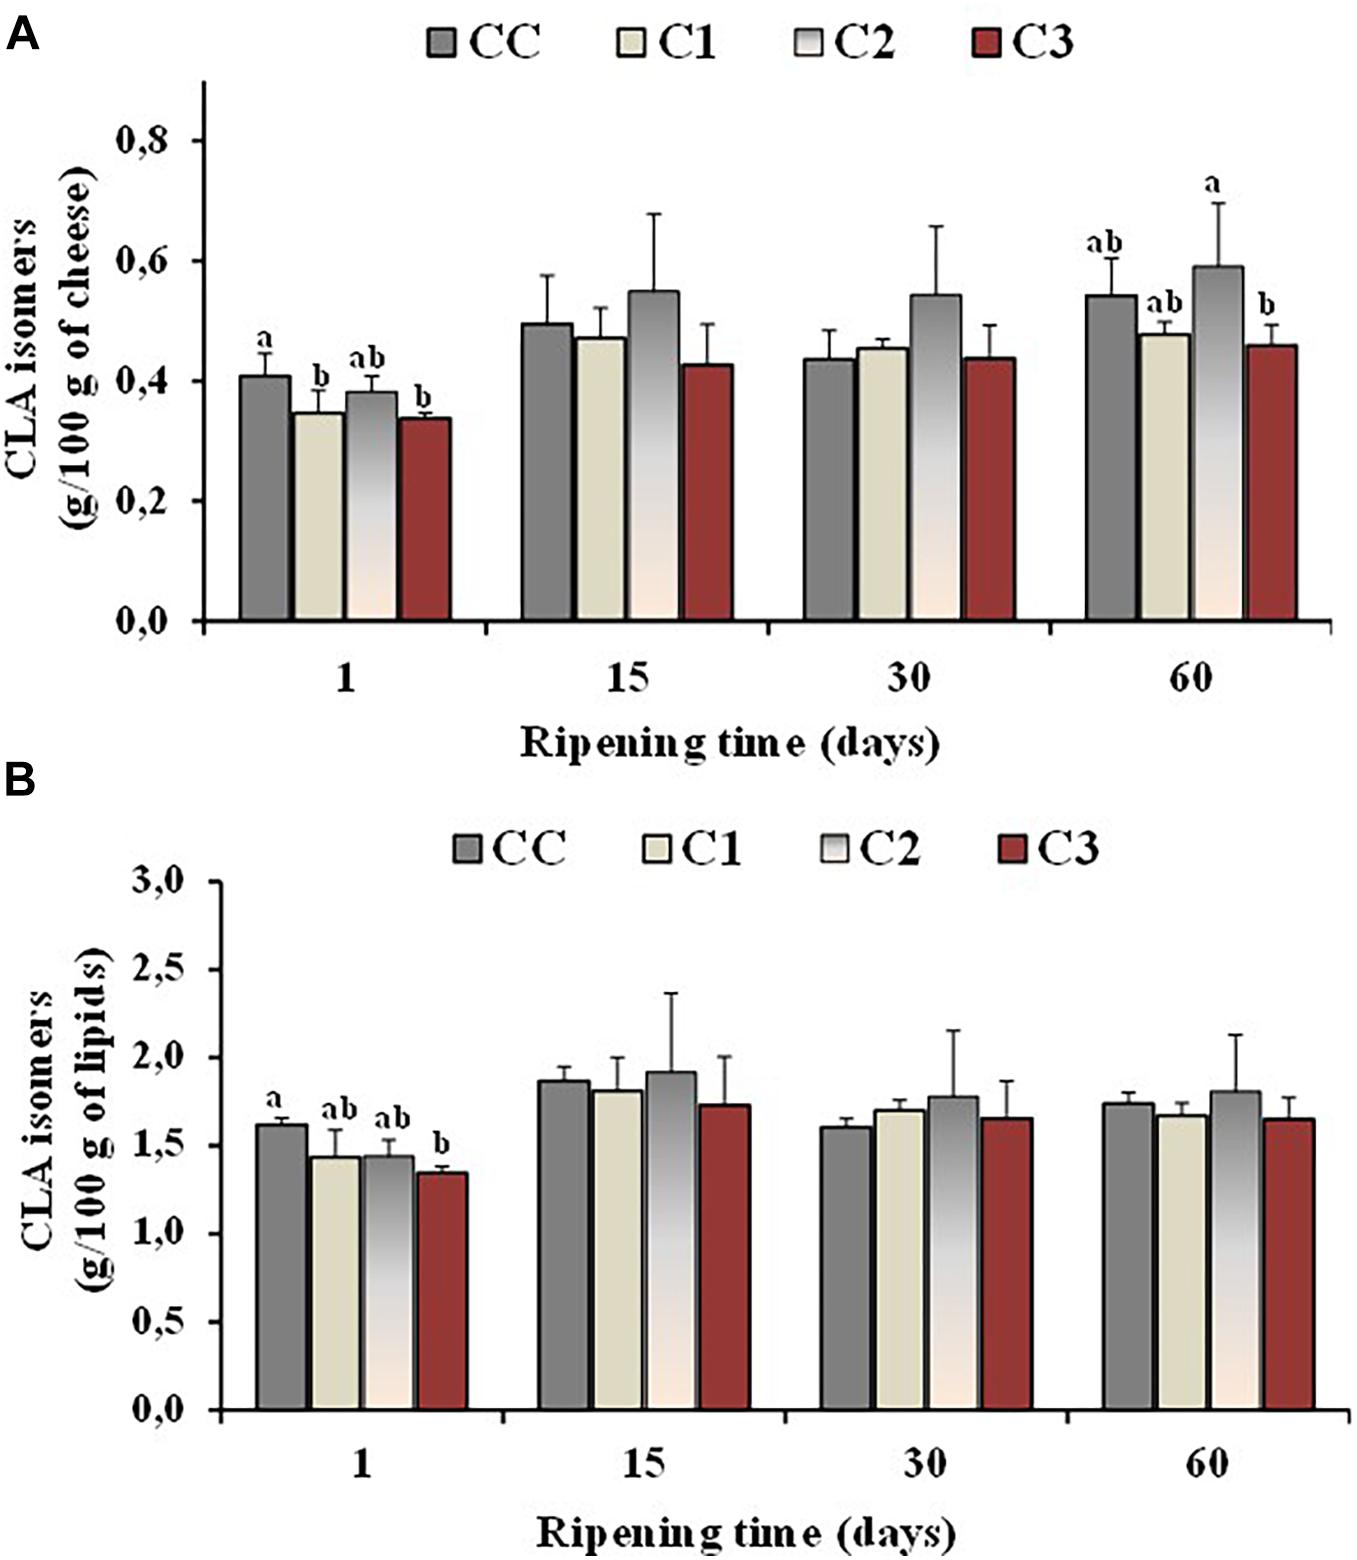
Figure 3. Total values of CLA isomers, expressed as g/100 g of cheese (A) and g/100 g of total lipids (B), measured in the control (CC) and probiotic cheeses (C1, C2, C3) at different ripening times; (n = 6). a,b,c Samples with different superscript letters, within the same ripening time, are significantly different at P < 0.05 (One-way ANOVA).
Total Cholesterol and α-Tocopherol Levels of Caciotta Cheese During Ripening
Dairy products play a major role in supplying dietary cholesterol, since cholesterol is the predominant sterol of milk (> 95 g/100 g of total sterol) (Collins et al., 2003). The association between plasma cholesterol and atherosclerosis has emphasized the importance of the assessment of cholesterol in dairy products (Marrone et al., 2014). Several probiotic strains have been shown to possess in vitro cholesterol-lowering ability (Ooi and Liong, 2010). Figure 4 shows the values of total cholesterol, expressed as mg/100 g cheese and mg/100 g lipids (Figures 4A,B, respectively), measured in the control and probiotic cheeses at different ripening times. As expected, cholesterol content (mg/100 g cheese) increased in all cheese types during ripening because of the loss of water. After 60 days of ripening, the total cholesterol content was in the range 84–117 mg/100 g of cheese, with lower values observed in the probiotic cheeses C1 and C3, with respect to control CC and C2 sample. No significant differences were found in the cholesterol content expressed as mg/100 g of fat between control and probiotic cheeses even though in-vitro cholesterol-lowering Lactobacillus strains were used in C1 e C3 cheeses. On the other hand, possible differences between the expression of functional properties in vitro and in vivo have been pointed out, as various factors related to the environmental conditions and/or interaction with microbial communities prevailing in situ could affect the efficiency of the strains. In the study by Albano et al. (2018) seven LAB strains showed a lower ability to reduce cholesterol in cheese than in broth. Our results highlight the importance to perform in situ studies to confirm the in vitro functional characteristics of probiotic strains in order to assess their health-promoting properties and their performance as novel probiotic.
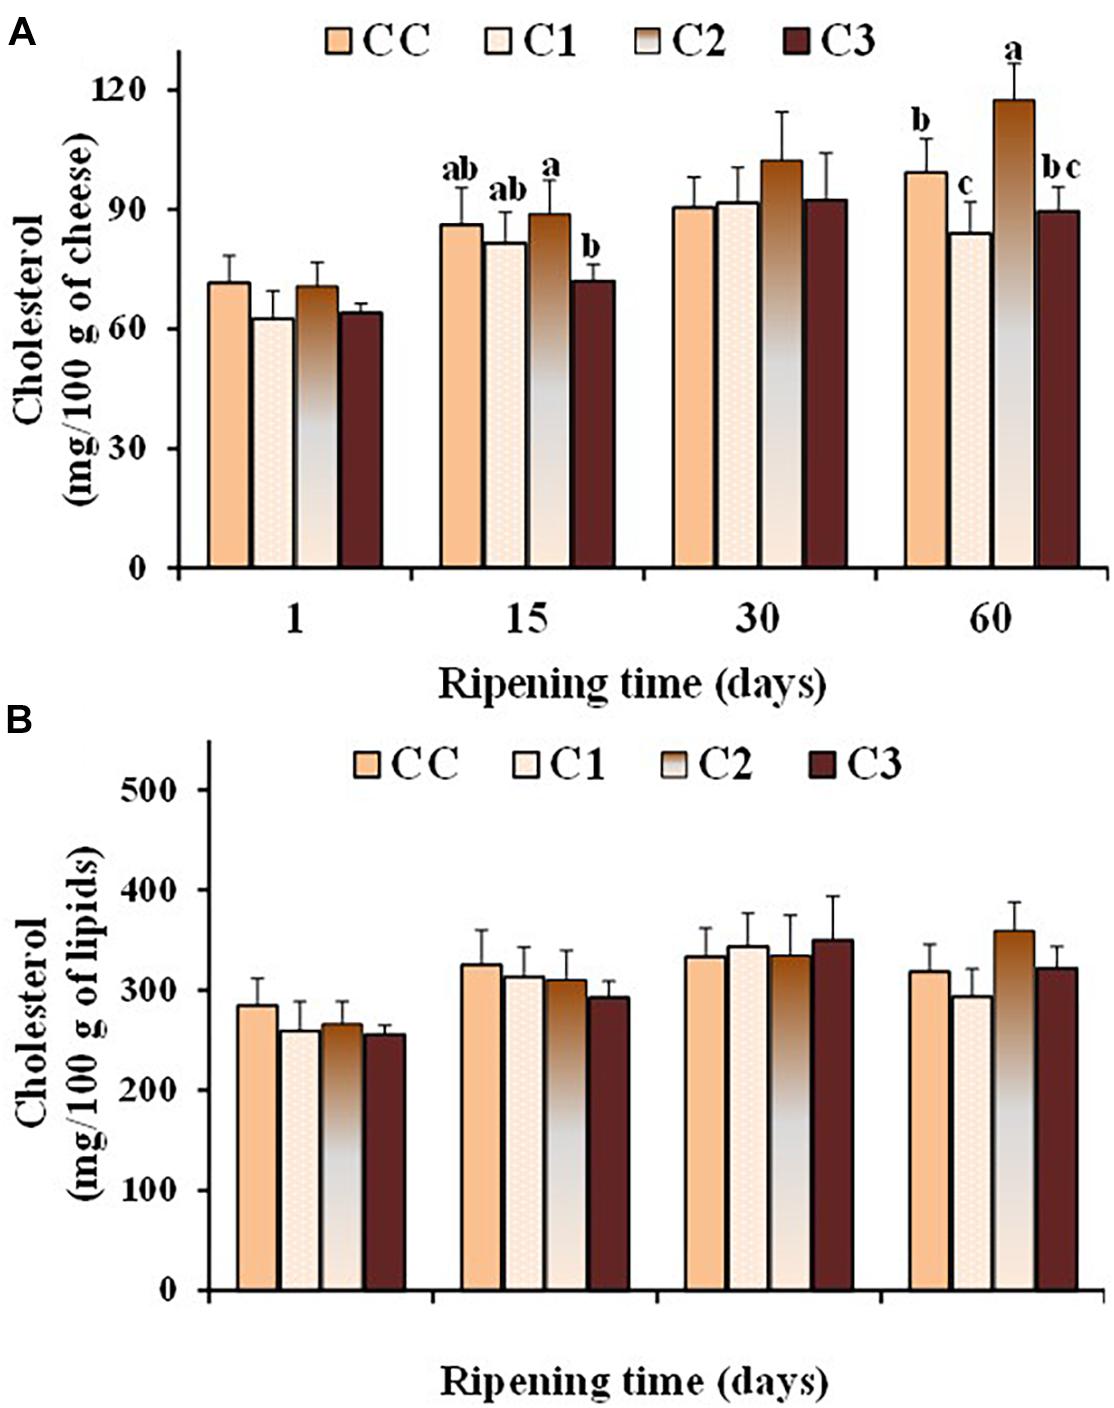
Figure 4. Values of total cholesterol, expressed as mg/100 g of cheese (A) and mg/100 g of total lipids (B), measured in the control (CC) and probiotic cheeses (C1, C2, C3) at different ripening times; (n = 6). a,b,c,d Samples with different superscript letters, within the same ripening time, are significantly different at P < 0.05 (One-way ANOVA).
The level of the antioxidant α-tocopherol was also determined in all cheeses during ripening. In general, cheese is considered a product stable to oxidation (Mele et al., 2011), characterized by the presence of antioxidants like vitamin E, vitamin A and β-carotene (Revilla et al., 2014). Vitamin E is known to act primarily as a liposoluble antioxidant, protecting PUFA and related substances from peroxidation, and α-tocopherol is the main component with vitamin E activity in sheep milk and cheese (Revilla et al., 2014). The effect of different probiotic organisms and ripening time on the α-tocopherol content of the control and probiotic cheeses is presented in Figure 5. A little increase in concentration, expressed as μg/100 g cheese, was observed in all cheese batches at 15 days of ripening, followed by similar or lower amount at 30 and 60 days of maturation (Figure 5A). No significant differences were observed among control and experimental cheeses and the average values for α-tocopherol of both control and probiotic cheeses were in the range 312–389 μg/100 g of cheese and 1–1.2 μg/100 g of lipids after 60 days of ripening (Figure 5B).
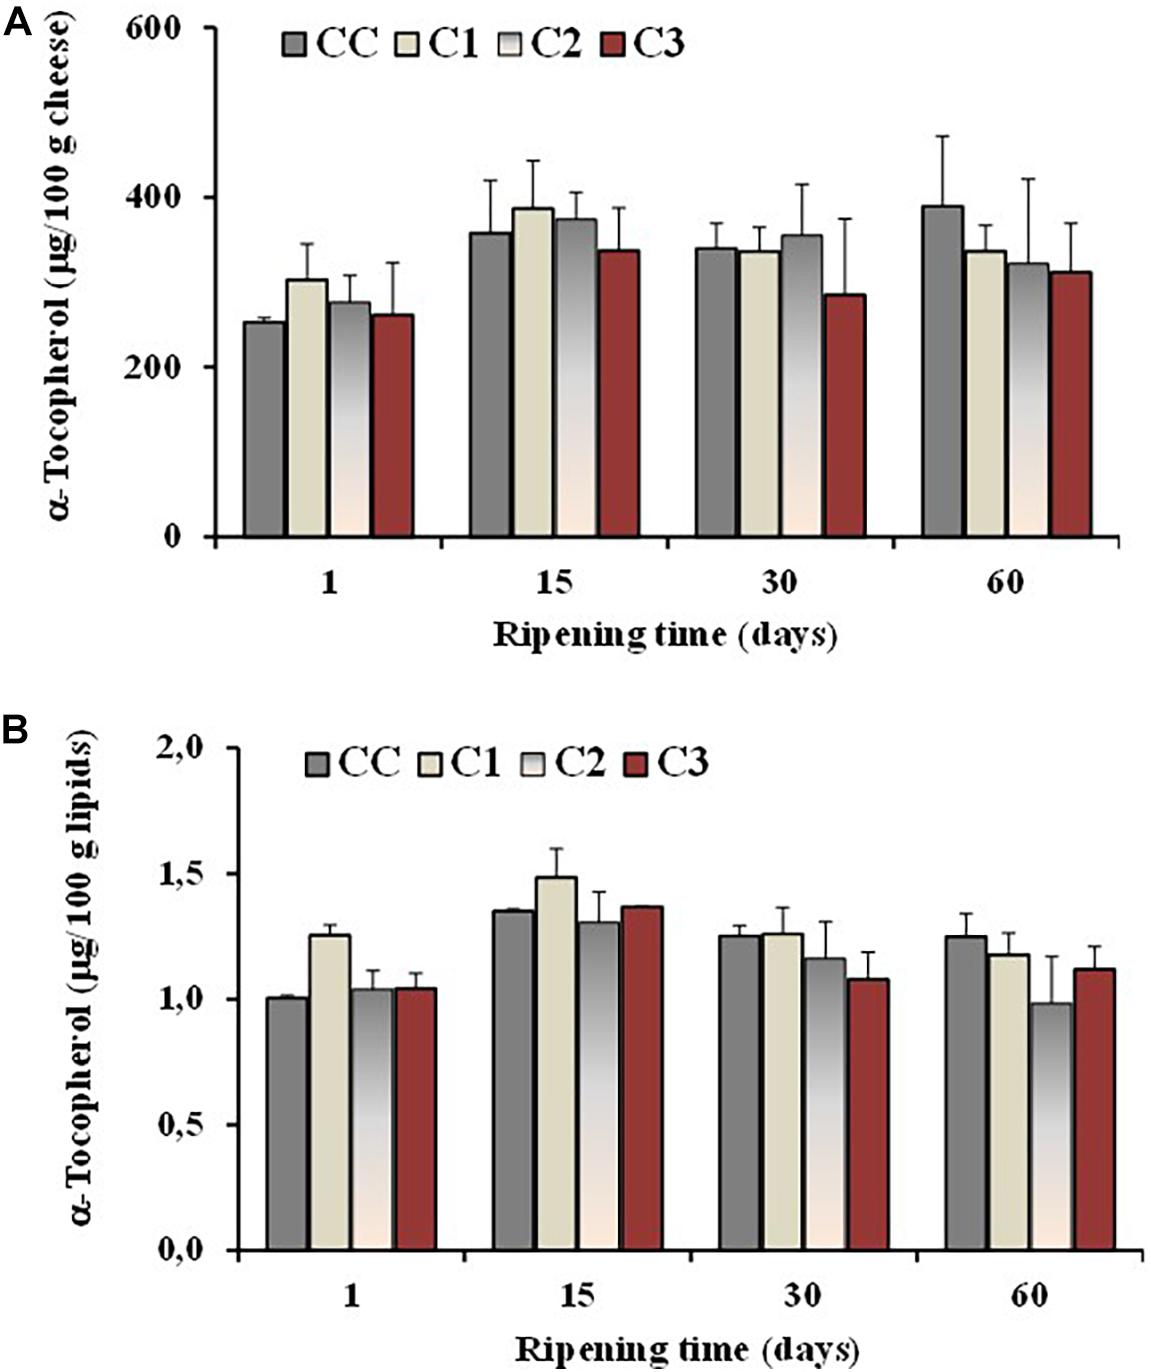
Figure 5. Total values of α-tocopherol, expressed as μg/100 g of cheese (A) and μg/100 g of total lipids (B), measured in the control (CC) and probiotic cheeses (C1, C2, C3) at different ripening times; (n = 6).
Metabolic Profile of Caciotta Cheeses During Maturation
Metabolomics analysis of cheese has been shown to be a valuable tool to investigate the association between the biochemical events occurring in this food and maturation process (Piras et al., 2013), microbial culture-dependent methods (Pisano et al., 2016), sensory properties (Ochi et al., 2012a), or cheese quality (Mazzei and Piccolo, 2012). In the present study, we have performed a NMR-based metabolomics analysis of the aqueous extract of Caciotta cheese to evaluate and compare the changes of the metabolic profile due to the ripening time and the added cultures.
Representative 1H NMR spectra of the aqueous extracts of control Caciotta at different ripening days are reported in Figure 6, while those of C1, C2 and C3 cheeses are depicted in the Supplementary Material (Supplementary Figures 4–7). A variety of amino acids, carbohydrates, osmolytes, and organic acids were detected. In good agreement with the literature (Consonni and Cagliani, 2008; Rodrigues et al., 2011; Piras et al., 2013), it can be visually observed that ripening time has an impact on the NMR profile of all cheeses, as pointed out, in particular, by the increasing temporal intensities of many amino acid peaks and the decreasing of lactose signals. Among the various NMR peaks, those from lactic acid (La) were predominant in all Caciotta aqueous extracts at all ripening times (Supplementary Figure 4 in the Supplementary Material). A high content of La is typical of the initial stage of cheese when the starter cultures cause a slight and rapid acidification of milk. The occurrence of high levels of La over the maturation time of Caciotta, indicated a sustained microbial activity during the ripening period. Compared to control, the levels of La in the experimental cheeses produced with autochthonous strains increased more markedly after 15 days of maturation, particularly in C1 and C3 (Supplementary Figure 8 in Supplementary Material), then decreased up to 60 days of ripening, reaching the lowest values in C3, presumably as a consequence of the lactate metabolism of the K. lactis strain included in the culture (Fadda et al., 2004). Since lactic acid is the most abundant organic acid in Caciotta, its content changes are reasonably the main source of the observed pH variations (Table 2).
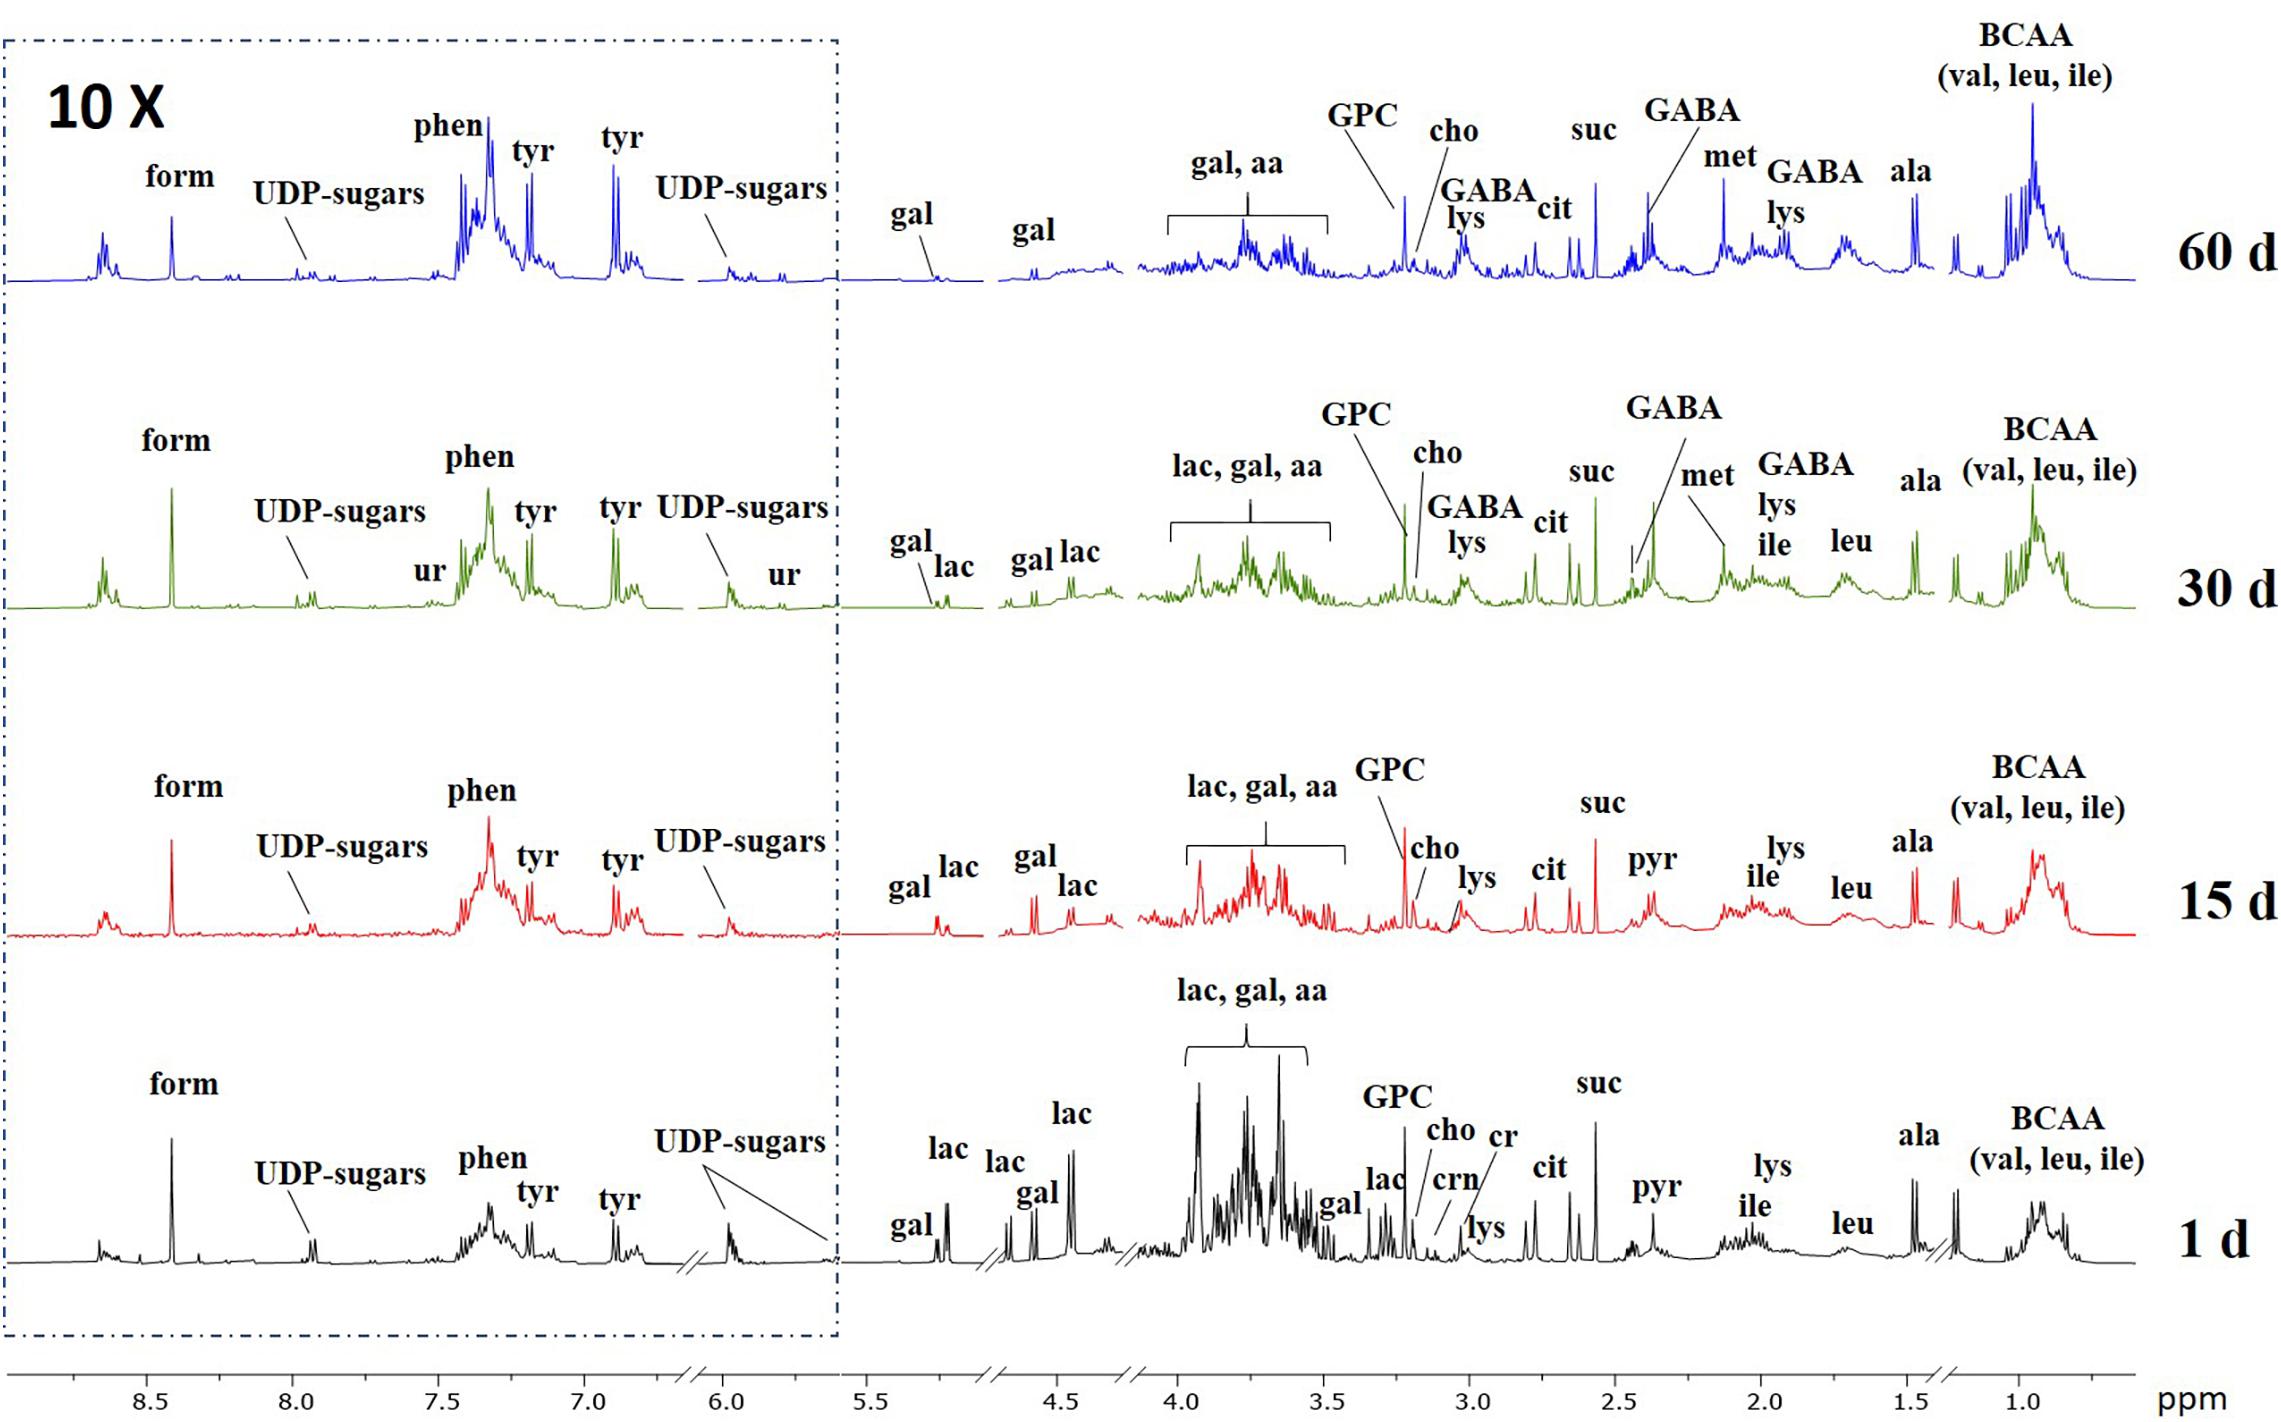
Figure 6. Representative 1H NMR spectra of the aqueous extracts of control Caciotta cheese at different ripening days. Abbreviations: aa, amino acids; ala, alanine; cit, citric acid; cho, choline; cr, creatine; crn, creatinine; form, formic acid; GABA, γ-aminobutyric acid; gal, galactose; GPC, glycero-phosphocholine; ile; isoleucine; lac, lactose; leu, leucine; lys, lysine; met, methionine; phen, phenylalanine; pyr, pyruvic acid; suc, succinic acid; tyr, tyrosine; UDP-sugars, uridine diphosphate-related sugars; ur, uracile; val, valine.
A preliminary multivariate statistical analysis of the whole NMR data set was performed by PCA in order to explore the intrinsic variability. Due to the high intensity of lactic acid peaks, the corresponding bins were removed prior to analysis in order to monitor possible changes of the metabolic profiles due to the less abundant metabolites. Figure 7 shows the PCA scores plot built with the first two principal components (PCs), PC1 and PC2 explaining 54.5 and 16.2% of the total variance, respectively. All samples in the plots were within the 95% Hotelling’s T-squared ellipse, except those of C1 at 1 day of ripening, characterized by higher levels of lactose compared to the other samples. As it can be observed by the score distribution for each time point, we obtained a good reproducibility of NMR data in terms of replicates and trials. Furthermore, the score movement from the right to the left indicated a continuous metabolic change during cheese maturation. Differences in the scores distribution were visible also in terms of added cultures, in particular at the beginning of preparation. Overall, these findings suggested variations in the metabolome of cheeses in relation to both ripening time and added culture.
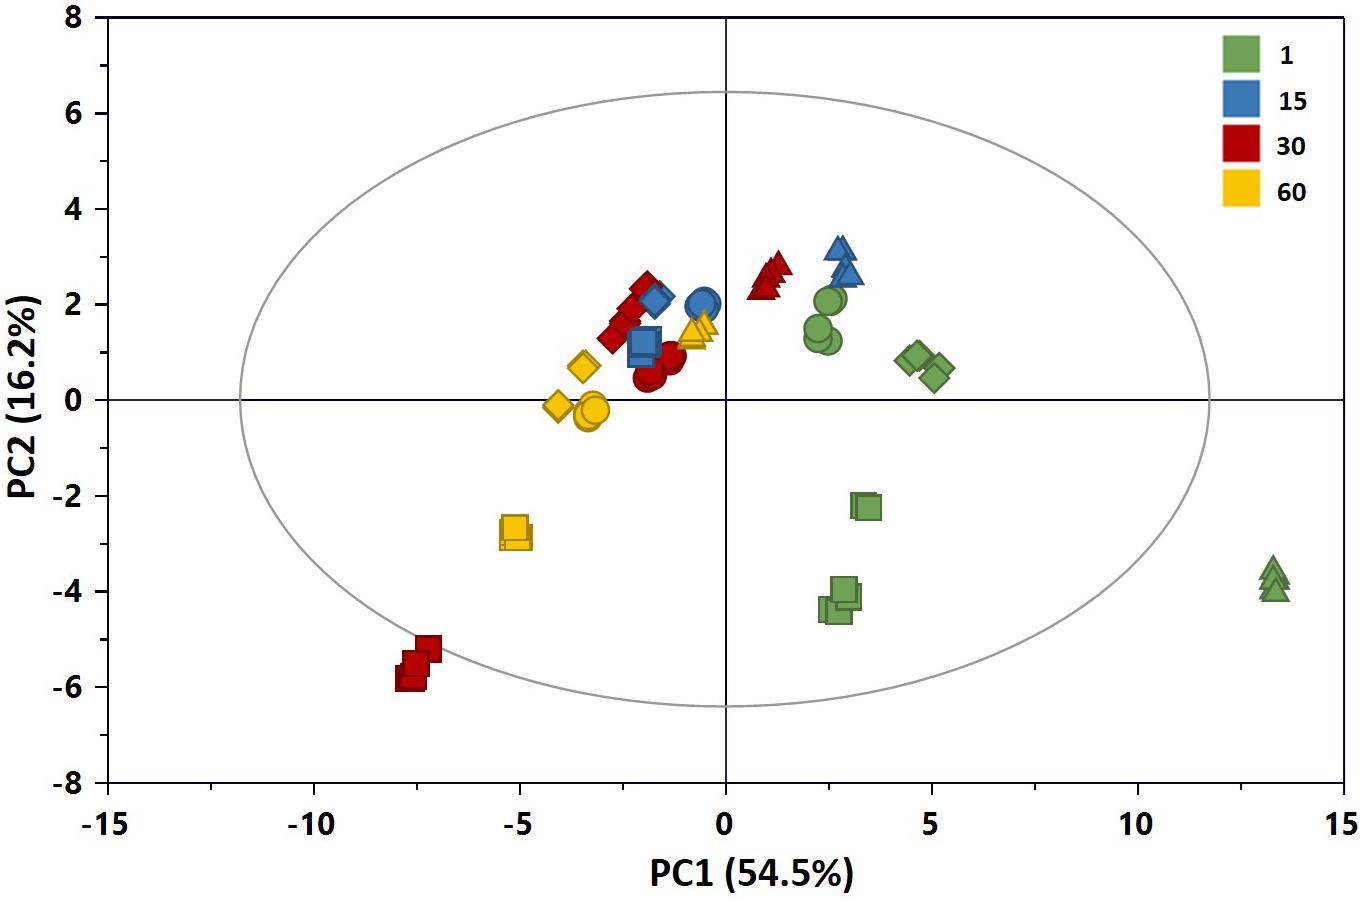
Figure 7. PC1 vs. PC2 scores plot of the PCA model built with the 1H NMR spectra of the aqueous extracts of Caciotta (R2X = 0.707; Q2 = 0.698): CC (•), C1 (▲), C2 (◆), C3 (■). The color of scores denotes the ripening days. The reader is remanded to the color version of the figure.
To focus on the metabolic changes mostly correlated with the ripening time, an OPLS model was built for each Caciotta cheese type (Supplementary Figure 9 in Supplementary Material). All models were characterised by high statistical values, yielding a Q2 ≥ 0.95. Each model was further validated by permutation tests (n = 400), providing the Q2 and R2 values of the permutated models lower than the original ones (data not shown), and by CV-ANOVA (p < 0.0001) to ensure that there was no overfitting. The analysis of the S-line correlation coefficient plots evidenced for all cheeses a general increase of the content of free amino acids (AA) and organic acids during ripening, and a concomitant decrease of the carbohydrate levels. Among these metabolites, only a few exhibited a statistically significant correlation with cheese aging (p(cov) ≥|0.05|; p(cor) ≥|0.5|). In particular, branched chain amino acids (BCAA: valine, leucine, isoleucine) were positively correlated with time in all cheeses. Additionally, a positive correlation was observed for methionine, leucine, and 4-aminobutyric (GABA) only in CC and C3, for succinic acid only in C1 and C2, for alanine only in C3 and for acetic acid only in C2. Finally, for all cheeses, the most significant negative correlation with time was observed for lactose.
In order to examine the differences among the NMR profiles of cheeses in terms of the type of added culture, OPLS-DA models were built for pairwise comparisons among samples at 60 days of ripening. All models were found robust following permutation test (n = 400) and CV-ANOVA (p < 0.0001). The score plots of the models are shown in Supplementary Material (Supplementary Figure 10). Looking for candidate metabolites with an important impact on the group separation (Figure 8), we could note that C3 cheese had the highest content of BCAA followed in decreasing order by CC, C1, and C2. C3 exhibited also the highest levels of methionine and GABA, the latter being present only in the spectra of C3 and CC. As to the organic acids, CC was characterized by the highest content of citric acid, while high levels of formic, acetic and succinic acids were significantly associated with the use of autochthonous cultures. Acetic acid was more abundant in C2, while succinic acid in C1. In C1, of interest is the presence of erythritol. This polyol has been reported to occur in different type of cheeses by osmotolerant yeasts in response to salt stress (Breuer and Harms, 2006; Tomaszewska et al., 2014), and its presence may be indicative of metabolic activity by the D. hansenii strain added to C1, even though it was not detected either in culture or by DGGE analysis. Significantly higher levels of branched-chained fatty acids characterized C2 compared to the other cheeses.
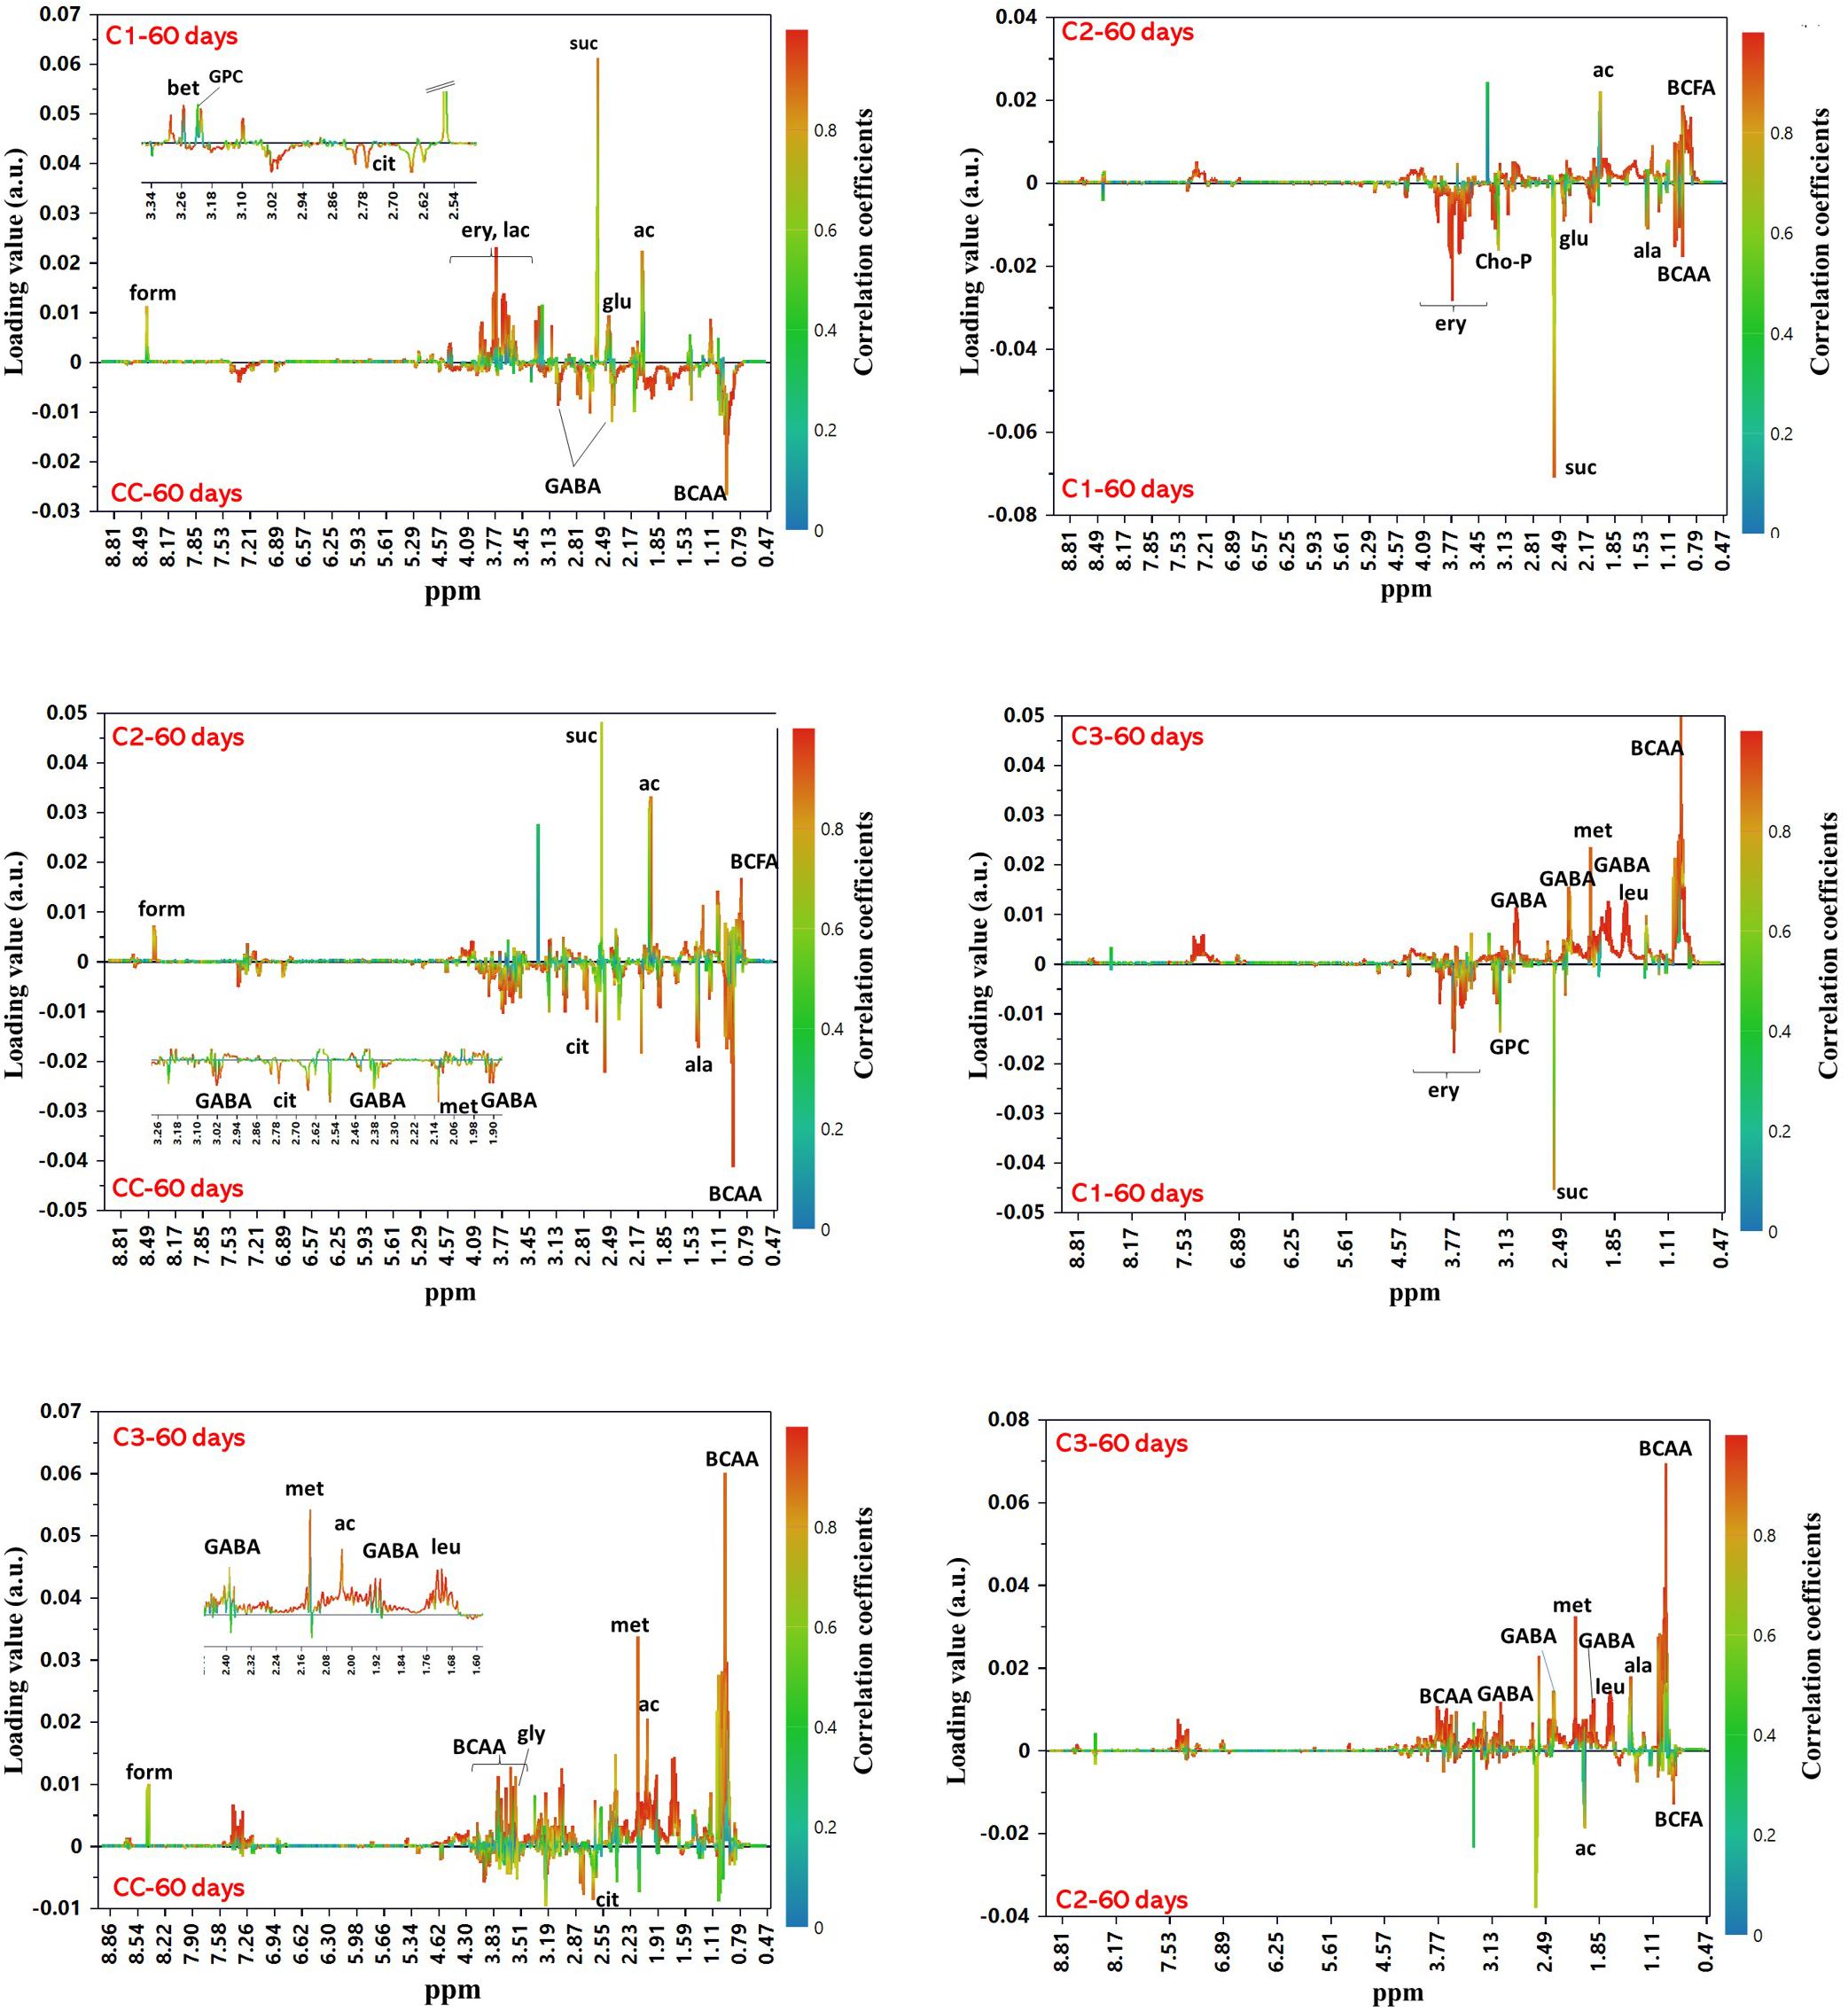
Figure 8. OPLS-DA S-line correlation coefficient plots for the pairwise comparisons between groups of cheeses at 60 days of ripening. For all models Q2Y > 0.95 and CV-ANOVA p-value < 0.0001. Only the signals from the major contributing metabolites toward the class separation are labeled (cutoff values: p(cov) ≥|0.05| and p(cor) ≥|0.5|). Abbreviations: ac, acetic acid; ala, alanine; BCAA, branched-chain amino acids; BCFA, branched-chain fatty acids; cho-P, phospho-choline; cit, citric acid; ery, erythritol; form, formic acid; GABA, γ-aminobutyric acid; gly, glycine; glu, glutamate; GPC, glycero-phosphocholine; lac, lactose; leu, leucine; met, methionine; suc, succinic acid.
Overall, the above-mentioned compositional changes observed in the metabolic profile of Caciotta relative to ripening time are in line with the occurrence of cheese fermentation (Mcsween, 2004). Lactose is the most abundant carbohydrate in milk. It is mostly consumed at the beginning of the fermentation as the main energy source for the growth of microorganisms. As fermentation progressed, the bacteria degraded also the milk proteins and released peptides and free AA, contributing to the general flavor and sensory quality of cheese. In particular, BCAA and methionine are some of the major precursors of cheese aroma compounds. These metabolites were particularly abundant in C3 and CC that, according to our sensorial analysis, were also the cheeses with the most intense aroma. GABA is the decarboxylation product of L-glutamate which is naturally present in caseins. It possesses several physiological activities, such as neurotransmission, antianxiety, and improves brain function and long-term memory (Wu and Sun, 2015). During fermentation, several LAB and NSLAB have been shown to produce GABA in response to stress due to acidic conditions (Dhakal et al., 2012; Valenzuela et al., 2019). This activity appears to vary widely among LAB strains and to depend on fermentation parameters such as pH and temperature. GABA has been also associated with a sour flavor note (Ochi et al., 2012b). Its high levels in C3 may contribute to the distinctive flavor profile of this cheese, besides giving also an added value compared to the other Caciotta due to its potentially beneficial health-promoting effects. Also organic acids have an important role on the sensory properties of cheese (Singh et al., 2003), besides acting as natural preservatives. They may arise from the hydrolysis of fatty acids, bacterial growth, or the addition of acidulants during cheesemaking. Succinic acid, in particular, is known to be produced by citrate-fermenting strains of LAB (Kaneuchi et al., 1988), while acetic and formic acids are derived mainly from lactose by the hetero-fermentative metabolism of NSLAB (McSweeney and Fox, 2004). The relatively lower levels of succinic and acetic acid and higher abundance of citric acid in the commercial Caciotta compared to C1, C2, and C3 suggests the presence of a higher proportion of non-citrate-fermenting strains in the control cheese.
Conclusion
Cheese has been demonstrated to be an optimal carrier product to deliver living probiotic bacteria, and autochthonous potential probiotic strains would be the best choice for use as adjunct cultures since they should be well-adapted to this food environment (Castro et al., 2015; Fusco et al., 2019; Bancalari et al., 2020). The data obtained in this study have indicated the applicative potential of autochthonous LAB cultures, containing putative probiotic Lactobacillus and Kluyveromyces strains, for the production of ovine Caciotta cheese. The use of combined inoculums with autochthonous cultures and probiotic strains did not statistically affect the gross composition and lipid profile of experimental Caciotta with respect to the control, while improving the sensory characteristics in case of C1 and C3 cheeses. The NMR-based metabolomics approach used in our study highlighted differences in the cheese metabolome as a function of both ripening time and added autochthonous cultures. Both the Kluyveromyces and Lactobacillus probiotic strains survived manufacturing process and retained their viability till the end of ripening, the latter with a concentration much higher than 106 cfu/g, the amount of probiotic bacteria suggested at the time of consumption in order to exert a positive effect on human health. Further studies will aim to assess the survival of the probiotic strains in the human intestinal tract of volunteers fed with probiotic Caciotta cheese and to investigate the influence of the probiotic cheese intake on human metabolomics profile.
Data Availability Statement
The raw data supporting the conclusions of this article will be made available by the authors, without undue reservation.
Ethics Statement
The panel test participants provided written informed consent to participate in this study. Sardinian Region ethic committee did not require the study to be reviewed or approved by an ethic committee.
Author Contributions
AR and MP contributed to the experimental design of the study, interpretation of results, and wrote the manuscript. DP, VM, and SV carried out the experiments. FC performed NMR measurements and analyzed the data. MF carried out the DGGE experiments and supervised the study. SC contributed to the interpretation of the results and the critical revision of the manuscript. All authors read and approved the final manuscript.
Funding
This work was supported by Regione Autonoma della Sardegna (RAS, L.R. 7/2007, CRP 17617, CRP 26076) and partially supported by grants from University of Cagliari (Fondo Integrativo per la Ricerca, FIR, 2016).
Conflict of Interest
The authors declare that the research was conducted in the absence of any commercial or financial relationships that could be construed as a potential conflict of interest.
Acknowledgments
The authors wish to thank Argiolas Formaggi for performing the cheesemaking trials.
Supplementary Material
The Supplementary Material for this article can be found online at: https://www.frontiersin.org/articles/10.3389/fmicb.2020.583745/full#supplementary-material
Footnotes
References
Albano, C., Morandi, S., Silvetti, T., Casiraghi, M. C., Manini, F., and Brasca, M. (2018). Lactic acid bacteria with cholesterol-lowering properties for dairy applications: in vitro and in situ activity. J. Dairy Sci. 101, 10807–10818. doi: 10.3168/jds.2018-15096
Albenzio, M., Santillo, A., Caroprese, M., Ruggieri, D., Napolitano, F., and Sevi (2013). Physicochemical properties of Scamorza ewe milk cheese manufactured with different probiotic cultures. J. Dairy Sci. 96, 2781–2791. doi: 10.3168/jds.2012-6218
Amaral, J. S., Cunha, S. C., Seabra, R. M., Alves, M. R., Oliveira, B. P. P., and Pereira, J. A. (2004). Triacylglycerol composition of walnut (Juglans regia L.) cultivars: characterization by HPLC-ELSD and chemometrics. J. Agric. Food Chem. 52, 7964–7969. doi: 10.1021/jf048918n
Aquilanti, L., Babini, V., Santarelli, S., Osimani, A., Petruzzelli, A., and Clementi, F. (2011). Bacterial dynamics in a raw cow’ s milk Caciotta cheese manufactured with aqueous extract of Cynara cardunculus dried flowers. Lett. Appl. Microbiol. 52, 651–659. doi: 10.1111/j.1472-765X.2011.03053.x
Aradottir, S., and Olsson, B. L. (2005). Methodological modifications on quantification of phosphatidylethanol in blood from humans abusing alcohol, using high-performance liquid chromatography and evaporative light scattering detection. BMC Biochem. 6:18. doi: 10.1186/1471-2091-6-18
Bae, S., Fleet, G. H., and Heard, G. M. (2006). Lactic acid bacteria associated with wine grapes from several Australian vineyards. J. Appl. Microbiol. 100, 712–727. doi: 10.1111/j.1365-2672.2006.02890.x
Bancalari, E., Montanari, C., Levante, A., Alinovi, M., Neviani, E., Gardini, F., et al. (2020). Lactobacillus paracasei 4341 as adjunct culture to enance flavor in short ripened Caciotta-type cheese. Food Res. Int. 135:109284. doi: 10.1016/j.foodres.2020.109284
Bravi, E., Perretti, G., and Montanari, L. (2006). Fatty acids by high-performance liquid chromatography and evaporative light-scattering detector. J. Chromatogr. A 1134, 210–214. doi: 10.1016/j.chroma.2006.09.007
Breuer, U., and Harms, H. (2006). Debaryomyces hansenii – an extremophlic yeast with biotechnological potential. Yeast 23, 415–437. doi: 10.1002/yea.1374
Bro, R., and Smilde, A. K. (2014). Principal component analysis. Anal. Methods 6, 2812–2831. doi: 10.1039/c3ay41907j
Buccioni, A., Minieri, S., Conte, G., Benvenuti, D., Pezzati, A., Antongiovanni, M., et al. (2012). Changes in conjugated linoleic acid and C18:1 isomers profile during the ripening of Pecorino Toscano cheese produced with raw milk. Ital. J. Anim. Sci. 11:e75. doi: 10.4081/ijas.2012.e75
Bylesjo, M., Rantalainen, M., Cloarec, O., Nicholson, J. K., Holmes, E., and Trygg, J. (2006). OPLS discriminant analysis: combining the strengths of PLS-DA and SIMCA classification. J. Chemometrics 20, 341–351. doi: 10.1002/cem.1006
Calasso, M., Ercolini, D., Mancini, L., Stellato, G., Minervini, F., Di Cagno, R., et al. (2016). Relationship among house, rind and core microbiotas during manufacture of traditional Italian cheeses at the same dairy plant. Food Microbiol. 54, 115–126. doi: 10.1016/j.fm.2015.10.008
Calasso, M., Minervini, F., De Filippis, F., Ercolini, D., De Angelis, M., and Gobbetti, M. (2020). Attenuated Lactococcus lactis and surface bacteria as tools for conditioning the microbiota and driving the ripening of semisoft Caciotta cheese. Appl. Environ. Microbiol. 86:e02165-19. doi: 10.1128/AEM.02165-19
Carafa, I., Stocco, G., Franceschi, P., Summer, A., Tuohy, K. M., Bittante, G., et al. (2019). Evaluation of autochthonous lactic acid bacteria as starter and non-starter cultures for the production of Traditional Mountain cheese. Food Res. Int. 115, 209–218. doi: 10.1016/j.foodres.2018.08.069
Castro, J. M., Tornadijo, M. E., Fresno, J. M., and Sandoval, H. (2015). Biocheese: a food probiotic carrier. Biomed Res. Int. 2015:723056. doi: 10.1155/2015/723056
Cebolla, V. L., Membrado, L., Vela, J., and Ferrando, A. C. (1997). Evaporative light-scattering detection in the quantitative analysis of semivolatile polycyclic aromatic compounds by high-performance liquid chromatography. J. Chromatogr. Sci. 35, 141–150. doi: 10.1093/chromsci/35.4.141
Centeno, J. A., Garabald, J. I., Docampo, F., Lorenzo, J. M., and Carballo, J. (2017). Recovering traditional raw-milk Tetilla cheese flavour and sensory attributes by using Kocuria varians and Yarrowia lipolytica adjunct cultures. Int. J. Food Microbiol. 251, 33–40. doi: 10.1016/j.ijfoodmicro.2017.03.014
Cocolin, L., Bisson, L. F., and Mills, D. A. (2000). Direct profiling of the yeast dynamics in wine fermentations. FEMS Microbiol. Lett. 189, 81–87. doi: 10.1111/j.1574-6968.2000.tb09210.x
Coda, R., Brechany, E., De Angelis, M., De Candia, S., Di Cagno, R., and Gobbetti, M. (2006). Comparison of the compositional, microbiological, biochemical, and volatile profile characteristics of nine Italian ewes’ milk cheeses. J. Dairy Sci. 89, 4126–4143. doi: 10.3168/jds.S0022-0302(06)72458-4
Collins, Y. F., McSweeney, P. L. H., and Wilkinson, M. G. (2003). Lipolysis and free fatty acid catabolism in cheese: a review of current knowledge. Int. Dairy J. 13, 841–866. doi: 10.1016/s0958-6946(03)00109-2
Consonni, R., and Cagliani, L. R. (2008). Ripening and geographical characterization of Parmigiano Reggiano cheese by 1H NMR spectroscopy. Talanta 76, 200–205. doi: 10.1016/j.talanta.2008.02.022
Cosentino, S., Pisano, B., Piras, C., Deplano, M., and Palmas, F. (2002). “Characterization of lactic acid bacteria isolated from traditional Fiore Sardo cheese,” in Proceedings International Conference SFAM, (Netherlands: Wageningen), 104–107.
Cosentino, S., Pisano, M. B., Corda, A., Fadda, M. E., and Piras, C. (2004). Genotypic and technological characterization of enterococci isolated from artisanal Fiore Sardo cheese. J. Dairy Res. 71, 445–450. doi: 10.1017/s002202990400041x
De Freitas, I., Pinon, N., Berdogué, J. L., Tournayre, P., Lortal, S., and Thierry, A. (2008). Kluyveromyces lactis but not Pichia fermentans used as adjunct culture modifies the olfactory profiles of Cantalet cheese. J. Dairy Sci. 91, 531–543. doi: 10.3168/jds.2007-0136
De Pasquale, I., Di Cagno, R., Buchin, S., De Angelis, M., and Gobbetti, M. (2019). Use of autochthonous mesophilic lactic acid bacteria as starter cultures for making Pecorino Crotonese cheese: effect on compositional, microbiological and biochemical attributes. Food Res. Int. 116, 1344–1356. doi: 10.1016/j.foodres.2018.10.024
Dhakal, R., Bajpai, V. K., and Baek, K. H. (2012). Production of GABA (γ-aminobutyric acid) by microorganisms: a review. Braz. J. Microbiol. 43, 1230–1241. doi: 10.1590/S1517-83822012000400001
Dolci, P., Ferrocino, I., Giordano, M., Pramotton, R., Vernetti-Prot, L., Zenato, S., et al. (2020). Impact of Lactococcus lactis as starter culture on microbiota and metabolome profile of an Italian raw milk cheese. Int. Dairy J. 110:104804. doi: 10.1016/j.idairyj.2020.104804
Fadda, M. E., Mossa, V., Pisano, M. B., Deplano, M., and Cosentino, S. (2004). Occurrence and characterization of yeasts isolated from artisanal Fiore Sardo cheese. Int. J. Food Microbiol. 95, 51–59. doi: 10.1016/j.ijfoodmicro.2004.02.001
Fadda, M. E., Mossa, V., Pisano, M. B., Deplano, M., and Cosentino, S. (2017). In vitro screening of Kluyveromyces strains isolated from Fiore Sardo cheese for potential use as probiotics. LWT Food Sci. Technol. 75, 100–106. doi: 10.1016/j.lwt.2016.08.020
Fleet, G. H. (2007). Yeasts in food and beverages: Impact on product quality and safety. Curr. Opin. Biotechnol. 18, 170–175. doi: 10.1016/j.copbio.2007.01.010
Folch, J., Lees, M., and Sloane-Stanley, G. H. (1957). A simple method for the isolation and purification of total lipid from animal tissues. J. Biol. Chem. 226, 497–509.
Franz, C. M. A. P., Huch, M., Abriouel, H., Holzapfel, W., and Galvez, A. (2011). Enterococci as probiotics and their implications in food and health. Int. J. Food Microbiol. 151, 125–140. doi: 10.1016/j.ijfoodmicro.2011.08.014
Fuka, M. M., Maksimovic, A. Z., Tanuwidjaja, I., Hulak, N., and Schloter, M. (2017). Chracterization of enterococcal community isolated from an artisan Istrian raw milk cheese: biotechnological and safety aspects. Food Technol. Biotechnol. 55, 368–380. doi: 10.17113/ftb.55.03.17.5118
Fusco, V., Quero, G. M., Poltronieri, P., Morea, M., and Baruzzi, F. (2019). Autochthonous and Probiotic Lactic Acid Bacteria Employed for Production of “Advanced Traditional Cheeses”. Foods 8:412. doi: 10.3390/foods8090412
Giraffa, G. (2003). Functionality of enterococci in dairy products. Int. J. Food Microbiol. 88, 215–222. doi: 10.1016/s0168-1605(03)00183-1
Gobbetti, M., Di Cagno, R., Calasso, M., Neviani, E., Foxd, P. F., and De Angelis, M. (2018). Drivers that establish and assembly the lactic acid bacteria biota in cheeses. Trends Food Sci. Technol. 78, 244–254. doi: 10.1016/j.tifs.2018.06.010
Gobbetti, M., Di Cagno, R., and De Angelis, M. (2010). Functional microorganisms for functional food quality. Crit. Rev. Food Sci. Nutr. 50, 716–727. doi: 10.1080/10408398.2010.499770
Guarrasia, V., Sannino, C., Moschetti, M., Bonanno, A., Di Grigoli, A., and Luca Settanni, L. (2017). The individual contribution of starter and non-starter lactic acid bacteria to the volatile organic compound composition of Caciocavallo Palermitano cheese. Int. J. Food Microbiol. 259, 35–42. doi: 10.1016/j.ijfoodmicro.2017.07.022
Gursoy, O., Seckin, A. K., Kinik, O., and Karaman, A. D. (2012). The effect of using different probiotic cultures on conjugated linoleic acid (CLA) concentration and fatty acid composition of white pickle cheese. Int. J. Food Sci. Nutr. 63, 610–615. doi: 10.3109/09637486.2011.643295
Hanchi, H., Mottawea, W., Sebei, K., and Hammami, R. (2018). The genus Enterococcus: between probiotic potential and safety concerns: an update. Front. Microbiol. 9:1791. doi: 10.3389/fmicb.2018.01791
Homayouni, A., Ansari, F., Azizi, A., Pourjafar, H., and Madadi, M. (2020). Cheese as a potential food carrier to delivery probiotic microorganisms into the human gut: a review. Curr. Nutr. Food Sci. 16, 15–28. doi: 10.2174/1573401314666180817101526
Kaneuchi, C., Seki, M., and Komagata, K. (1988). Production of succinic acid from citric acid and related acids by Lactobacillus strains. Appl. Environ. Microbiol. 54, 3053–3056. doi: 10.1128/AEM.54.12.3053-3056.1988
Karimi, R., Sohrabvandi, S., and Mortazavian, A. M. (2012). Sensory characteristics of probiotic cheese. Compr. Rev. Food Sci. Food Saf. 11, 437–452. doi: 10.1111/j.1541-4337.2012.00194.x
Lanciotti, R., Vannini, L., Chaves Lopez, C., Gobbetti, M., and Guerzoni, M. E. (2005). Evaluation of the ability of Yarrowia lipolytica to impart strain-dependent characteristics to cheese when used as a ripening adjunct. Int. J. Dairy Technol. 58, 89–99. doi: 10.1111/j.1471-0307.2005.00197.x
Laskaridis, K., Serafeimidou, A., Zlatanos, S., Gylou, E., Kontorepanidou, E., and Sagredos, A. (2013). Changes in fatty acid profile of feta cheese including conjugated linoleic acid. J. Sci. Food Agric. 93, 2130–2136. doi: 10.1002/jsfa.6018
Linares, D. M., Gómez, C., Renes, E., Fresno, J. M., Tornadijo, M. E., Ross, R. P., et al. (2017). Lactic acid bacteria and bifidobacteria with potential to design natural biofunctional health-promoting dairy foods. Front. Microbiol. 8:846. doi: 10.3389/fmicb.2017.0084
Marcial-Coba, M. S., Knøchel, S., and Nielsen, D. S. (2019). Low-moisture food matrices as probiotic carriers. FEMS Microbiol. Lett. 366:fnz006. doi: 10.1093/femsle/fnz006
Marrone, R., Balestrieri, A., Pepe, T., Vollano, L., Murru, N., D’Occhio, M. J., et al. (2014). Physicochemical composition, fatty acid profile and cholesterol content of “Pecorino Carmasciano” cheese, a traditional Italian dairy product. J. Food Compos. Anal. 36, 85–89. doi: 10.1016/j.jfca.2014.05.006
Mayrhofer, S., Filipp, R., Lehner, D., Reiterich, C., Kneifel, W., and Domig, K. J. (2014). Suitability of different PCR-DGGE primer sets for the monitoring of lactic acid bacteria in wine. S. Afr. J. Enol. Vitic. 35, 185–195. doi: 10.21548/35-2-1001
Mazzei, P., and Piccolo, A. (2012). 1H HRMAS-NMR metabolomic to assess quality and traceability of mozzarella cheese from Campania buffalo milk. Food Chem. 132, 1620–1627. doi: 10.1016/j.foodchem.2011.11.142
Mcsween, P. L. H. (2004). Biochemistry of Cheese Ripening. Int. J. Dairy Technol. 57, 127–144. doi: 10.1111/j.1471-0307.2004.00147.x
McSweeney, P. L. H., and Fox, P. F. (2004). “Metabolism of residual lactose and of lactate and citrate,” in Cheese: Chemistry, Physics and Microbiology, eds P. F. Fox, P. L. H. McSweeney, M. C. Timothy, and P. G. Timothy (London: Elsevier), 361–371. doi: 10.1016/s1874-558x(04)80074-5
Mele, M., Contarini, G., Cercaci, L., Serra, A., Buccioni, A., Povolo, M., et al. (2011). Enrichment of Pecorino cheese with conjugated linoleic acid by feeding dairy ewes with extruded linseed: effect on fatty acid and triglycerides composition and on oxidative stability. Int. Dairy J. 21, 365–372. doi: 10.1016/j.idairyj.2010.12.015
Merchàn, A. V., Benito, M. J., Galvàn, A. I., and de Herrera, S. R. M. S. (2020). Identification and selection of yeast with functional properties for future application in soft paste cheese. LWT Food Sci. Technol. 124:109173. doi: 10.1016/j.lwt.2020.109173
Montel, M. C., Buchin, S., Mallet, A., Delbes-Paus, C., Vuitton, D., Desmasures, N., et al. (2014). Traditional cheeses: rich and diverse microbiota with associated benefits. Int. J. Food Microbiol. 177, 136–154. doi: 10.1016/j.ijfoodmicro.2014.02.019
Muyzer, G., de Waal, E. C., and Uitterlinden, A. G. (1993). Profiling of complex microbial populations by denaturing gradient gel electrophoresis analysis of polymerase chain reaction-amplified genes coding for 16S rRNA. Appl. Environ. Microbiol. 59, 695–700. doi: 10.1128/AEM.59.3.695-700.1993
Ochi, H., Bamba, T., Naito, H., Iwatsuki, K., and Fukusaki, E. (2012a). Metabolic fingerprinting of hard and semi-hard natural cheeses using gas chromatography with flame ionization detector for practical sensory prediction modeling. J. Biosci. Bioeng. 114, 506–511. doi: 10.1016/j.jbiosc.2012.06.002
Ochi, H., Naito, H., Iwatsuki, K., Bamba, T., and Fukusaki, E. (2012b). Metabolomics-based component profiling of hard and semi-hard natural cheeses with gas chromatography/time-of-flight-mass spectrometry, and its application to sensory predictive modeling. J. Biosci. Bioeng. 113, 751–758. doi: 10.1016/j.jbiosc.2012.02.006
Ooi, L. G., and Liong, M. T. (2010). Cholesterol-lowering effects of probiotics and prebiotics: a review of in vivo and in vitro findings. Int. J. Mol. Sci. 11, 2499–2522. doi: 10.3390/ijms11062499
Pangallo, D., Sakova, N., Korenova, J., Puskarova, A., Krakova, L., Valík, L., et al. (2014). Microbial diversity and dynamics during the production of May bryndza cheese. Int. J. Food Microbiol. 170, 38–43. doi: 10.1016/j.ijfoodmicro.2013.10.015
Pereira Andrade, R., Oliveira, D. R., Lopes, A. C. A., de Abreu, L. R., and Ferreira Duarte, W. (2019). Survival of Kluyveromyces lactis and Torulaspora delbrueckii to simulated gastrointestinal conditions and their use as single and mixed inoculum for cheese production. Food Res. Int. 125:108620. doi: 10.1016/j.foodres.2019.108620
Perotti, M. C., Wolf, I. V., Addis, M., Comunian, R., Paba, A., and Meinardi, C. A. (2014). Incorporation of probiotic bacteria (Lactobacillus acidophilus and Bifidobacterium ssp.) in Argentinean ovine cheese. Dairy Sci. Technol. 94, 255–267. doi: 10.1007/s13594-013-0158-x
Piras, C., Cesare Marincola, F., Savorani, F., Engelsen, S. B., Cosentino, S., Viale, S., et al. (2013). A NMR metabolomics study of the ripening process of the Fiore Sardo cheese produced with autochthonous adjunct cultures. Food Chem. 141, 2137–2147. doi: 10.1016/j.foodchem.2013.04.108
Pisano, M. B., Casula, M., Corda, A., Fadda, M. E., Deplano, M., et al. (2008). In vitro probiotic characteristics of Lactobacillus strains isolated from Fiore Sardo cheese. Ital. J. Food Sci. 4, 505–516.
Pisano, M. B., Fadda, M. E., Deplano, M., Corda, A., Casula, M., and Cosentino, S. (2007). Characterization of Fiore Sardo cheese manufactured with the addition of autochthonous cultures. J. Dairy Res. 74, 255–261. doi: 10.1017/S0022029907002464
Pisano, M. B., Fadda, M. E., Melis, R., Ciusa, M. L., Viale, S., Deplano, M., et al. (2015). Molecular identification of bacteriocins produced by Lactococcus lactis dairy strains and their technological and genotypic characterization. Food Control 51, 1–8. doi: 10.1016/j.foodcont.2014.11.005
Pisano, M. B., Scano, P., Murgia, A., Cosentino, S., and Caboni, P. (2016). Metabolomics and microbiological profile of Italian mozzarella cheese produced with buffalo and cow milk. Food Chem. 192, 618–624. doi: 10.1016/j.foodchem.2015.07.061
Pisano, M. B., Viale, S., Conti, S., Fadda, M. E., Deplano, M., Melis, M. P., et al. (2014). Preliminary evaluation of probiotic properties of Lactobacillus strains isolated from sardinian dairy products. Biomed Res. Int. 2014:286390. doi: 10.1155/2014/286390
Prandini, A., Sigolo, S., and Piva, G. (2011). A comparative study of fatty acid composition and CLA concentration in commercial cheeses. J. Food Compos. Anal. 24, 55–61. doi: 10.1016/j.jfca.2010.04.004
Randazzo, C. L., Pitino, I., De Luca, S., Scifo, G. O., and Caggia, C. (2008). Effect of wild strains used as starter cultures and adjunct cultures on the volatile compounds of the Pecorino Siciliano cheese. Int. J. Food Microbiol. 122, 269–278. doi: 10.1016/j.ijfoodmicro.2007.12.005
Revilla, I., Lobos-Ortega, I., Vivar-Quintana, A., González-Martín, M. I., Hernández-Hierro, J. M., and González-Pérez, C. (2014). Variations in the contents of vitamins A and E during the ripening of cheeses with different compositions. Czech J. Food Sci. 32, 342–347. doi: 10.17221/518/2012-CJFS
Rodrigues, D., Santos, C. H., Rocha-Santos, T. A. P., Gomes, A. M., Goodfellow, B. J., and Freitas, A. C. (2011). Metabolic profiling of potential probiotic or symbiotic cheeses by nuclear magnetic resonance (NMR) spectroscopy. J. Agric. Food Chem. 59, 4955–4961. doi: 10.1021/jf104605r
Rosa, A., Maxia, A., Putzu, D., Atzeri, A., Era, B., Fais, A., et al. (2017). Chemical composition of Lycium europaeum fruit oil obtained by supercritical CO2 extraction and evaluation of its antioxidant activity, cytotoxicity and cell absorption. Food Chem. 230, 82–90. doi: 10.1016/j.foodchem.2017.03.019
Rosa, A., Murgia, S., Putzu, D., Meli, V., and Falchi, A. M. (2015). Monoolein-based cubosomes affect lipid profile in HeLa cells. Chem. Phys. Lipids 191, 96–105. doi: 10.1016/j.chemphyslip.2015.08.017
Saad, N., Delattre, C., Urdaci, M., Schmitter, J. M., and Bressollier, P. (2013). An overview of the last advances in probiotic and prebiotic field. LWT Food Sci. Technol. 50, 1–16. doi: 10.1016/j.lwt.2012.05.014
Sabikhi, L., Sathish, M. H. K., and Mathur, B. N. (2014). Bifidobacterium bifidum in probiotic Edam cheese: influence on cheese ripening. J. Food Sci. Technol. 51, 3902–3909. doi: 10.1007/s13197-013-0945-7
Sameer, B., Ganguly, S., Khetra, Y., and Sabikhi, L. (2020). Development and characterization of probiotic Buffalo milk Ricotta cheese. LWT Food Sci. Technol. 121:108944. doi: 10.1016/j.lwt.2019.108944
Saxelin, M., Korpela, R., and Mayra-Makinen, A. (2003). “Introduction: classifying functional dairy products,” in Functional Dairy Products, eds T. Mattila-Sandholm and M. Saarela (Boca Raton, FL: CRC Press), 1–16. doi: 10.1533/9781855736917.1
Silvetti, T., Capra, E., Morandi, S., Cremonesi, P., Decimo, M., Gavazzi, F., et al. (2017). Microbial population profile during ripening of Protected Designation of Origin (PDO) Silter cheese, produced with and without autochthonous starter culture. LWT Food Sci. Technol. 84, 821–831. doi: 10.1016/j.lwt.2017.06.022
Singh, T. K., Drake, M. A., and Cadwallader, K. R. (2003). Flavour of Cheddar cheese: a chemical and sensory perspective. Compr. Rev. Food Sci. Food Saf. 2, 166–189. doi: 10.1111/j.1541-4337.2003.tb00021.x
Talwalkar, A. L., and Kailasapathy, K. A. (2004). A review of oxygen toxicity in probiotic yogurts: influence on the survival of probiotic bacteria and protective techniques. Compr. Rev. Food Sci. Food Saf. 3, 117–124. doi: 10.1111/j.1541-4337.2004.tb00061.x
Tapia, M. S., Alzamora, S. M., and Chirife, J. (2007). “Effects of water activity (aw) on microbial stability as a hurdle in food preservation,” in Water Activity in Foods: Fundamentals and Applications, eds G. V. Barbosa-Cánovas, A. J. Fontana, S. J. Schmidt, and T. P. Labuza (Hoboken, NJ: Wiley), 239–271. doi: 10.1002/9780470376454.ch10
Terpou, A., Bosnea, L., Kanellaki, M., Plessas, S., Bekatorou, A., Bezirtzoglou, E., et al. (2018). Growth capacity of a novel potential probiotic Lactobacillus paracasei K5 strain incorporated in industrial white brined cheese as an adjunct culture. J. Food Sci. 83, 723–731. doi: 10.1111/1750-3841.14079
Tofalo, R., Fusco, V., Bohnlein, C., Kabisch, J., Logrieco, A. F., Habermannet, D., et al. (2019). The life and time of yeasts in traditional food fermentations. Crit. Rev. Food Sci. Nutr. 59, 1–30. doi: 10.1080/10408398.2019.1677553
Tomaszewska, L., Rakicka, M., Rymowicz, W., and Rywinska, A. (2014). A comparative study on glycerol metabolism to erythritol and citric acid in Yarrowia lipolytica yeast cells. FEMS Yeast Res. 14, 966–976. doi: 10.1111/1567-1364.12184
Trygg, J., and Wold, S. (2002). Orthogonal projections to latent structures (O-PLS). J. Chemom. 16, 119–128. doi: 10.1002/cem.695
Turchi, B., Nuvoloni, R., Fratini, F., Pedonese, F., Ebani, V. V., and Cerri, D. (2011). Caciotta della Garfagnana cheese: selection and evaluation of autochthonous mesophilic lactic acid bacteria as starter cultures. Ital. J. Anim. Sci. 10:e22. doi: 10.4081/ijas.2011.e22
Valenzuela, J., Flórez, A., Vázquez, L., Vasek, O., and Mayo, B. (2019). Production of γ-aminobutyric acid (GABA) by lactic acid bacteria strains isolated from traditional, starter-free dairy products made of raw milk. Benef. Microbes 10, 579–587. doi: 10.3920/BM2018.0176
Wu, C., and Sun, D. (2015). GABA receptors in brain development, function, and injury. Metab. Brain Dis. 30, 367–379. doi: 10.1007/s11011-014-9560-1
Yunita, D., and Dodd, C. E. R. (2018). Microbial community dynamics of a blue-veined raw milk cheese from the United Kingdom. J. Dairy Sci. 101, 4923–4935. doi: 10.3168/jds.2017-14104
Zhang, L., Zhang, X., Liu, C., Li, C., Li, S., Li, T., et al. (2013). Manufacture of Cheddar cheese using probiotic Lactobacillus plantarum K25 and its cholesterol-lowering effects in a mice model. World J. Microbiol. Biotechnol. 29, 127–135. doi: 10.1007/s11274-012-1165-4
Keywords: probiotic cheese, autochthonous cultures, lipids, metabolomics, NMR
Citation: Pisano MB, Rosa A, Putzu D, Cesare Marincola F, Mossa V, Viale S, Fadda ME and Cosentino S (2020) Influence of Autochthonous Putative Probiotic Cultures on Microbiota, Lipid Components and Metabolome of Caciotta Cheese. Front. Microbiol. 11:583745. doi: 10.3389/fmicb.2020.583745
Received: 15 July 2020; Accepted: 29 September 2020;
Published: 21 October 2020.
Edited by:
Uelinton Manoel Pinto, University of São Paulo, BrazilReviewed by:
Zhihong Sun, Inner Mongolia Agricultural University, ChinaFrancesca Silva Dias, Federal University of São Francisco Valley, Brazil
Natan Pimentel, Federal University of São Carlos, Brazil
Copyright © 2020 Pisano, Rosa, Putzu, Cesare Marincola, Mossa, Viale, Fadda and Cosentino. This is an open-access article distributed under the terms of the Creative Commons Attribution License (CC BY). The use, distribution or reproduction in other forums is permitted, provided the original author(s) and the copyright owner(s) are credited and that the original publication in this journal is cited, in accordance with accepted academic practice. No use, distribution or reproduction is permitted which does not comply with these terms.
*Correspondence: Antonella Rosa, YW5yb3NhQHVuaWNhLml0; Flaminia Cesare Marincola, ZmxhbWluaWFAdW5pY2EuaXQ=; Sofia Cosentino, c2Nvc2VudGlAdW5pY2EuaXQ=