 Jian Ma1
 Yixiao Zhu1
 Zhisheng Wang1*Xiong Yu2Rui Hu1Xueying Wang1Guang Cao1Huawei Zou1Ali Mujtaba Shah1Quanhui Peng1Bai Xue1Lizhi Wang1Suonan Zhao3Xiangying Kong3
- 1Low Carbon Breeding Cattle and Safety Production University Key Laboratory of Sichuan Province, Animal Nutrition Institute, Sichuan Agricultural University, Chengdu, China
- 2College of Animal Science, Xinjiang Agricultural University, Urumchi, China
- 3Haibei Demonstration Zone of Plateau Modern Ecological Animal Husbandry Science and Technology, Haibei, China
In ruminants, the bacterial community in the gastrointestinal tract (GIT) has an essential role in healthy growth. Examining the bacterial composition in the GIT between growth-retarded and normal yaks could improve our understanding of the role of microorganisms in yaks with growth retardation. In this study, eight male yaks with growth retardation were used as the growth-retarded yak (GRY) group, and another eight male growth normal yaks (GNYs) with the same breed and age were used as the GNY group. We compared the bacterial community in the rumen, duodenum, jejunum, ileum, cecum, and colon between GRY and GNY groups based on the 16S ribosomal RNA gene sequencing. Alpha-diversity revealed that the Shannon index in the duodenum and ileum of the GNY group was higher (P < 0.05) than that of the GRY group. However, the opposite trend was found in the jejunum and cecum. The principal coordinates analysis (PCoA) showed that the bacterial structure in all segments of GIT differed from each other between two groups. In the rumen, the relative abundances of Ruminococcaceae NK4A214 group, Ruminococcaceae UCG-014, and Treponema 2 were higher (P < 0.05) in the GNY group as compared with the GRY group. However, the Christensenellaceae R-7 group exhibited an opposite trend. In the jejunum, compared with the GNY group, the unclassified Chitinophagaceae was enriched significantly (P < 0.05) in the GRY group. However, the unclassified Peptostreptococcaceae, Christensenellaceae R-7 group, and Lachnospiraceae NK3A20 group were enriched (P < 0.05) in the GNY group. In the ileum, the relative abundances of the Rikenellaceae RC9 gut group and Prevotellaceae UCG-004 were higher (P < 0.05) in the GNY group than those in the GRY group. In the cecum, the GNY group showed a higher (P < 0.05) relative abundance of Prevotellaceae UCG-003 as compared with the GRY group. In the colon, the relative abundances of Treponema 2 and unclassified Lachnospiraceae were slightly higher (0.05 < P < 0.10) in the GNY group than those in the GRY group. Overall, these results improve our knowledge about the bacterial composition in the GIT of growth-retarded and normal yaks, and regulating the bacterial community may be an effective solution to promote the compensatory growth of GRYs.
Introduction
The yak (Bos grunniens) is a major indigenous ruminant inhabiting extreme climate on the Qinghai–Tibetan Plateau at high altitudes from 2,500 to 6,000 m. Most of the yaks in the world are distributed in China, and the milk, meat, fur, and fuel (feces for living fuel) of yaks are used by local Tibetan herdsmen for the major living resources and financial income (Xu T. et al., 2017). In addition, yaks remain semidomesticated status, grazing on the grassland with a natural mating, and have a crucial ecological niche in the Qinghai–Tibetan Plateau ecosystem (Zhang et al., 2016). However, in the Qinghai–Tibetan Plateau, the climatic environment is sharp frost (average temperature −15 to −5°C) with heavy snowfall in the long-term cold season (from October to May). In the cold season, due to the grass is snow-covered and withered, the grassland of the plateau is extremely short of forage. On the other hand, the seasonal reproduction characteristics of yaks, which usually mate from June to October and have a delivery during May to September after a 265 day pregnancy (Zi, 2003), lead to severe malnutrition of yak calves in early life. Previous studies have reported that severe malnutrition of animals during early age restrained normal growth and development in the future (Du et al., 2010; Gu et al., 2017). Therefore, the yaks with growth retardation widely exist on the Qinghai–Tibetan Plateau.
Our previous studies found that compared with growth normal yaks (GNYs), growth-retarded yaks (GRYs) had lower body weight (BW) and feed efficiency and higher morbidity and mortality, so that the economic income of yaks farming was reduced. Additionally, the papillae height of rumen and the ruminal and intestinal weight in GNYs were lower than those in GRYs, indicating that the development of gastrointestinal tract (GIT) of GRYs was dysplastic (Hu et al., 2016, 2019). As important organs for feed digestion, nutrients absorption, endocrine, and immune functions, healthy gastrointestinal development is the foundation of animals’ body nutrients deposition and growth (Celi et al., 2017; Powell et al., 2017). In ruminants, the rumen is a special digestive organ for digesting roughage, and its healthy development has a critical role in the process of digestion, particularly for yaks (digestion of natural grass) (Zhou et al., 2011). Moreover, studies have shown that severe malnutrition of animals during a young age could damage the structure and function of the GIT and then result in subsequent growth retardation (Li et al., 2018; Zhang et al., 2018).
The microbial community in the GIT of mammalian animals has been increasingly identified as an important factor in animals’ growth, health, and production performance (Holmes et al., 2012; Yeoman and White, 2014). The microflora in the GIT is an intricate micro-ecosystem, which mainly composes of ciliate protozoa, anaerobic fungi, archaea, and bacteria (Falony et al., 2016; Cui et al., 2020a). A previous study has found that the microbiota acted as an essential role in regulating homeostasis and nutritional metabolism of the host’s GIT (Rey et al., 2013). Furthermore, symbiotic relationships between the host and microflora in the GIT have been demonstrated to increase the host’s resistibility to external pathogenic bacteria and then to crucially facilitate the maturation of the immune system (Dolan and Chang, 2016; Parker et al., 2017). As metabolites of microorganisms, the butyrate and propionate are deemed important modulatory media (Ohland and Jobin, 2015). In ruminants, microbial fermentation is an important process to digest high fiber feedstuff. The typical example in the rumen is the fibro lytic activity, which contributes to the conversion of crude fiber to volatile fatty acids (VFAs), mainly including acetate, propionate, and butyrate (Jami et al., 2013). As the primary energy substrate, VFAs are produced in the rumen by microbial fermentation and then quickly absorbed by the ruminal epithelium and provide approximately 80% of metabolizable energy for the ruminants (Gozho and Mutsvangwa, 2008). Our previous study found that the GRYs had lower concentrations of butyrate and propionate in the rumen as compared with normal yaks (Hu et al., 2019). Another study in beef calves reported that the relative abundances of Proteobacteria, Rhodospirillaceae, Campylobacterales, and Butyricimonas, which had a vital function in the production of energy and VFA, were decreased in the fecal microbiota of growth-retarded calves compared with normal calves. On the contrary, the relative abundances of suspected pathogens, including Anaeroplasma and Acholeplasma, were increased in growth-retarded calves (Du et al., 2018).
According to the studies mentioned earlier, we can find that the gastrointestinal microflora plays an important role in the healthy growth of animals. On the other hand, because of the convenience of fecal sampling and conventional viewpoint in the rumen as the main functional organ of ruminants, the majority of researchers paid more attention to the bacterial community in the rumen and feces (Wang et al., 2016; Xu H. et al., 2017). However, numerous researches reported that the ruminal or fecal microbial community could not represent all the GIT (de Oliveira et al., 2013; Zhao et al., 2015). Therefore, in the current study, we compared the bacterial community in the rumen, duodenum, jejunum, ileum, cecum, and colon of GRYs and GNYs based on the bacterial 16S ribosomal RNA (rRNA) gene sequencing to improve our understanding of the role of microflora in the nutrition and metabolism of yaks and provide new insights into scientific management by regulating the microbial community of growth-retarded animals.
Materials and Methods
Ethics Statement
This animal experiment was carried out in accordance with the Regulation on the Administration of Laboratory Animals (2017 Revision) promulgated by Decree No. 676 of the State Council. The protocol was authorized and approved by the Institutional Animal Care and Use Committee of Sichuan Agricultural University (Chengdu, Sichuan, China).
Animals and Experimental Design
The study was conducted at the farm of Animal Husbandry and Veterinary Institute of Haibei Prefecture, Qinghai Province, China (altitude approximately 3,200 m; 100°54′ E longitude and 36°57′ N latitude). According to the previous studies on BW of yaks population by our group (Hu et al., 2016, 2019) and investigation results of local yaks population by the Animal Husbandry and Veterinary Institute of Haibei Prefecture, growth retardation is defined as BW that the BW of one yak with the same breed and age is in the low 10% of yaks population in the absence of deformity or early disease signs (Jones et al., 2012). In this experiment, eight male Qinghai Plateau yaks (BW = 74.00 ± 6.41 kg and age = 16 months old) with growth retardation were used as the GRY group. Another eight male GNYs (BW = 111.63 ± 4.03 kg) with the same breed and age were selected as the GNY group. The detailed BW of yaks is presented in Supplementary Table 1. All the yaks were pastured on the same plateau grassland without supplementary feed and housing. After the yaks were marked with ear tags, a 15 day observation period followed by the sample collection was implemented.
Sample Collection
Twelve yaks from two groups, which were close to the group average BW, were slaughtered by captive bolt stunning and exsanguinated humanely. The process of slaughter followed the National Standard Operating Procedures (GB/T 19477-2004, cattle slaughtering, China). After slaughter, the abdominal cavity was opened, and then, the different gastrointestinal segments, including rumen, duodenum, jejunum, ileum, cecum, and colon, were isolated with a suture line to avoid reflux of digesta among adjacent regions. The digesta samples in different GIT were collected and put into the sterile centrifuge tubes, individually. Finally, the digesta samples were immediately frozen in liquid nitrogen and then stored at −80°C until the total DNA extraction.
Microbial DNA Isolation
All the digesta samples were thawed (4°C), and the digesta samples (200 mg) in each GIT were used for total genomic DNA isolation using the TIANamp Stool DNA Kit (TIANGEN, Beijing, China). The concrete operating steps of microbial DNA extraction were according to the manufacturer’s instructions with the bacterial lysis step, bead-beating step using a TGrinder H24 Tissue Homogenizer (TIANGEN, Beijing, China). Subsequently, the DNA purification was processed with a spin column. The concentration and purity of DNA were assessed using 0.8% Agarose Gel Electrophoresis and a NanoDrop 2,000 Spectrophotometer (Thermo Scientific, Waltham, MA, United States). Finally, DNA was diluted to 10 ng/μl using sterile ultrapure water and stored at −80°C for a downstream procedure.
PCR Amplification
The universal primers 515F (5′-GTGCCAGCMGCCGCGGTAA-3′) and 806R (5′-GGACTACHVGGGTWTCTAAT-3′) with 12 nt unique barcodes were used to amplify the V4 variable region of the 16S rRNA gene from all DNA samples (Caporaso et al., 2011). The PCR reactions were carried out in a 25 μl mixture containing 1 × PCR buffer, 1.5 mmol/L MgCl2, 0.4 μmol/L deoxynucleoside triphosphates, each primer at 1.0 μmol/L, 0.5 U of KOD-Plus-Neo DNA Polymerase (TOYOBO, Osaka, Japan), and 10-ng template DNA. The PCR amplification was performed using Applied Biosystems® Gene Amp® PCR System 9,700 (Thermo Scientific, Waltham, MA, United States) according to the following process: initial denaturation at 94°C for 1 min, followed by 30 cycles (denaturation at 94°C for 20 s, annealing at 54°C for 30 s, and extension at 75°C for 30 s), and a final extension at 72°C for 5 min. Three PCR replicates were performed for each sample, and the three replicates per sample for PCR reactions were combined together.
PCR products mixed with 1/6 volume of 6 × loading buffer were loaded on 2% agarose gel for detection. Samples with a bright main strip of approximately 410 bp were chosen for further analysis of purification and quantification. The electrophoresis band was purified via QIAquick Gel Extraction Kit (QIAGEN, Adelaide, SA, Australia). DNA was quantified using Qubit@ 2.0 Fluorometer (Thermo Scientific, Waltham, MA, United States) reference to the electrophoresis preliminary test results. Finally, PCR products from all samples were pooled with an equal molar amount for subsequent sequencing analysis.
High-Throughput Sequencing and Sequencing Data Analysis
Sequencing libraries were generated using TruSeq DNA PCR-Free Sample Prep Kit (Illumina, San Diego, CA, United States) according to the manufacturer’s recommendations, and index codes were added. The library quality was assessed by the Qubit@ 2.0 Fluorometer (Thermo Fisher Scientific, Waltham, MA, United States) and Agilent Bioanalyzer 2,100 system (Agilent Technologies, Carpinteria, CA, United States). Then, the library was sequenced on an Illumina HiSeq 2500 platform (Illumina, San Diego, CA, United States) by 2 × 250 bp paired-end sequencing.
Paired-end reads from the original DNA fragments were merged using FLASH (version 1.03) (Magoč and Salzberg, 2011). Each sample sequence was split from the reads based on the unique Barcodes, and then, the raw data were obtained by truncating the Barcodes sequence. The quality control was conducted via Trimmomatic (version 0.36) (Bolger et al., 2014). Then, the Uchime algorithm was used to remove the chimeras reference to the Gold database to get the clean reads (Edgar et al., 2011). Subsequently, sequences were clustered into operational taxonomic units (OTUs) at 97% identity threshold using UPARSE algorithms in Usearch software (version 8.0), and the representative sequence with the most abundant sequence was selected for each OTU (Edgar, 2013). The assignments of taxonomic OTU were performed using the UCLUST (Edgar, 2010) and Silva database (version 132) (Quast et al., 2013). The PyNAST was used to compare and filter the representative sequences (Gregory et al., 2010). All samples were homogenized, and the samples with the least amount of data were taken as the standard for resampling to avoid the effects of sequencing depth on community diversity.
According to the operations mentioned earlier, the sequencing data analysis was carried out by R software (version 3.5.3). The Vegan was used to calculate the alpha- and beta-diversity parameters. In addition, rarefaction curves were generated based on the number of OTUs. The distance of Bray–Curtis was calculated via the vegdist function of Vegan. The PCoA based on Bray–Curtis dissimilarity matrices was analyzed using the ape package, and the adonis function of Vegan was used to calculate the permutational multivariate analysis of variance. The heat map was obtained with the dominant bacteria using the z-score normalization for each sample [z score = (actual relative abundance of a genus − mean relative abundance of the same genus)/standard deviation]. The heat map and bubble plot were generated using the online resources ImageGP1. Besides, the linear discriminant analysis effect size (LEfSe) method (Segata et al., 2011) was performed to identify bacterial taxa with significant differences between the GNY and GRY groups using the online resources2. In our study, the linear discriminant analysis score ≥ 3.5 was identified as an important contributor to each group (Mörkl et al., 2017).
Statistical Analysis
All statistical analysis was performed using the SPSS software (version 20.0 for Windows, SPSS, Chicago, IL, United States). All data were firstly performed normality and homogeneity of variances tests. Alpha-diversity indexes and the bacterial relative abundance between GNY and GRY groups were analyzed using the t-test. If the data did not satisfy normal distribution or homogeneity of variance, these data were analyzed using the non-parametric test. Data were presented as mean and standard error of the mean. The significance level of alpha-diversity indexes was indicated at P-value < 0.05, and a trend was declared at 0.05 ≤ P-value < 0.10. P-values of < 0.05 after false discovery rate correction of bacterial composition using the Benjamini–Hochberg procedure for the multiple comparisons were considered significant, and a trend was declared at 0.05 ≤ P-value < 0.10.
Results
Data Acquisition and Analysis
In the current study, 72 samples from the digesta of rumen, duodenum, jejunum, ileum, cecum, and colon were collected from two groups. We obtained a total of 2,476,770 raw sequences by 16S rRNA gene sequencing, with an average of 34,399 ± 2,926 (mean ± standard error) sequences per sample. After quality filtering of the sequence, the 2,361,454 valid sequences were obtained, with an average of 32,798 ± 2,801 sequences per sample (Supplementary Table 2). The average sequencing length of all samples was 298 ± 4.25 bp. Based on a 97% nucleotide sequence identity between reads, we identified 8,398, 10,436, 8,130, 6,882, 8,158, and 7,817 OTUs in the rumen, duodenum, jejunum, ileum, cecum, and colon, respectively. The Q30 (Supplementary Table 2) and rarefaction curves (Figure 1) were generated for each sample to evaluate whether sampling provided sufficient OTU coverage to accurately describe the bacterial community of each region. The curves of all samples reached a plateau, suggesting that a sufficient number of sequences had been generated to investigate bacterial diversity in the rumen, duodenum, jejunum, ileum, cecum, and colon.
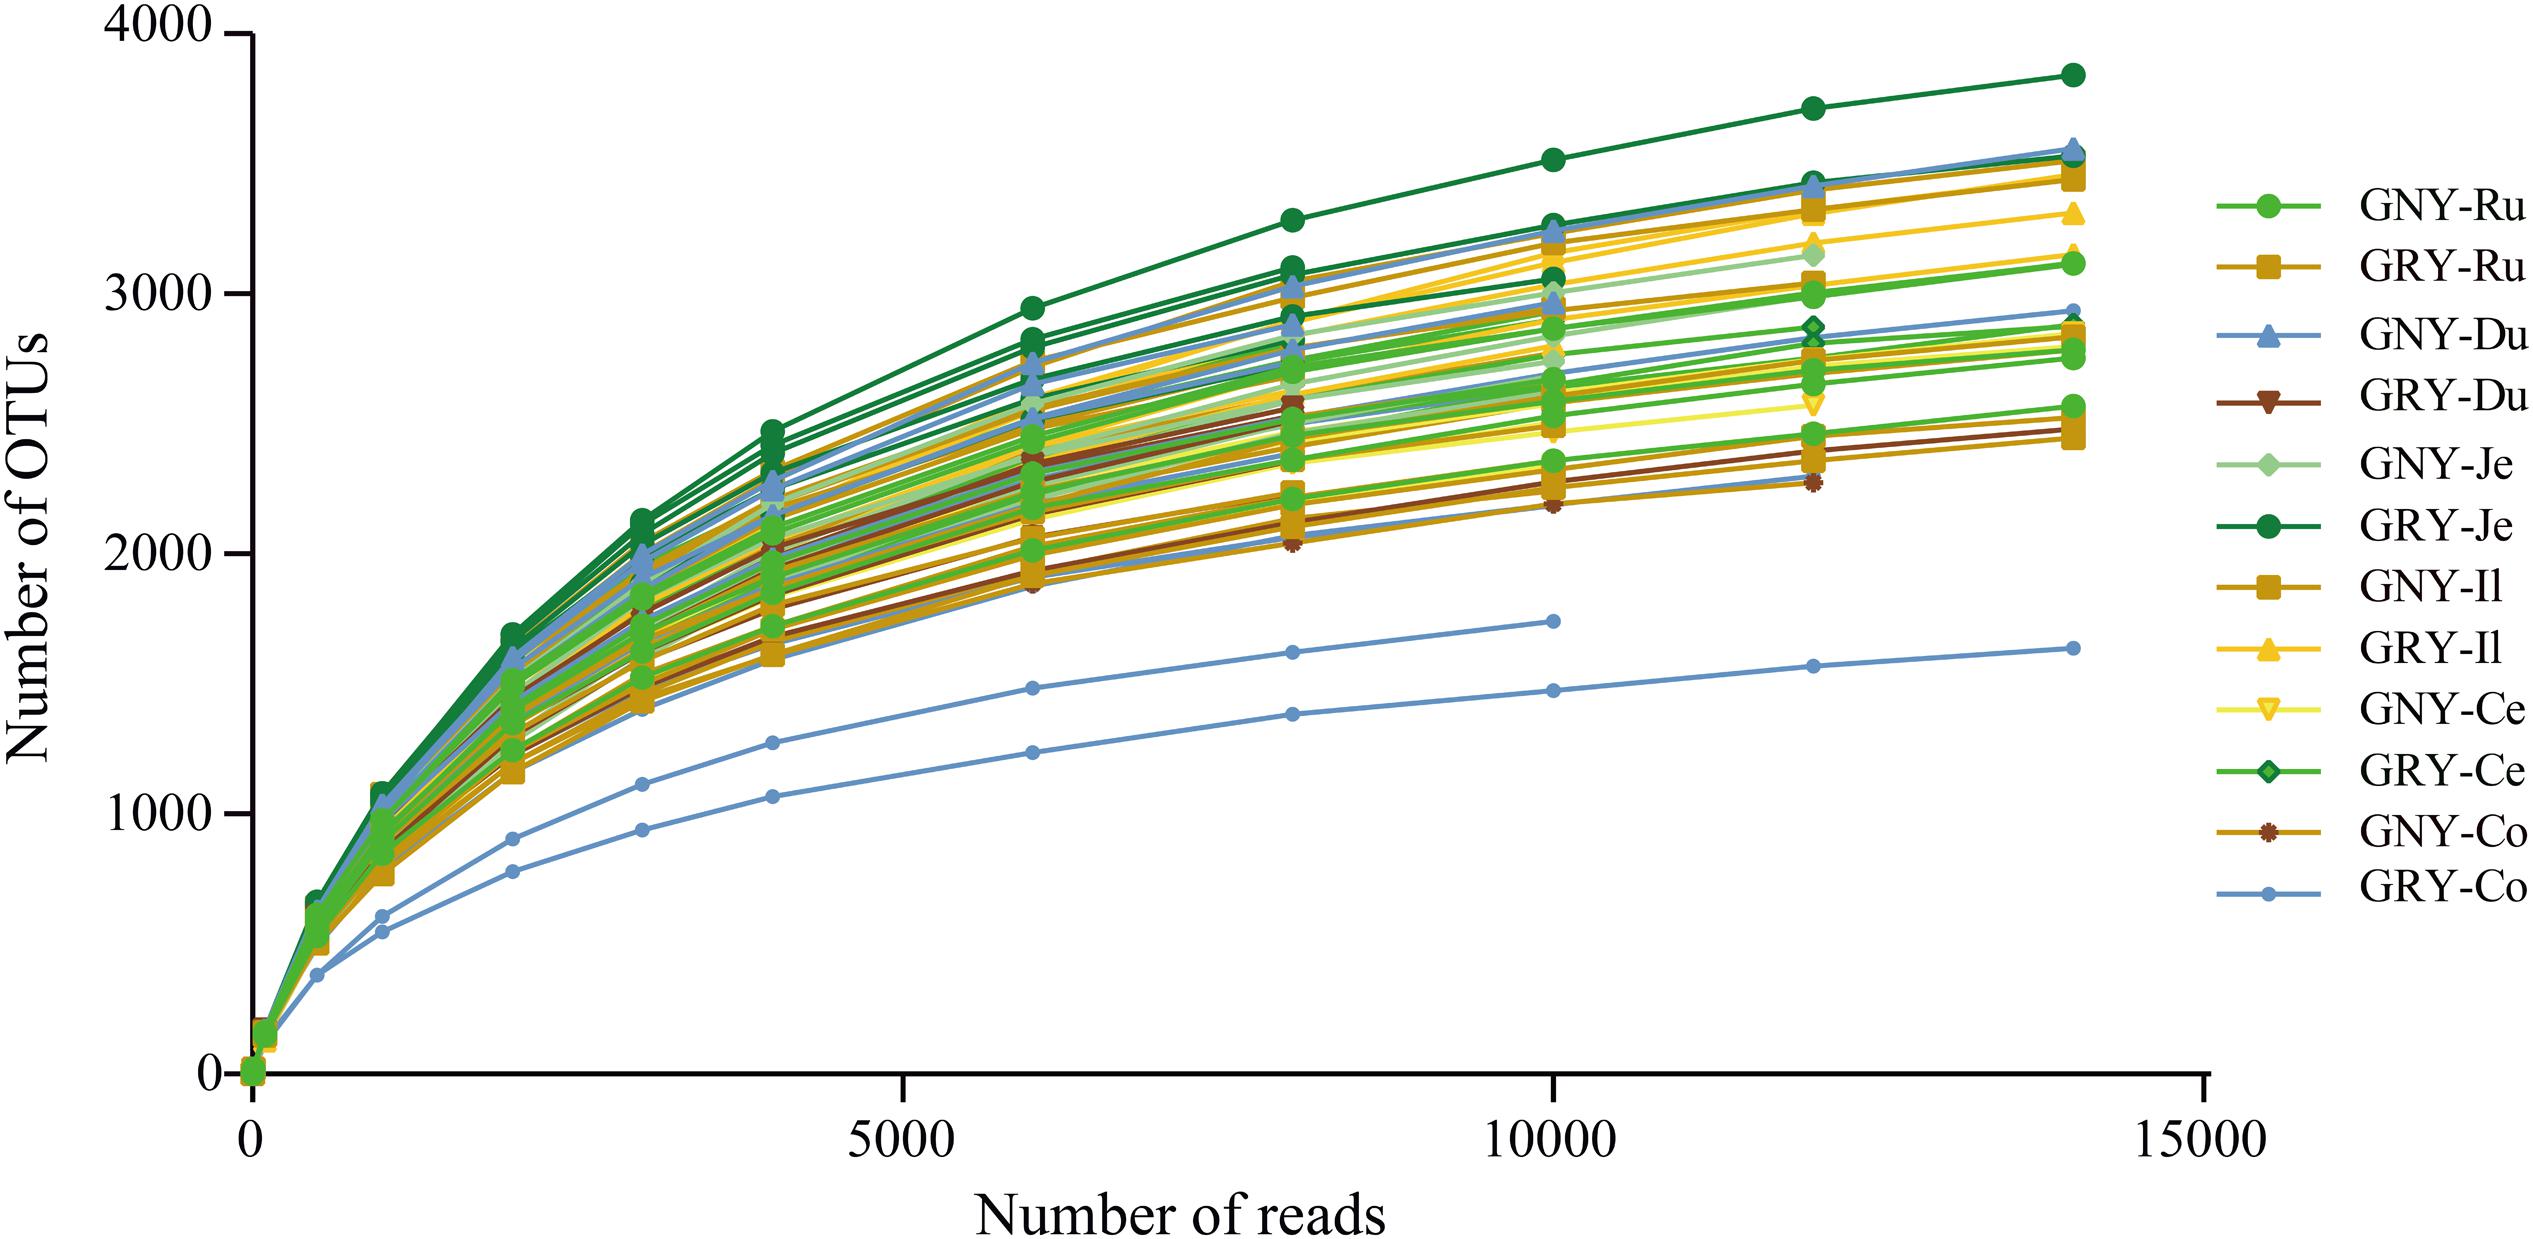
Figure 1. Rarefaction curves for all gastrointestinal digesta samples (n = 72). Operational taxonomic units were assigned at the 97% sequence similarity level. GNY, growth normal yak (n = 6); GRY, growth-retarded yak (n = 6); Ru, rumen; Du, duodenum; Je, jejunum; Il, ileum; Ce, cecum; Co, colon.
Difference of Bacterial Alpha-Diversity Indexes in the Gastrointestinal Tract Between Growth-Retarded and Normal Yaks
Alpha-diversity analysis showed that the observed species, Chao1, ACE, and Shannon indexes in the rumen and colon were similar (P > 0.05) between the GNY and GRY groups (Table 1). In the duodenum and ileum, the Shannon index of the GNY group was higher (P < 0.05) than that of the GRY group. However, the opposite trend was observed in the jejunum and cecum. No significant difference (P > 0.05) of observed species, Chao1, and ACE indexes in the duodenum and ileum was found between them. However, in the GNY group, the observed species, Chao1, and ACE indexes of jejunum and cecum were lower (P < 0.05) than the GRY group (Table 1).
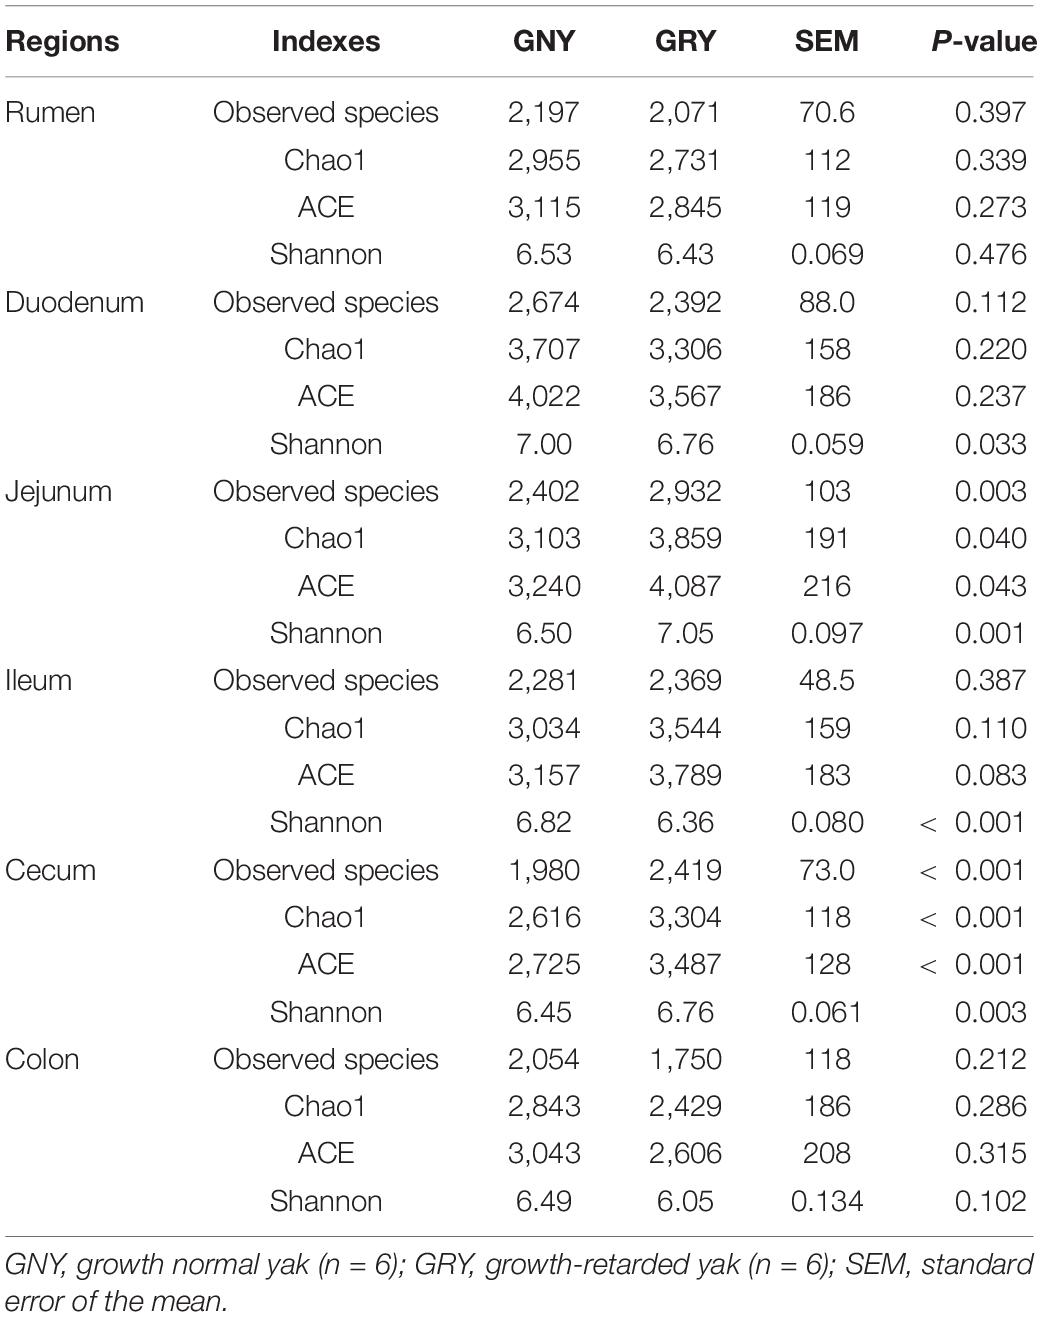
Table 1. Comparison of the alpha-diversity indexes in the different gastrointestinal regions of yaks.
Difference of Bacterial Beta-Diversity in the Gastrointestinal Tract Between Growth-Retarded and Normal Yaks
In the current study, based on the Bray–Curtis dissimilarity matrices, when using the PCoA to examine the structure of microflora in the GIT between the GNY and GRY groups, the bacterial communities in the rumen (Figure 2A), duodenum (Figure 2B), jejunum (Figure 2C), ileum (Figure 2D), and cecum (Figure 2E) were clearly separated from each other. Meanwhile, the permutational multivariate analysis of variance was used to determine whether there is a significant difference of distance in the GIT between the GNY and GRY groups. The results showed significant differences in the rumen (R2 = 0.218, P = 0.003), duodenum (R2 = 0.183, P = 0.010), jejunum (R2 = 0.557, P = 0.003), ileum (R2 = 0.594, P = 0.003), and cecum (R2 = 0.304, P = 0.003) between the two groups (Supplementary Table 3). Besides, in the colon (Figure 2F), the bacterial community had a trend of difference between the two groups (R2 = 0.144, P = 0.051) (Supplementary Table 3).
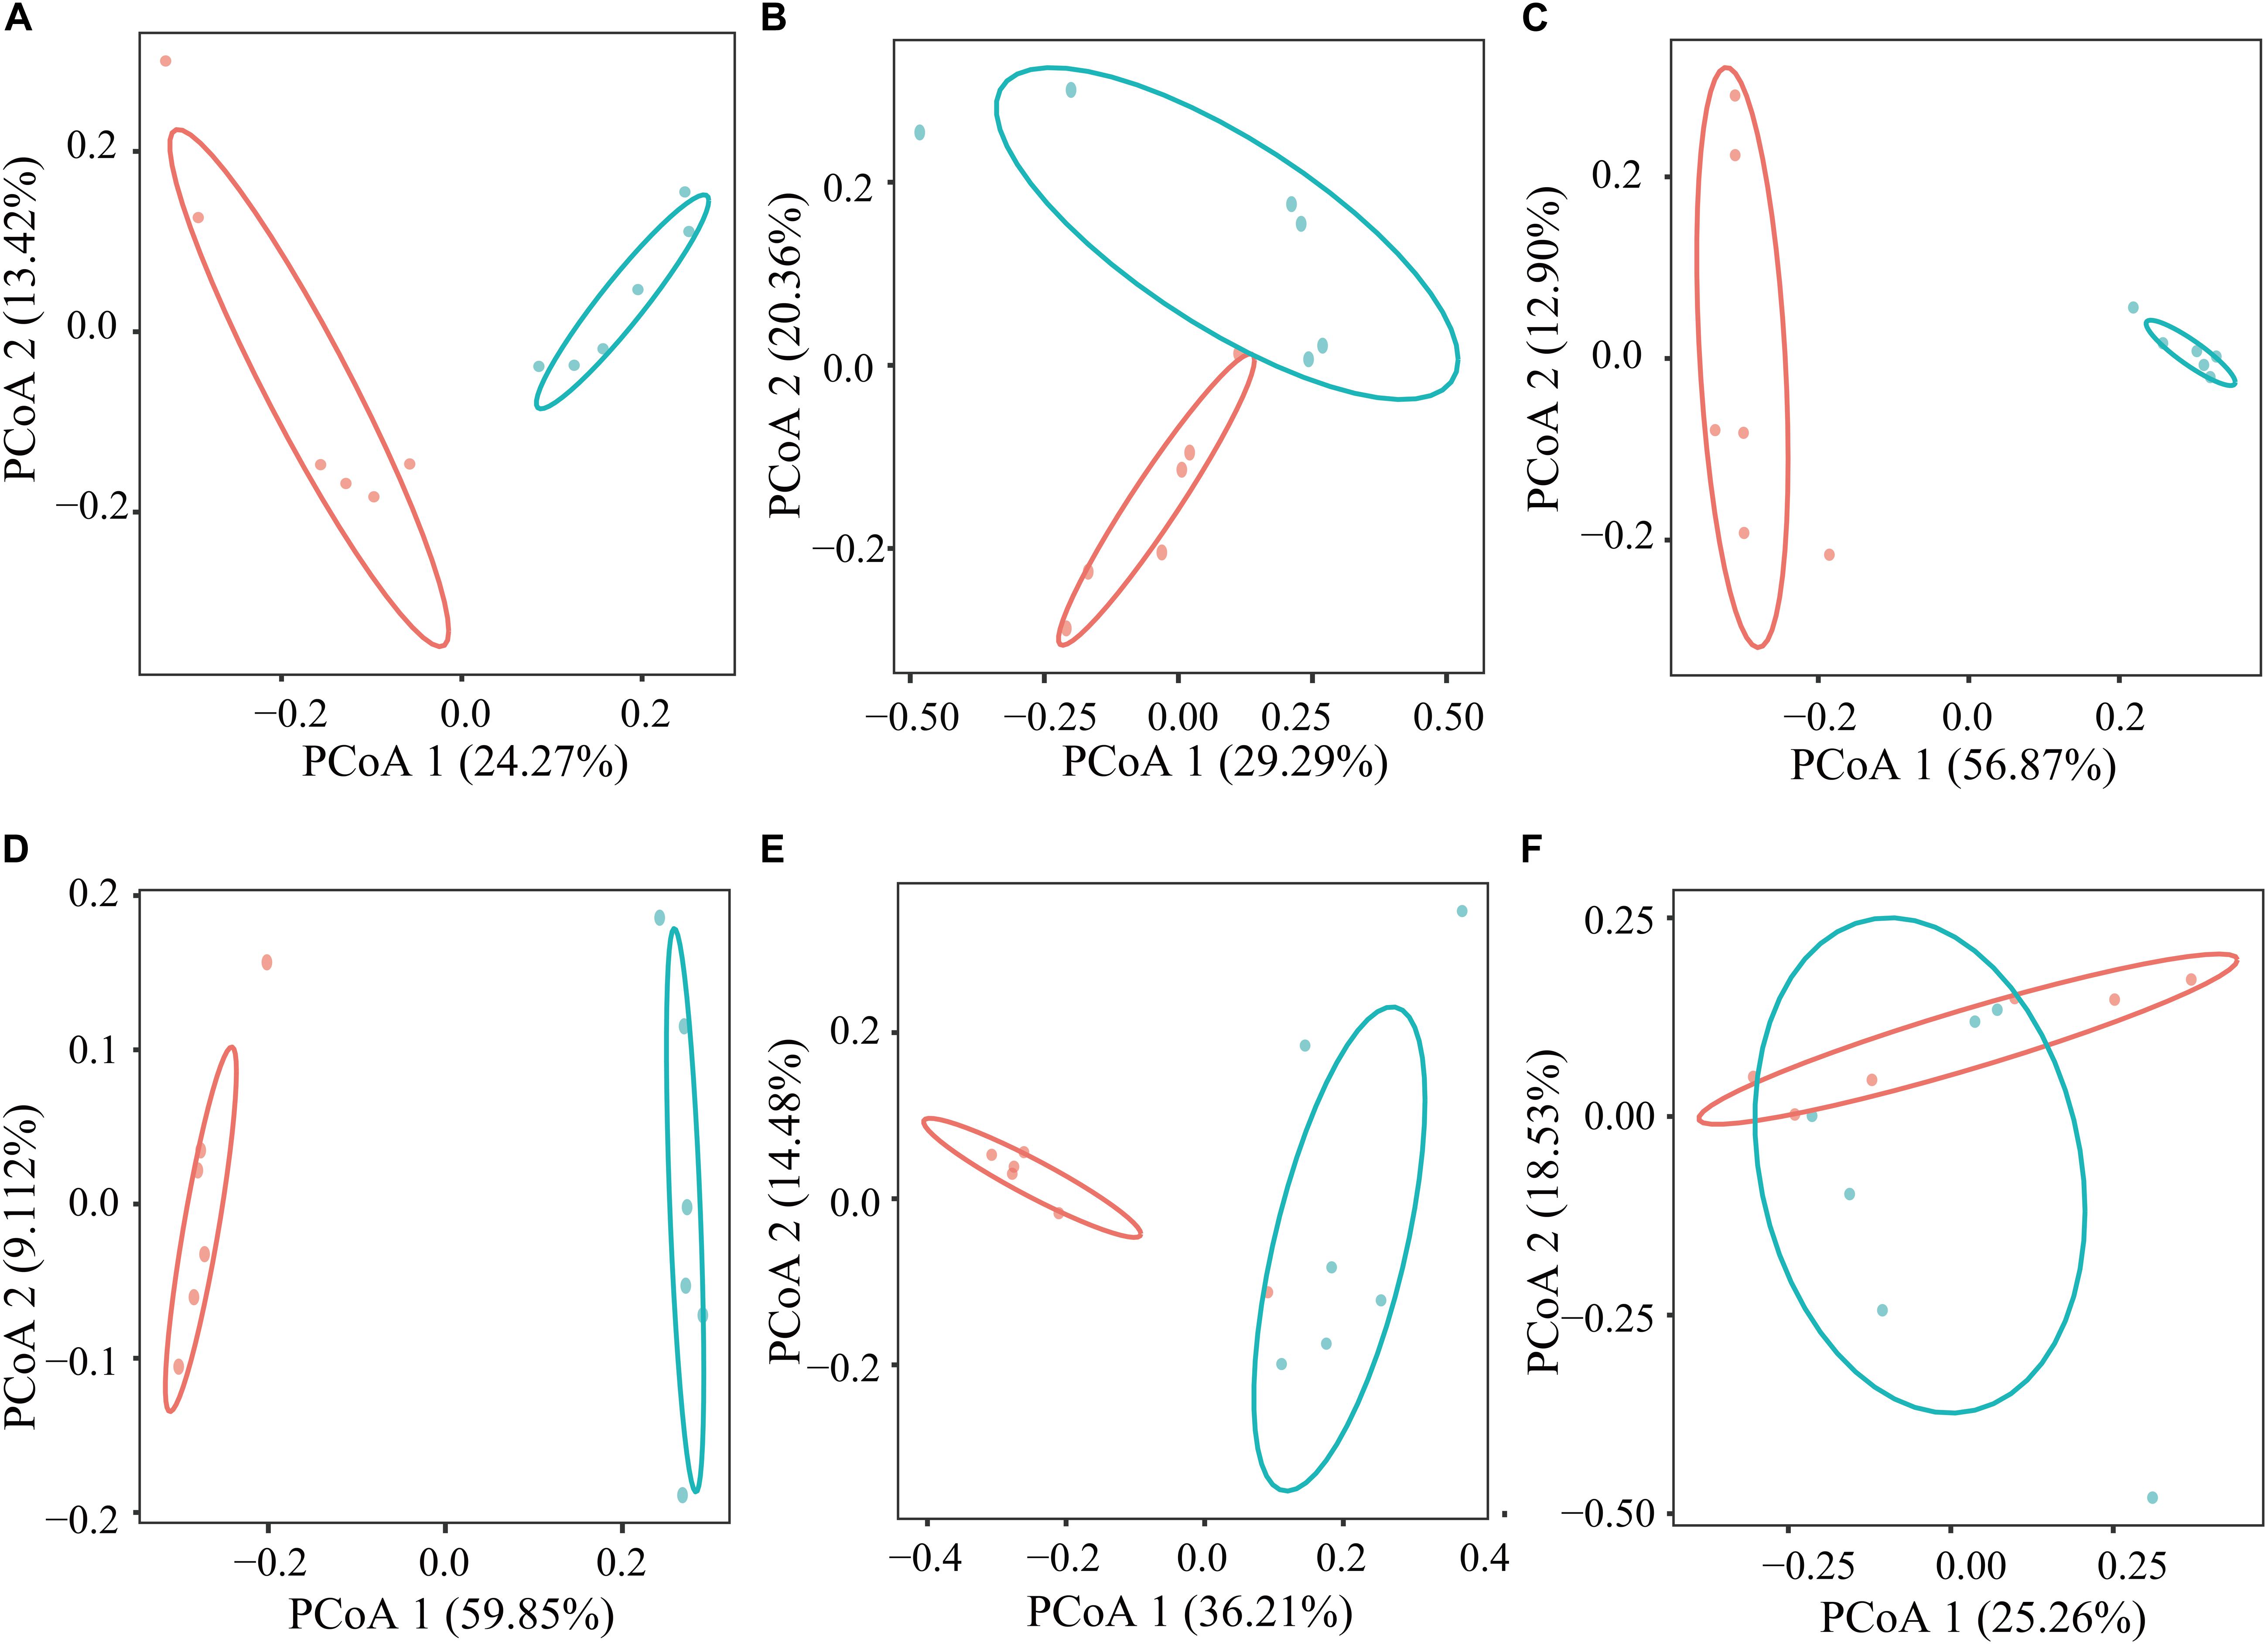
Figure 2. Principal coordinates analysis of bacterial communities in the rumen (A), duodenum (B), jejunum (C), ileum (D), cecum (E), and colon (F) between GNY (n = 6) and GRY (n = 6) groups based on the Bray–Curtis distance. GNY, growth normal yak (red color); GRY, growth-retarded yak (blue color).
Difference of Bacterial Community in the Rumen Between Growth-Retarded and Normal Yaks
At the phylum level, a total of 32 phyla were identified from 12 digesta samples in the rumen, and the number of bacteria phyla detected in the GNY and GRY groups were 29 and 31, respectively. The Bacteroidetes (GNY = 45.23% and GRY = 44.81%) and Firmicutes (GNY = 40.24% and GRY = 34.60%) were the predominant bacteria in the rumen of yaks, accounting for more than 75% of the total relative abundance of total bacteria. Compared with the GNY group, the relative abundance of Spirochetes of the GRY group was lower (P = 0.033). In contrast, the relative abundances of Actinobacteria and Patescibacteria were higher (P < 0.05) in the GRY group than those in the GNY group. Besides, the relative abundances of Firmicutes (P = 0.052) and Tenericutes (P = 0.072) tended to be higher in the GNY group than the GRY group. An opposite trend of Chloroflexi was found between the two groups (Table 2). No obvious difference (P > 0.05) of Firmicutes-to-Bacteroidetes ratio (F/B ratio) was found between the two groups (Figure 3A).
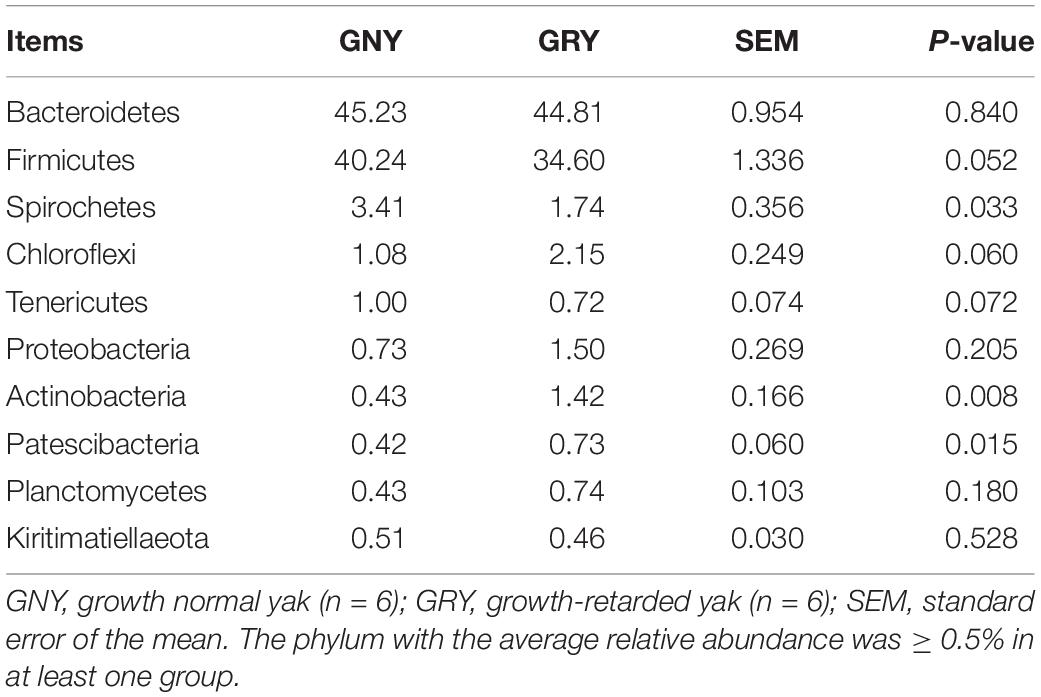
Table 2. Comparison of the relative abundance (%) of the representative bacteria at the phylum level in the rumen of growth-retarded and normal yaks.
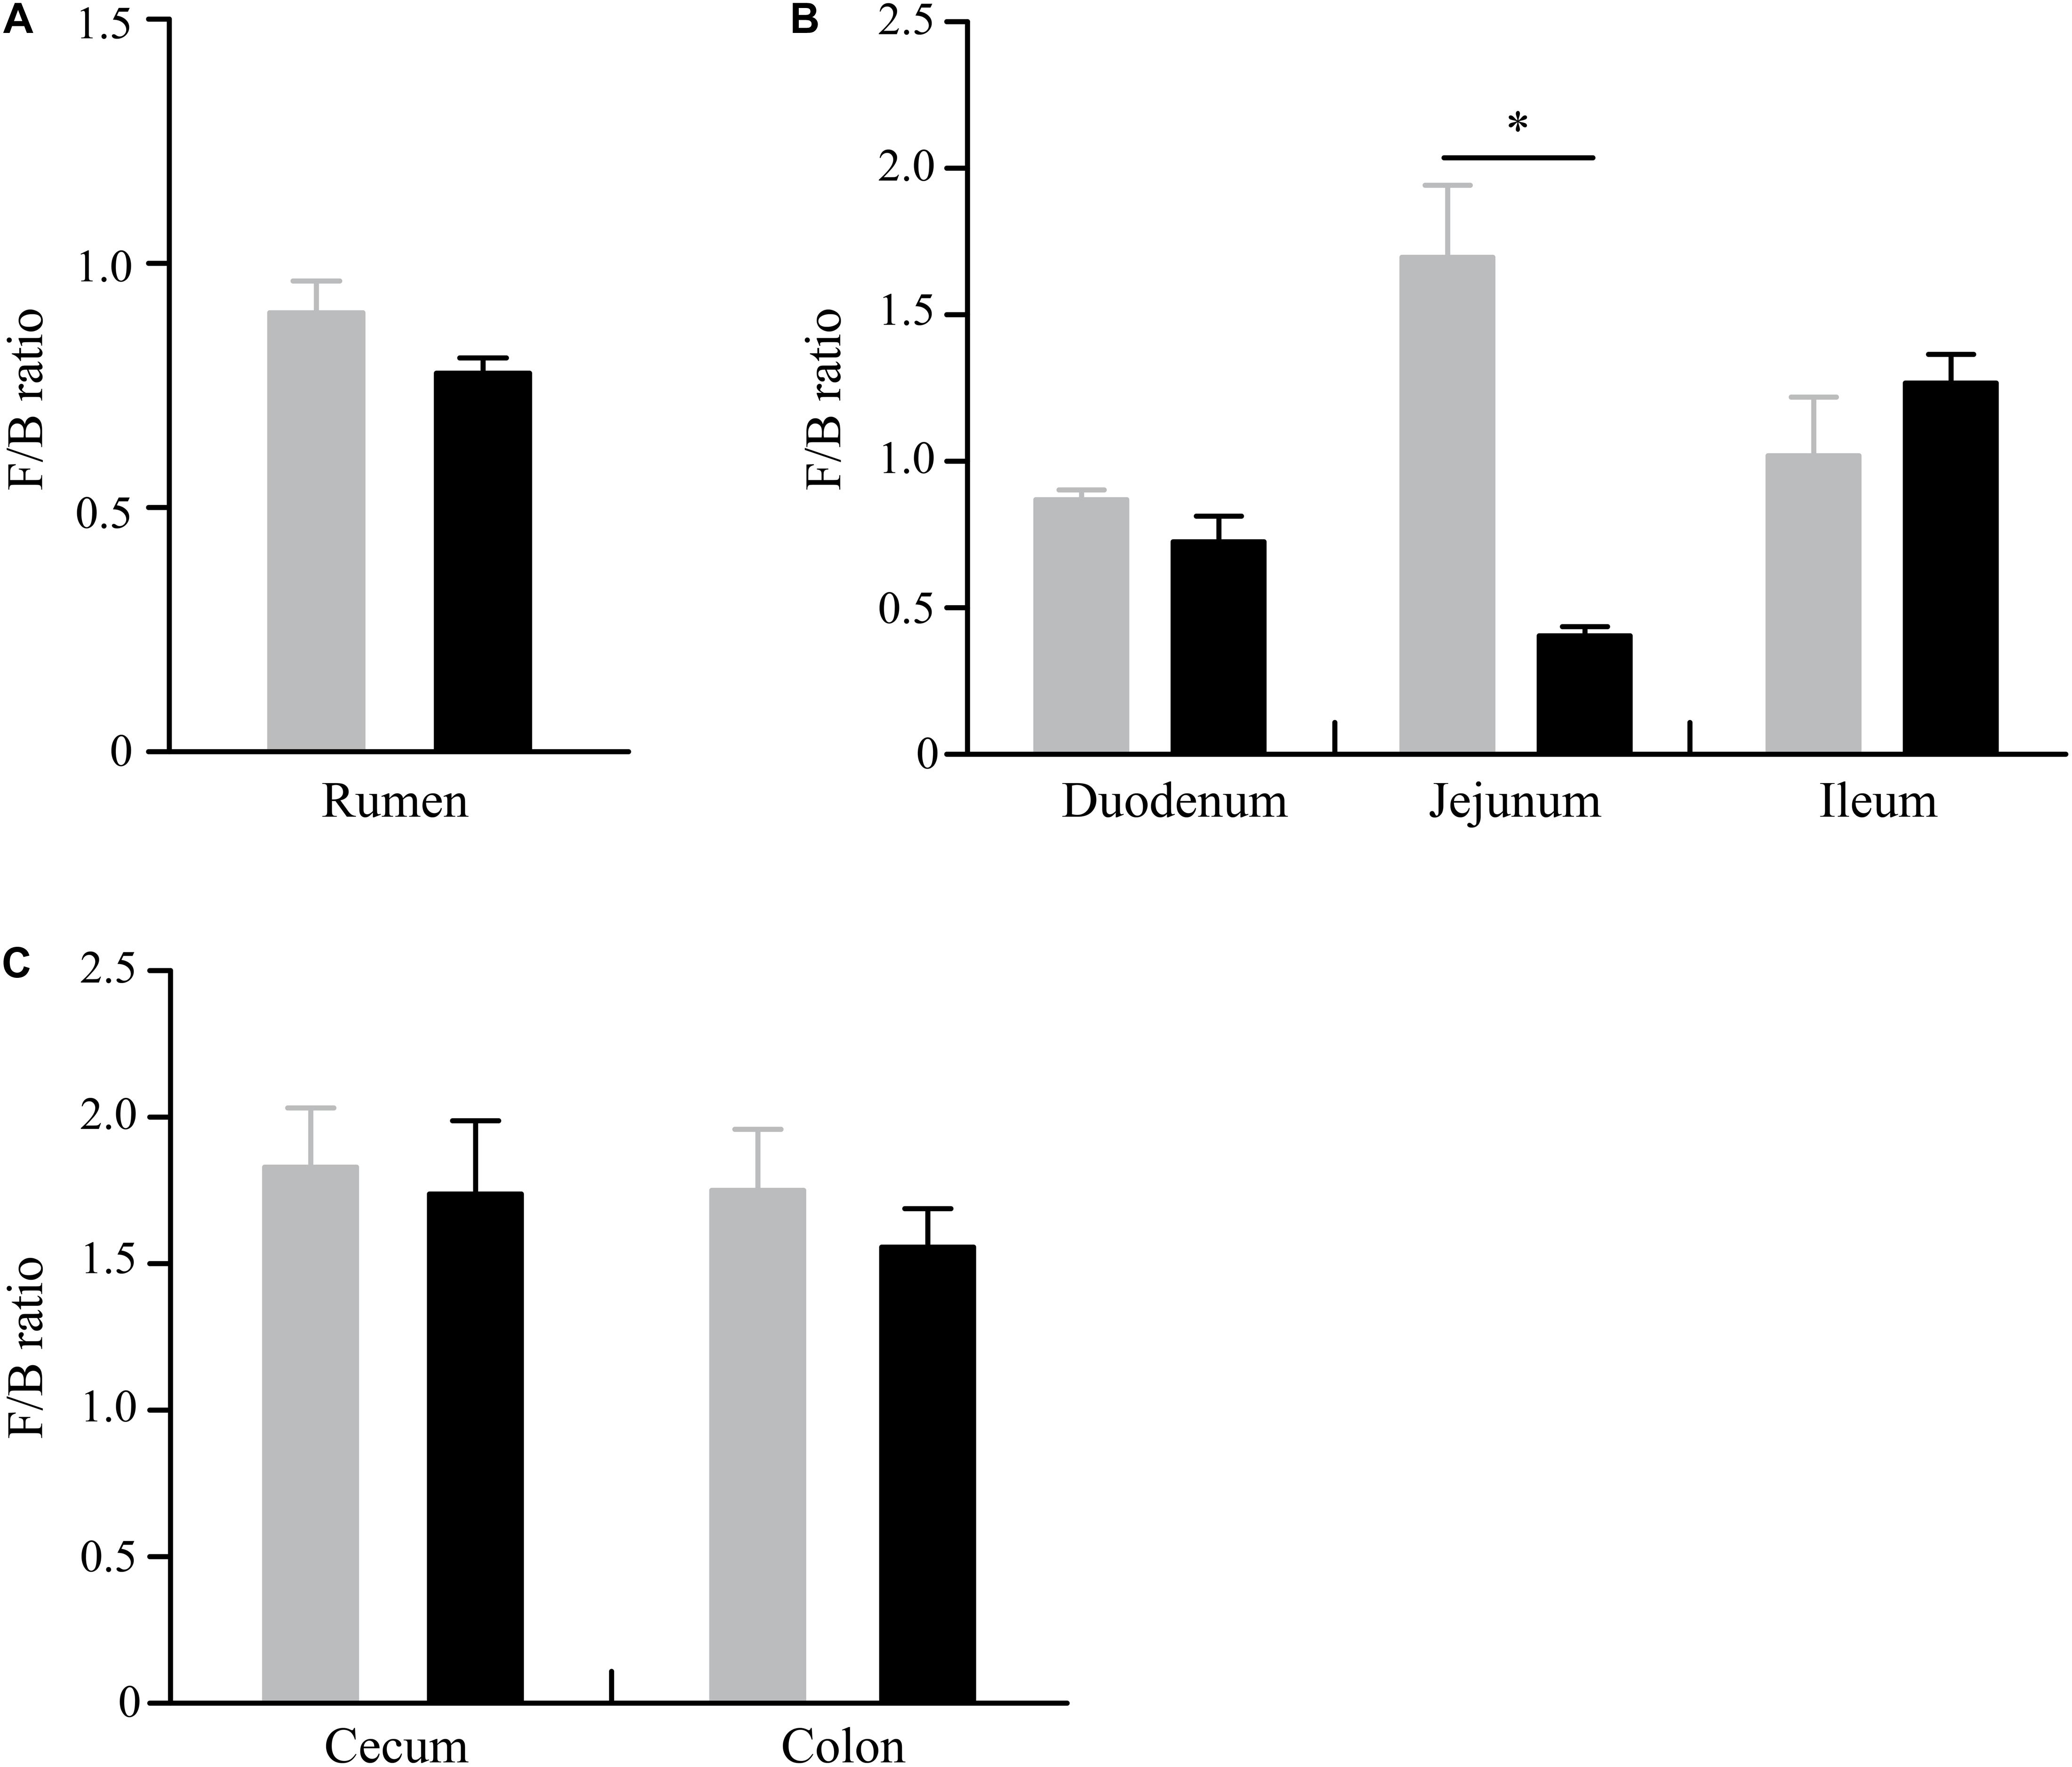
Figure 3. Difference of Firmicutes-to-Bacteroidetes ratio in the rumen (A), small intestine (B), and large intestine (C) between GNY (n = 6) and GRY (n = 6) groups. GNY, growth normal yak (gray bar); GRY, growth-retarded yak (black bar). The asterisk indicates a significant difference between GNY and GRY groups (P < 0.05).
At the genus level (Figure 4A and Supplementary Table 4), Rikenellaceae RC9 gut group was the most dominant bacterium in the ruminal digesta of the two groups (GNY = 13.94% and GRY = 13.95%), followed by the Bacteroidales unclassified F082 (GNY = 8.56% and GRY = 10.23%), Christensenellaceae R-7 group (GNY = 6.17% and GRY = 9.40%), and Prevotella 1 (GNY = 6.22% and GRY = 6.19%). The relative abundances of Ruminococcaceae NK4A214 group, Ruminococcaceae UCG-014, and Treponema 2 were higher (P < 0.05) in the GNY group than those in the GRY group. Compared with the GNY group, a higher (P < 0.05) relative abundance of Christensenellaceae R-7 group was found in the GRY group. Furthermore, the relative abundance of unclassified Bacteroidales UCG-001 in the GNY group was slightly higher (P = 0.084) than that in the GRY group. By using LEfSe analysis, the differential genera were further identified based on the relative abundance of different bacteria. In the rumen, 13 differential bacteria, mainly including Christensenellaceae R-7 group, Treponema 2, and Ruminococcaceae UCG-014, were identified between the two groups (Figure 4B).
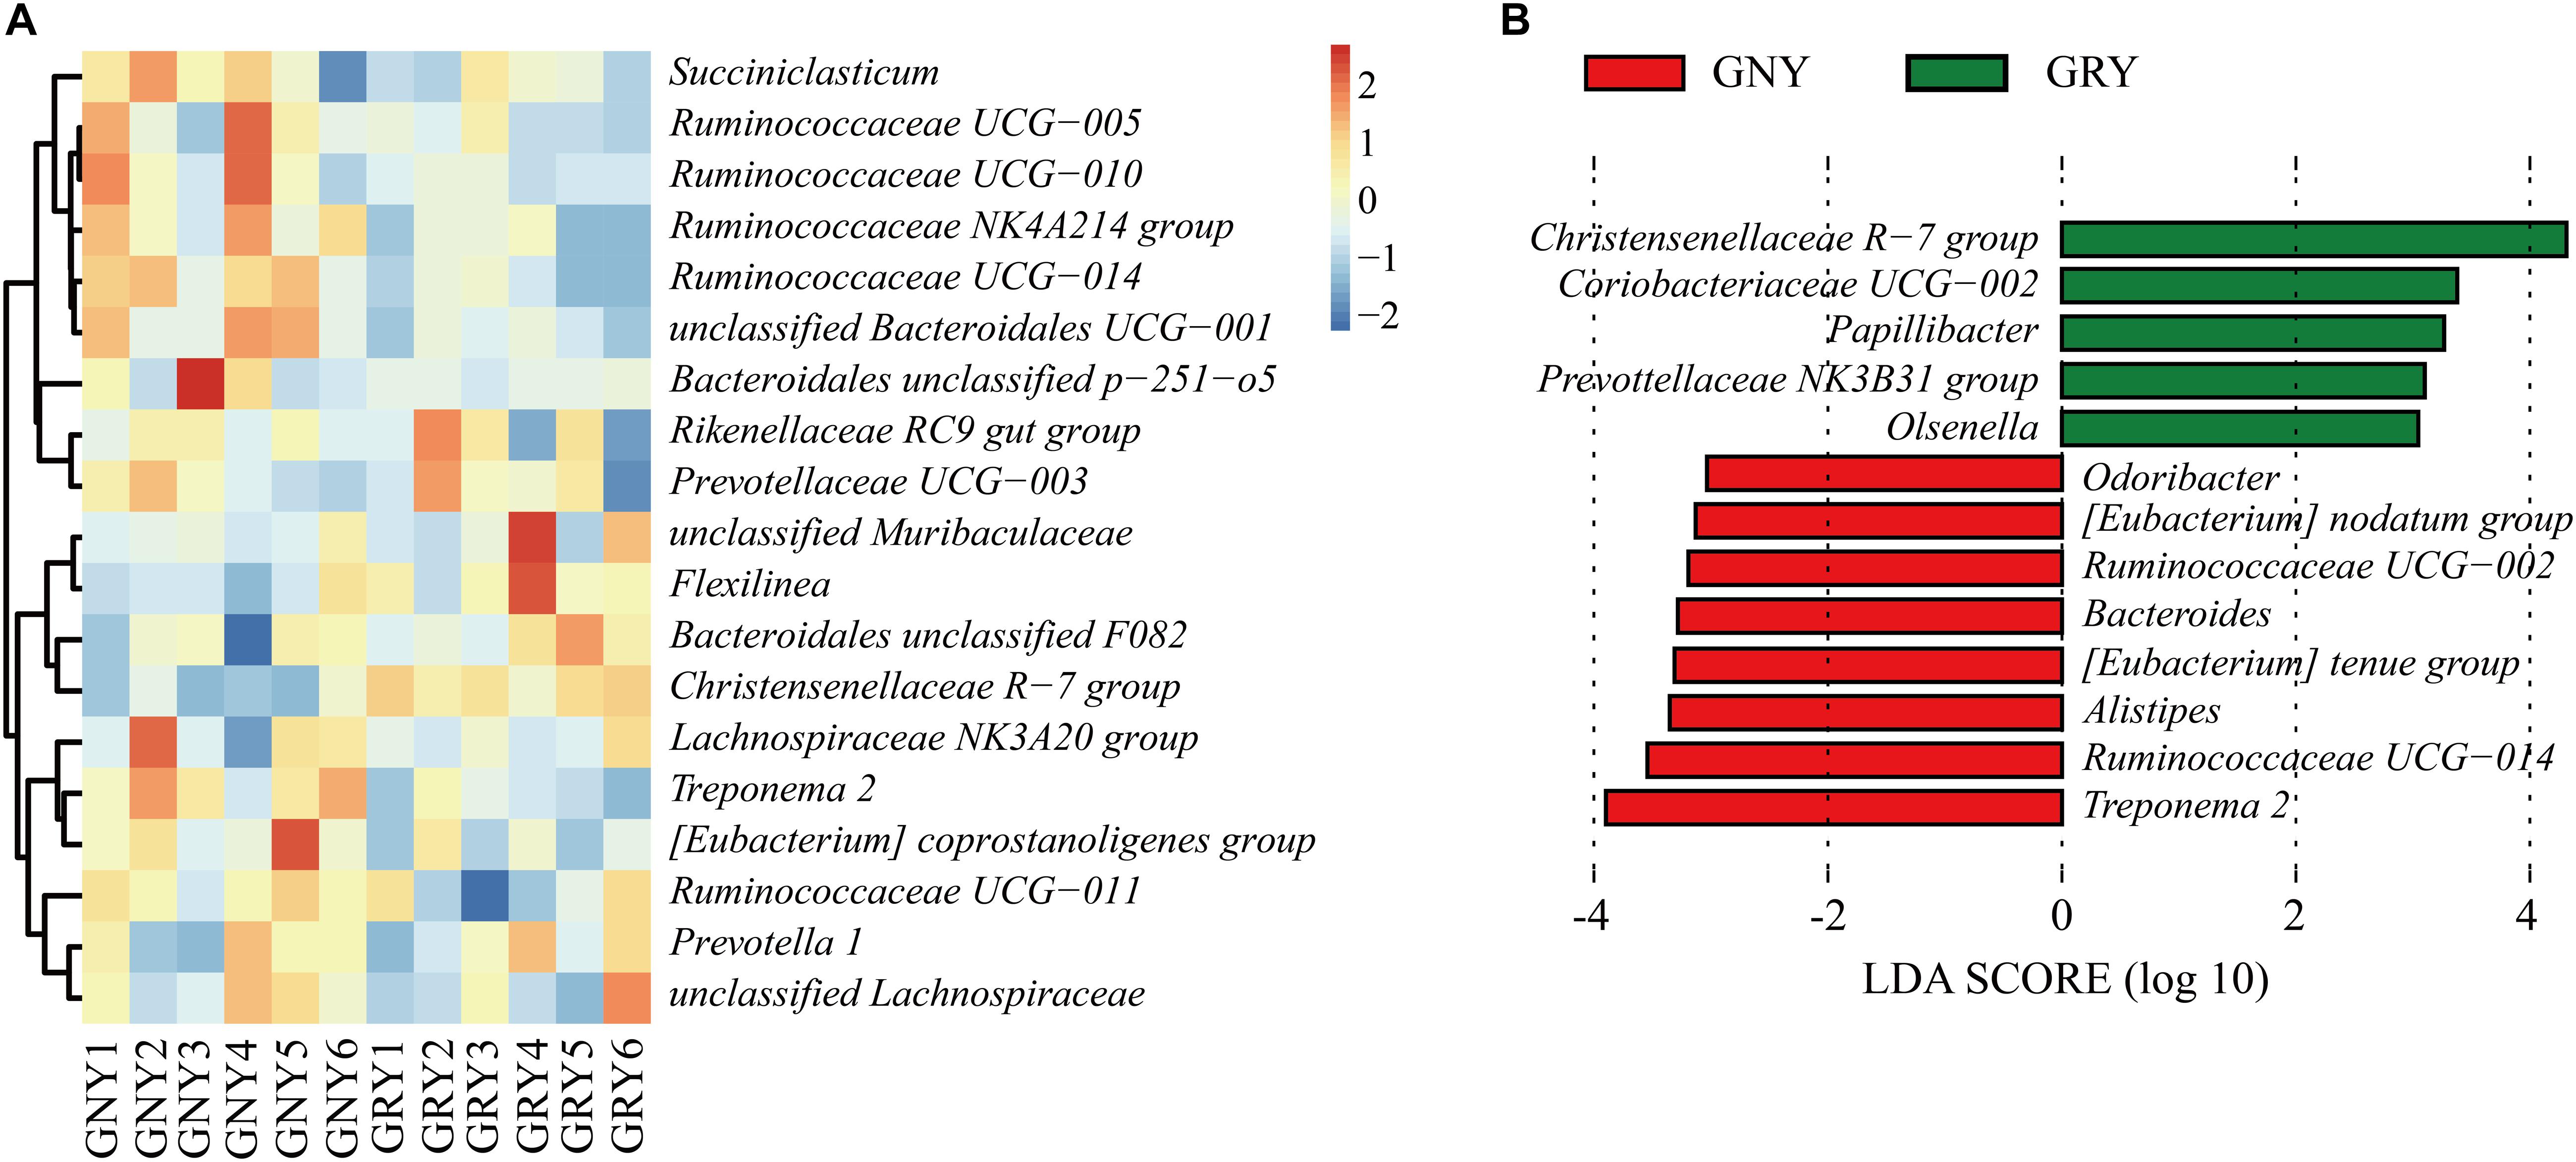
Figure 4. Taxa plots depicting the ruminal bacterial composition of GNY (n = 6) and GRY (n = 6) groups. (A) Heat map showing the relative abundance of dominant bacteria at genus level in the rumen. Genus with the average relative abundance was ≥ 1% in at least one group. (B) Linear discriminant analysis effect size analysis identified the most differentially abundant genera between GNY (red) and GRY (green) groups. Genus with linear discriminant analysis values higher than 3.5 is displayed. GNY, growth normal yak; GRY, growth-retarded yak.
Difference of Bacterial Community in the Small Intestine Between Growth-Retarded and Normal Yaks
In the small intestine, we observed a total of 37 phyla in 36 digesta samples. The number of bacteria phyla identified in the duodenum, jejunum, and ileum of the GNY and GRY groups were 31 and 30, 30 and 31, and 30 and 32, respectively. The Firmicutes (duodenum: GNY = 36.58% and GRY = 34.04%; jejunum: GNY = 38.94% and GRY = 15.18%; ileum: GNY = 35.01% and GRY = 38.03%), Bacteroidetes (duodenum: GNY = 42.15% and GRY = 48.36%; jejunum: GNY = 24.89% and GRY = 37.67%; ileum: GNY = 34.39% and GRY = 27.86%), and Proteobacteria (duodenum: GNY = 5.77% and GRY = 4.40%; jejunum: GNY = 9.49% and GRY = 17.81%; ileum: GNY = 12.28% and GRY = 14.13%) were the dominant bacteria in each segment of small intestine. In the duodenum, the GNY group showed a slightly higher (P = 0.055) relative abundance of Planctomycetes as compared with the GRY group. In the jejunum, the relative abundance of Bacteroidetes in the GRY group was higher (P < 0.05) than that in the GNY group. However, an opposite tendency was found in the ileum. In the jejunum, the relative abundances of Proteobacteria, Acidobacteria, Planctomycetes, Actinobacteria, and Gemmatimonadetes in the GRY group were higher (P < 0.05) than those in the GNY group (Table 3). Additionally, the F/B ratio was similar (P > 0.05) in the duodenum and ileum between the two groups. However, compared with the GRY group, the F/B ratio of the GNY group exhibited greater (P < 0.05) in the jejunum (Figure 3B).

Table 3. Comparison of the relative abundance (%) of the representative bacteria at the phylum level in the small intestine of growth-retarded and normal yaks.
At the genus level (Figures 5A–C and Supplementary Table 5), results showed that predominant genera in the small intestine of yaks included Rikenellaceae RC9 gut group, Lactobacillus, Christensenellaceae R-7 group, and Ruminococcaceae UCG-005, as well as those unclassified bacteria derived from Muribaculaceae, Chitinophagaceae, and Peptostreptococcaceae. In the jejunum, compared with the GNY group, the bacteria, including unclassified Chitinophagaceae, Terrimonas, Niastella, Flavisolibacter, Flavitalea, Paenibacillus, unclassified Micropepsaceae, unclassified Subgroup 6 (Acidobacteria), and unclassified Bifidobacteriaceae, were significantly enriched (P < 0.05) in the GRY group. However, the unclassified Peptostreptococcaceae, Christensenellaceae R-7 group, Romboutsia, Clostridium sensu stricto 1, (Eubacterium) coprostanoligenes group, Lachnospiraceae NK3A20 group, Ruminococcus 2, Turicibacter, and Flexilinea were significantly enriched (P < 0.05) in the GNY group. In the ileum, the relative abundances of Rikenellaceae RC9 gut group, unclassified Muribaculaceae, Prevotellaceae UCG-004, Alistipes, Prevotellaceae UCG-003, Ruminococcaceae UCG-005, (Eubacterium) coprostanoligenes group, Ruminococcaceae UCG-010, unclassified Ruminococcaceae, Ruminococcaceae UCG-013, and unclassified Clostridiales vadinBB60 group were higher (P < 0.05) in the GNY group than those in the GRY group. However, the relative abundances of unclassified Peptostreptococcaceae, (Eubacterium) tenue group, Romboutsia, and Clostridium sensu stricto 1 displayed an opposite trend. In the duodenum, jejunum, and ileum, 7, 35, and 22 differential bacteria were observed between the two groups, respectively. Of these, the Ruminococcaceae UCG-014, Christensenellaceae R-7 group, and Ruminococcaceae UCG-005 showed the highest difference in the corresponding gastrointestinal regions between the two groups (Figures 5D–F).
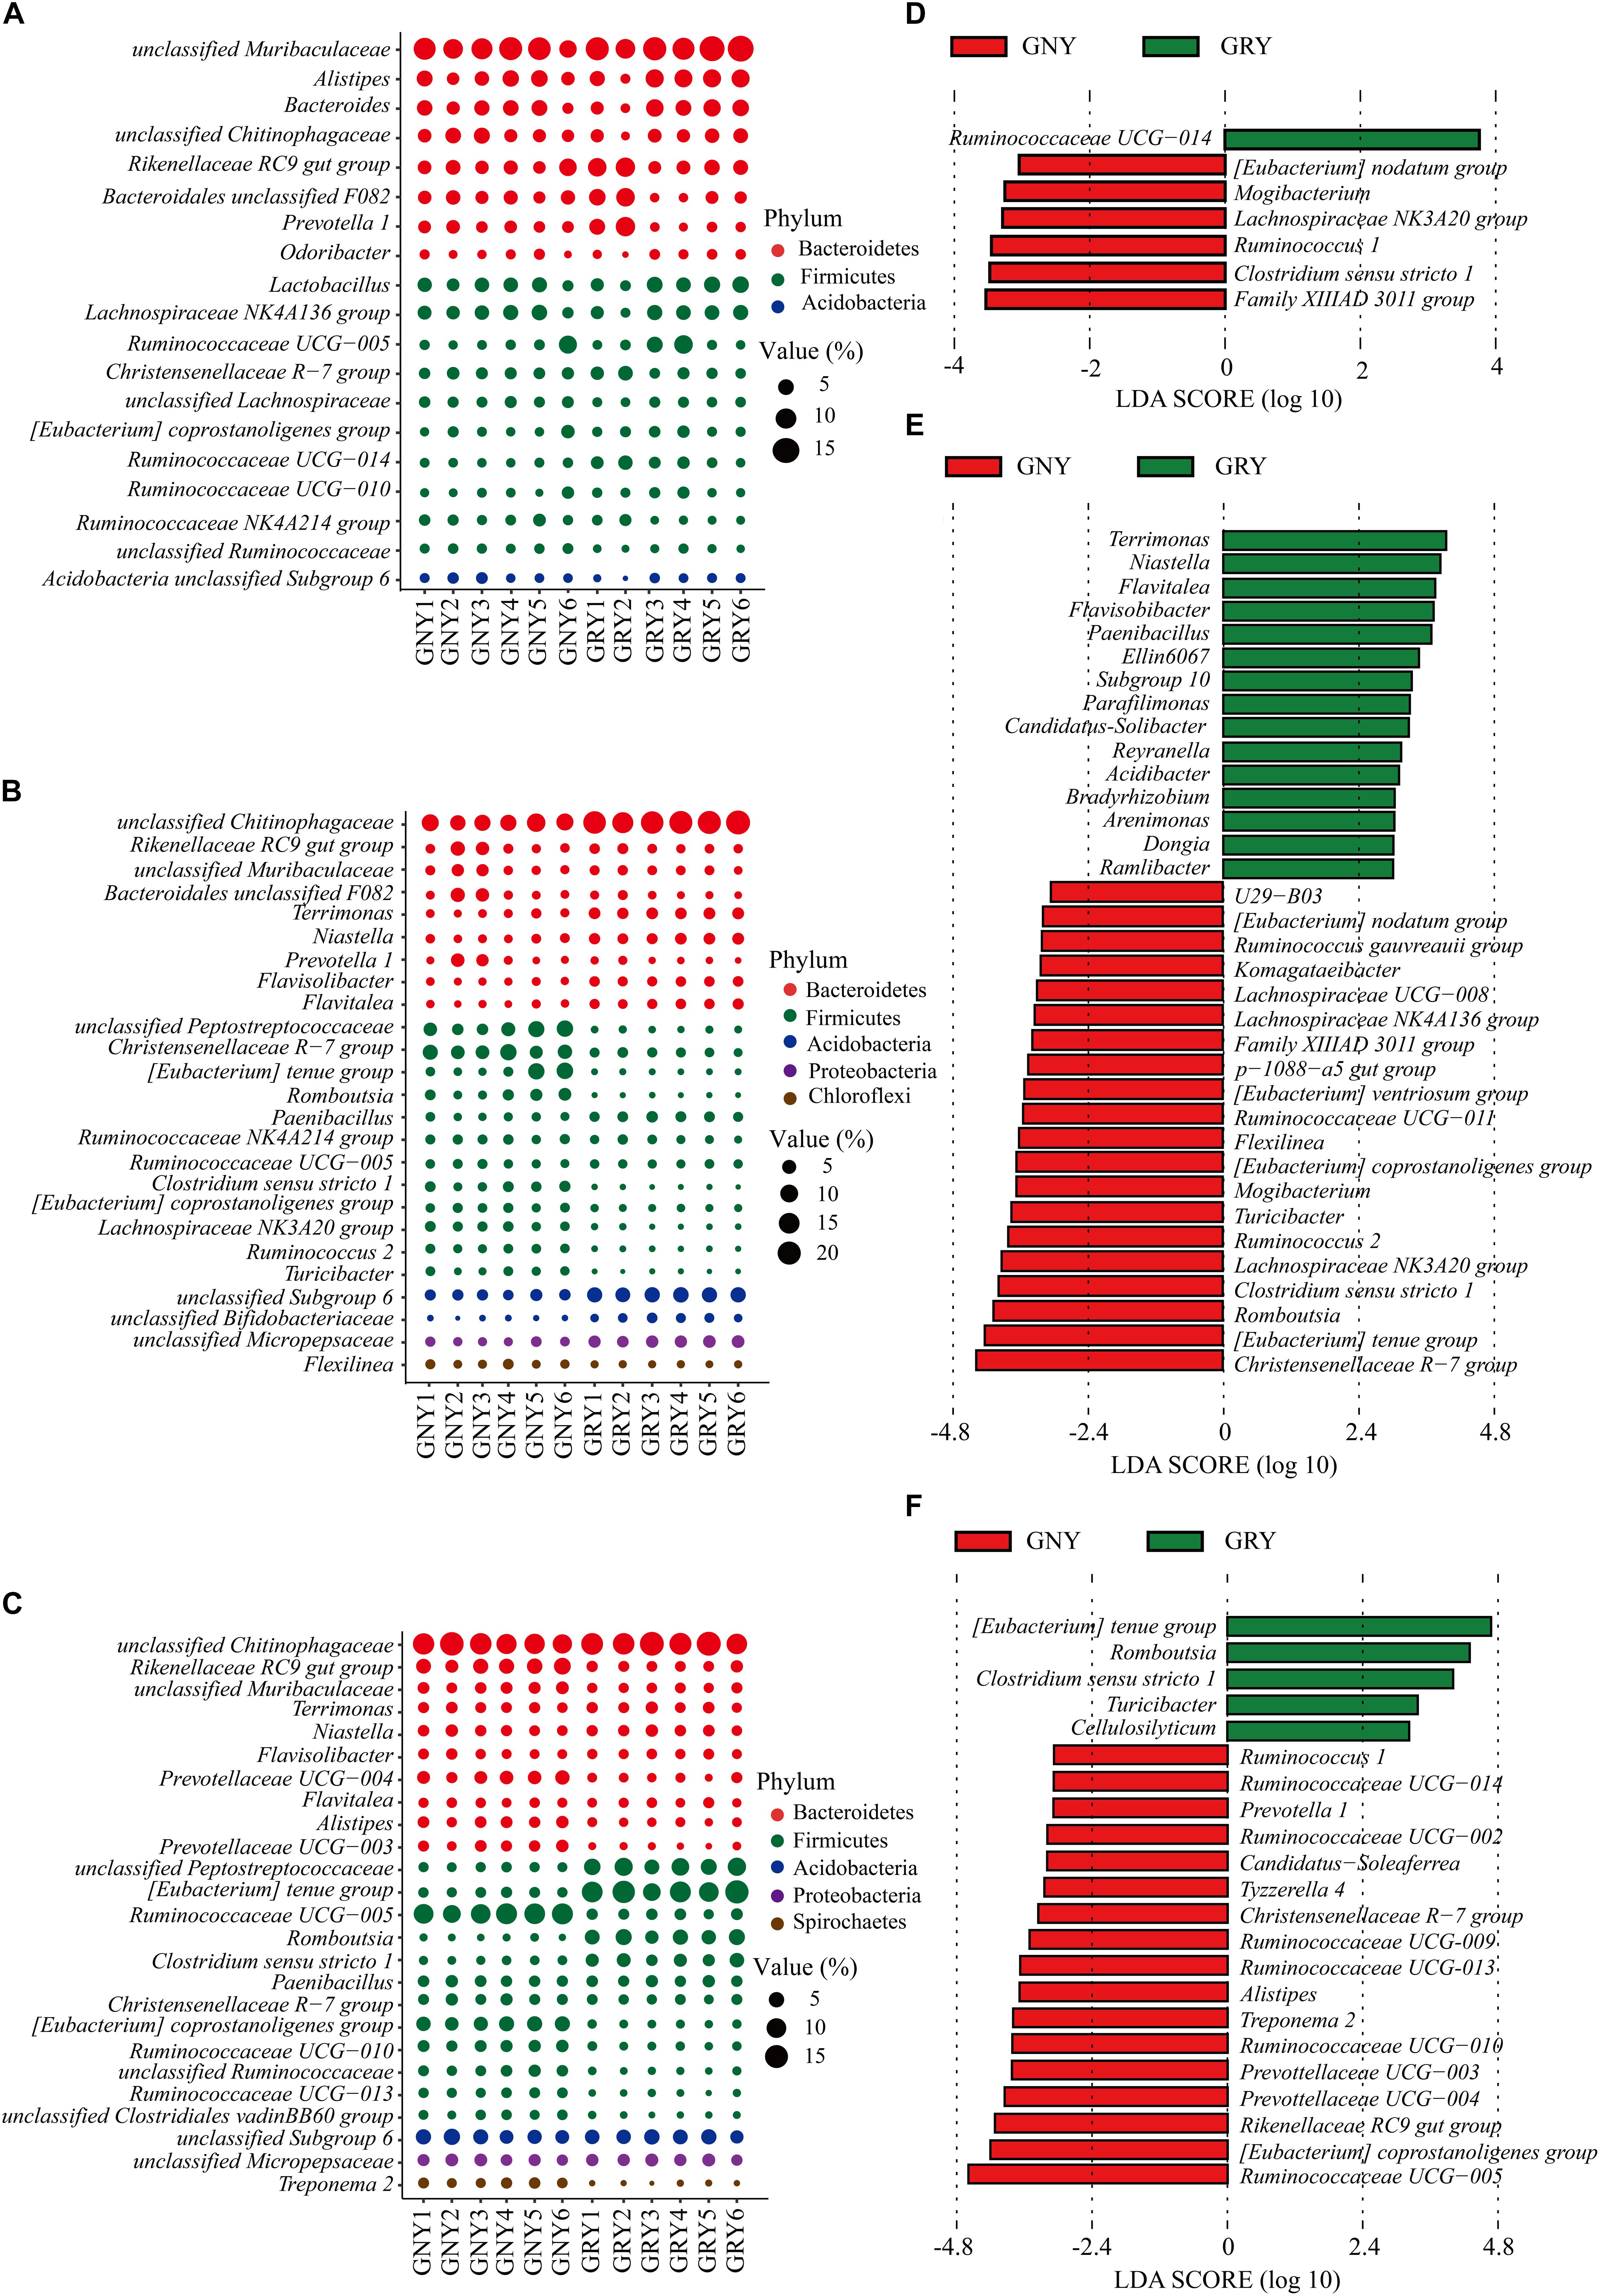
Figure 5. Taxa plots depicting bacterial composition in the small intestine of GNY (n = 6) and GRY (n = 6) groups. Bubble plot showing the relative abundance of dominant bacteria at genus level in the duodenum (A), jejunum (B), and ileum (C). Genus with the average relative abundance was ≥ 1% in at least one group. Linear discriminant analysis effect size analysis identified the most differentially abundant genera in the duodenum (D), jejunum (E), and ileum (F) between GNY (red) and GRY (green) groups. Genus with linear discriminant analysis values higher than 3.5 is displayed. GNY, growth normal yak; GRY, growth-retarded yak.
Difference of Bacterial Community in the Large Intestine Between Growth-Retarded and Normal Yaks
In the large intestine, a total of 32 bacterial phyla were identified in 24 digesta samples. The number of bacteria phyla identified in the cecum and colon of GNY and GRY groups were 26 and 27 as well as 27 and 25, respectively. The majority of the bacteria belonged to the Firmicutes (cecum: GNY = 57.32% and GRY = 53.84%; colon: GNY = 54.72% and GRY = 54.09%), Bacteroidetes (cecum: GNY = 32.72% and GRY = 32.75%; colon: GNY = 32.69% and GRY = 28.92%), and Proteobacteria (cecum: GNY = 1.94% and GRY = 1.72%; colon: GNY = 2.15% and GRY = 1.52%), which accounted for appropriately 90% of all bacterial taxa. In the cecum, the relative abundances of Tenericutes (P = 0.090) and Actinobacteria (P = 0.068) were slightly higher (P < 0.05) in the GRY group as compared with the GNY group. In the colon, the relative abundance of Spirochetes in the GNY group was slightly higher (P = 0.092) than that in the GRY group (Table 4). Moreover, no significant difference (P > 0.05) in the F/B ratio was observed between the two groups (Figure 3C).
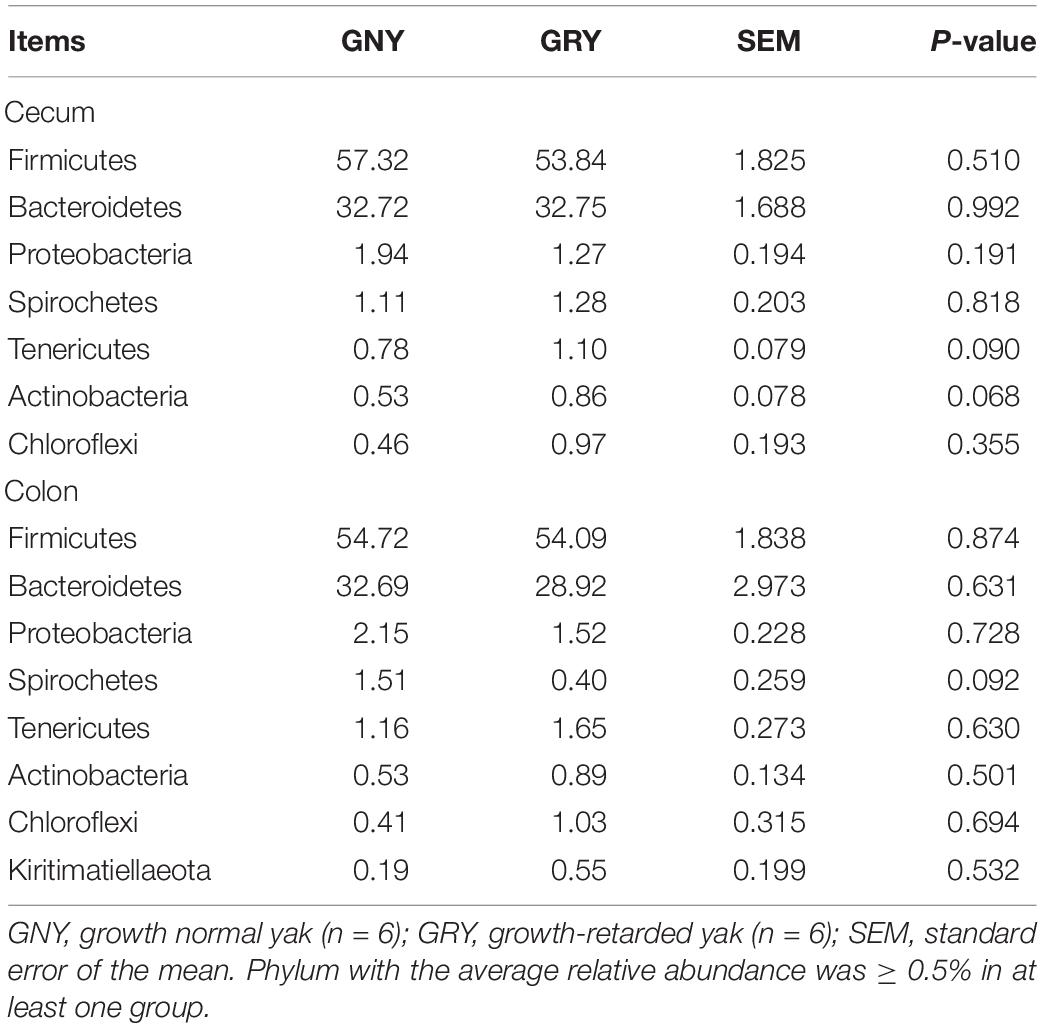
Table 4. Comparison of the relative abundance (%) of the representative bacteria at the phylum level in the large intestine of growth-retarded and normal yaks.
At the genus level (Figures 6A,B and Supplementary Table 6), Ruminococcaceae UCG-005 was the most dominant bacterium in the large intestine of the GNY (cecum, 14.94%; colon, 12.72%) and GRY (cecum, 10.38%; colon, 7.89%) groups, followed by Rikenellaceae RC9 gut group (cecum: GNY = 7.94% and GRY = 7.67%; colon: GNY = 8.18% and GRY = 6.26%), (Eubacterium) coprostanoligenes group (cecum: GNY = 5.47% and GRY = 5.57%; colon: GNY = 4.53% and GRY = 3.66%), Ruminococcaceae UCG-010 (cecum: GNY = 6.90% and GRY = 4.25%; colon: GNY = 4.11% and GRY = 3.70%), and Christensenellaceae R-7 group (cecum: GNY = 2.54% and GRY = 6.14%; colon: GNY = 4.12% and GRY = 5.33%). In the cecum, the relative abundances of Bacteroidales unclassified p-2534-18B5 gut group, Prevotellaceae UCG-003, unclassified Clostridiales vadinBB60 group, and Ruminococcaceae UCG-009 in the GNY group were higher (P < 0.05) than those in the GRY group. Furthermore, the relative abundances of unclassified Bacteroidales (P = 0.064), Ruminococcaceae UCG-005 (P = 0.062), and Ruminococcaceae UCG-010 (P = 0.072) tended to be higher in the GNY group than the GRY group. In the colon, compared with the GRY group, the unclassified Lachnospiraceae (P = 0.063) and Treponema 2 (P = 0.052) were slightly higher in the GNY group. The LEfSe analysis revealed that 11 and 1 differential bacteria were identified in the cecum and colon, respectively, between the two groups. In the cecum, the Ruminococcaceae UCG-005 and Christensenellaceae R-7 group showed a higher difference between the two groups. The differential bacteria were Treponema 2 in the colon (Figures 6C,D).
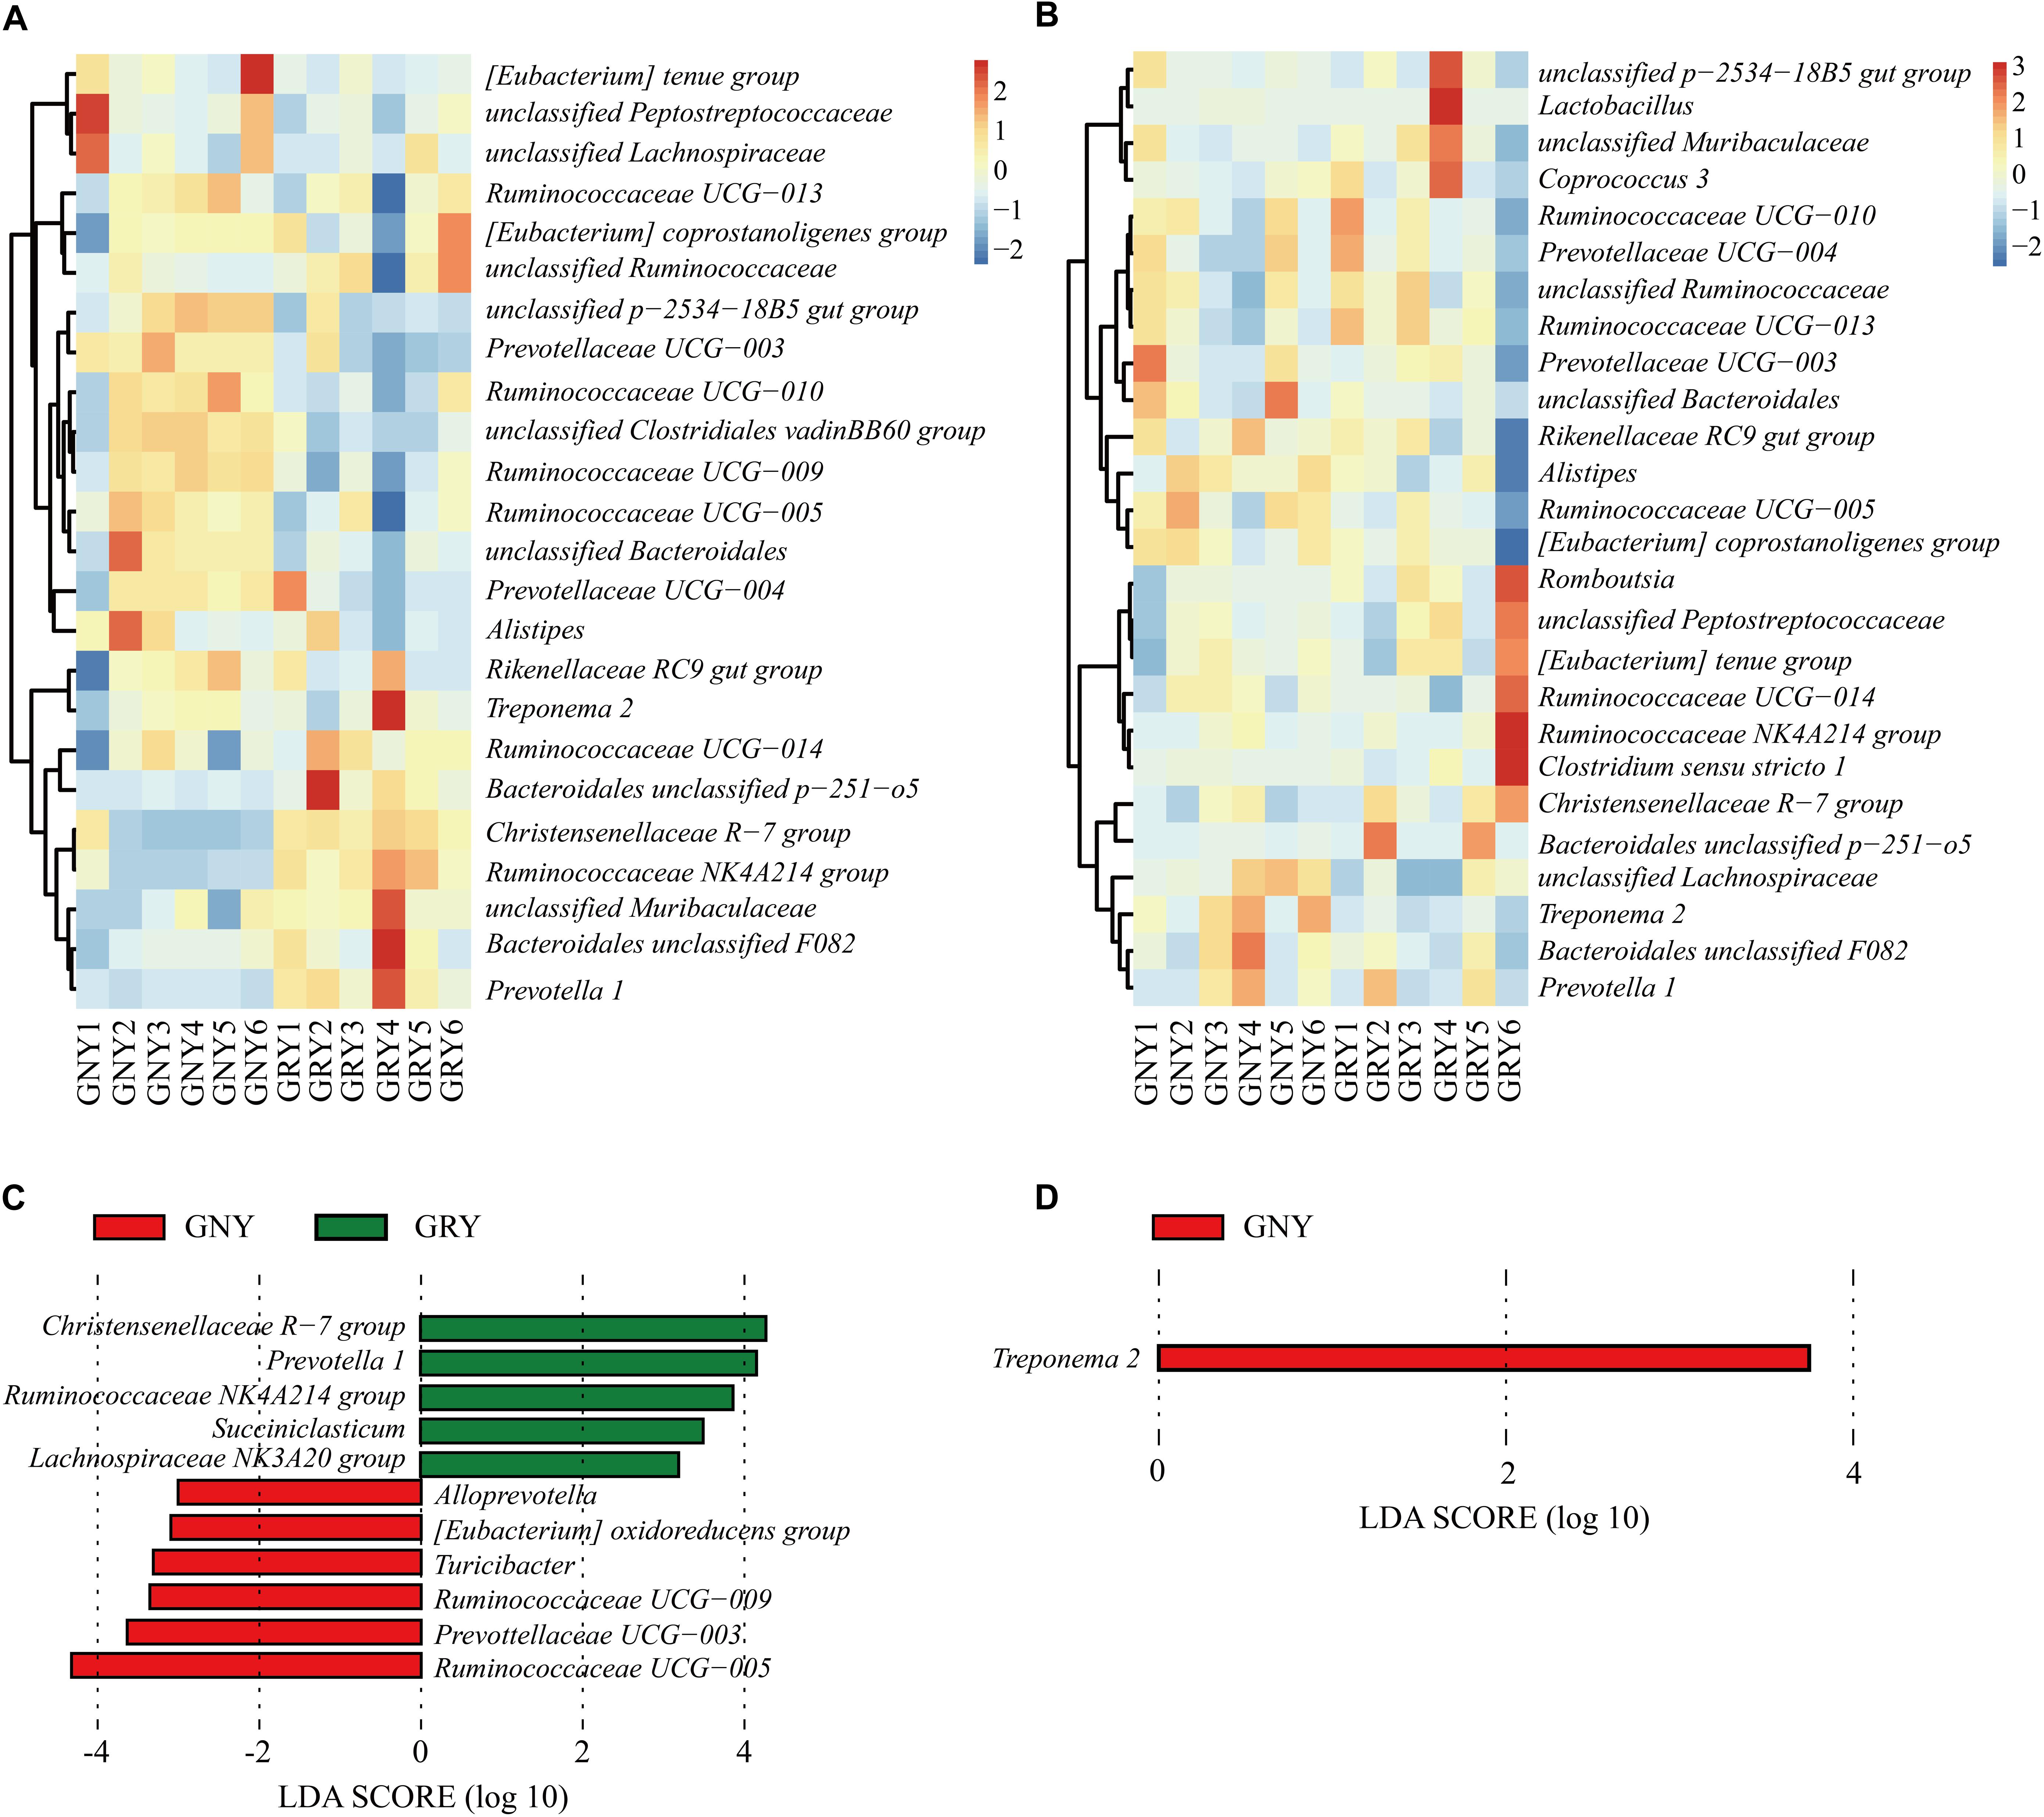
Figure 6. Taxa plots depicting bacterial composition in the large intestine of GNY (n = 6) and GRY (n = 6) groups. Heat map showing the relative abundance of dominant bacteria at genus level in the cecum (A) and colon (B). Genus with the average relative abundance was ≥ 1% in at least one group. Linear discriminant analysis effect size analysis identified the most differentially abundant genera in the cecum (C) and colon (D) between GNY (red) and GRY (green) groups. Genus with linear discriminant analysis values higher than 3.5 is displayed. GNY, growth normal yak; GRY, growth-retarded yak.
Discussion
Although they have no major clinical problems, the yaks with retardation are related to higher morbidity and mortality and lower feed efficiency, which result in increased feeding costs. The healthy development of GIT plays an essential role in the growth process of animals (Malmuthuge et al., 2015; Xiao et al., 2016). In humans, studies have demonstrated that the microbial composition in the GIT of stunted children was different from that of healthy children of the same age (Subramanian et al., 2014; Blanton et al., 2016). In the present study, we compared the bacterial community in the GIT (rumen, duodenum, jejunum, ileum, cecum, and colon) of GRYs and GNYs. The current study showed that the phyla Bacteroidetes and Firmicutes were the dominant bacteria of GIT in GRYs and GNYs. Consistent with our study, the two phyla were also found to be presented abundantly in the GIT of dairy cattle (Mao et al., 2015), goats (Li et al., 2019), yaks (Cui et al., 2020b), and steers (de Oliveira et al., 2013), suggesting the functional importance of Bacteroidetes and Firmicutes in the GIT of ruminants. In addition, the PCoA results revealed that the bacterial composition and structure in each segment of GIT were distinct between the GNY and GRY groups. Similar to our results, Hu et al. (2019) and Che et al. (2019) have reported that the composition of bacteria in the GIT between growth-retarded and normal animals was different.
In ruminants, the rumen, which harbors a great deal of inhabiting microbes, is typically the main digestive and absorptive organ for VFA and excess ammonia-N (Henderson et al., 2015). A previous study reported that Firmicutes had an important role in the process of energy absorption (Ley et al., 2006). Additionally, Firmicutes are known to be involved in the degradation of oligosaccharides, starch, and cellulose (Ahmad et al., 2020). In the rumen of yaks, the research found that the relative abundance of Firmicutes in the feeding group was significantly increased as compared with the grazing group (Zhou et al., 2017). Zou et al. (2019) reported that grazing yaks with low feed efficiency exhibited lower Firmicutes relative abundance in the rumen. Consistent with previous studies, in the current study, the relative abundance of Firmicutes in the GNY group was slightly higher than that in the GRY group, suggesting that GNYs had better feed efficiency. Moreover, Jia et al. (2018) found that the increased Tenericutes relative abundance in the rumen of fattening lambs was related to higher nitrogen utilization. Our study revealed that the relative abundance of Tenericutes in the GNY group was slightly higher than that in the GRY group, indicating that the nitrogen utilization of GNYs was higher. In the future, more experiments should be conducted to investigate the potential effects of those bacteria on the growth performance of yaks.
Our study revealed that the genera Rikenellaceae RC9 gut group, Prevotella, and Christensenellaceae R-7 group were the predominant bacteria in the rumen, which were in accordance with previous findings in yaks (Xue et al., 2018; Hu et al., 2019). The bacteria belonging to the Christensenellaceae family can secrete α-arabinosidase, β-glucosidase, and β-galactosidase, which are related to feed efficiency (Perea et al., 2017). A previous study reported that the relative abundance of Christensenellaceae was inversely associated with BW (Waters and Ley, 2019). In the present study, the Christensenellaceae R-7 group relative abundance in the GRY group was higher than that in the GNY group. The decreased relative abundance of Christensenellaceae may increase the BW of yaks. In the rumen, the bacteria from Ruminococcaceae family play a vital role in fiber degradation and biohydrogenation (Gagen et al., 2015; Opdahl et al., 2018). A study has found that the relative abundance of Ruminococcaceae was higher in the rumen of beef cattle with higher feed efficiency (Li and Guan, 2017). Results from the current study showed that the relative abundances of Ruminococcaceae NK4A214 group and Ruminococcaceae UCG-014 were significantly higher in the GNY group than those in the GRY group, indicating that GNYs had a higher ability of degradation for fiber. In addition, compared with the GRY group, the relative abundance of Treponema 2 was higher in the GNY group. Treponema is mainly involved in the utilization of soluble carbohydrates (Stanton and Canale-Parola, 1980). Besides, Treponema showed a higher abundance in the rumen of beef cattle when the high concentrate diets was fed (Chen et al., 2011). The results from ruminal bacteria indicated that the fiber utilization of GRYs was lower as compared with GNYs.
The microbiota in the gut plays an important role in the host by absorbing essential nutrients, promoting the development of the GIT, and maintaining immune function (Guzman et al., 2015; Yeoman et al., 2018). The balanced intestinal microbiota is essential for animals to grow normally (Alipour et al., 2018). In the jejunum, we found that the F/B ratio was strikingly higher in the GNY group than that in the GRY group. In previous research, the higher F/B ratio in the gut was confirmed to be associated with human obesity (Turnbaugh et al., 2006). A study in cattle found that the increased F/B ratio was positively correlated with growth rate and feed efficiency (Myer et al., 2015a), suggesting the important role of Firmicutes and Bacteroidetes in energy metabolism. The results from our study indicated that GNYs have a higher ability to utilize the crude fiber of roughage, thereby providing more energy for the host. Moreover, a study in humans reported that the abundances of Proteobacteria and Acidobacteria were markedly increased in cases that suffered from enteritis (Wang et al., 2018). In the current study, the phyla Proteobacteria and Acidobacteria in the jejunum of the GRY group were obviously higher as compared with the GNY group. Besides, according to our data (not yet published), the GRYs showed higher mRNA expression of inflammatory cytokines in the jejunum and concentrations of inflammatory cytokines in the serum as compared with GNYs. These results might indicate that the GRYs had intestinal inflammation. However, these results need future investigation. In the jejunum and ileum, the relative abundance of Planctomycetes in the GRY group was higher than that in the GNY group. A previous study in marine microorganisms found that the Planctomycetes could utilize nitrite and ammonium ions to generate nitrogen gas for energy under anoxic conditions (Delmont et al., 2018). However, the potential function of Planctomycetes in animals still needs further elucidation.
At the genus level, we found that the unclassified Muribaculaceae and unclassified Chitinophagaceae were the predominant bacteria in the duodenum, jejunum, and ileum. Compared with the duodenum, the jejunum and ileum showed a larger difference of bacterial community between the GNY and GRY groups. In the jejunum, the relative abundance of unclassified Chitinophagaceae in the GRY group was higher than that in the GNY group. A previous study has reported that Chitinophagaceae harbored several enzymes that could degrade fungal cell wall, including endoglucanases, b-glucanases, and chitinases (Carrión et al., 2019). The fungi have an important role in maintaining health for the host (Bernardes et al., 2020). The results from our study suggested that higher Chitinophagaceae abundance in the gut might have negative effects on GRYs. Interestingly, in the current study, the proportion of unclassified Peptostreptococcaceae and (Eubacterium) tenue group exhibited an opposite trend in the jejunum and ileum between the two groups. Previous research showed that the genus unclassified Peptostreptococcaceae and Eubacterium might have a vital role in feed digestion (Mao et al., 2012). The results implied that intestinal regions showed strong determinants of microbial community structure and function. In a human study, the Rikenellaceae can be used as a microbial marker to the microflora of obese adolescents (Del Chierico et al., 2018). Our study showed that the relative abundance of Rikenellaceae RC9 gut group in the ileum of the GNY group was higher than that of the GRY group. A recent finding reported that compared with polyp-associated intestinal tissue, the Romboutsia genus was more abundant in the healthy intestine (Mangifesta et al., 2018), which indicated the important role of Romboutsia in maintaining the health of the gut. However, the relative abundance of Romboutsia in the jejunum and ileum exhibited distinct results between the GNY and GRY groups. The possible reason is that the jejunum and ileum have different functions. The families Clostridiaceae and Prevotellaceae in the small intestine have been confirmed to be important in carbohydrate metabolism, and those bacteria might increase the ability of the intestine for nutrient acquisition, as has been reported in humans (Zoetendal et al., 2012). In the ileum, the Prevotellaceae UCG-004 and unclassified Clostridiales vadinBB60 group proportions in the GNY group were higher than those in the GRY group, indicating that the GNYs had higher efficiency of carbohydrate metabolism. Moreover, we also found that the genera Terrimonas, Niastella, Flavisolibacter, Flavitalea, Paenibacillus, Turicibacter, and Flexilinea displayed significant differences in the gut between the GNY and GRY groups. Unfortunately, at present, the knowledge of microflora is limited. However, there is no denying that the bacterial community in the small intestine between GRYs and GNYs is distinct.
In addition to the rumen and small intestine, the large intestine also has an important function in the normal growth of yaks. The cecum and colon are important parts of immune systems; besides, the large intestine plays an essential role in the post-ruminal degradation of cellulose and starch, which are considered to be vital in digestion (Armstrong and Smithard, 1979). A previous study reported that the relative abundances of Ruminococcaceae, Lachnospiraceae, and Clostridiaceae in the cecum of steers with high feed efficiency were higher (Myer et al., 2015b). The members of Ruminococcaceae are known for higher cellulolytic capacity. Consistent with rumen, the GNY group had higher Ruminococcaceae relative abundance. Moreover, the relative abundances of Prevotellaceae UCG-003, Treponema 2, and unclassified Lachnospiraceae in the large intestine of the GNY group were higher than those of the GRY group. These microorganisms may also contribute to further downstream feed fermentation. Overall, the microbial difference of the large intestine between the GNY and GRY groups was relatively low as compared with the rumen and small intestine.
Conclusion
In the current study, the GIT showed different bacterial communities between GRYs and GNYs. The relative abundances of bacteria related to oligosaccharide, starch, and cellulose degradation, including Ruminococcaceae, Treponema, Clostridiaceae, Prevotellaceae, and Lachnospiraceae, in the GIT of GNYs were higher than those of GRYs. Moreover, compared with GNYs, the relative abundances of some bacteria, including Christensenellaceae R-7 group, unclassified Chitinophagaceae, and (Eubacterium) tenue group, in the GIT of GRYs were higher. Results in our study revealed that the bacterial community in the GIT of GRYs was disrupted. Regulating the microbial community may be an effective solution to promote the compensatory growth of GRYs.
Data Availability Statement
The sequences from the current study have been deposited in the Sequence Read Archive database of National Center for Biotechnology Information with the accession number PRJNA659573.
Ethics Statement
This animal experiment was carried out in accordance with the Regulation on the Administration of Laboratory Animals (2017 Revision) promulgated by Decree No. 676 of the State Council. The protocol was authorized and approved by the Institutional Animal Care and Use Committee of Sichuan Agricultural University (Chengdu, Sichuan, China).
Author Contributions
JM, ZW, and SZ conceived and designed the research. JM, YZ, XW, GC, HZ, QP, BX, LW, and XK performed the animal experiment and sample collection. JM, YZ, and RH analyzed the data. JM wrote the original manuscript. JM, YZ, ZW, XY, and AS reviewed the manuscript. All authors read and approved the final manuscript.
Funding
This work was funded by the China Agriculture (Beef Cattle/Yak) Research System (CARS-37) and the National Natural Science Foundation of China (no. 31972591).
Conflict of Interest
The authors declare that the research was conducted in the absence of any commercial or financial relationships that could be construed as a potential conflict of interest.
Acknowledgments
Gratitude is expressed to the staff at the Animal Husbandry and Veterinary Institute of Haibei Prefecture for their ongoing assistance.
Supplementary Material
The Supplementary Material for this article can be found online at: https://www.frontiersin.org/articles/10.3389/fmicb.2020.600516/full#supplementary-material
Footnotes
References
Ahmad, A. A., Yang, C., Zhang, J., Kalwar, Q., Liang, Z., and Li, C. (2020). Effects of dietary energy levels on rumen fermentation, microbial diversity, and feed efficiency of yaks (Bos grunniens). Front. Microbiol. 11:625. doi: 10.3389/fmicb.2020.00625
Alipour, M. J., Jalanka, J., Pessa-Morikawa, T., Kokkonen, T., Satokari, R., and Hynönen, U. (2018). The composition of the perinatal intestinal microbiota in cattle. Sci. Rep. 8:10437. doi: 10.1038/s41598-018-28733-y
Armstrong, D. G., and Smithard, R. R. (1979). The fate of carbohydrates in the small and large intestines of the ruminant. Proc. Nutr. Soc. 38, 283–294. doi: 10.1079/pns19790050
Bernardes, E. V. T., Pettersen, V. K., Gutierrez, M. W., Laforest-Lapointe, I., Jendzjowsky, N. G., Cavin, J. B., et al. (2020). Intestinal fungi are causally implicated in microbiome assembly and immune development in mice. Nat. Commun. 11:2577. doi: 10.1038/s41467-020-16431-1
Blanton, L. V., Charbonneau, M. R., Salih, T., Barratt, M. J., Venkatesh, S., Ilkaveya, O., et al. (2016). Gut bacteria that prevent growth impairments transmitted by microbiota from malnourished children. Science 351:aad3311. doi: 10.1126/science.aad3311
Bolger, A. M., Lohse, M., and Usadel, B. (2014). Trimmomatic: a flexible trimmer for Illumina sequence data. Bioinformatics 30, 2114–2120. doi: 10.1093/bioinformatics/btu170
Caporaso, J. G., Lauber, C. L., Walters, W. A., Berg-Lyons, D., Lozupone, C. A., Turnbaugh, P. J., et al. (2011). Global patterns of 16S rRNA diversity at a depth of millions of sequences per sample. Proc. Natl. Acad. Sci. U.S.A. 108(Suppl. 1), 4516–4522. doi: 10.1073/pnas.1000080107
Carrión, V. J., Perez-Jaramillo, J., Cordovez, V., Tracanna, V., de Hollander, M., Ruiz-Buck, D., et al. (2019). Pathogen-induced activation of disease-suppressive functions in the endophytic root microbiome. Science 366, 606–612. doi: 10.1126/science.aaw9285
Celi, P., Cowieson, A. J., Fru-Nji, F., Steinert, R. E., Kluenter, A. M., and Verlhac, V. (2017). Gastrointestinal functionality in animal nutrition and health: new opportunities for sustainable animal production. Anim. Feed Sci. Technol. 234, 88–100. doi: 10.1016/j.anifeedsci.2017.09.012
Che, L., Hu, L., Zhou, Q., Peng, X., Liu, Y., Luo, Y., et al. (2019). Microbial insight into dietary protein source affects intestinal function of pigs with intrauterine growth retardation. Eur. J. Nutr. 59, 327–344. doi: 10.1007/s00394-019-01910-z
Chen, Y., Penner, G. B., Li, M., Oba, M., and Guan, L. L. (2011). Changes in bacterial diversity associated with epithelial tissue in the beef cow rumen during the transition to a high-grain diet. Appl. Environ. Microbiol. 77, 5770–5781. doi: 10.1128/aem.00375-11
Cui, Z., Wu, S., Liu, S., Sun, L., Feng, Y., Cao, Y., et al. (2020a). From maternal grazing to barn feeding during pre-weaning period: altered gastrointestinal microbiota contributes to change the development and function of the rumen and intestine of yak calves. Front. Microbiol. 11:485. doi: 10.3389/fmicb.2020.00485
Cui, Z., Wu, S., Li, J., Yang, Q.-E., Chai, S., Wang, L., et al. (2020b). Effect of alfalfa hay and starter feeding intervention on gastrointestinal microbial community, growth and immune performance of yak calves. Front. Microbiol. 11:994. doi: 10.3389/fmicb.2020.00994
de Oliveira, M. N. V., Jewell, K. A., Freitas, F. S., Benjamin, L. A., Tótola, M. R., Borges, A. C., et al. (2013). Characterizing the microbiota across the gastrointestinal tract of a Brazilian Nelore steer. Vet. Microbiol. 164, 307–314. doi: 10.1016/j.vetmic.2013.02.013
Del Chierico, F., Abbatini, F., Russo, A., Quagliariello, A., Reddel, S., Capoccia, D., et al. (2018). Gut microbiota markers in obese adolescent and adult patients: age-dependent differential patterns. Front. Microbiol. 9:1210. doi: 10.3389/fmicb.2018.01210
Delmont, T. O., Quince, C., Shaiber, A., Esen, ÖC., Lee, S. T., Rappé, M. S., et al. (2018). Nitrogen-fixing populations of Planctomycetes and Proteobacteria are abundant in surface ocean metagenomes. Nat. Microbiol. 3, 804–813. doi: 10.1038/s41564-018-0176-9
Dolan, K. T., and Chang, E. B. (2016). Diet, gut microbes, and the pathogenesis of inflammatory bowel diseases. Mol. Nutr. Food Res. 61:1600129. doi: 10.1002/mnfr.201600129
Du, M., Tong, J., Zhao, J., Underwood, K. R., Zhu, M., Ford, S. P., et al. (2010). Fetal programming of skeletal muscle development in ruminant animals. J. Anim. Sci. 88(E. Suppl.), E51–E60. doi: 10.2527/jas.2009-2311
Du, R., Jiao, S., Dai, Y., An, J., Lv, J., Yan, X., et al. (2018). Probiotic Bacillus amyloliquefaciens C-1 improves growth performance, stimulates GH/IGF-1, and regulates the gut microbiota of growth-retarded beef calves. Front. Microbiol. 9:2006. doi: 10.3389/fmicb.2018.02006
Edgar, R. C. (2010). Search and clustering orders of magnitude faster than BLAST. Bioinformatics 26, 2460–2461. doi: 10.1093/bioinformatics/btq461
Edgar, R. C. (2013). UPARSE: highly accurate OTU sequences from microbial amplicon reads. Nat. Methods 10, 996–998. doi: 10.1038/nmeth.2604
Edgar, R. C., Haas, B. J., Clemente, J. C., Quince, C., and Knight, R. (2011). UCHIME improves sensitivity and speed of chimera detection. Bioinformatics 27, 2194–2200. doi: 10.1093/bioinformatics/btr381
Falony, G., Joossens, M., Vieira-Silva, S., Wang, J., Darzi, Y., Faust, K., et al. (2016). Population-level analysis of gut microbiome variation. Science 352, 560–564. doi: 10.1126/science.aad3503
Gagen, E. J., Padmanabha, J., Denman, S. E., and McSweeney, C. S. (2015). Hydrogenotrophic culture enrichment reveals rumen Lachnospiraceae and Ruminococcaceae acetogens and hydrogen responsive Bacteroidetes from pasture fed cattle. FEMS Microbiol. Lett. 362:fnv104. doi: 10.1093/femsle/fnv104
Gozho, G. N., and Mutsvangwa, T. (2008). Influence of carbohydrate source on ruminal fermentation characteristics, performance, and microbial protein synthesis in dairy cows. J. Dairy Sci. 91, 2726–2735. doi: 10.3168/jds.2007-0809
Gregory, C. J., Bittinger, K., Bushman, F. D., DeSantis, T. Z., Andersen, G. L., and Knight, R. (2010). PyNAST: a flexible tool for aligning sequences to a template alignment. Bioinformatics 26, 266–267. doi: 10.1093/bioinformatics/btp636
Gu, Y., Song, Y., Yin, H., Lin, S., Zhang, X., Che, L., et al. (2017). Dietary supplementation with tributyrin prevented weaned pigs from growth retardation and lethal infection via modulation of inflammatory cytokines production, ileal FGF19 expression, and intestinal acetate fermentation. J. Anim. Sci. 95, 226–238. doi: 10.2527/jas.2016.0911
Guzman, C. E., Bereza-Malcolm, L. T., De Groef, B., and Franks, A. E. (2015). Presence of selected Methanogens, Fibrolytic Bacteria, and Proteobacteria in the gastrointestinal tract of neonatal dairy calves from birth to 72 hours. PLoS One 10:e0133048. doi: 10.1371/journal.pone.0133048
Henderson, G., Cox, F., Ganesh, S., Jonker, A., Young, W., Collaborators, G. R. C., et al. (2015). Rumen microbial community composition varies with diet and host, but a core microbiome is found across a wide geographical range. Sci. Rep. 5:14567. doi: 10.1038/srep14567
Holmes, E., Li, J. V., Marchesi, J. R., and Nicholson, J. K. (2012). Gut microbiota composition and activity in relation to host metabolic phenotype and disease risk. Cell Metab. 16, 559–564. doi: 10.1016/j.cmet.2012.10.007
Hu, R., Wang, Z., Peng, Q., Zou, H., Wang, H., Yu, X., et al. (2016). Effects of GHRP-2 and cysteamine administration on growth performance, somatotropic axis hormone and muscle protein deposition in yaks (Bos grunniens) with growth retardation. PLoS One 11:e0149461. doi: 10.1371/journal.pone.0149461
Hu, R., Zou, H., Wang, Z., Cao, B., Peng, Q., Jing, X., et al. (2019). Nutritional interventions improved rumen functions and promoted compensatory growth of growth-retarded yaks as revealed by integrated transcripts and microbiome analyses. Front. Microbiol. 10:318. doi: 10.3389/fmicb.2019.00318
Jami, E., Israel, A., Kotser, A., and Mizrahi, I. (2013). Exploring the bovine rumen bacterial community from birth to adulthood. ISME J. 7, 1069–1079. doi: 10.1038/ismej.2013.2
Jia, P., Cui, K., Ma, T., Wan, F., Wang, W., Yang, D., et al. (2018). Influence of dietary supplementation with Bacillus licheniformis and Saccharomyces cerevisiae as alternatives to monensin on growth performance, antioxidant, immunity, ruminal fermentation and microbial diversity of fattening lambs. Sci. Rep. 8:16712. doi: 10.1038/s41598-018-35081-4
Jones, C. K., Gabler, N. K., Main, R. G., and Patience, J. F. (2012). Characterizing growth and carcass composition differences in pigs with varying weaning weights and postweaning performance. J. Anim. Sci. 90, 4072–4080. doi: 10.2527/jas2011-4793
Ley, R. E., Turnbaugh, P. J., Klein, S., and Gordon, J. I. (2006). Human gut microbes associated with obesity. Nature 444, 1022–1023. doi: 10.1038/4441022a
Li, B., Zhang, K., Li, C., Wang, X., Chen, Y., and Yang, Y. (2019). Characterization and comparison of microbiota in the gastrointestinal tracts of the goat (Capra hircus) during preweaning development. Front. Microbiol. 10:2125. doi: 10.3389/fmicb.2019.0212
Li, Y., Zhang, H., Su, W., Ying, Z., Chen, Y., Zhang, L., et al. (2018). Effects of dietary Bacillus amyloliquefaciens supplementation on growth performance, intestinal morphology, inflammatory response, and microbiota of intra-uterine growth retarded weanling piglets. J. Anim. Sci. Biotechnol. 9:22. doi: 10.1186/s40104-018-0236-2
Li, F., and Guan, L. L. (2017). Metatranscriptomic profiling reveals linkages between the active rumen microbiome and feed efficiency in beef cattle. Appl. Environ. Microbiol. 83:e00061-17. doi: 10.1128/aem.00061-17
Magoč, T., and Salzberg, S. L. (2011). FLASH: fast length adjustment of short reads to improve genome assemblies. Bioinformatics 27, 2957–2963. doi: 10.1093/bioinformatics/btr507
Malmuthuge, N., Griebel, P. J., and Guan, L. L. (2015). The gut microbiome and its potential role in the development and function of newborn calf gastrointestinal tract. Front. Vet. Sci. 2:36. doi: 10.3389/fvets.2015.00036
Mangifesta, M., Mancabelli, L., Milani, C., Gaiani, F., de’Angelis, N., de’Angelis, G. L., et al. (2018). Mucosal microbiota of intestinal polyps reveals putative biomarkers of colorectal cancer. Sci. Rep. 8:13974. doi: 10.1038/s41598-018-32413-2
Mao, S., Zhang, M., Liu, J., and Zhu, W. (2015). Characterising the bacterial microbiota across the gastrointestinal tracts of dairy cattle: membership and potential function. Sci. Rep. 5:16116. doi: 10.1038/srep16116
Mao, S., Zhang, R., Wang, D., and Zhu, W. (2012). The diversity of the fecal bacterial community and its relationship with the concentration of volatile fatty acids in the feces during subacute rumen acidosis in dairy cows. BMC Vet. Res. 8:237. doi: 10.1186/1746-6148-8-237
Mörkl, S., Lackner, S., Müller, W., Gorkiewicz, G., Doz, P., Kashofer, K., et al. (2017). Gut microbiota and body composition in anorexia nervosa inpatients in comparison to athletes, overweight, obese, and normal weight controls. Int. J. Eat. Disorder. 12, 1421–1431. doi: 10.1002/eat.22801
Myer, P. R., Smith, T. P. L., Wells, J. E., Kuehn, L. A., and Freetly, H. C. (2015a). Rumen microbiome from steers differing in feed efficiency. PLoS One 10:e0129174. doi: 10.1371/journal.pone.0129174
Myer, P. R., Wells, J. E., Smith, T. P. L., Kuehn, L. A., and Freetly, H. C. (2015b). Cecum microbial communities from steers differing in feed efficiency. J. Anim. Sci. 93, 5327–5340. doi: 10.2527/jas.2015-9415
Ohland, C. L., and Jobin, C. (2015). Microbial activities and intestinal homeostasis: a delicate balance between health and disease. Cell. Mol. Gastroenterol. Hepatol. 1, 28–40. doi: 10.1016/j.jcmgh.2014.11.004
Opdahl, L. J., Gonda, M. G., and St-Pierre, B. (2018). Identification of uncultured bacterial species from Firmicutes, Bacteroidetes and CANDIDATUS Saccharibacteria as candidate cellulose utilizers from the rumen of beef cows. Microorganisms 6:17. doi: 10.3390/microorganisms6010017
Parker, A., Lawson, M., Vaux, L., and Pin, C. (2017). Host-microbe interaction in the gastrointestinal tract. Environ. Microbiol. 20, 2337–2353. doi: 10.1111/1462-2920.13926
Perea, K., Perz, K., Olivo, S. K., Williams, A., Lachman, M., Ishaq, S. L., et al. (2017). Feed efficiency phenotypes in lambs involve changes in ruminal, colonic, and small-intestine-located microbiota. J. Anim. Sci. 95, 2585–2592. doi: 10.2527/jas.2016.1222
Powell, N., Walker, M. M., and Talley, N. J. (2017). The mucosal immune system: master regulator of bidirectional gut-brain communications. Nat. Rev. Gastroenterol. Hepatol. 14, 143–159. doi: 10.1038/nrgastro.2016.191
Quast, C., Pruesse, E., Yilmaz, P., Gerken, J., Schweer, T., Yarza, P., et al. (2013). The SILVA ribosomal RNA gene database project: improved data processing and web-based tools. Nucleic Acids Res. 41, D590–D596. doi: 10.1093/nar/gks1219
Rey, M., Enjalbert, F., Combes, S., Cauquil, L., Bouchez, O., and Monteils, V. (2013). Establishment of ruminal bacterial community in dairy calves from birth to weaning is sequential. J. Appl. Microbiol. 116, 245–257. doi: 10.1111/jam.12405
Segata, N., Izard, J., Waldron, L., Gevers, D., Miropolsky, L., Garrett, W. S., et al. (2011). Metagenomic biomarker discovery and explanation. Genome Biol. 12:R60. doi: 10.1186/gb-2011-12-6-r60
Stanton, T. B., and Canale-Parola, E. (1980). Treponema bryantii sp. nov., a rumen spirochete that interacts with cellulolytic bacteria. Arch. Microbiol. 127, 145–156. doi: 10.1007/bf00428018
Subramanian, S., Huq, S., Yatsunenko, T., Haque, R., Mahfuz, M., Alam, M. A., et al. (2014). Persistent gut microbiota immaturity in malnourished Bangladeshi children. Nature 510, 417–421. doi: 10.1038/nature13421
Turnbaugh, P. J., Ley, R. E., Mahowald, M. A., Magrini, V., Mardis, E. R., and Gordon, J. I. (2006). An obesity-associated gut microbiome with increased capacity for energy harvest. Nature 444, 1027–1031. doi: 10.1038/nature05414
Wang, K., Jin, X., Li, Q., Sawaya, A. C. H. F., Le Leu, R. K., Conlon, M. A., et al. (2018). Propolis from different geographic origins suppress intestinal inflammation in a model of DSS-induced colitis is associated with decreased Bacteroides spp. in the gut. Mol. Nutr. Food Res. 62:1800080. doi: 10.1002/mnfr.201800080
Wang, W., Li, C., Li, F., Wang, X., Zhang, X., Liu, T., et al. (2016). Effects of early feeding on the host rumen transcriptome and bacterial diversity in lambs. Sci. Rep. 6:32479. doi: 10.1038/srep32479
Waters, J. L., and Ley, R. E. (2019). The human gut bacteria Christensenellaceae are widespread, heritable, and associated with health. BMC Biol. 17:83. doi: 10.1186/s12915-019-0699-4
Xiao, J. X., Alugongo, G. M., Chung, R., Dong, S. Z., Li, S. L., Yoon, I., et al. (2016). Effects of Saccharomyces cerevisiae fermentation products on dairy calves: ruminal fermentation, gastrointestinal morphology, and microbial community. J. Dairy Sci. 99, 5401–5412. doi: 10.3168/jds.2015-10563
Xu, H., Huang, W., Hou, Q., Kwok, L., Sun, Z., Ma, H., et al. (2017). The effects of probiotics administration on the milk production, milk components and fecal bacteria microbiota of dairy cows. Sci. Bull. 62, 767–774. doi: 10.1016/j.scib.2017.04.019
Xu, T., Xu, S., Hu, L., Zhao, N., Liu, Z., Ma, L., et al. (2017). Effect of dietary types on feed intakes, growth performance and economic benefit in Tibetan sheep and yaks on the Qinghai-Tibet Plateau during cold season. PLoS One 12:e0169187. doi: 10.1371/journal.pone.0169187
Xue, D., Chen, H., Luo, X., Guan, J., He, Y., and Zhao, X. (2018). Microbial diversity in the rumen, reticulum, omasum, and abomasum of yak on a rapid fattening regime in an agro-pastoral transition zone. J. Microbiol. 56, 734–743. doi: 10.1007/s12275-018-8133-0
Yeoman, C. J., Ishaq, S. L., Bichi, E., Olivo, S. K., Lowe, J., and Aldridge, B. M. (2018). Biogeographical differences in the influence of maternal microbial sources on the early successional development of the bovine neonatal gastrointestinal tract. Sci. Rep. 8:3197. doi: 10.1038/s41598-018-21440-8
Yeoman, C. J., and White, B. A. (2014). Gastrointestinal tract microbiota and probiotics in production animals. Annu. Rev. Anim. Biosci. 2, 469–486. doi: 10.1146/annurev-animal-022513-114149
Zhang, H., Dong, L., Wang, M., Yu, L., and Wang, H. (2018). Effects of dietary L-arginine and N-carbamylglutamate supplementation on intestinal integrity, immune function, and oxidative status in intrauterine-growth-retarded suckling lambs. J. Agric. Food Chem. 66, 4145–4154. doi: 10.1021/acs.jafc.8b00726
Zhang, Z., Xu, D., Wang, L., Hao, J., Wang, J., Zhou, X., et al. (2016). Convergent evolution of rumen microbiomes in high-altitude mammals. Curr. Biol. 26, 1873–1879. doi: 10.1016/j.cub.2016.05.012
Zhao, W., Wang, Y., Liu, S., Huang, J., Zhai, Z., He, C., et al. (2015). The dynamic distribution of porcine microbiota across different ages and gastrointestinal tract segments. PLoS One 10:e0117441. doi: 10.1371/journal.pone.0117441
Zhou, J., Bao, L., Chang, L., Liu, Z., You, C., and Lu, H. (2011). Beta-xylosidase activity of a GH3 glucosidase/xylosidase from yak rumen metagenome promotes the enzymatic degradation of hemicellulosic xylans. Lett. Appl. Microbiol. 54, 79–87. doi: 10.1111/j.1472-765x.2011.03175.x
Zhou, Z., Fang, L., Meng, Q., Li, S., Chai, S., Liu, S., et al. (2017). Assessment of ruminal bacterial and archaeal community structure in yak (Bos grunniens). Front. Microbiol. 8:179. doi: 10.3389/fmicb.2017.00179
Zi, X. D. (2003). Reproduction in female yaks (Bos grunniens) and opportunities for improvement. Theriogenology 59, 1303–1312. doi: 10.1016/s0093-691x(02)01172-x
Zoetendal, E. G., Raes, J., van den Bogert, B., Arumugam, M., Booijink, C. C., Troost, F. J., et al. (2012). The human small intestinal microbiota is driven by rapid uptake and conversion of simple carbohydrates. ISME J. 6, 1415–1426. doi: 10.1038/ismej.2011.212
Keywords: yak, growth retardation, bacterial community, gastrointestinal tract, Qinghai–Tibetan Plateau
Citation: Ma J, Zhu Y, Wang Z, Yu X, Hu R, Wang X, Cao G, Zou H, Shah AM, Peng Q, Xue B, Wang L, Zhao S and Kong X (2020) Comparing the Bacterial Community in the Gastrointestinal Tracts Between Growth-Retarded and Normal Yaks on the Qinghai–Tibetan Plateau. Front. Microbiol. 11:600516. doi: 10.3389/fmicb.2020.600516
Received: 30 August 2020; Accepted: 16 November 2020;
Published: 18 December 2020.
Edited by:
Shyam Sundar Paul, ICAR, IndiaReviewed by:
Jiakui Li, Huazhong Agricultural University, ChinaJunjun Wang, China Agricultural University, China
Copyright © 2020 Ma, Zhu, Wang, Yu, Hu, Wang, Cao, Zou, Shah, Peng, Xue, Wang, Zhao and Kong. This is an open-access article distributed under the terms of the Creative Commons Attribution License (CC BY). The use, distribution or reproduction in other forums is permitted, provided the original author(s) and the copyright owner(s) are credited and that the original publication in this journal is cited, in accordance with accepted academic practice. No use, distribution or reproduction is permitted which does not comply with these terms.
*Correspondence: Zhisheng Wang, d2FuZ3pzNjdAMTI2LmNvbQ==