 Julian Droste1
 Christian Rückert1
 Jörn Kalinowski1
 Mohamed Belal Hamed2,3
 Jozef Anné2
 Kenneth Simoens4
 Kristel Bernaerts4
 Anastassios Economou2
 Tobias Busche1*
- 1Microbial Genomics and Biotechnology, Center for Biotechnology, Bielefeld University, Bielefeld, Germany
- 2Laboratory of Molecular Bacteriology, Department of Microbiology and Immunology, KU Leuven, Rega Institute, Leuven, Belgium
- 3Molecular Biology Department, National Research Centre, Dokii, Egypt
- 4Bio- and Chemical Systems Technology, Reactor Engineering, and Safety (CREaS) Section, Department of Chemical Engineering, KU Leuven, Leuven, Belgium
Streptomyces lividans TK24 is a relevant Gram-positive soil inhabiting bacterium and one of the model organisms of the genus Streptomyces. It is known for its potential to produce secondary metabolites, antibiotics, and other industrially relevant products. S. lividans TK24 is the plasmid-free derivative of S. lividans 66 and a close genetic relative of the strain Streptomyces coelicolor A3(2). In this study, we used transcriptome and proteome data to improve the annotation of the S. lividans TK24 genome. The RNA-seq data of primary 5′-ends of transcripts were used to determine transcription start sites (TSS) in the genome. We identified 5,424 TSS, of which 4,664 were assigned to annotated CDS and ncRNAs, 687 to antisense transcripts distributed between 606 CDS and their UTRs, 67 to tRNAs, and 108 to novel transcripts and CDS. Using the TSS data, the promoter regions and their motifs were analyzed in detail, revealing a conserved -10 (TAnnnT) and a weakly conserved -35 region (nTGACn). The analysis of the 5′ untranslated region (UTRs) of S. lividans TK24 revealed 17% leaderless transcripts. Several cis-regulatory elements, like riboswitches or attenuator structures could be detected in the 5′-UTRs. The S. lividans TK24 transcriptome contains at least 929 operons. The genome harbors 27 secondary metabolite gene clusters of which 26 could be shown to be transcribed under at least one of the applied conditions. Comparison of the reannotated genome with that of the strain Streptomyces coelicolor A3(2) revealed a high degree of similarity. This study presents an extensive reannotation of the S. lividans TK24 genome based on transcriptome and proteome analyses. The analysis of TSS data revealed insights into the promoter structure, 5′-UTRs, cis-regulatory elements, attenuator structures and novel transcripts, like small RNAs. Finally, the repertoire of secondary metabolite gene clusters was examined. These data provide a basis for future studies regarding gene characterization, transcriptional regulatory networks, and usage as a secondary metabolite producing strain.
Introduction
The genus Streptomyces includes Gram-positive filamentous growing soil bacteria with an extraordinarily high G + C content (Bentley et al., 2002). Streptomyces species have a complex life cycle with several biochemical and morphological changes. Spores germinate and form a vegetative mycelium, which in turn produces an aerial mycelium that afterward forms spores again (Leblond et al., 1993).
Streptomyces spp. are well known for their potential to produce secondary metabolites such as antibiotics. Important representatives of this genus are Streptomyces coelicolor A3(2) and Streptomyces lividans. They are the best-characterized Streptomyces strains and serve as model organisms (Hopwood, 1999). S. lividans TK24 is a plasmid-free, streptomycin-resistant derivative of the strain S. lividans 66 (Hopwood et al., 1983) and is often used as a host for cloning or heterologous expression and secretion of proteins or production of enzymes involved in antibiotic production (Hopwood et al., 1995; Bibb, 2005; Hamed et al., 2018).
Due to the wide range of applications, such as secretory production of human proteins (e.g., IL-4R, Zhang et al., 2004), industrial enzymes (Anné et al., 2014; Hamed et al., 2018) and bioethanol production (Lee et al., 2013), S. lividans TK24 has become an important strain in the field of biotechnology. Due to their high importance as secondary metabolite producers and the high number of secondary metabolite biosynthetic gene clusters that are apparently inactive or poorly expressed at standard cultivation conditions (Baral et al., 2018), Streptomycetes genomes are currently sequenced and explored in a large scale (Harrison and Studholme, 2014). There are 2,340 genomes or draft genomes listed in the NCBI database for the genus Streptomyces (NCBI database, 2021).
In contrast to draft genomes, complete Streptomycetes genomes are relatively rare, with just 328 listed as complete. The genome sequence of S. lividans TK24 was completely determined in 2015 by combining a paired-end whole genome shotgun library and a 7k mate-pair library. Gaps were closed using Sanger sequencing of corresponding PCR products. This version of the genome (GenBank: CP009124.1, submitted: 04-AUG-2014) has a size of about 8.345 Mbp and a G + C content of 72.24%. In total, 7,361 CDS, 18 rRNA genes organized in 6 operons and 64 tRNA genes were predicted (Rückert et al., 2015), with 1,990 CDS annotated as “hypothetical proteins” (Tsolis et al., 2018). Furthermore, 27 putative secondary metabolite gene cluster were predicted by the use of antiSMASH 5.0. By comparison of the S. lividans TK24 genome to its close relatives, 507 genes were identified, which have no homologs in S. coelicolor A3(2) (Rückert et al., 2015).
The ever-advancing technologies in the post-genomics fields, particularly transcriptomics and proteomics can be used today to generate much more exact descriptions of genes than possible by bioinformatics predictions only.
In this study, the genome of S. lividans TK24 was reannotated using a multi-omics approach based on transcriptome and proteome data. For the determination of transcription start sites (TSS) a library enriched for native 5′-ends of transcripts (Pfeifer-Sancar et al., 2013; Irla et al., 2015) and whole transcriptome libraries were sequenced on an Illumina sequencer.
The entire transcriptome information was used to verify and correct rRNA and tRNA predictions, to find novel transcripts and for the correction of translation start sites (TLS). Furthermore, the 5′-UTRs were analyzed regarding ribosome binding sites (RBS) and cis-regulatory elements like riboswitches and leader peptides in attenuated operons. Moreover, promoter motifs were determined using the information of TSS and TLS positions in the genome sequence of S. lividans TK24. In addition, secondary metabolite gene clusters were identified, and their transcriptional organization was analyzed. Open reading frames and accurate translation start sites were confirmed by identifying N-terminal peptides in the proteomics dataset. Finally, the genome of S. lividans TK24 was compared with that of its close relative S. coelicolor A3(2) (Jeong et al., 2016). The updated proteome annotations are accessible through the SToPS database.
Results and Discussion
Annotating the Genome in a Multi-Omics Approach by Transcriptome and Proteome Data
To improve the annotation of the S. lividans TK24 genome, a combination of transcriptome and proteome data was used. A state-of-the-art bioinformatics pipeline similar to that designed for the reannotation of the Actinoplanes sp. SE50/110 genome (Wolf et al., 2017) was applied (Figure 1). Finally, 7,472 CDS were annotated in the S. lividans TK24 genome (Table 1), compared to 7,361 predicted CDS in the previous annotation (Rückert et al., 2015).
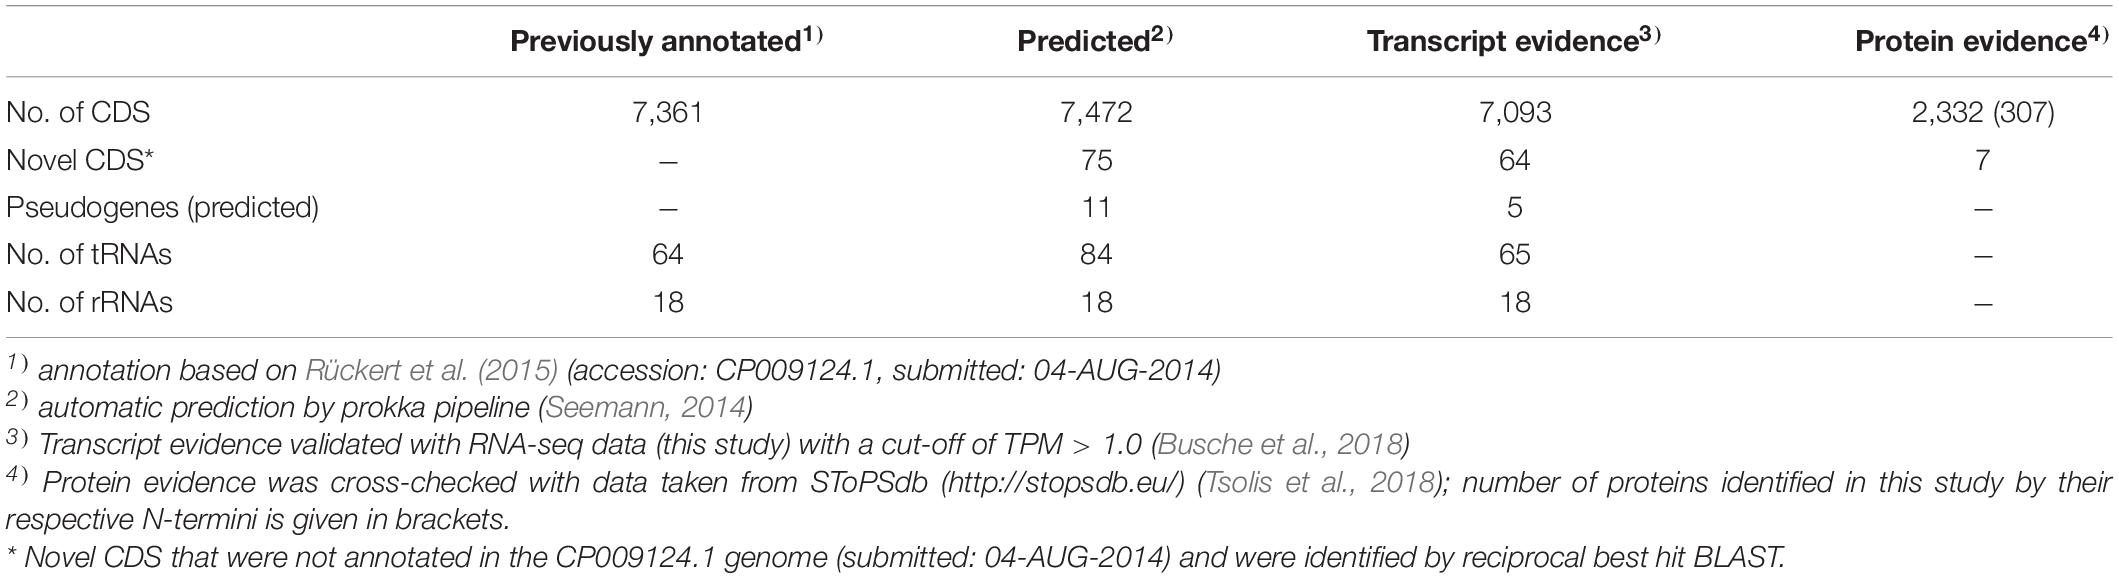
Table 1. Features of the reannotated S. lividans TK24 genome.
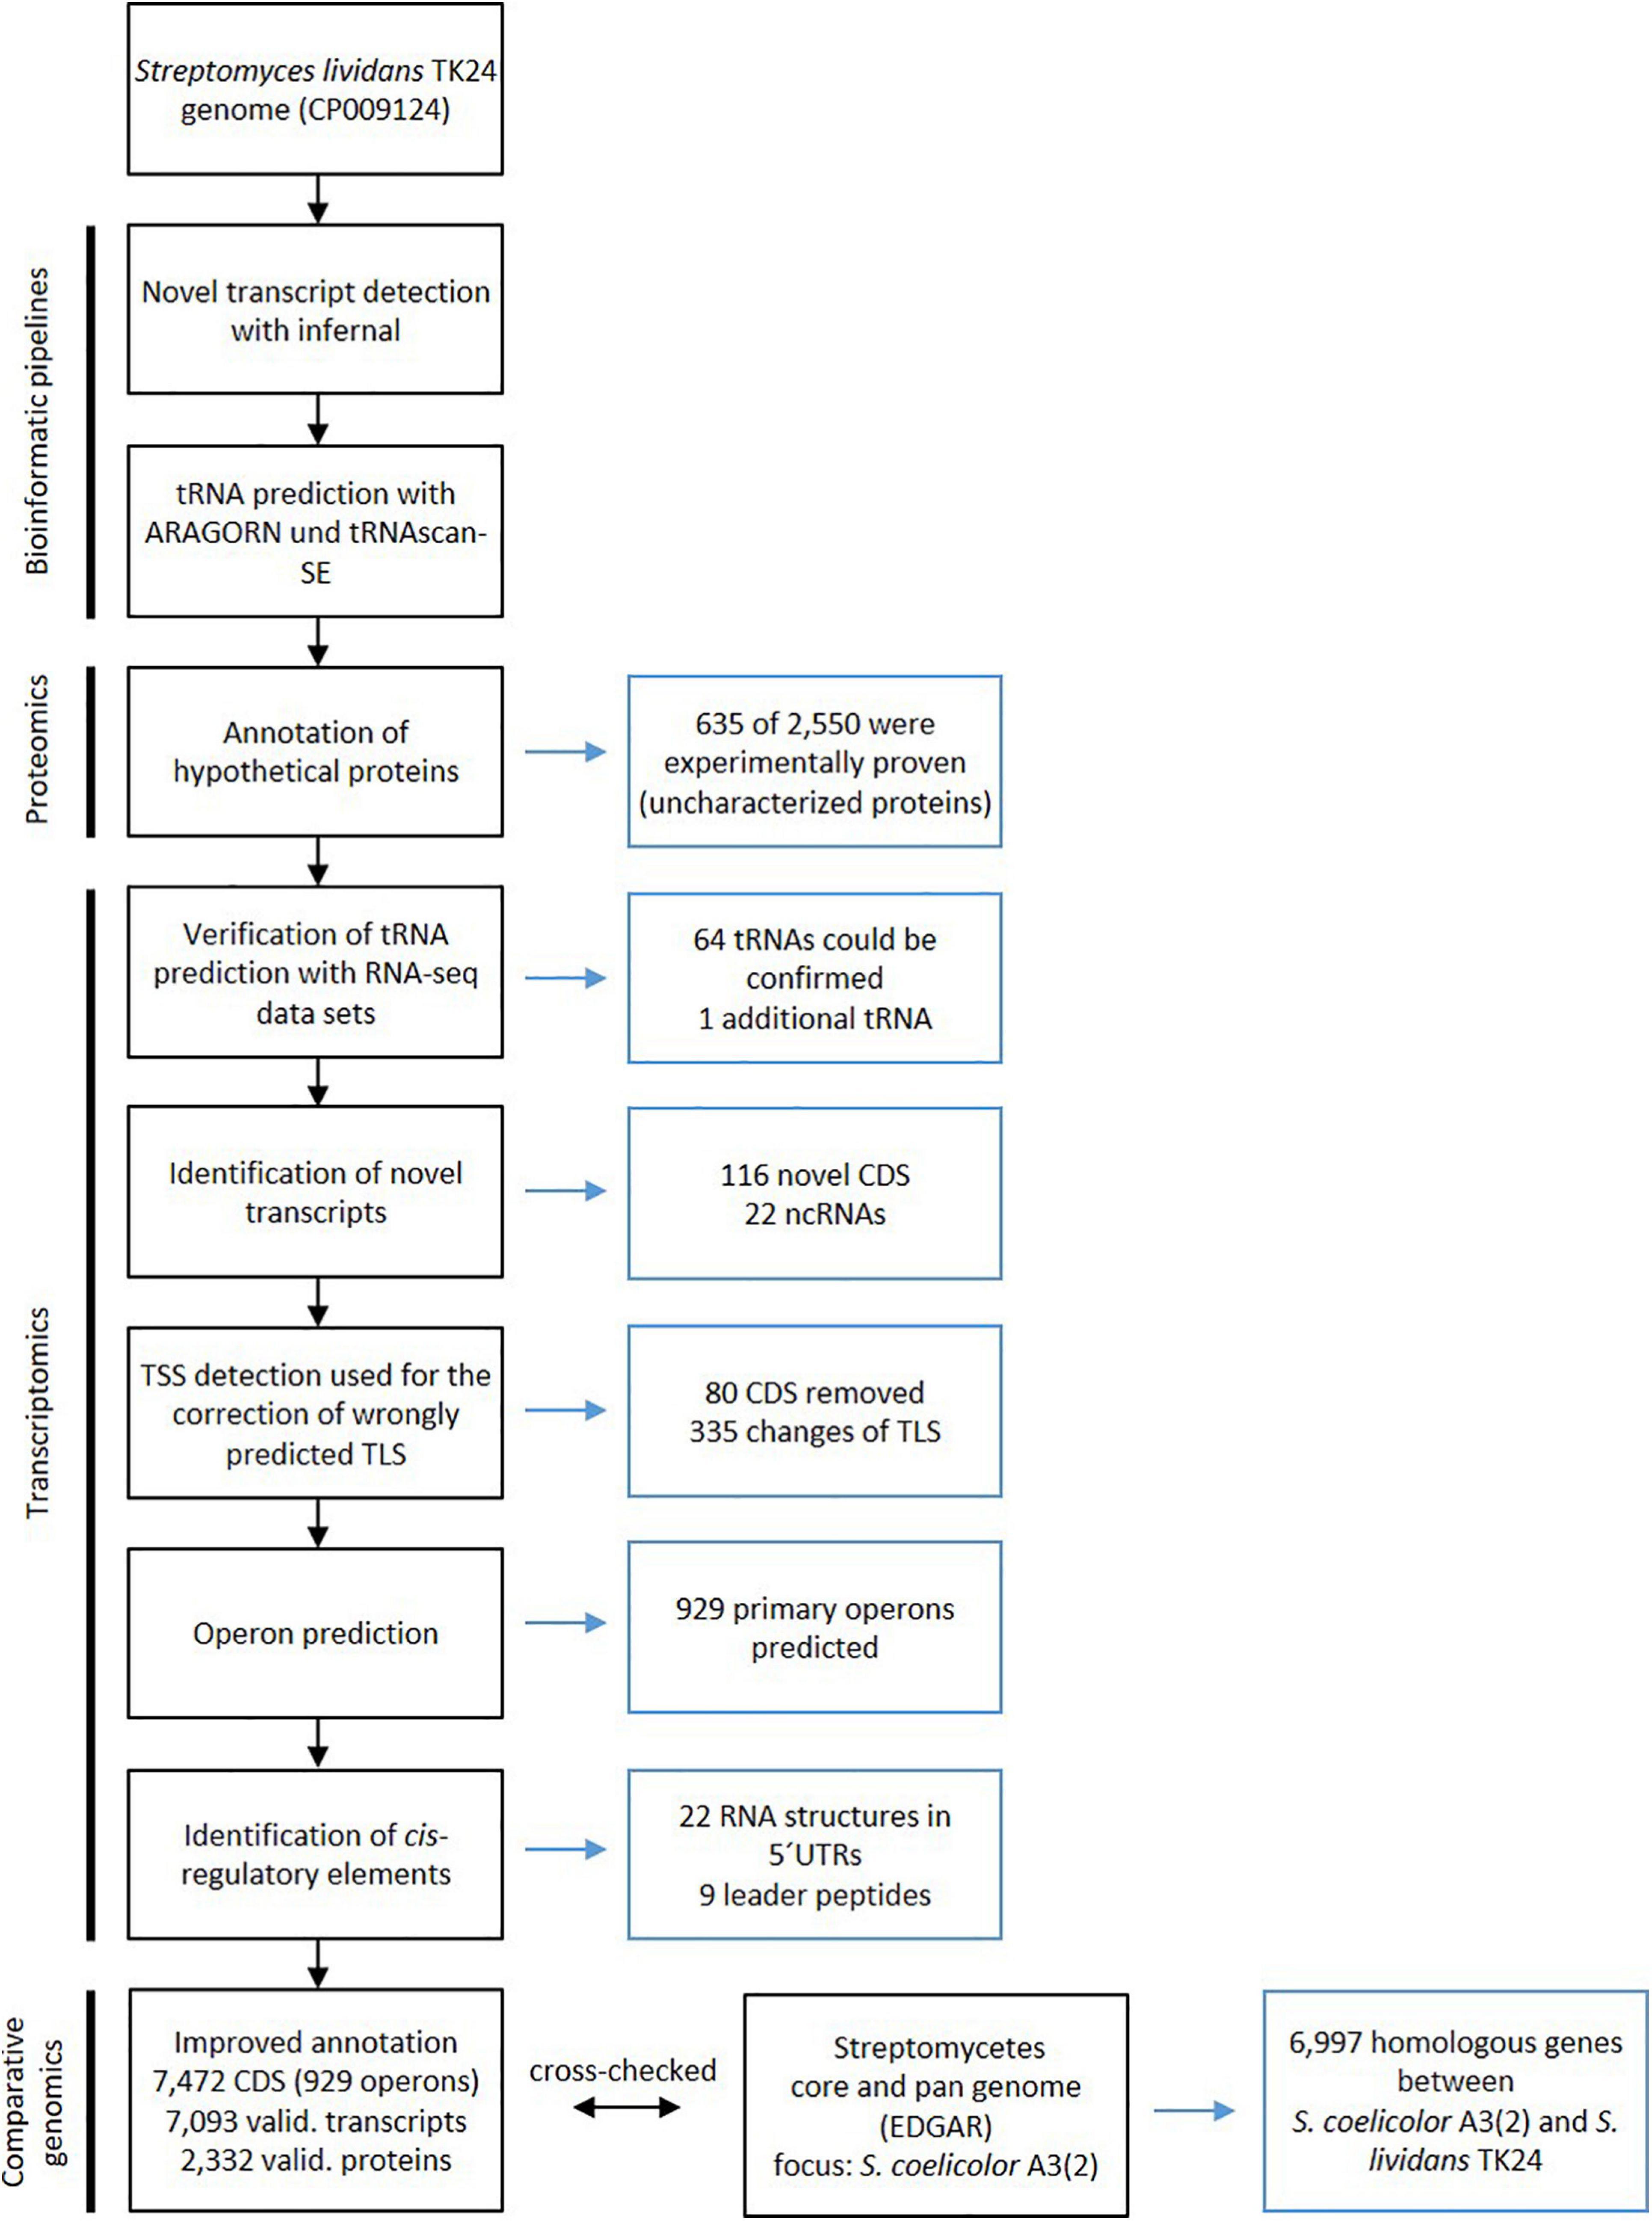
Figure 1. Workflow for improving the Streptomyces lividans TK24 genome annotation through transcriptomics and proteomics data. On the left side of the flow chart the specific analysis is defined and on the right side the conducted changes are described. Figure adapted from Wolf et al. (2017), Copyright (2017), with permission from Elsevier.
Proteomics data were obtained by LC-MS/MS analysis (Tsolis et al., 2019) and used to verify the existence of translated gene products under the tested conditions and to replace annotations of “hypothetical proteins” (Supplementary Table 3). By this, a total number of 2,332 proteins could be detected of which 131 were identified through their respective N-terminus (Table 1). All data were introduced into the SToPSdb database1.
By comparing the genome of S. lividans TK24 (this study) and S. coelicolor A3(2) (Jeong et al., 2016) it becomes clear, that the two strains are very similar to each other. The two genomes share ∼92.9% of all their genes (6,977 homologous genes, Figure 2).
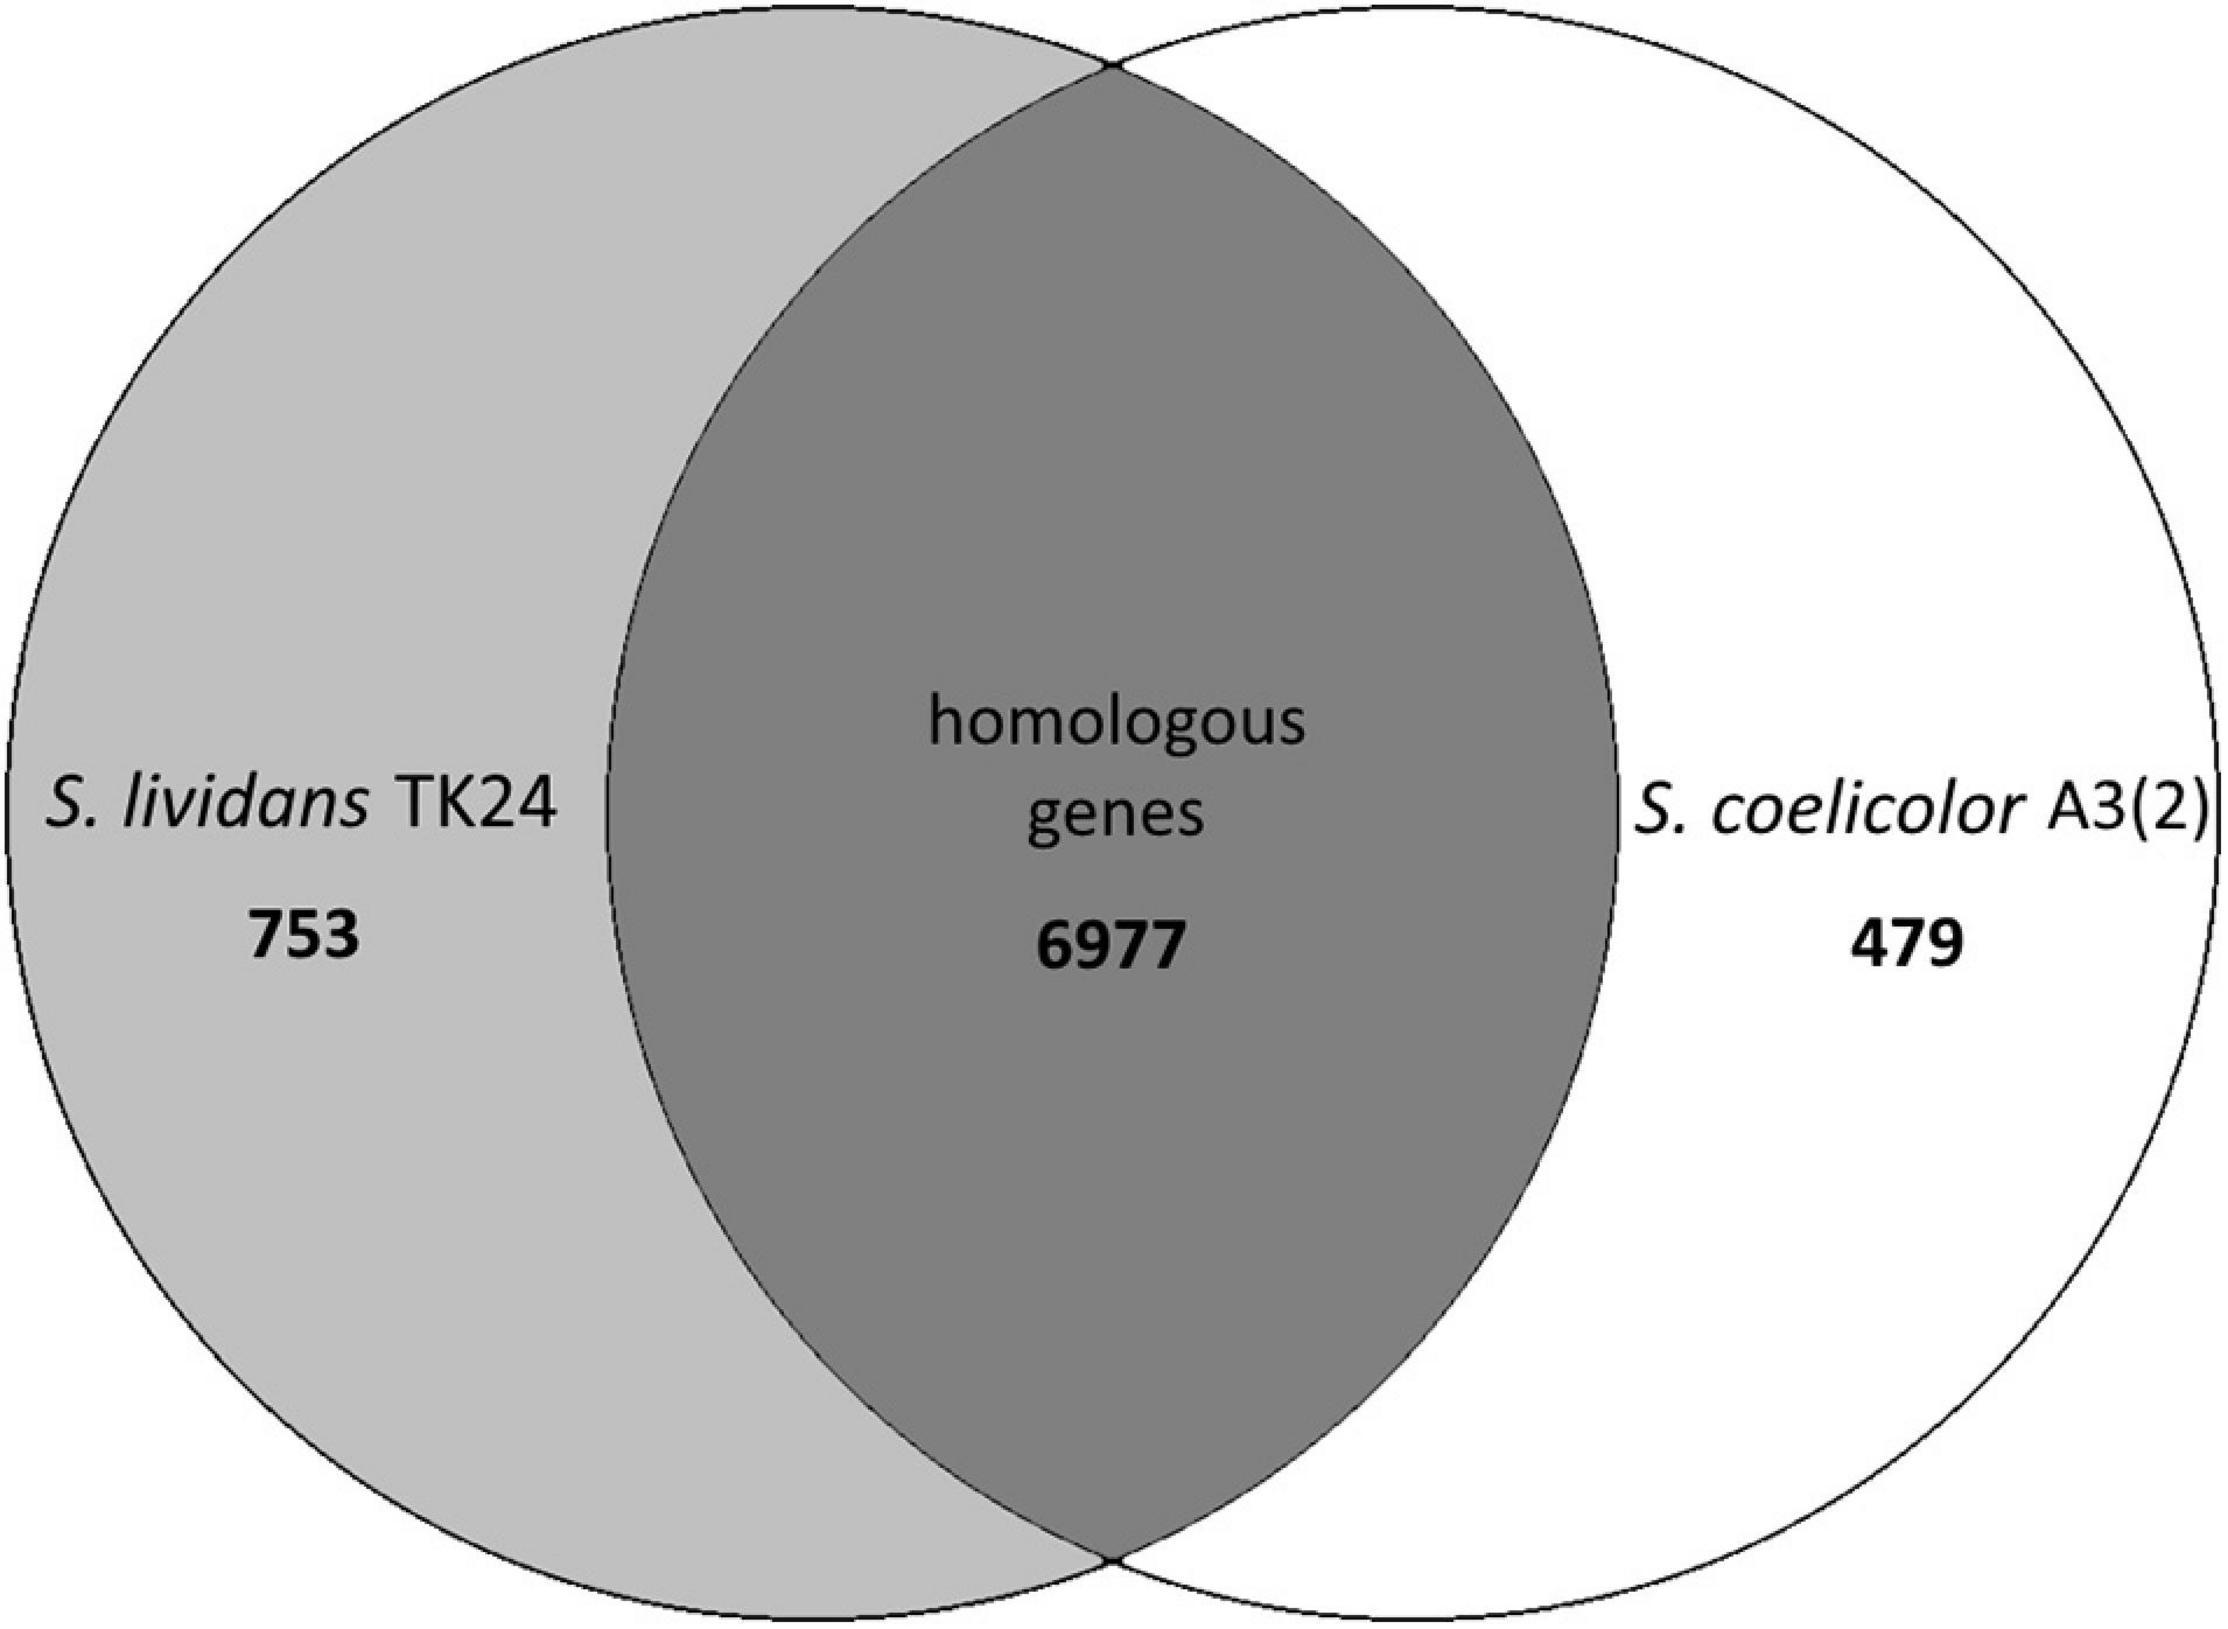
Figure 2. Venn diagram of the number of homologous genes shared between Streptomyces lividans TK24 and S. coelicolor A3(2), created using EDGAR (Blom et al., 2016), a software platform for comparative genomics.
Verification of Automatic tRNA Predictions With RNA-seq Data Sets
The bioinformatic detection of tRNAs in genomes with a high G + C content, like that of S. lividans TK24 (72.24%), results in a high false positive rate that is explained by the high G + C content of the tRNAs themselves (Laslett and Canbäck, 2008). The automatic tRNA detection via the prokka pipeline described in Rückert et al. (2015) was verified with the tRNA detection tool tRNAscan-SE 1.21 (Lowe and Eddy, 1997) and the predicted tRNAs were checked for transcription using the whole transcriptome data set.
In this way, all 64 tRNAs predicted by both software tools could be confirmed in addition to one tRNA identified only with ARAGORN.
Identification of Novel Transcripts in the S. lividans TK24 Genome
The genome was searched for novel transcripts using the Infernal software (Nawrocki and Eddy, 2013) with Rfam (Nawrocki et al., 2015) as a database. In this context, 23 novel transcripts could be identified containing a tRNA (described above), the tmRNA (RF00023) and 21 small RNAs (sRNA) (Table 2). Among the sRNAs, there is one, which affects ureB transcription (RF02514), the 6C RNA (RF01066), one actinobacterial sRNA Ms_IGR-5 (RF02471), one ASdes TB sRNA (RF01781), five ASpks TB sRNAs (RF01782), the RNase P RNA (RF00010), and the bacterial signal recognition particle RNA (RF00169).
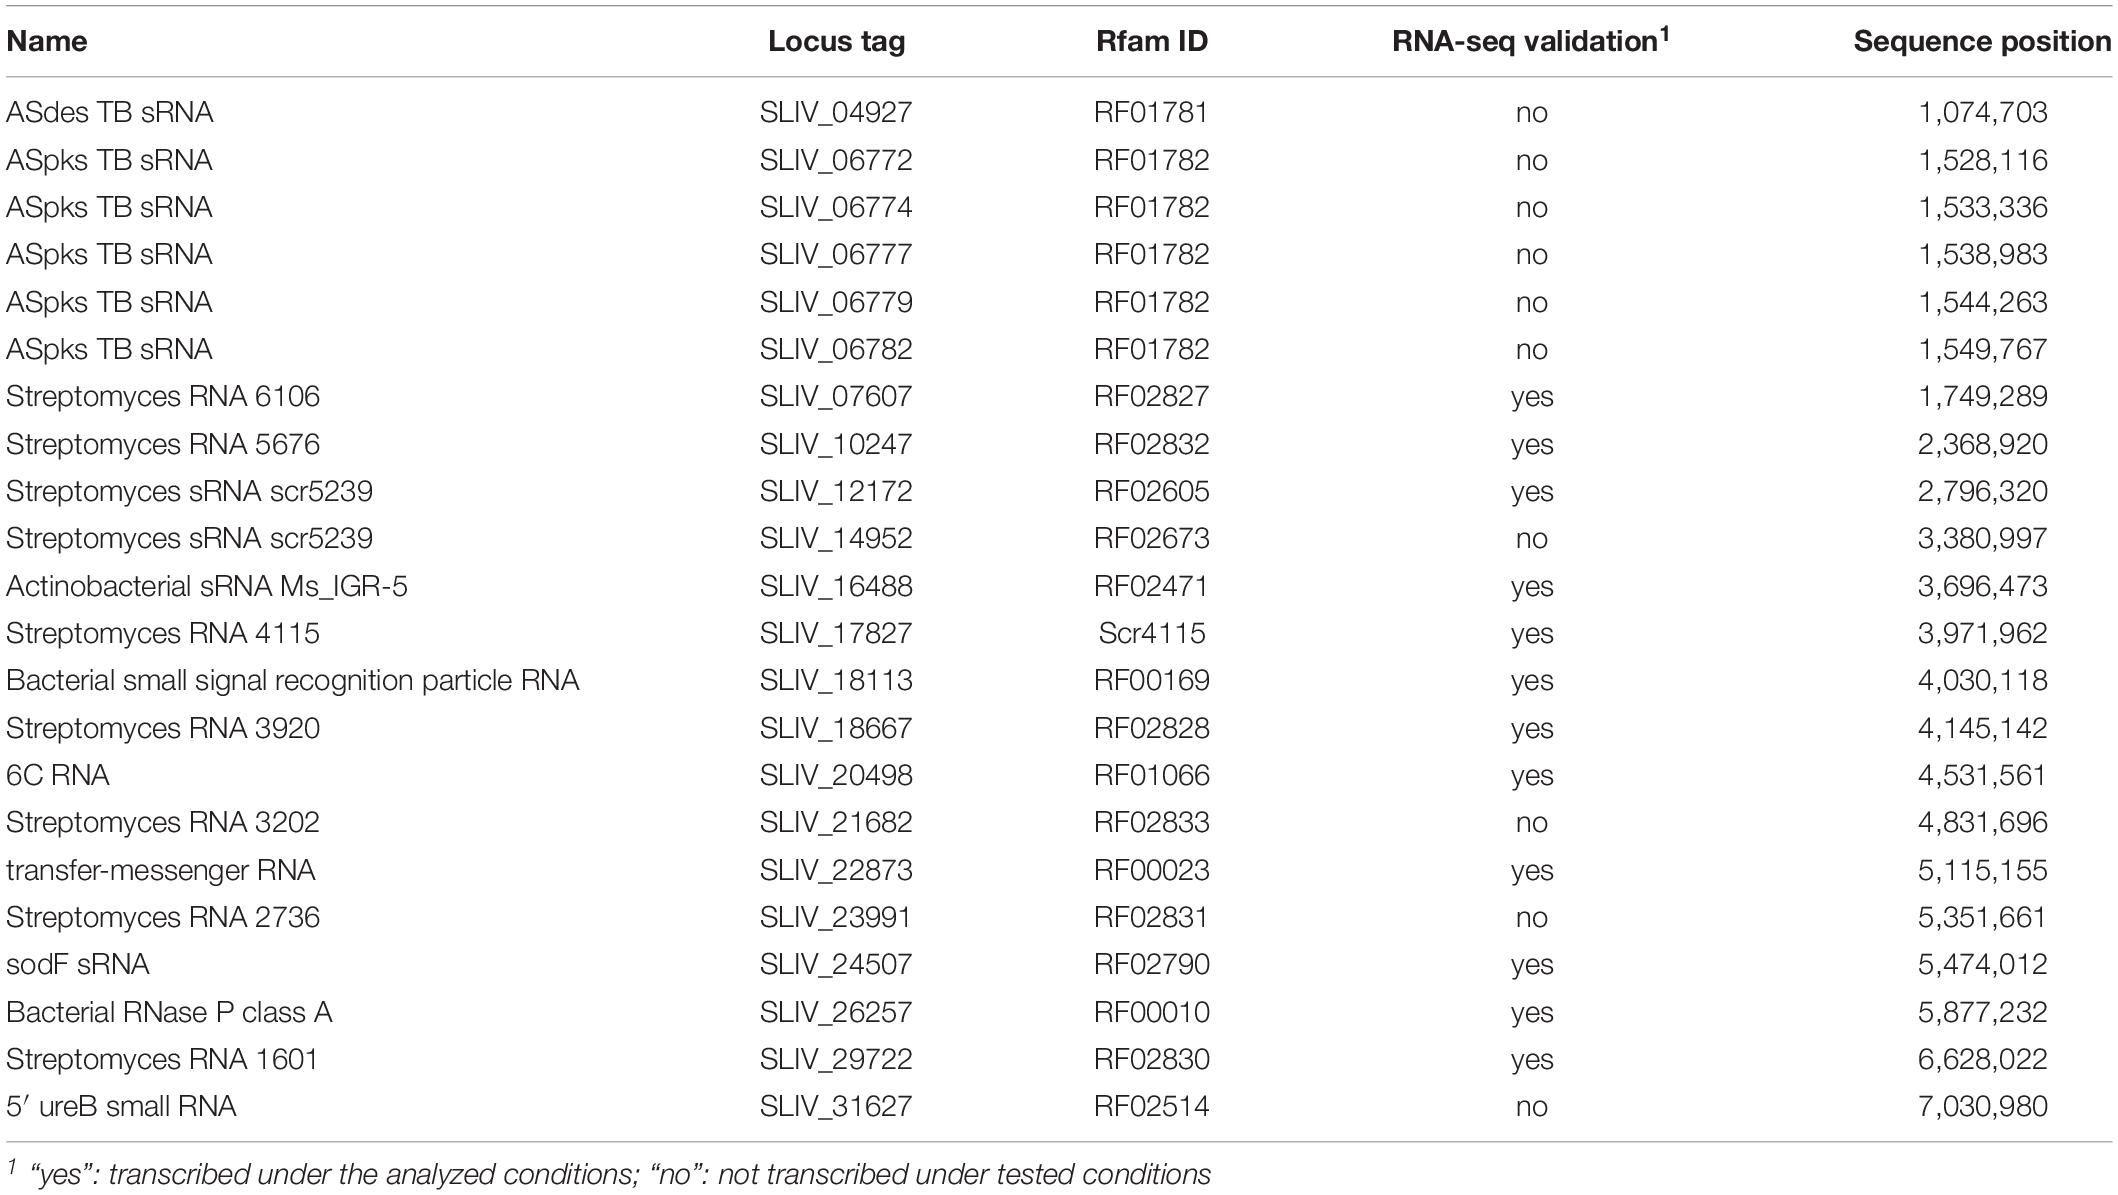
Table 2. Novel transcripts with known functions detected in Streptomyces lividans TK24 using the Rfam database.
The transcription of 12 of these novel transcripts could be verified by analyzing the RNA-seq data. This includes the bacterial RNase P class A (SLIV_26257), the bacterial signal recognition particle RNA (SLIV_18113), and the tmRNA (SLIV_22873), which are conserved in all bacteria, as well as the 6C RNA (SLIV_20498), which is conserved in all actinobacteria.
Improving the Annotation of Coding Regions by Correcting Wrongly Predicted Translation Start Sites
Due to the high G + C content of the S. lividans TK24 genome and the resulting fewer AT-rich stop codons, N-terminally extended ORFs are erroneously predicted (Hyatt et al., 2010). For this reason, translational start sites were manually corrected using the TSS predictions resulting from the RNA-seq data (Supplementary Table 2). In total, 335 start codons were changed, of which 48% were wrongly predicted ATG, 46% GTG and 6% TTG start codons. After TLS correction, the total amount of ATG start codons was increased to 55.4%, whereas the number of GTG and TTG start codons was decreased to 40.8% and 3.9% respectively.
Furthermore, 80 CDS were removed due to disagreements in the RNA-seq data (e.g., transcription on the opposite strand) and 116 novel CDS were annotated (Supplementary Table 1). About 26.7% of the novel annotated CDS are transcribed leaderless, and 30.2% have a 5′UTR. For the remaining 46.5% of the novel CDS, no TSS could be assigned or the genes are located in an operon. For 78 of the 116 novel CDS (67.2%) a homologous protein-coding gene in the genome of S. coelicolor A3(2) could be found by BLASTX search (Altschul et al., 1997).
Identification of Transcription Start Sites Through RNA-seq of 5′-Ends of Native Transcripts
To ensure a high annotation quality of the S. lividans TK24 genome, an RNA-seq data set enriched for native 5′-transcript ends and whole transcriptome datasets were used for the refinement. The sequencing of the 5′-transcript end library revealed 2.5 million reads mapping to the S. lividans TK24 genome. For the whole transcriptome sequencing around 191 million reads were mapped on the genome. For this, transcriptomes were sequenced from two cultivations in two different media and at three different time points as described previously (Tsolis et al., 2019). This data set can be used to identify transcribed (novel) genes, operon structures and small or antisense RNAs.
Transcription start sites (TSS) were identified using the 5′-end RNA-seq data set (Figure 3). The analysis and visualization was carried out with the software ReadXplorer 2 (Hilker et al., 2016) as described by Wolf et al. (2017). 8,344 TSS were detected by automated prediction, of which 343 TSS are located in rRNA and tRNA genes and 2,532 false positive TSS were excluded from further analysis. Finally 5,580 manually curated TSS of which 5,424 TSS belonging to annotated genes and 760 belonging to new transcripts (Figure 3B, Supplementary Table 4). 687 TSS of these were classified as putative antisense TSS due to their orientation to 606 CDS and their UTRs. 108 TSS could be assigned to novel CDS or novel transcripts (Figure 3B, Supplementary Table 1). Furthermore, the RNA-seq datasets were used to verify and to correct the translation start sites for the improvement of the annotation, to verify the tRNA prediction, for the identification of novel transcripts and small RNAs, as well as for the identification and analysis of cis-regulatory elements like riboswitches (Table 3).
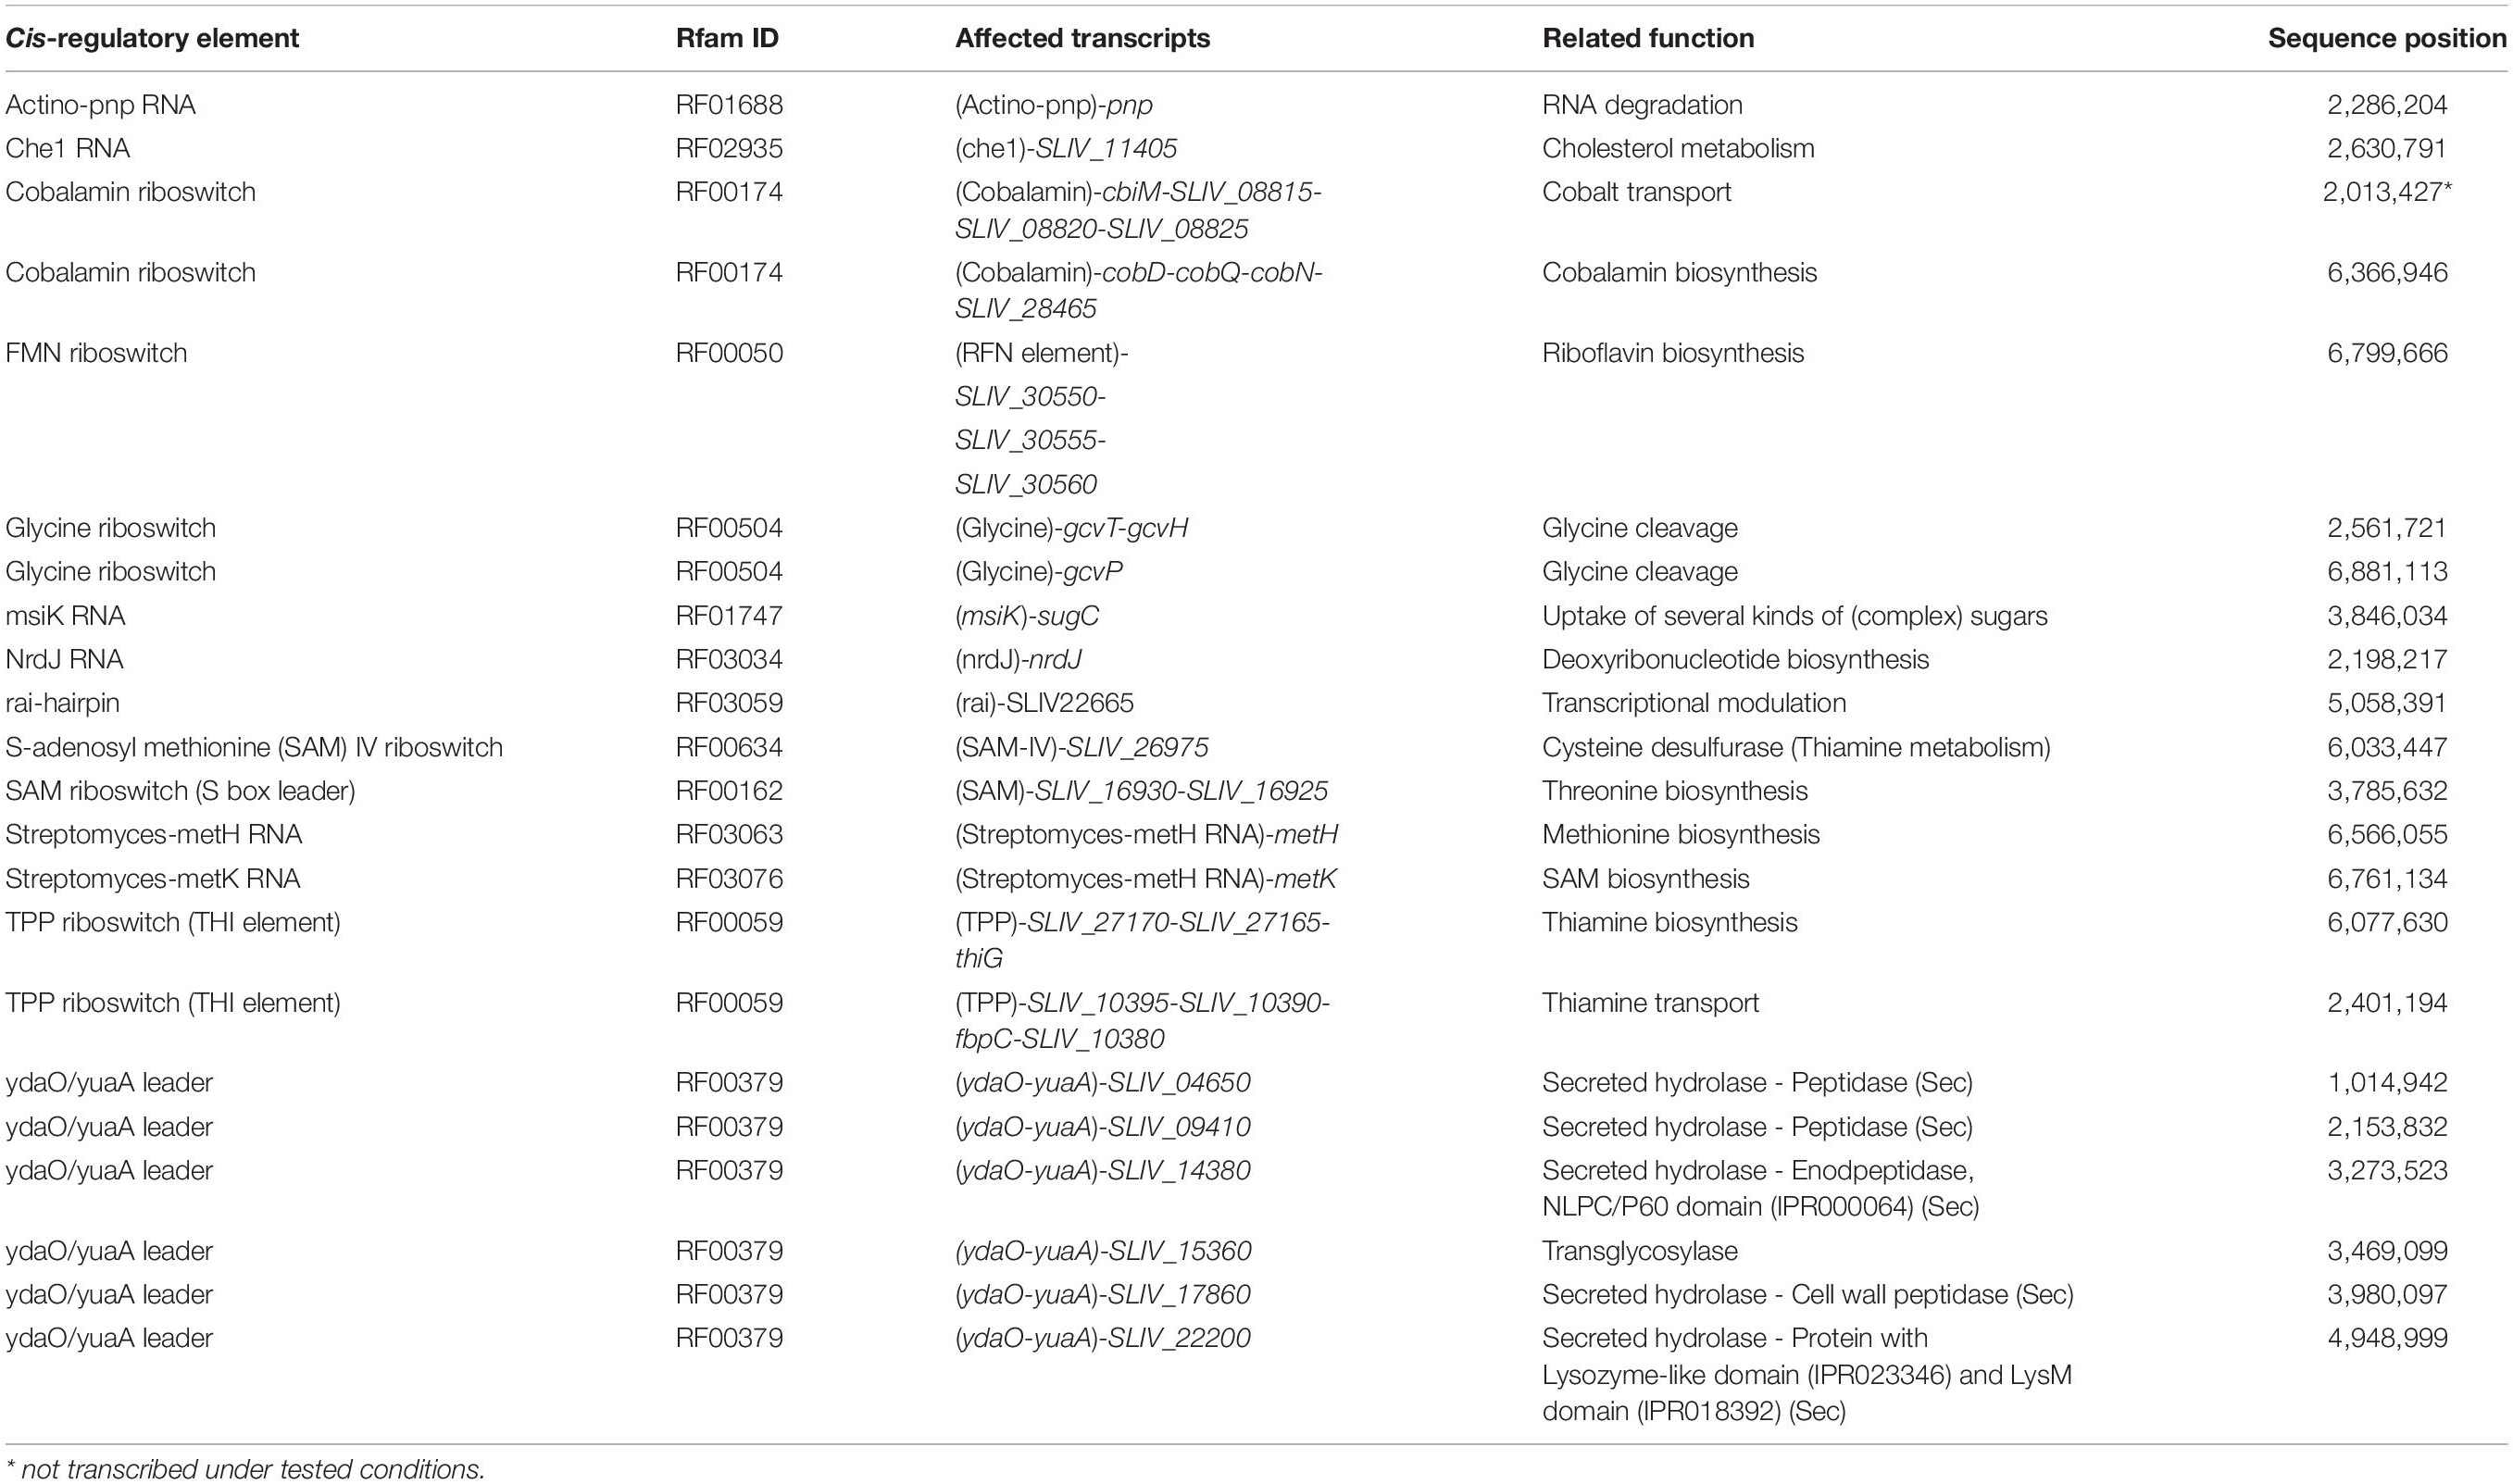
Table 3. Cis-regulatory elements detected in the Streptomyces lividans TK24 genome by searching the Rfam database and validated by RNA-seq data.
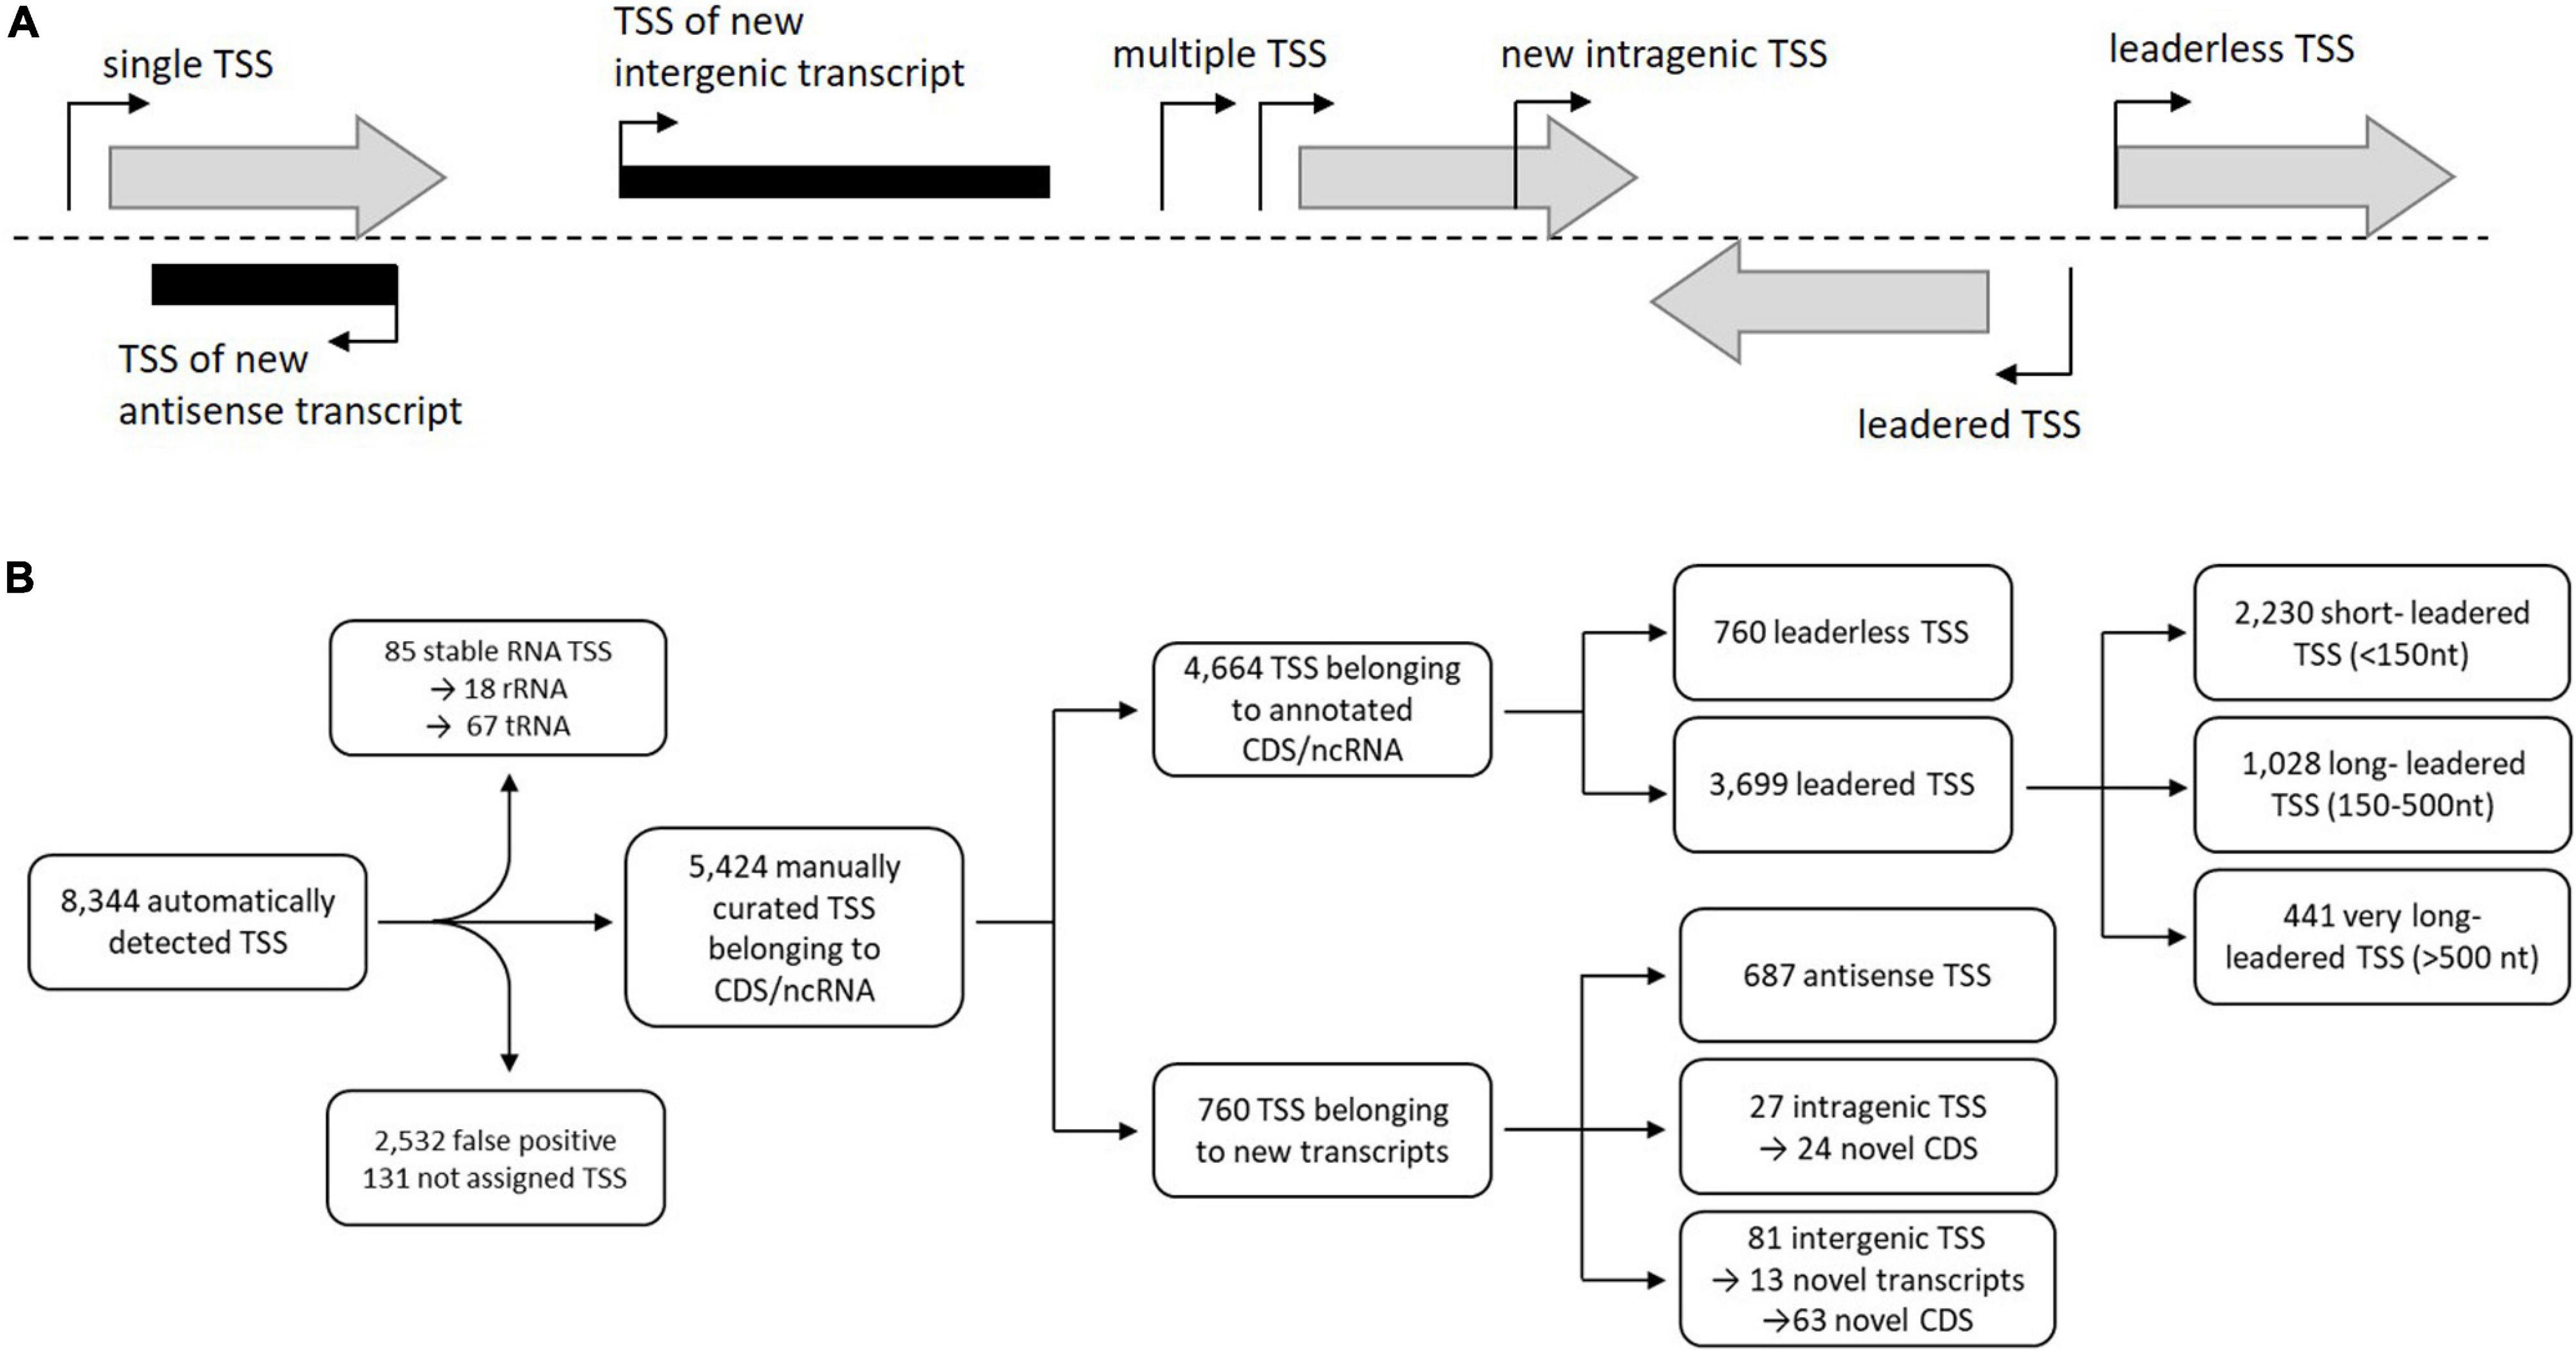
Figure 3. (A) Classification of transcription start sites (TSS) based on genomic context (expanded from Pfeifer-Sancar et al., 2013). The first TSS classification level is divided into two categories: TSSs that belong to annotated genes (gray shaded arrows) and TSSs that belong to new transcripts (black rectangles). TSSs belonging to annotated genes were classified into single TSSs or multiple TSSs. TSSs belonging to new transcripts were arranged into antisense, intragenic, or intergenic TSSs. (B) Identification, filtering, and classification of TSSs (expanded from Pfeifer-Sancar et al., 2013). From the 8,344 automatically detected TSSs, those TSSs were removed that belong to rRNAs or tRNAs (85) as well as those determined to be false-positive by manual inspection (2,532) for further analyses resulting in 5,580 putative TSS assigned to different transcript types.
In S. coelicolor A3(2) the identification of transcription start sites revealed a total of 3,570 TSSs, which were further categorized into primary (2,771), secondary (333), antisense (256), intragenic (79) and intergenic (131) TSSs (Jeong et al., 2016).
Genomic Features Deduced From the Location of Transcription Start Sites of the S. lividans TK24 Genome Sequence
Analysis of the S. lividans TK24 Transcripts With and Without 5′-UTR
Bacterial mRNAs most often have a 5′untranslated region (5′-UTR), which differ in length between different transcripts. These UTRs are often called leader transcripts and play an important role in the regulation of transcription and translation. Such a leader also contains the ribosome binding site. Transcripts with no 5′-UTR are called leaderless. The analysis of all transcripts of S. lividans TK24 revealed the size distribution of their 5′-UTRs (Figure 4). The UTR length varies between 0 and 3,068 nucleotides, with 90% of all analyzed UTRs having a length of less than 500 nt. More than 75% of the leader transcripts are 5-200 nucleotides long.
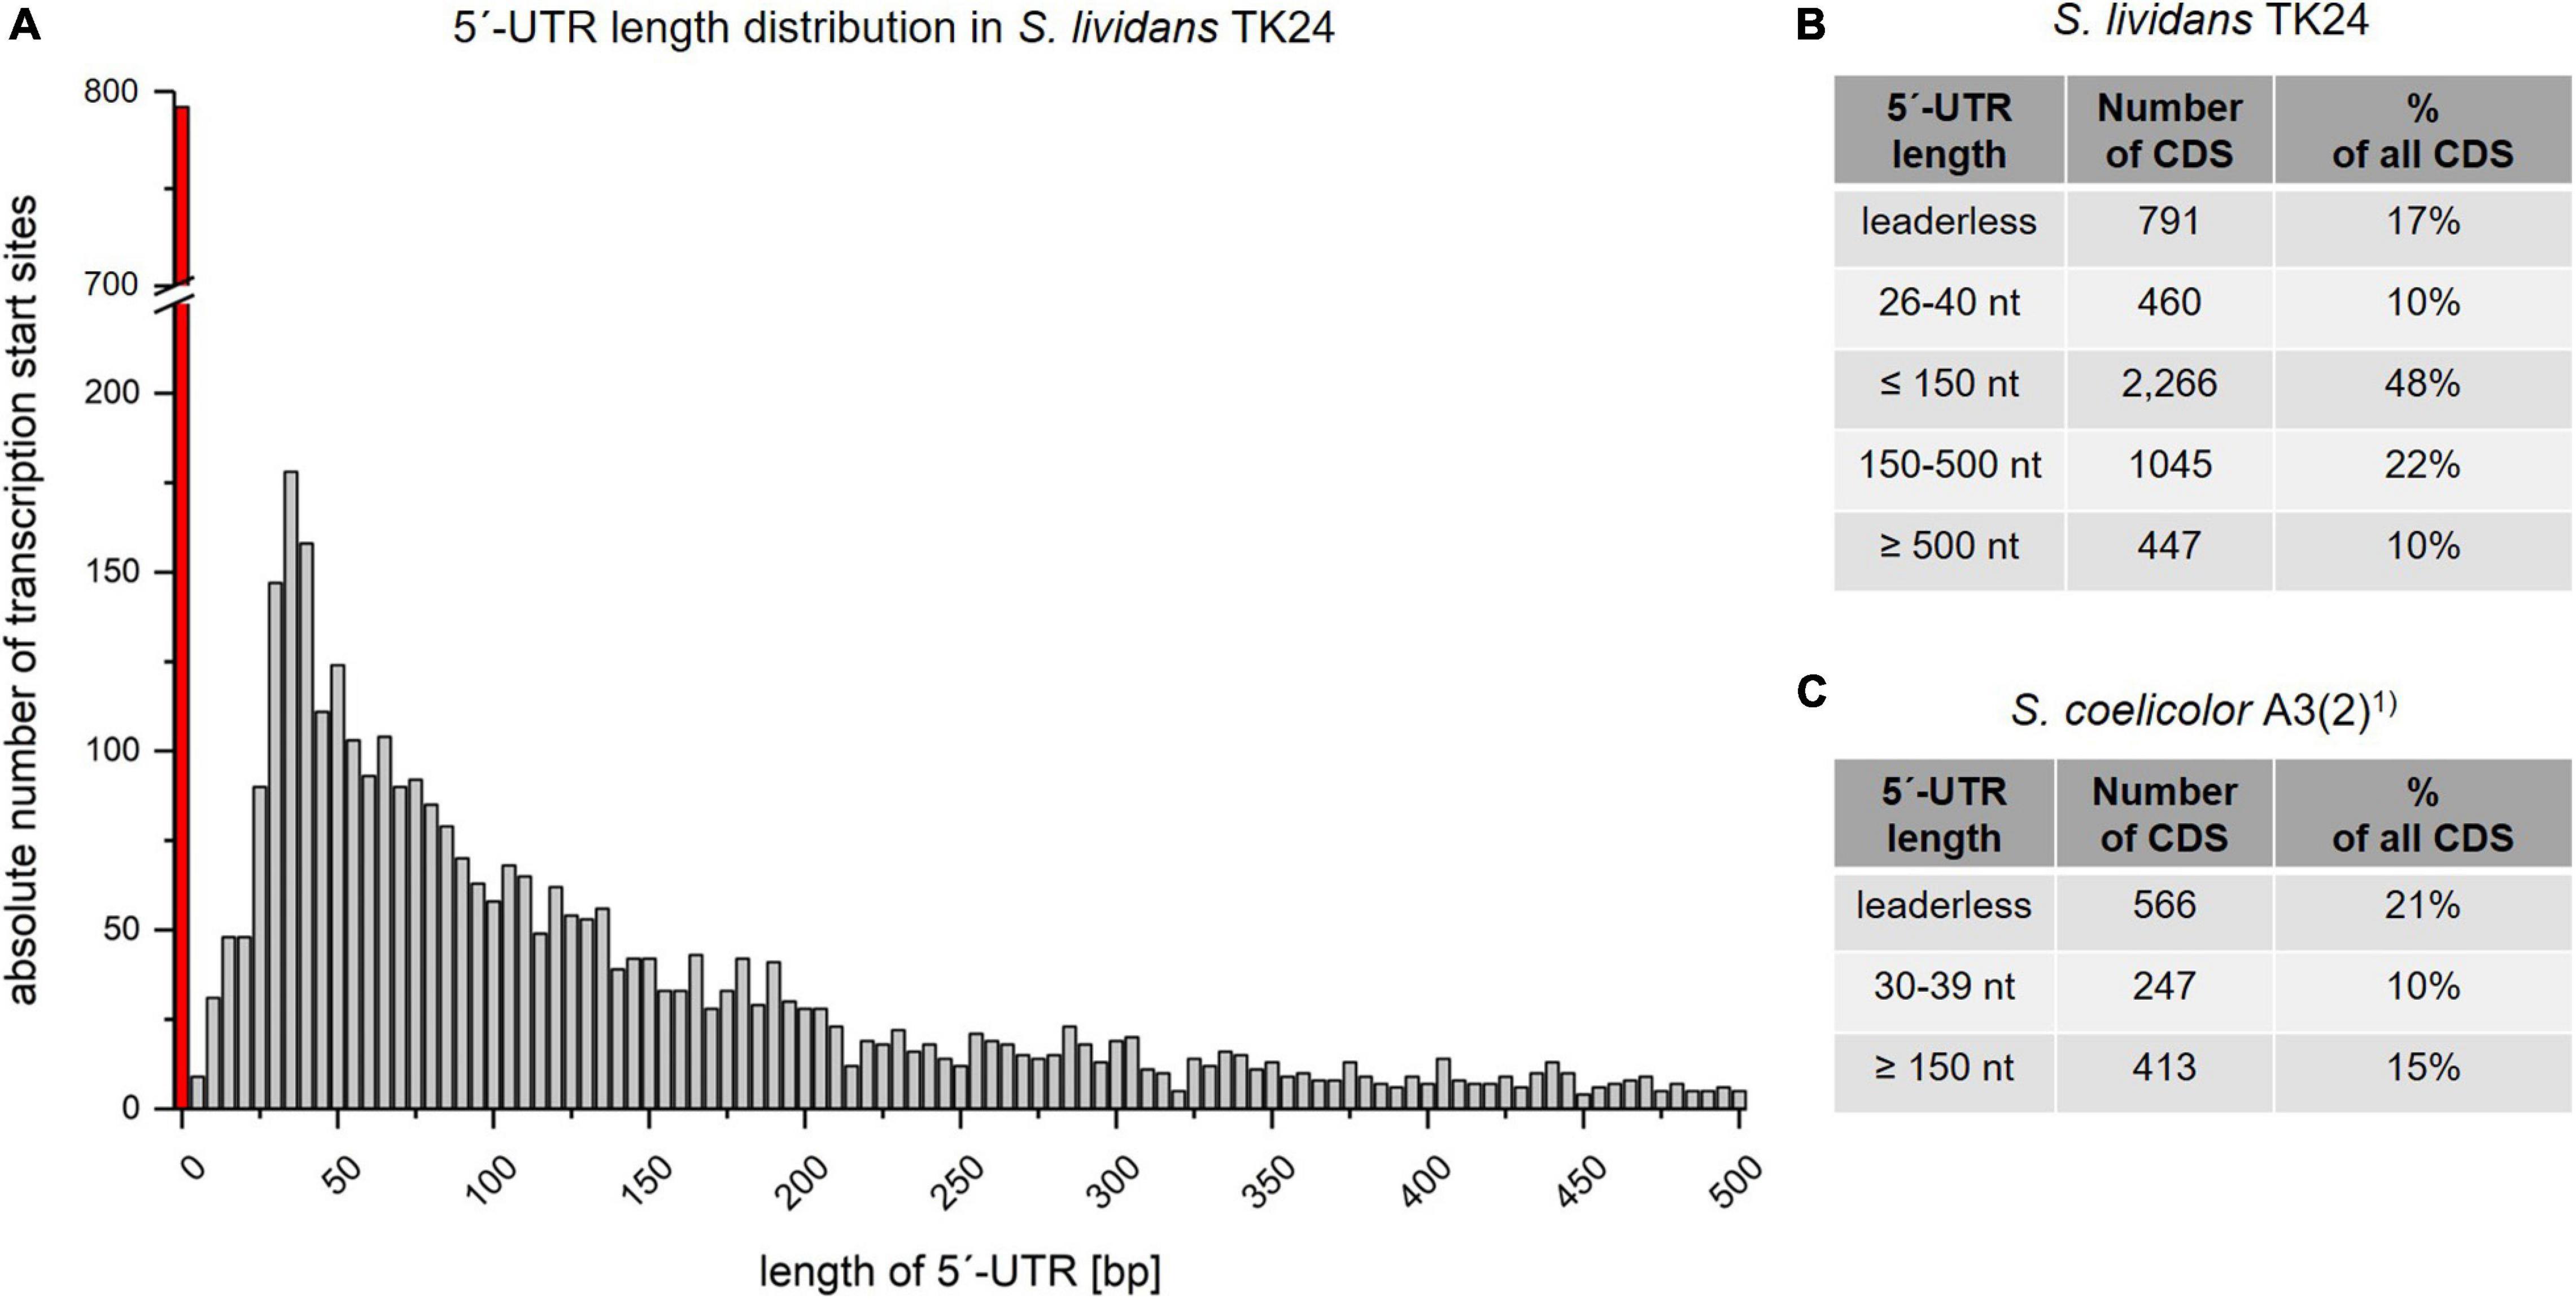
Figure 4. Length distribution of the 5′-untranslated regions (5′-UTRs). (A) 5′-UTR length distribution based on 4,717 identified TSSs and up to a length of 500 nucleotides. X axis: Absolute number of leader sequences detected for the given length interval. Y axis: The length of leader sequences plotted in 5 nucleotide intervals. The red bar represents leaderless transcripts with a leader sequence length of 0 to 3 nucleotides. (B) Different categories of 5′-UTR lengths in Streptomyces lividans TK24. (C) Different categories of 5′-UTR lengths in S. coelicolor A3(2), based on the data of Jeong et al. (2016)1).
For most bacteria analyzed by bioinformatics predictions, the most common 5′-UTR length was less than 30 (Sorek and Cossart, 2010) to 40 nucleotides (Passalacqua et al., 2009). However, this estimation may change due to recent developments in NGS technologies (McClure et al., 2013). Leaderless transcripts in the S. lividans TK24 genome were determined to be 791 (17% of all primary TSS) (Figures 3B, 4B), which is in common with the proportion of leaderless transcripts identified in S. coelicolor A3(2) (566; 21.0%) by Jeong et al. (2016) (Figure 4C). These numbers include not only monocistronic genes but also the first genes of operons. ATG and GTG translation start codons were found a frequency of 67.8% and 32.2%, respectively, in all leaderless transcripts. The most frequent 5′-UTR length range is 26–40 nt (460 10%) in S. lividans TK24, which matches the findings for S. coelicolor A3(2) (30-39 nt; 247; 10%) (Figures 4B, 4C).
Global Identification of −10 and −35 Promoter Consensus Motifs in the S. lividans TK24 Genome
Based on the 5′-end transcriptome library data and the resulting exact position of the TSS, we were able to search for promoter motifs, such as the −10 region (Pribnow box) and the −35 region of promoters addressed by the house-keeping sigma factor.
Therefore, 70 bases upstream of the identified primary TSS were searched with the web tool Improbizer (Ao et al., 2004). For the −10 region a conserved hexamer motif represented by TAnnnT was found in 88.7% of all sequences examined (4,268 of 4,812 sequences in total) (Figure 5 and Supplementary Table 5). For leaderless transcribed genes, the conserved -10 sequence was found in 93.4% of all sequences. The T on the first position of the identified hexamer was found in 63.8% of the leaderless and in 42.9% of the analyzed leadered sequences. For the A on second position within the −10 motif, a frequency of 94.5% in leaderless and 70.6% of leadered transcribed genes could be determined. In the last position of the -10 hexamer, a T could be identified with an abundance of 97.4% and 73.6% in the considered sequences of leaderless and leadered transcribed genes in S. lividans TK24.
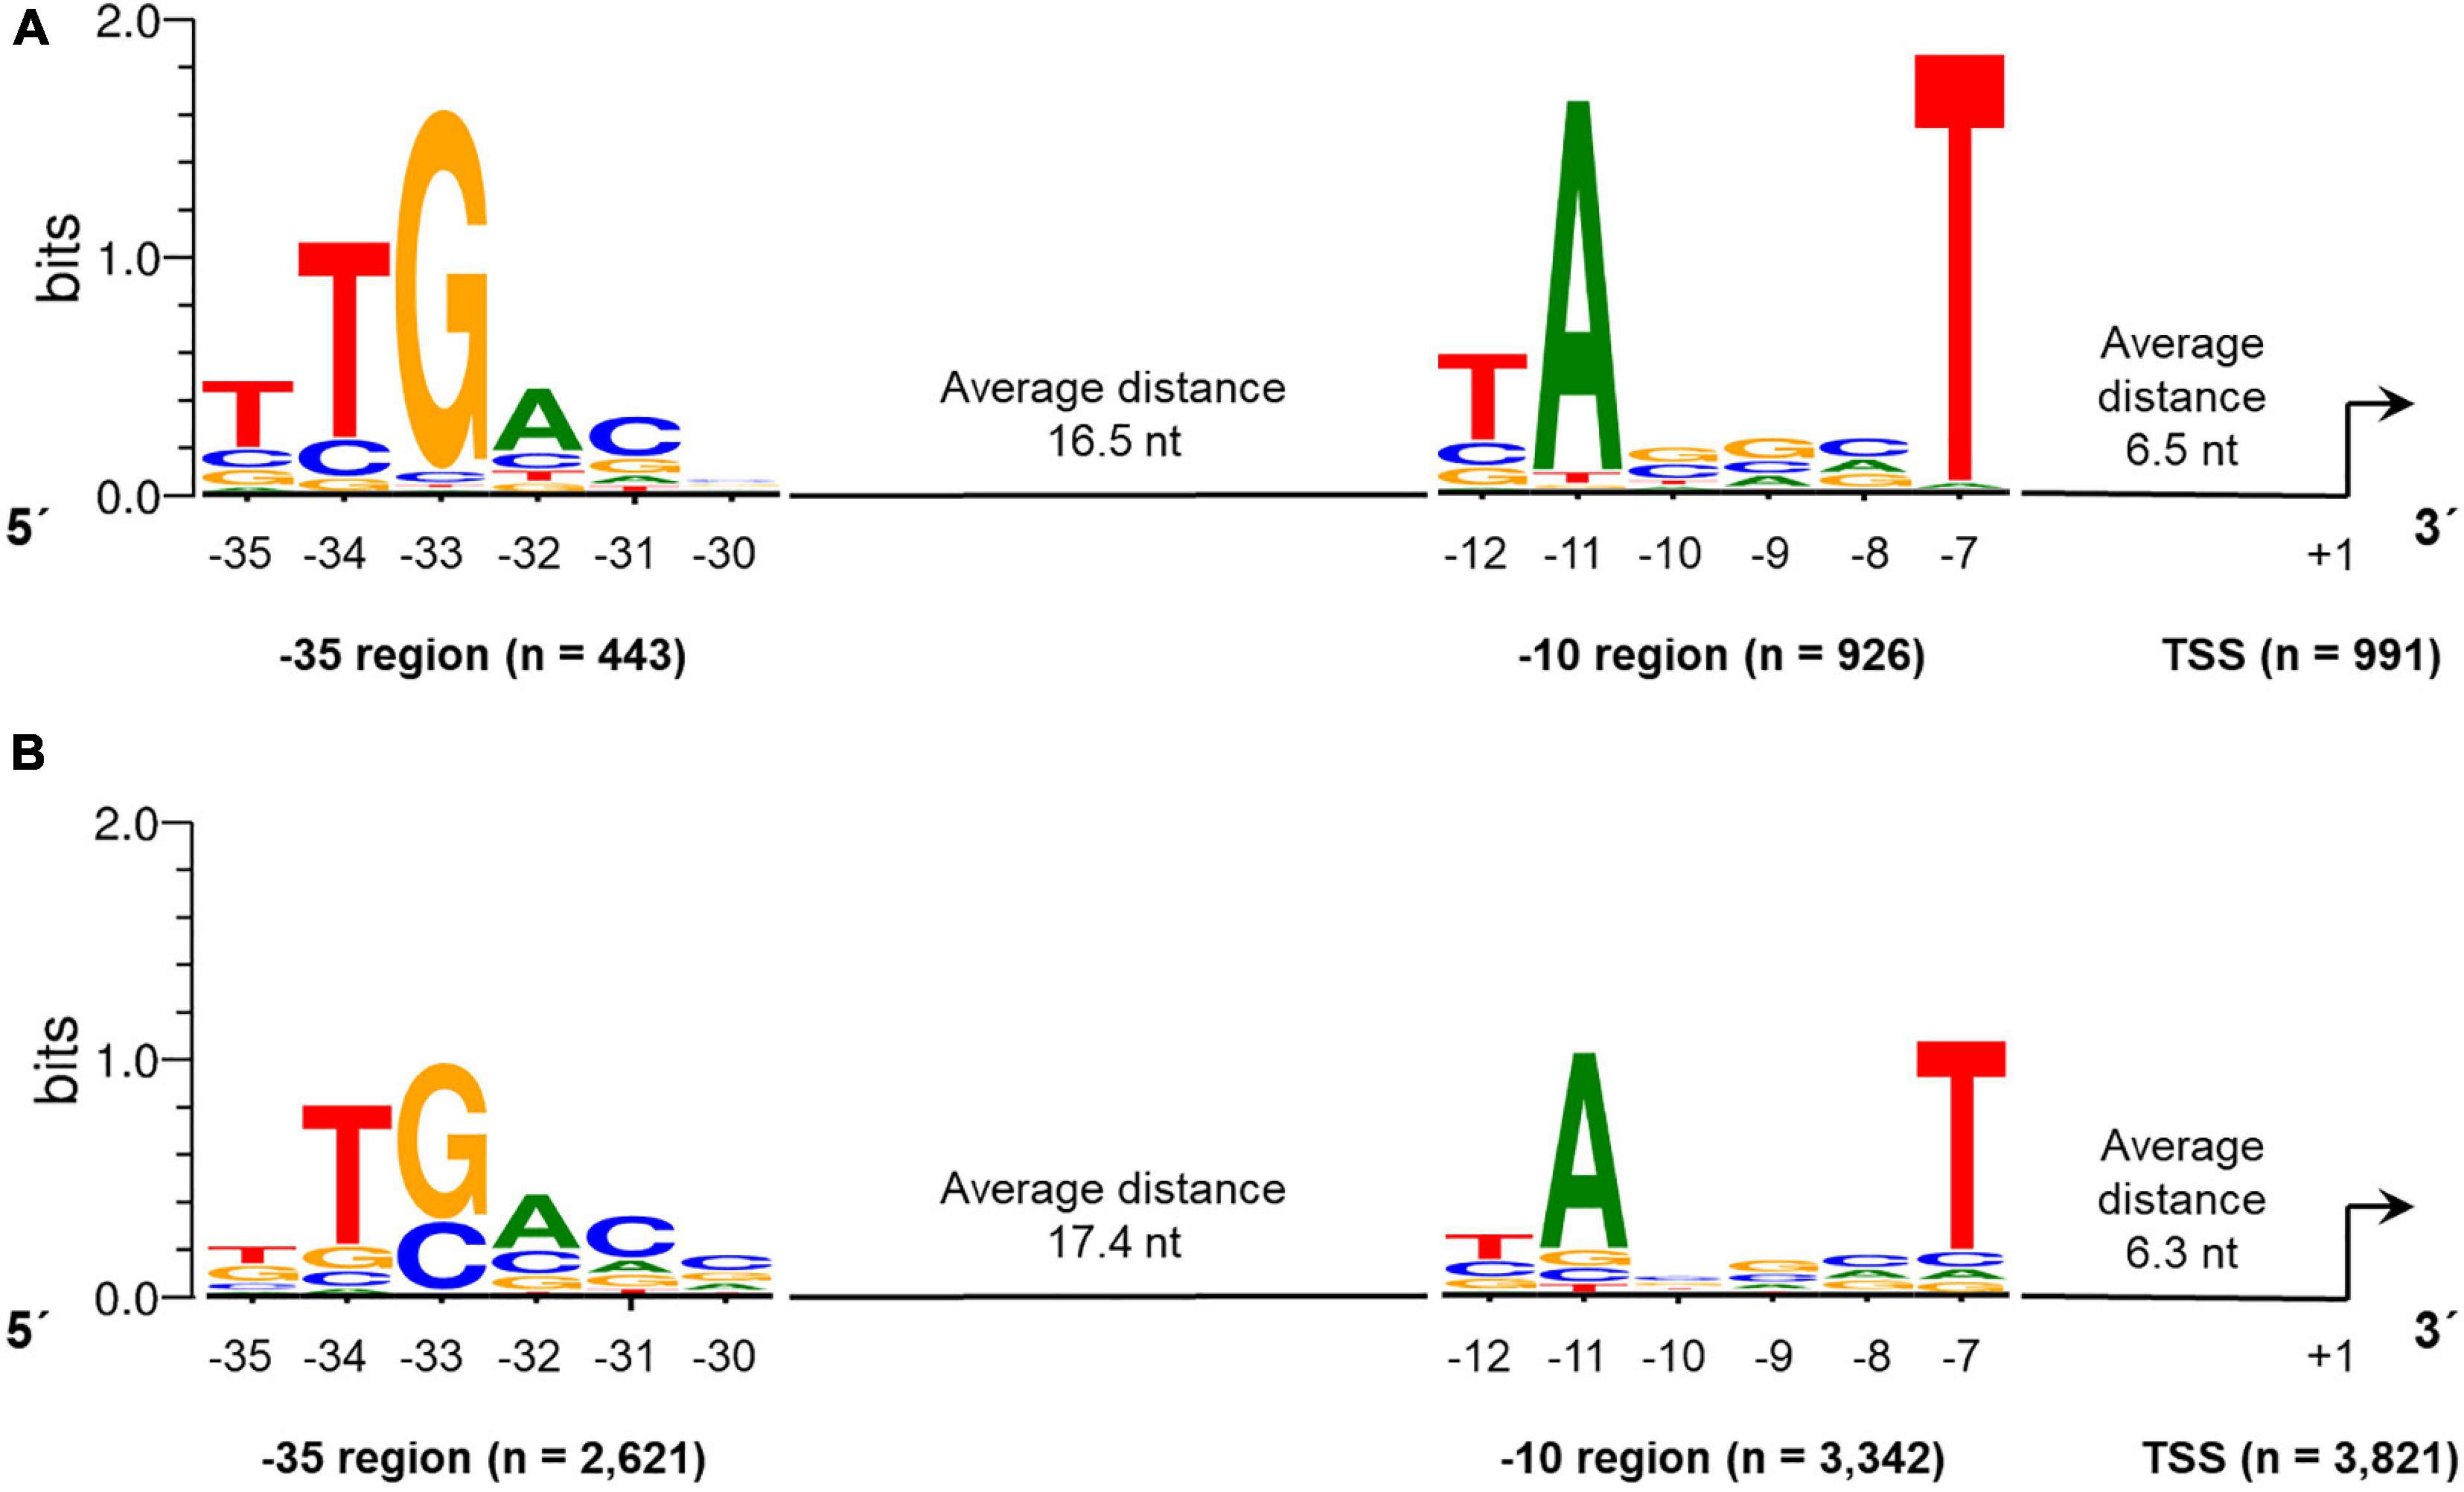
Figure 5. Conserved –10 and –35 regions identified in promoter regions of leaderless (A) and leadered (B) transcribed genes in the Streptomyces lividans TK24 genome. The motifs were identified using Improbizer (Ao et al., 2004), the logos were created using WebLogo (Crooks et al., 2004).
The average distance between the 10 hexamer and the TSS was 6.3 nucleotides (Figure 5). The distance ranges between 4 and 9 nucleotides whereas 88.7% of all spacers are between 5 and 7 nucleotides in length. For 97.1% of the leaderless and 72.3% of the analyzed leadered TSS, the first base is a purine (A or G).
Next, the aligned sequences were used for the analysis of the −35 region using Improbizer (Figure 5). The distance between −10 and −35 was restricted to a length of 15 to 19 nucleotides, resulting in a total number of 443 (leaderless) and 2,621 (leadered) examined sequences. The consensus hexamer motif was TTGACn for the leaderless and nTGACn for the leadered transcribed genes respectively, since the T on the first position was not identified frequently for leaderless transcripts (Supplementary Table 5). These are largely consistent with the E. coli −35 consensus motif TTGACA. This motif could be identified in 3,064 of all 4,812 analyzed sequences (63.7%). The average distance between the −10 and the −35 regions was found to be 16.5 nt (leaderless) and 17.4 nt (leadered), which is similar to the spacer length of 17 nt described as optimal in E. coli (Singh et al., 2011).
In S. coelicolor A3(2) the -10 motif was found to be TAnnnT (in 80.4% of the analyzed TSS upstream regions, which is identical to the identified consensus sequence in this study. In addition, the −35 region of S. coelicolor A3(2) (nTGACC; upstream of 58.6% of the TSSs) is very similar to that found in S. lividans TK24 (TTGACn; Figure 5). The slight difference in the sixth position may be due to the different number of analyzed TSS or different weighting criteria.
Determination of Ribosome Binding Sites in the S. lividans TK24 Genome Sequence
For the identification of potential ribosome binding sites (RBS; Shine-Dalgarno sequence) in S. lividans TK24, all CDS with a primary TSS and a 5′-UTR size of 10 to 150 nucleotides were analyzed. For those CDS (2,385), the sequence 20 nucleotides upstream of the start codon was searched for a conserved RBS motif using the web tool Improbizer (Ao et al., 2004). In 93.7% of all analyzed sequences (2,234 out of 2,385) a conserved RBS motif could be found. The detected consensus motif is A/GGGAGn (Figure 6) with an average distance to the translation start codon of 6.37 nt. The spacer length ranged between 4 and 9 nt.
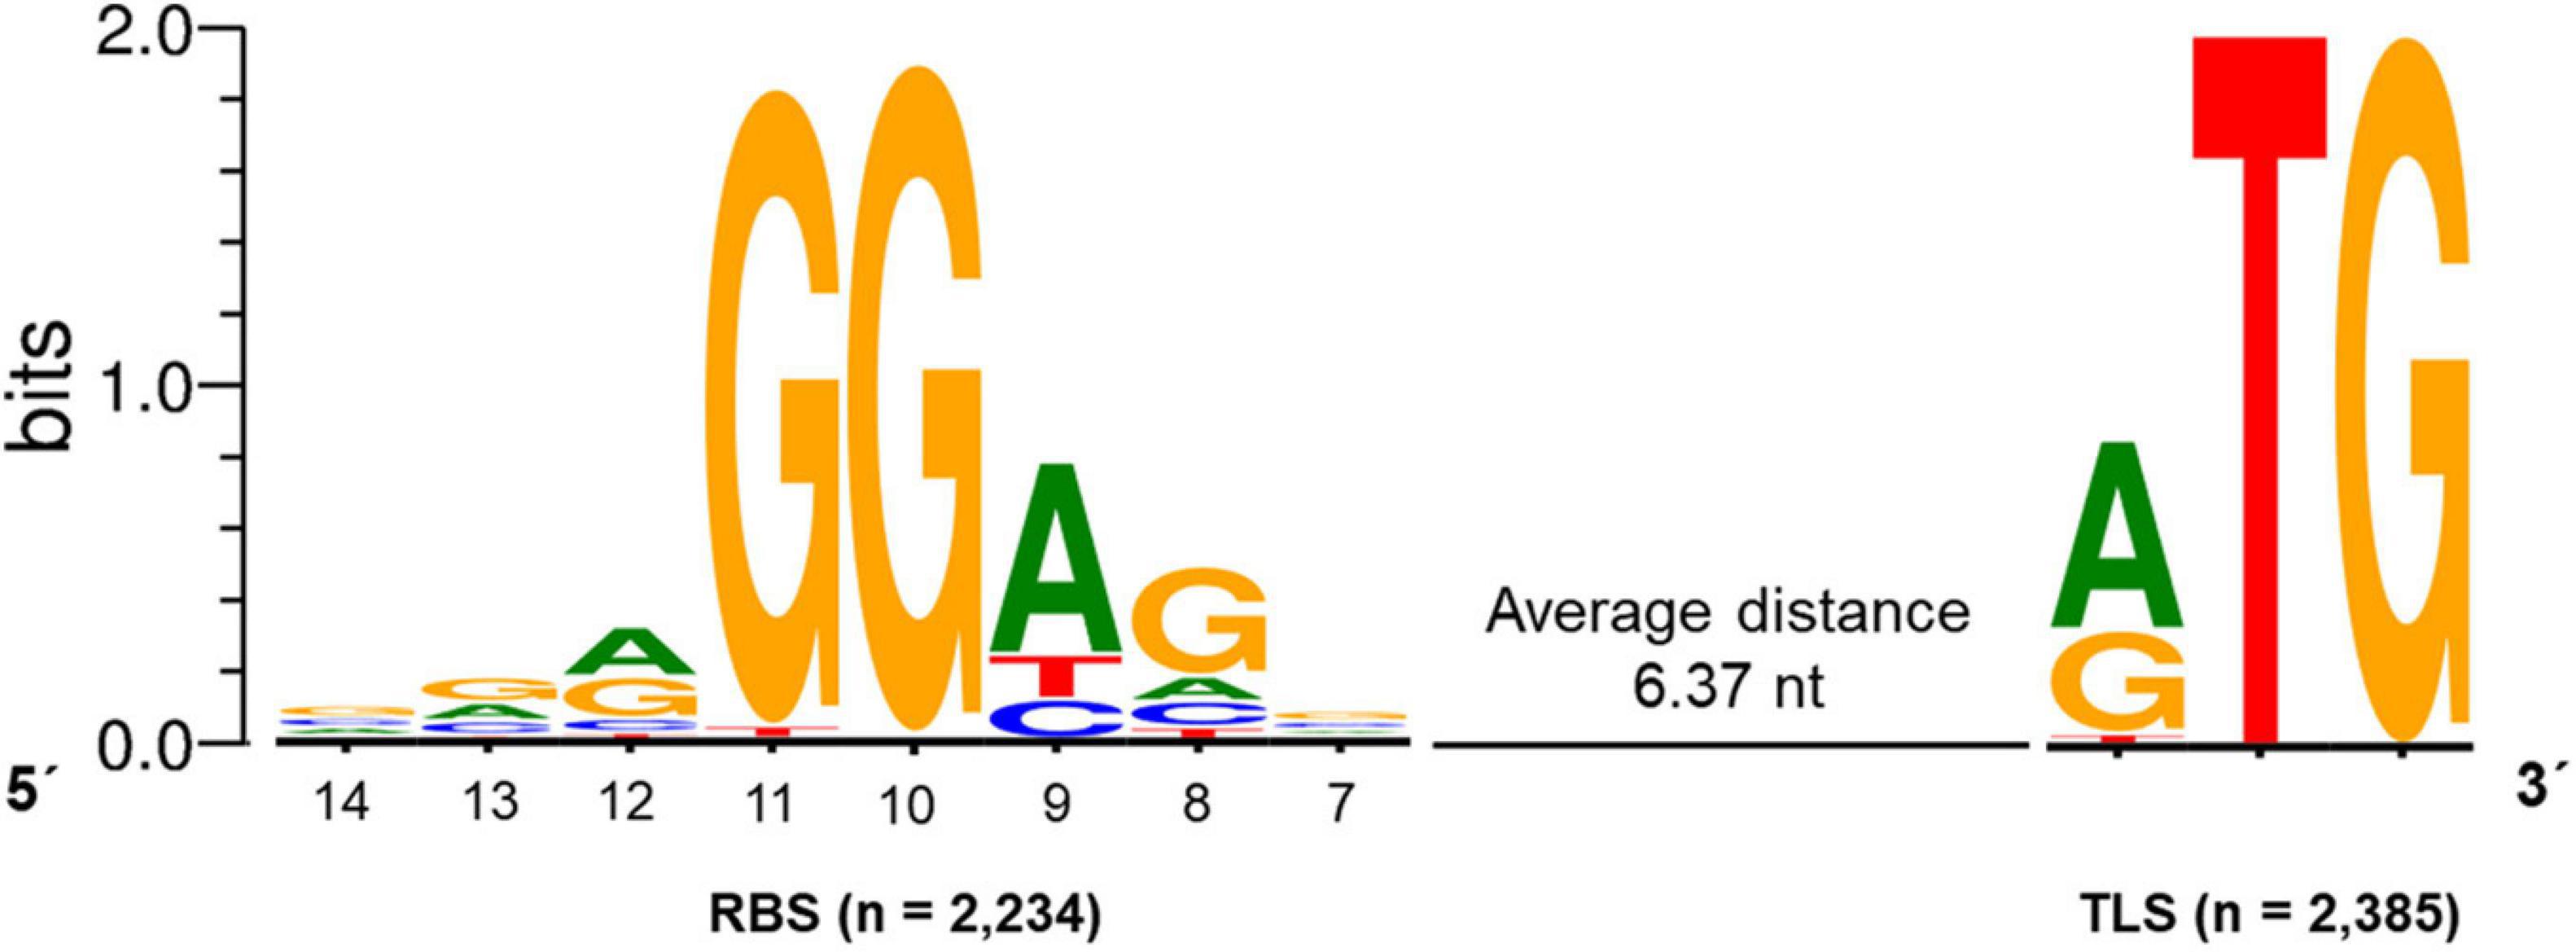
Figure 6. Conserved ribosomal binding site (RBS) motif of Streptomyces lividans TK24. The consensus sequence A/GGGAGn was found in 2,234 sequences upstream of the translation start (TLS) codon identified in 2,385 CDSs with an experimentally determined primary TSSs and a 5′-UTR of 10-150 nt. The average distance between the RBS and the TLS was 6.37 nt. The conserved RBS motif was identified using Improbizer (Ao et al., 2004), the logo was created using WebLogo (Crooks et al., 2004).
The first position of the identified hexamer was determined to be an A or a G (45.1% and 36.5%, respectively). G was commonly found in position 2 and 3 with a frequency of 97.4% and 98.6%, followed by an A in position 4 identified in 70% of the sequences and a G in position 5 found in 64.1% of all analyzed sequences. The sixth position base was not conserved.
The identified motif fits to sequence AGGAGG described in previous studies (Burger et al., 1998) and was found to increase gene expression compared to modified ribosomal binding sites in S. coelicolor A3(2) (Luo et al., 2017). The determined RBS consensus sequence A/GGGAGn partly matches the 3′-end of the 16S rRNA 3′UUUCCUCCA5′ found in the S. lividans TK24 genome.
Furthermore, the motif is very similar to the RBS/Shine-Dalgarno sequence AGGAGG described for E. coli (Shine and Dalgarno, 1974; Omotajo et al., 2015). The spacer length between the RBS and the translation initiation codon is in the range of 5–10 nt, which has been described to be optimal for efficient translation initiation in the Bacteria (Omotajo et al., 2015). The E. coli RBS was found 8-13 nucleotides upstream of the TLS with an average distance of 6.9 (Stormo et al., 1982). The spacer length for the strongest translation efficiency was determined to be 8 nt in E. coli (Ringquist et al., 1992). Here, the spacer length for S. lividans TK24 was found to be 6.37 nt, which is shorter compared to E. coli. This difference could be due to the slightly shorter 16S rRNA in S. lividans TK24 (1,514 nt) compared to E. coli (1,542 nt) (Brimacombe, 1978).
For S. coelicolor A3(2) a conserved polypurine (G > A) region 8-12 bp upstream of the TLS was described, which was found in 2,139 5′-UTR sequences. The spacer length of this identified region ranges between 5–8 nt. (Jeong et al., 2016).
Analysis of 5′-UTRs for Cis-Regulatory Elements
The bioinformatic analysis of the 5′-UTR (leader sequences) of S. lividans TK24 revealed a number of different predicted cis-regulatory elements (Table 3). Using RNA-seq data and the results of the TSS detection analysis, different riboswitches and other cis-regulatory elements were validated and characterized with respect to their transcriptional boundaries.
The validation of those elements was based on characteristic transcription profiles. In many cases of premature transcriptional termination through riboswitches, an increased number of mapped reads in the 5′-UTR compared to the downstream CDS could be observed under suitable conditions (Rosinski-Chupin et al., 2014). The analysis of the 5′-UTRs using the Rfam database revealed 22 different cis-regulatory elements with an E-value of less than 0.01, many of which belong to riboswitches (Table 3). Using the RNA-seq data it could be shown that 21 of the 22 cis-regulatory elements were highly transcribed within in the 5′-UTR of the downstream gene, validated by the identified upstream TSS and the corresponding TLS of the downstream transcribed gene. This strongly suggests that they would regulate these downstream genes.
Riboswitches play an important role in premature transcriptional termination. Specific environmental signals are sensed through small metabolites, which interact with the leader RNA and form alternative terminator or anti-terminator structures (Naville and Gautheret, 2010a; Millman et al., 2017). Alternatively, riboswitches affect the translational initiation through a blockade of the ribosome binding site by forming alternative stem loop structures in this area (Waters and Storz, 2009; Abduljalil, 2018).
For all cis-regulatory elements in Table 3, a biological function could be assigned to the likely affected downstream coding region. These include two cobalamin (vitamin B12) binding riboswitches (RF00174) identified upstream of the cobD, cobQ and cobN genes, which are involved in cobalamin biosynthesis (Nahvi et al., 2004; Peselis and Serganov, 2012) and upstream of genes related to cobalt transport (Fowler et al., 2010).
Furthermore, glycine riboswitches (RF00504) were found upstream of the genes gcvT, gcvH, and gcvP coding for a glycine cleavage system (Mandal et al., 2004). A thiamine (vitamin B1) riboswitch (RF00059) was identified in the 5′-UTR of genes involved in thiamine transport. These riboswitches bind the activated form thiamine pyrophosphate (TPP), an essential coenzyme in prokaryotes (Hohmann and Meacock, 1998; Serganov et al., 2006).
In addition, two different variants of S-adenosylmethionine (SAM)-dependent riboswitches were identified. The first one is a SAM-IV riboswitch (RF00634) upstream of gene SLIV_26975 coding for a cysteine desulfurase (Grundy and Henkin, 1998). The second one is a SAM (S box leader) riboswitch (RF00162), which was found upstream of genes involved in threonine biosynthesis (Serganov and Patel, 2009).
Additionally, a msiK motif (RF01747) regulating genes encoding a sugar uptake system, which has also been described for S. coelicolor A3(2) (Bertram et al., 2004), as well as an actino-pnp RNA (RF01688) in the 5′-UTR of the polynucleotide phosphorylase gene pnp itself (Jarrige et al., 2001) were predicted and validated in the genome of S. lividans TK24.
Finally, six leaders with a ydaO/yuaA riboswitch were predicted in the genome of S. lividans TK24. The ydaO/yuaA riboswitch is also called cyclic di-AMP riboswitch, as it senses the cyclic di-AMP level inside the cell and is therefore related to stress, e.g., DNA damage or cell wall stress (Barrick et al., 2004; Nelson et al., 2013). The genes typically regulated by ydaO/yuaA riboswitches in Actinobacteria are connected to cell wall metabolism (Nelson et al., 2013), like the cell wall peptidase SLIV_17860. Five of the leaders with a ydaO/yuaA riboswitch were shown to be transcribed under the cultivation conditions which were applied in this study. Each of the genes they regulate encodes for secreted proteins, like hydrolases, a transglycosylase and an endopeptidase.
In S. coelicolor the ydaO/yuaA riboswitch was also found upstream of genes encoding cell wall hydrolases, which affect germination, sporulation, and vegetative growth (Haiser et al., 2009). In other Gram-positive species like Bacillus subtilis it was shown, that increasing cyclic di-AMP level leads to transcriptional termination (Nelson et al., 2013), but in S. coelicolor it seems that the riboswitch acts on translation initiation by building a stem-loop structure and blocking the RBS of the downstream hydrolase genes (Haiser et al., 2009; Block et al., 2010). Based on this, the same regulation can be assumed for S. lividans TK24.
The 5′UTR of the genes, which are involved in the biosynthesis and metabolism of amino acids were analyzed for short leader peptides (Table 4). These leader peptides are often enriched in codons for the corresponding amino acids biosynthesized by the enzymes of the downstream operon to form small peptide ORFs and comprise regions with the potential of forming competing hairpins. Attenuators are a regulatory mechanism which is based on the coupling between transcription and translation in which the latter controls the former (Naville and Gautheret, 2010b). Ribosomal stalling or fast sliding over the leader peptide ORF biases the formation either of transcription termination or anti-termination hairpins, that this allows or prevents the transcription of biosynthetic genes that lie downstream (Vitreschak et al., 2004). This way, the cell finely regulates expensive anabolic resources. In the genome of S. lividans TK24, 8 leader peptides were identified with two being leucine-dependent (leuL), two tryptophan-dependent (trpL) and one each depending on alanine (alaL), isoleucine (ilvL), methionine (metL) and threonine (thrL) (Table 4). The two leucine-dependent leader peptides are located upstream of the leuS (leucine-tRNA ligase) and the leuA (2-isopropylmalate synthase) genes. LeuS loads leucine onto the corresponding tRNA. The 12 amino acids long LeuL2 leader peptide contains three leucines (MRAVRLLLSEPR∗). It is transcribed leaderless and is followed by a hairpin structure and a stretch of uridines, which seem to promote Rho-independent transcriptional termination. The 15-residue-long LeuL1 leader peptide contains five leucines (MRFGLLLLSCRGEGL∗). It is transcribed leaderless but lacks a typical Rho-independent transcriptional terminator. This was also described for leader peptides upstream of the leuA gene in other Actinobacteria (Seliverstov et al., 2005; Neshat et al., 2014; Wolf et al., 2017).
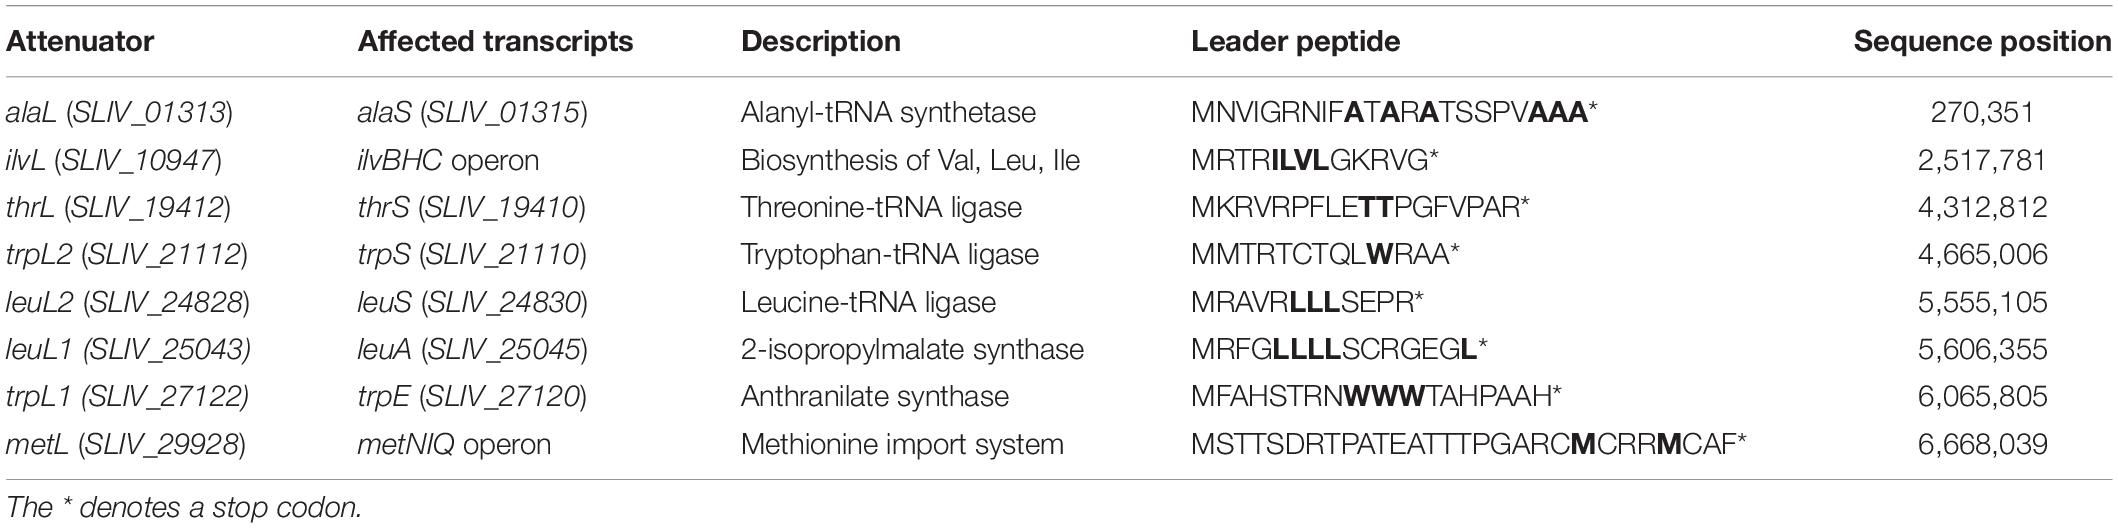
Table 4. Attenuator structures identified through RNA-seq with the affected transcripts and the translated leader peptide with the amino acids initiating the attenuation marked in bold.
The two tryptophan-dependent leader peptides trpL1 and trpL2 are located upstream of the genes trpE (encoding for anthranilate synthase) and trpS (encoding for tryptophan-tRNA ligase). TrpE is involved in an early step of tryptophan biosynthesis. Its leader peptide TrpL1 consists of 18 amino acids including 3 tryptophans (MFAHSTRNWWWTAHPAAH∗), is transcribed leaderless and its transcriptional termination seems to be Rho-independent due to the presence of two hairpin structures and a uridine enriched stretch between trpL1 and the monocistronic trpE gene. However, TrpL2 consists of 13 amino acids including only one tryptophan (MMTRTCTQLWRAA∗). The transcription start is also leaderless, and the termination is induced by two hairpin structures, but no uridine-enriched sequence was found downstream of trpL2.
Trp-dependent leader peptides are found in several bacteria. They are often located upstream of the trp biosynthesis operon (Kolter and Yanofsky, 1982). However, in S. lividans TK24 these two attenuator structures are located upstream of the two monocistronically transcribed genes trpE and trpS.
The AlaL leader peptide is located upstream of the alaS gene encoding an alanyl-tRNA synthetase. This enzyme is responsible for the attachment of the appropriate amino acid onto its tRNA. The leader peptide consists of 22 amino acids including 6 alanines (MNVIGRNIFATARATSSPVAAA∗). This type of leader peptide has not been described in bacteria before.
The attenuator sequence encoding the leader peptide IlvL is located upstream of the operon ilvBHC, which encodes key enzymes in the biosynthesis of the branched-chain amino acids valine, isoleucine, and leucine. The leader peptide with a length of 13 amino acids (MRTRILVLGKRVG∗) is transcribed leaderless and its transcriptional termination seems to be Rho-independent due to several hairpin structures and a uridine-rich sequence region downstream of the ilvL gene. It contains one codon for valine and isoleucine as well as two for leucine. This shows that these amino acids are involved in the regulation of their own biosynthesis as shown in several Actinobacteria (Seliverstov et al., 2005; Neshat et al., 2014; Wolf et al., 2017) and in S. coelicolor A3(2) (Craster et al., 1999).
A further attenuator structure was identified upstream of the gene metN, which is part of the methionine-dependent import system MetNIQ. The leader peptide has a length of 29 amino acids (MSTTSDRTPATEATTTPGARCMCRRMCAF∗) and contains several methionines and threonines. The transcription start of metL is leaderless, and its transcriptional termination is unclear. Whereas there are several hairpin structures downstream of metL, a typical structure of Rho-independent termination is missing.
Finally, a threonine-dependent leader peptide sequence could be identified upstream of the thrS gene encoding a threonine-tRNA ligase. The leader peptide consists of 18 amino acids (MKRVRPFLETTPGFVPAR∗) containing two threonines. The transcription of thrL starts leaderless, whereas its transcriptional termination is not clear, since one hairpin but no uridine rich sequence, necessary for a clear Rho-independent termination (Gusarov and Nudler, 1999), were found downstream of thrL.
Identification of Operon Structures by Combining the 5′-End and the Whole Transcriptome Data Sets
Two or more genes that are transcribed from a single promoter form an operon. Operon detection was performed using the software ReadXplorer2 (Hilker et al., 2016). The data of all six RNA-seq experiments were combined to increase the number of reads in regions with low coverage. The identified primary operons were checked for experimental validation using the TSS. If an operon has an assigned TSS, it is experimentally validated, if not, it was specified as predicted operon. The class of sub-operons consists of operons which show a TSS for a posterior gene in a primary operon. All other genes, which could not be connected to an operon, were assigned to be monocistronically transcribed.
Under the studied conditions 929 primary operons containing 2,274 genes (30.3% of the genome) could be determined by combining the 5′-end and the whole transcriptome data sets (Figure 7).
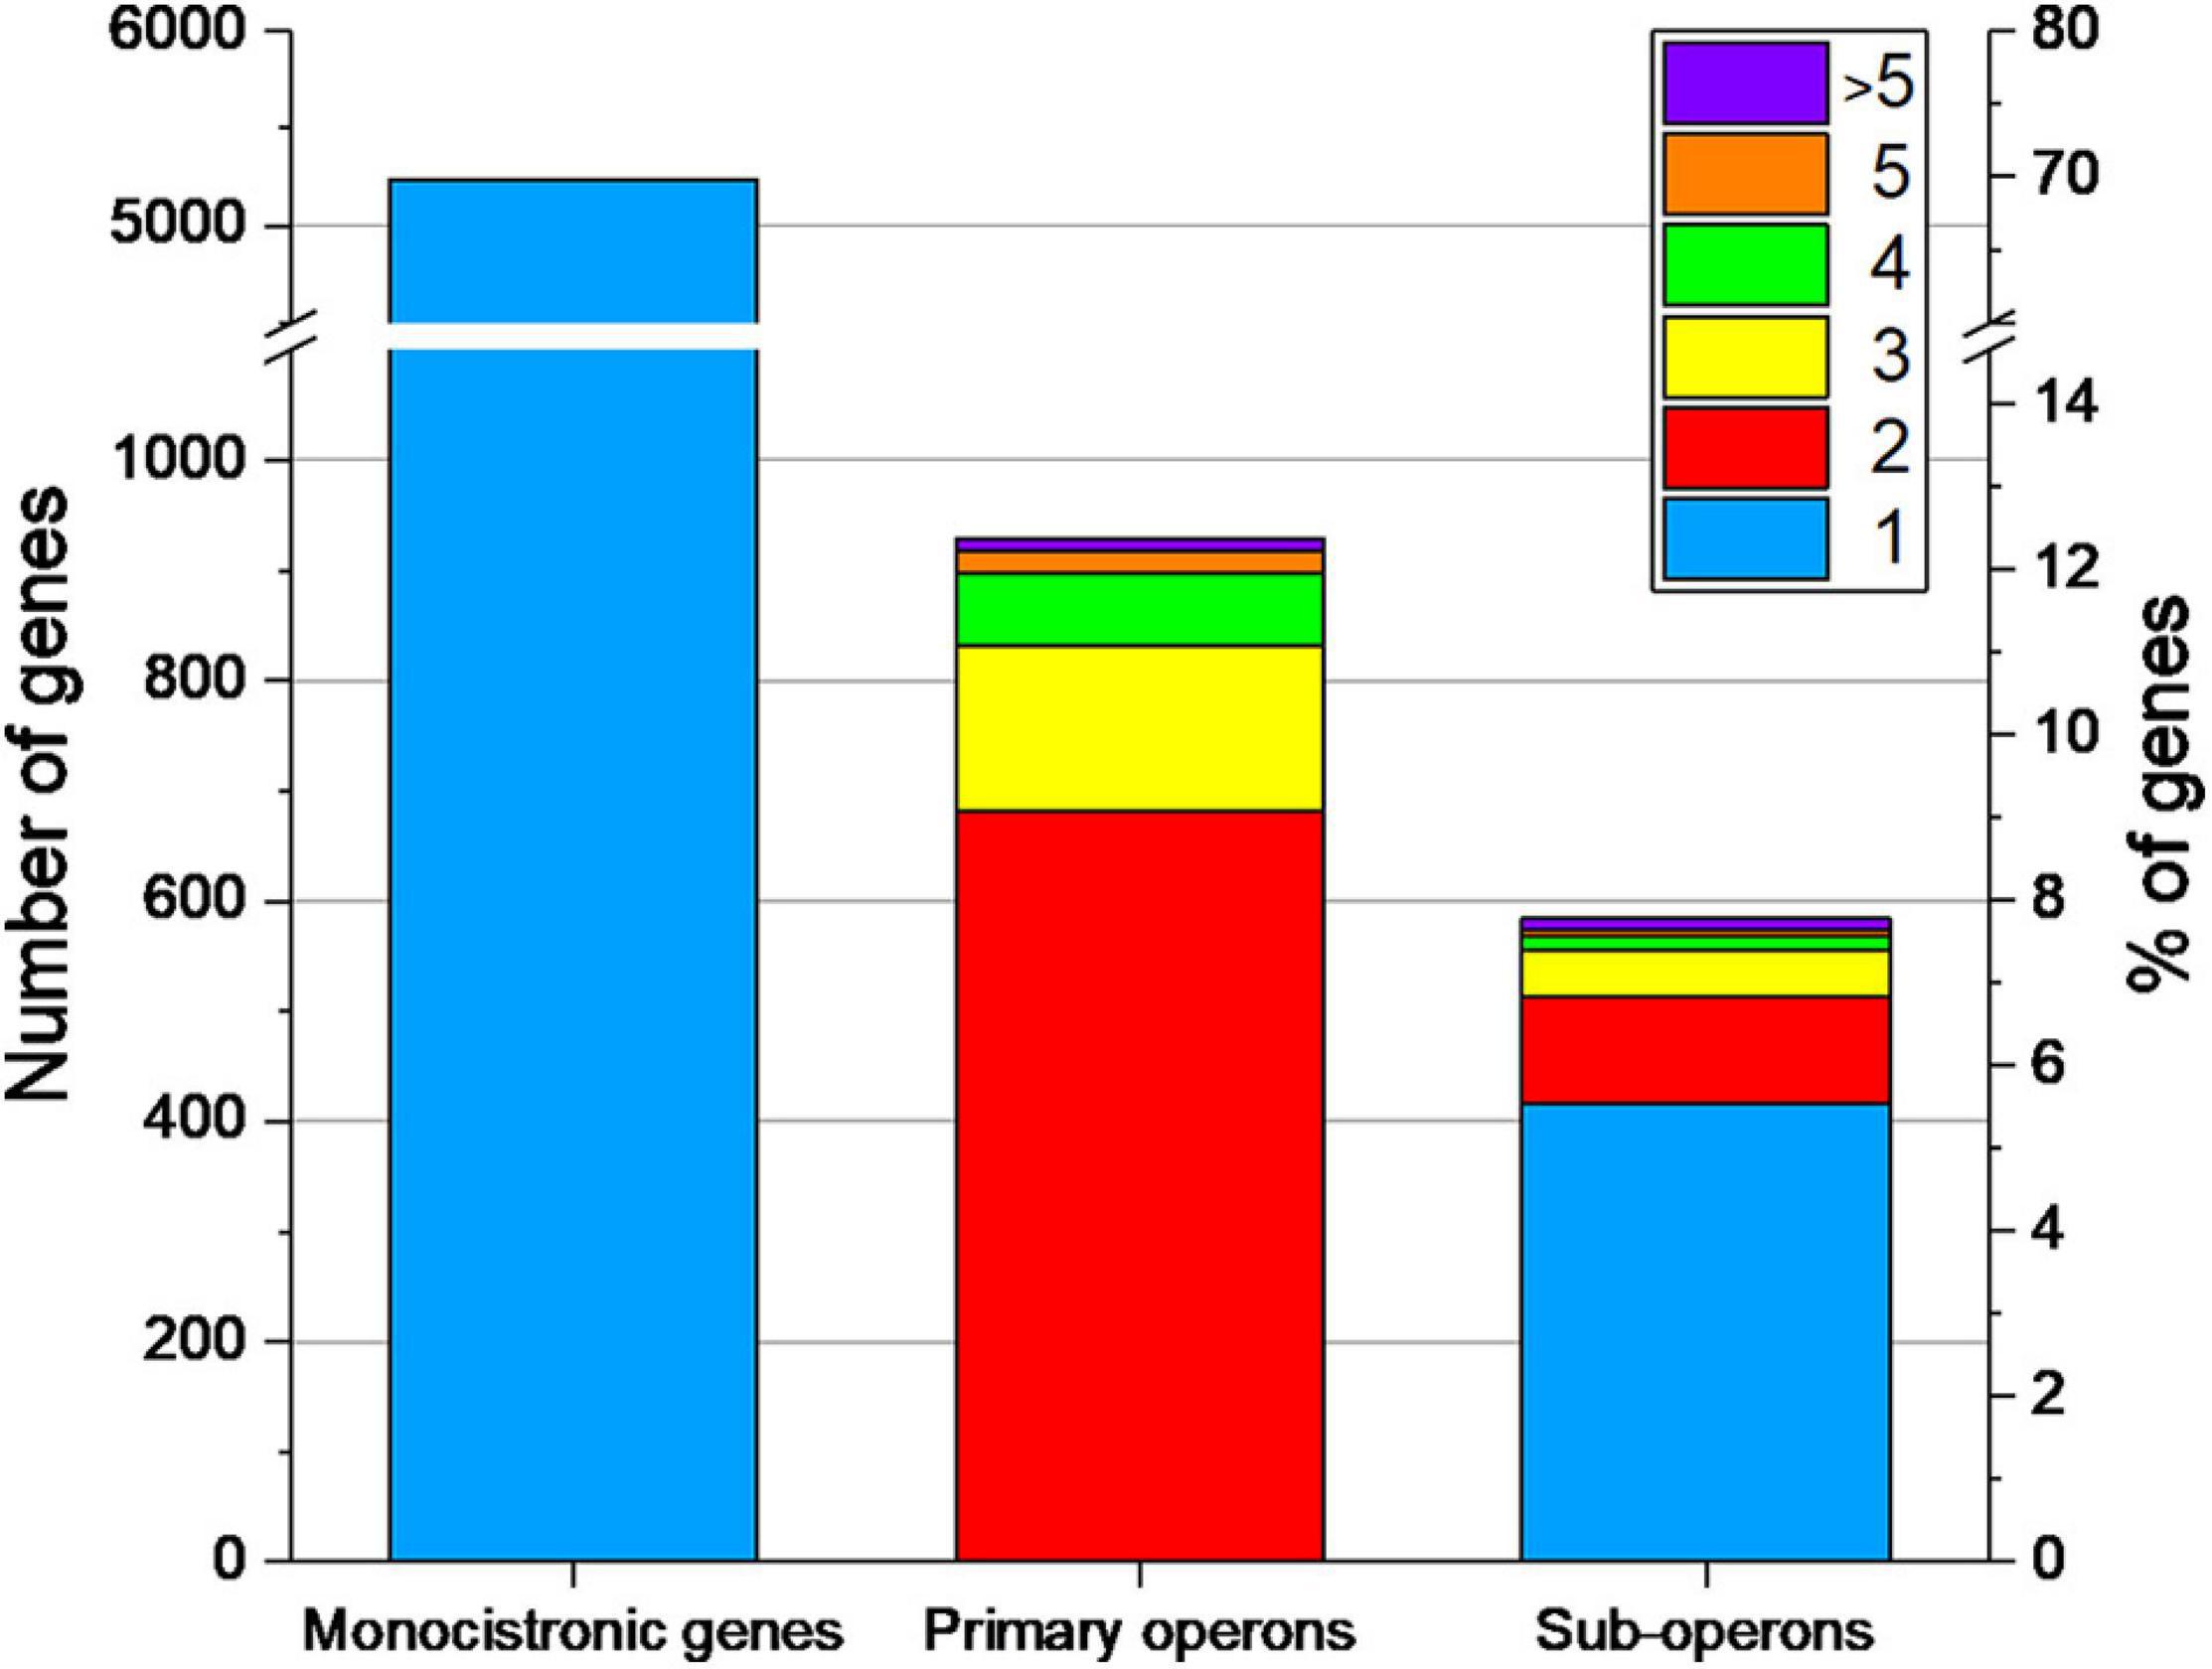
Figure 7. Number of monocistronic genes, and genes located in primary operons or sub-operons of Streptomyces lividans TK24. The number of genes included in primary and sub-operons is color-coded.
Of the primary annotated operons 444 (48%) could be experimentally validated, as a TSS could be assigned to their first gene. By analyzing the internal TSS, 584 sub-operons could be determined inside the 929 primary operons. The majority of the sub-operons consists of a single gene.
The largest primary operon contains 14 genes, which encodes the sub-units of NADH-quinone oxidoreductase, an enzyme responsible for electron shuttling in the respiratory chain (Sousa et al., 2012).
The number of monocistronically transcribed genes was determined to be 5,234 (70.0% of all CDS), of which about a half (2,639 genes) were associated with a TSS in this study.
The Transcriptional Organization of Secondary Metabolite Gene Clusters
Secondary metabolite gene clusters are very common in bacteria, especially in the genus Streptomyces. Many of these metabolites have interesting biological properties and show structural and functional diversity (Osbourn, 2010). Secondary metabolites have been exploited for a long time as antibiotics or anticancer agents in medicine and agriculture (Seca and Pinto, 2018). Due to progress in next-generation sequencing techniques, mining bacterial genomes for the identification of novel gene clusters is a promising approach to find novel compounds of biological and medical importance (Adamek et al., 2017).
For identification of novel biosynthetic gene clusters in the S. lividans TK24 genome, we applied the antiSMASH 5.0 tool (Blin et al., 2019). The analysis revealed 27 potential gene clusters (Table 5), all of which were also identified in the genome of the closely related strain S. coelicolor A3(2) (Bentley et al., 2002). Several of these gene clusters have been described in closely related Streptomyces sp., like the actinorhodin gene cluster (Okamoto et al., 2009) or the prodiginine gene cluster in S. coelicolor A3(2) (Williamson et al., 2006) and the coelimycin (cpk) gene cluster in S. coelicolor M145 (Gomez-Escribano et al., 2012). 26 of the 27 identified gene clusters show expression under one of the tested growth conditions in this study. A polyketide synthase (PKS) type I gene cluster for the potential production of coelimycin was identified but shows only very low expression levels under the different conditions tested. Coelimycin occurs as a yellow pigment but the function of this polyketide is still unclear. Its complex regulation was recently described in S. coelicolor A3(2) (Bednarz et al., 2019). The strongest expression was shown for the siderophore gene cluster, responsible for desferroxamine B production, and the ectoine biosynthetic gene cluster. Desferroxamine is a strong siderophore, which is used in the treatment of iron poisoning. It is mainly produced by Streptomyces pilosus (Chiani et al., 2010). Ectoine is a osmoprotectant which is produced by several bacteria to survive extreme salt concentration. It was found in both Gram-negative and Gram-positive bacteria (Peters et al., 1990). In S. coelicolor A3(2) production of actoine was detected under salt-induced osmotic stress. Ectoine production could be even increased by the addition of ectoine into the medium (Bursy et al., 2008).
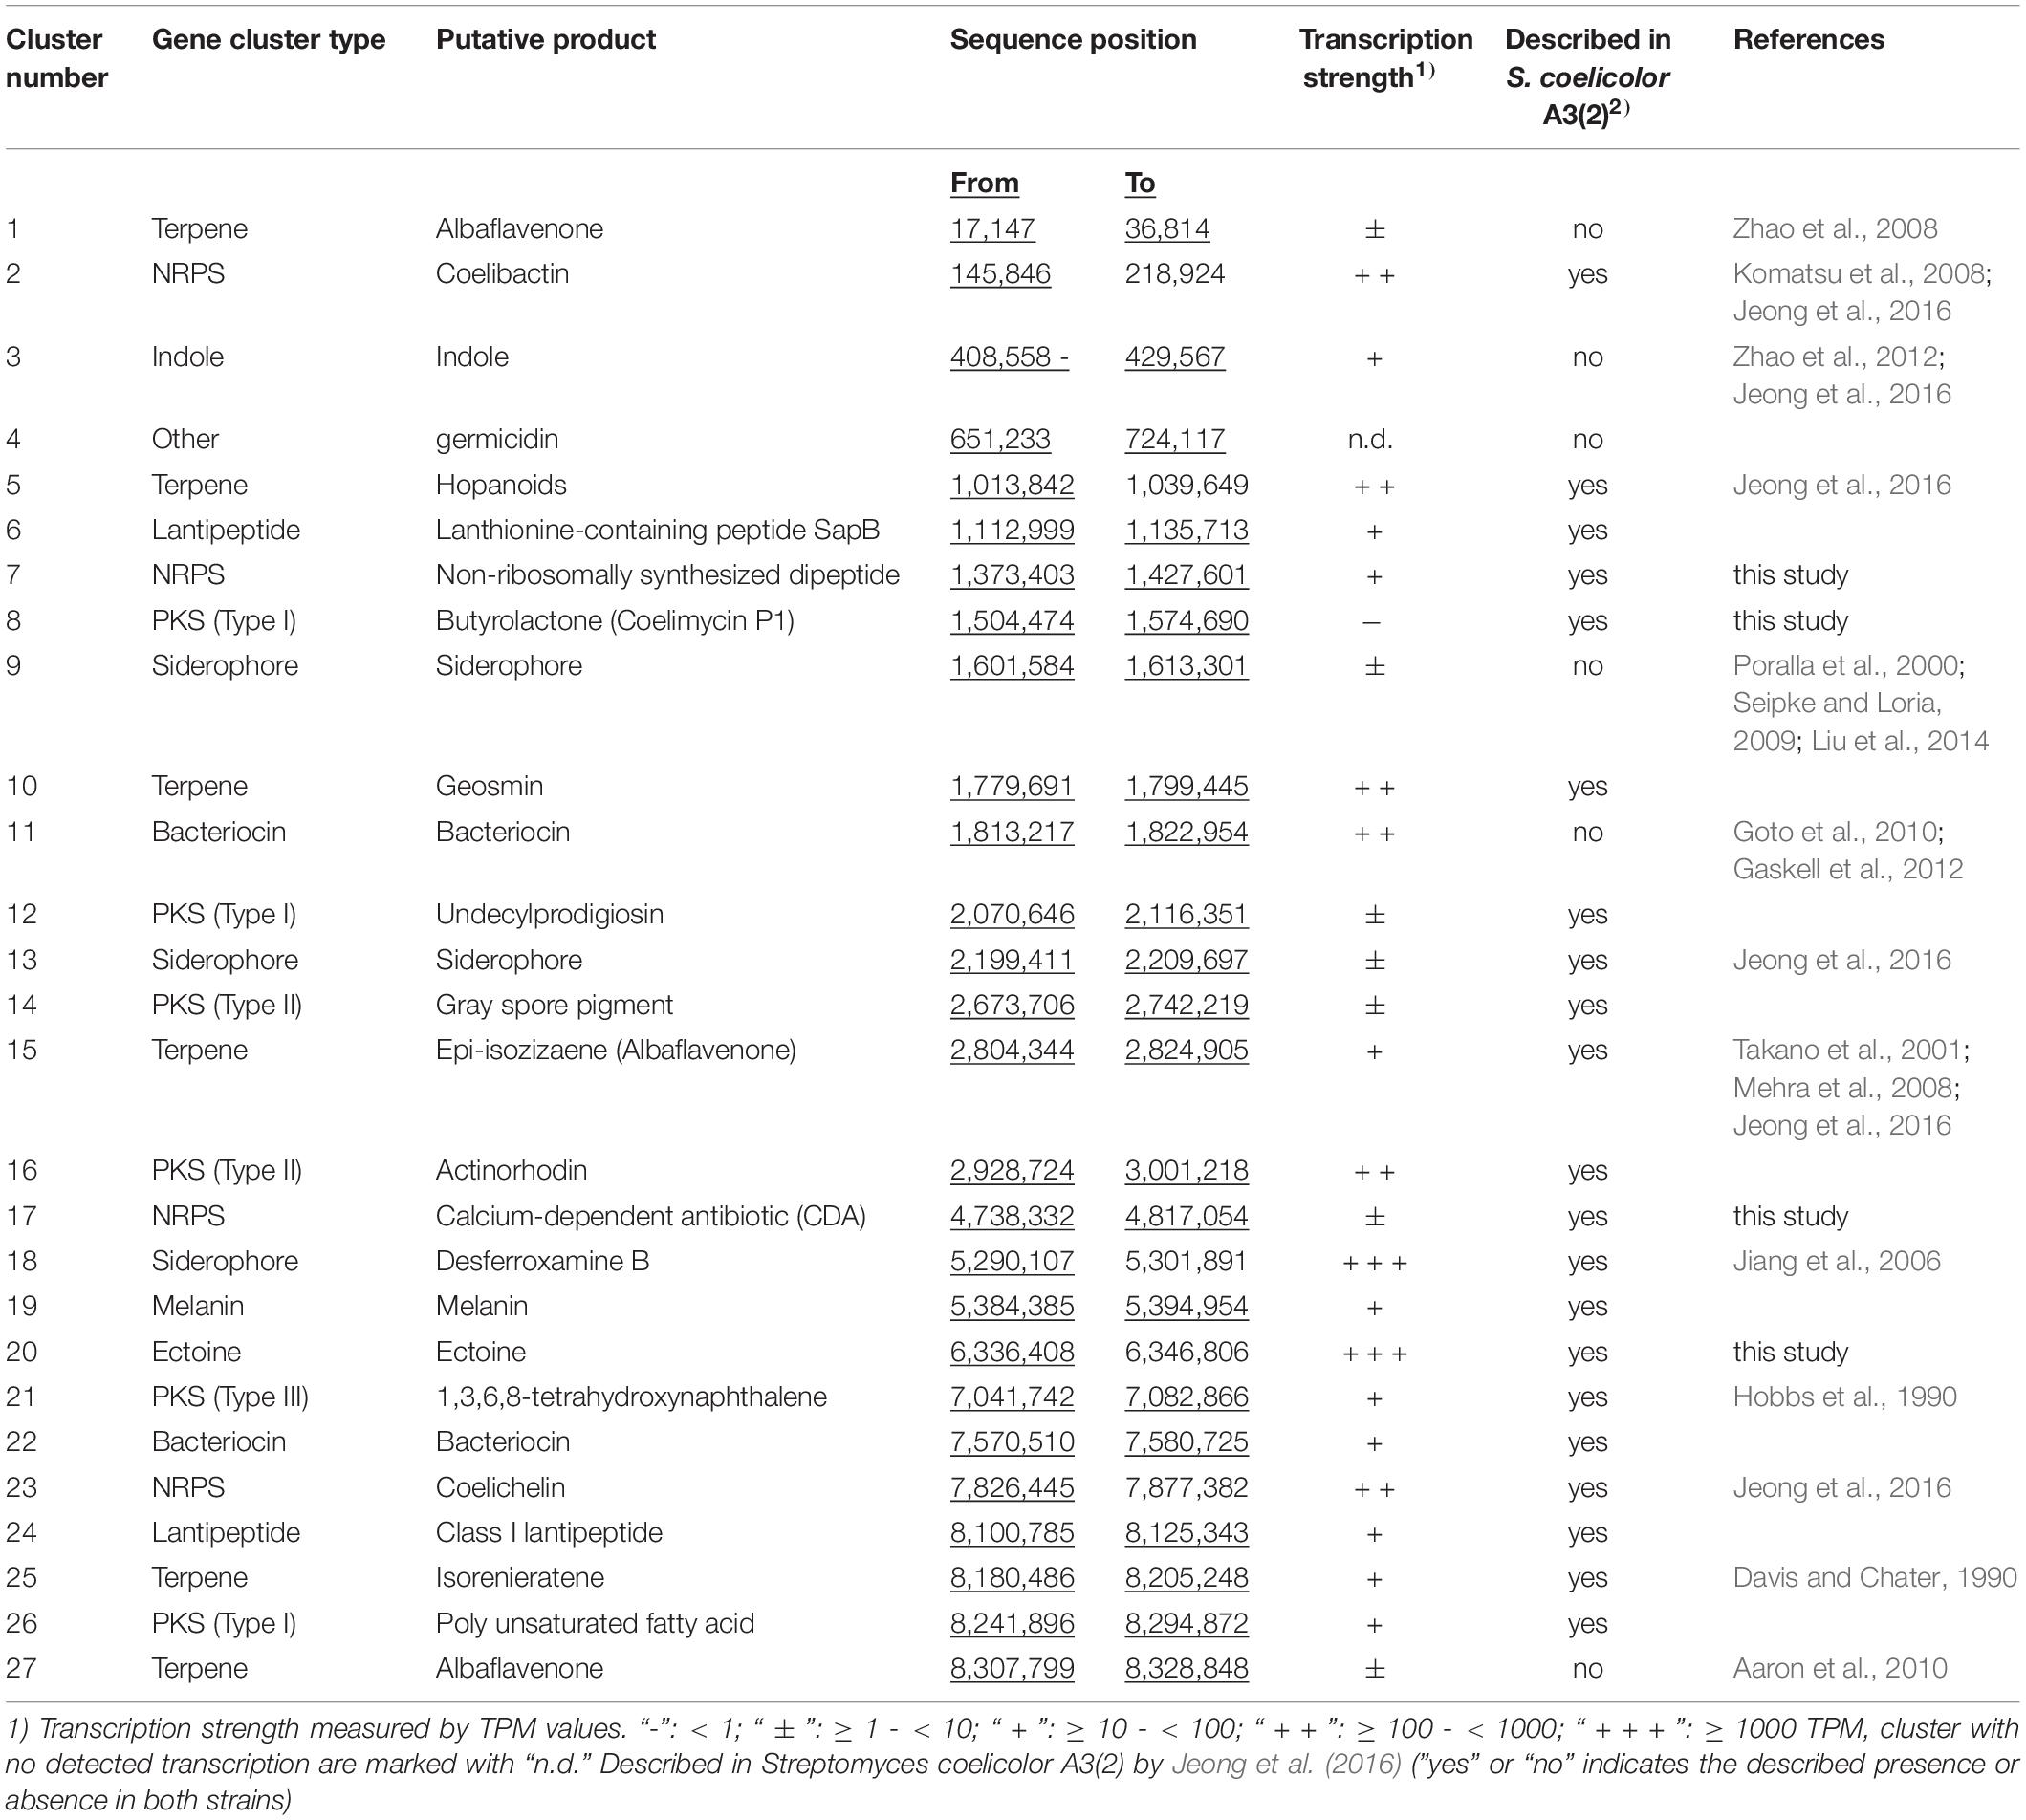
Table 5. Biosynthetic gene clusters predicted in the Streptomyces lividans TK24 genome through antiSMASH 5.0 (Blin et al., 2019) and the transcription of the clusters analyzed by RNA-seq.
The variety of gene clusters (Table 5) in S. lividans TK24 shows that this strain has further potential to be a source of new metabolites of biotechnological relevance.
In addition, we analyzed whether transcription of genes that belong to the core genome of streptomycetes (present in all of 17 analyzed genomes) might be distinct from that of genes restricted to only certain streptomycetes (non-core), including S. lividans TK24. Core genes are predominantly enriched in the middle of the linear genome/chromosome. Transcription of the whole S. lividans TK24 genome over the two cultivation conditions and the three time points was used to identify regions of strong or weak transcription (Figure 8). Stronger transcription appears to correlate with the location of core genes closer to the center. Genes located at the ends of the genome rarely belong to the Streptomycetes core genome and in most cases are less strongly transcribed.
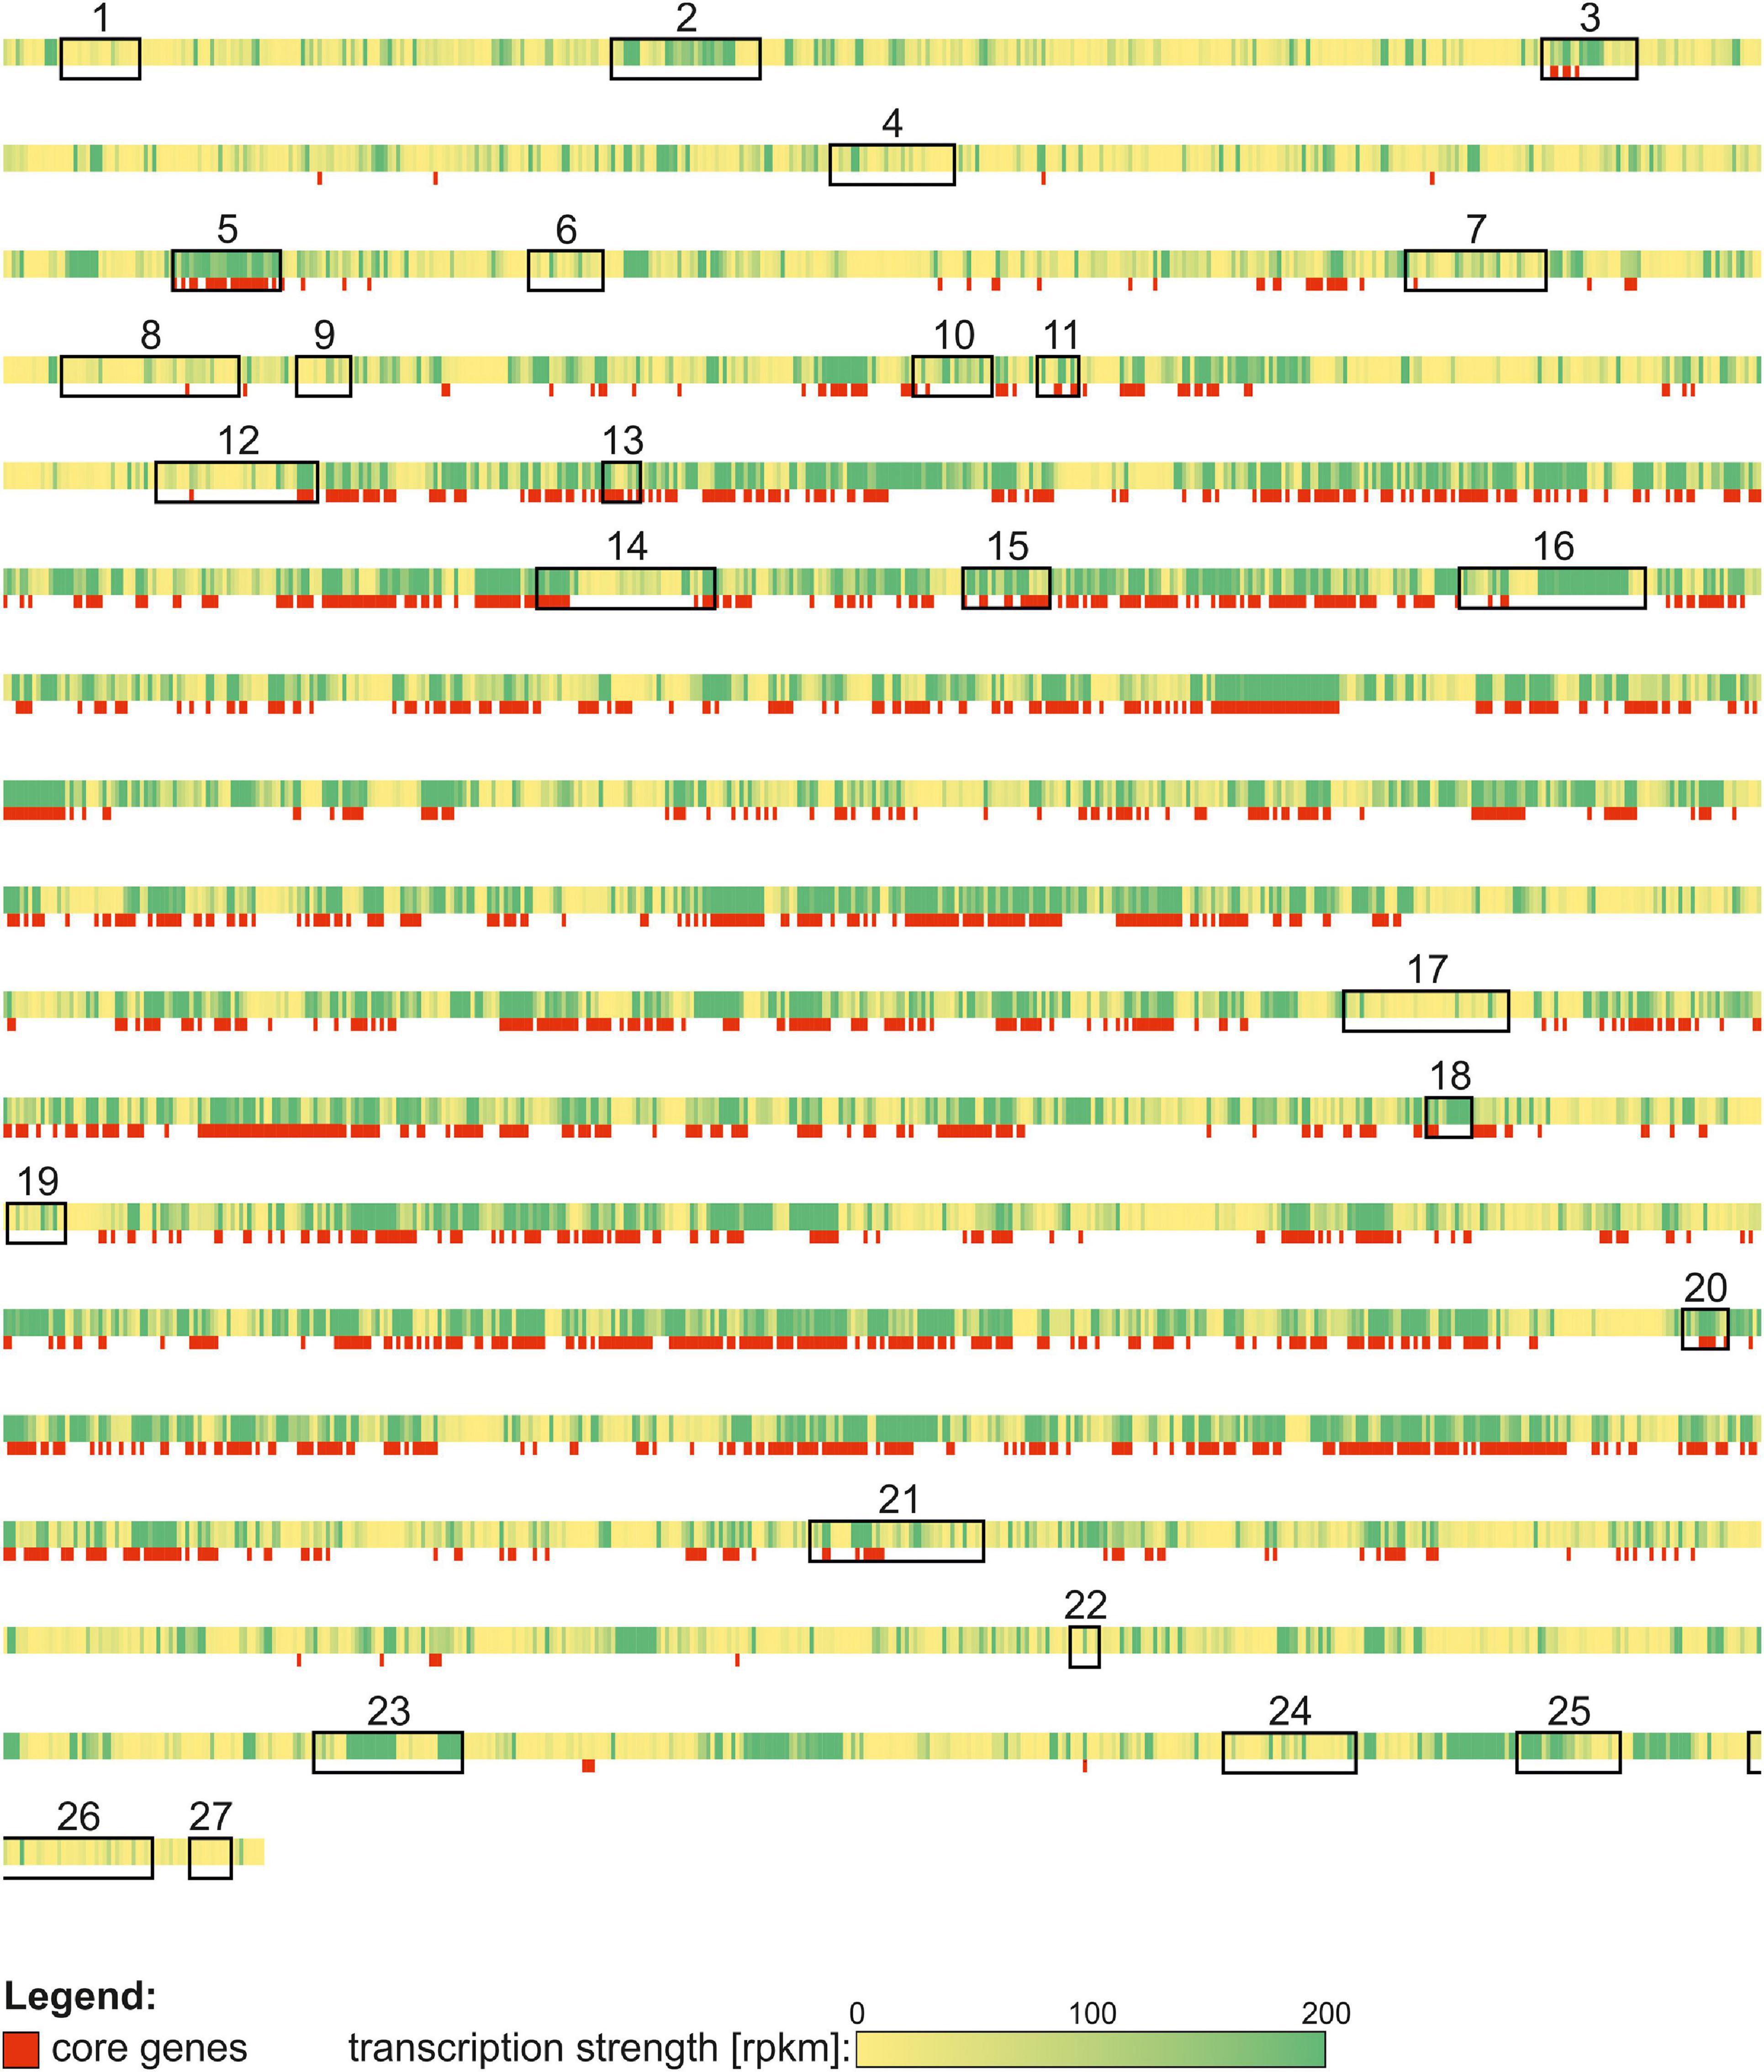
Figure 8. Transcription strength [rpkm] (from yellow to green) and core genes (red) of the Streptomyces lividans TK 24 genome. Secondary metabolite gene clusters are marked with boxes and numbered according to Table 5.
Among the identified gene cluster, 6 clusters were classified as terpene producing gene cluster. The predicted products are albaflavenone (3x), hopanoids, geosmin and isorenieratene. Albaflavenone was sucessfully produced in S. coelicolor A3(2) by Zhao et al. (2008). It functions as an antibiotic for several bacteria by slow down growth. 2-methylisoborneol is a monoterpene which is characterized by its earthy or musty odor. It is produced by several cyanobacteria and actinobacteria and is similar to geosmin. The human nose is very sensitive to these two compunds (Jüttner and Watson, 2007). Hopanoids are triterpenoids which are located in the membrane of several bacteria but also plants and fungi. It was shown that hopanoids are involved in the stability and acid tolerance of the cell membrane. Therefore, it can be assumed that these molecules help cells to adapt to extreme environments (Fischer et al., 2005). Strikingly, hopanoids are not detected in archaea (Belin et al., 2018). The hopanoid producing gene cluster (cluster 5) seems to belong to the core genome of S. lividans TK24 in contrast to all other identified secondary metabolite gene cluster (Figure 8). In Streptomyces scabies, hopanoid biosynthesis genes are expressed but not essential for growth under laboratory conditions (Seipke and Loria, 2009). Isorenieratene is a light harvesting pigment belonging to the class of carotenoids (Damsté et al., 2001), which was found to be involved in anoxygenic photosynthesis by using hydrogen sulfite as a final electron acceptor instead of oxygen (Brocks et al., 2005). Its biosynthesis was observed in cyanobacteria and a few actinomycetes, like Streptomyces griseus (Krügel et al., 1999). The transcriptional regulation was described to be sigB dependent (Lee et al., 2001).
The variety of gene clusters (Table 5) in S. lividans TK24 shows, that this strain has further potential to be a source of new metabolites of biotechnological relevance.
In addition, we analyzed whether transcription of genes that belong to the core genome of streptomycetes (present in all of 17 analyzed genomes) might be distinct from that of genes restricted to only certain streptomycetes (non-core), including S. lividans TK24. Core genes are predominantly enriched in the middle of the linear genome/chromosome. Transcription of the whole S. lividans TK24 genome over the two cultivation conditions and the three time points was used to identify regions of strong or weak transcription (Figure 8). Stronger transcription appears to correlate with the location of core genes in the center of the genome. Genes located at the ends of the genome rarely belong to the Streptomycetes core genome and in most cases are less strongly transcribed except some of the secondary metabolite gene clusters, located at the left or right arm of the genome.
However, two of the secondary metabolite gene clusters seem to be less strongly transcribed under the analyzed conditions, although they are located in the center of the chromosome (e.g., clusters 17 and 19). These two clusters do not contain any core genes and the activation of these clusters is not growth phase dependent. However, cluster 16, encoding genes of the actinorhodin biosynthesis, was strongly transcribed in the stationary phase but does not belong to the streptomycetes core genome. It is a PKS type II gene cluster which consists of 64 genes (SLIV_12785to SLIV_13100). The transcriptional landscape of the actinorhodin gene cluster was compared between different cultivation time points in minimal media containing casamino acids (Figure 9). It is interesting to note that actinorhodin is produced at the onset of the stationary phase of growth. This correlates well with the transcriptional profiles (Figure 9). During normal growth, only few genes of the cluster are transcribed, all of them known as regulatory genes. During transition to stationary phase, however, the whole cluster is strongly transcribed. Actinorhodin is an aromatic polyketide produced by S. coelicolor and S. lividans strains (Magnolo et al., 1991). In S. coelicolor A3(2) it is produced only in the stationary phase (Gramajo et al., 1993). Its biosynthesis is oxygen-dependent (Magnolo et al., 1991) and improved through iron limitation (Coisne et al., 1999). These findings are consistent with the transcription of the actinorhodin biosynthesis genes in S. lividans TK24 observed here (Figure 9).
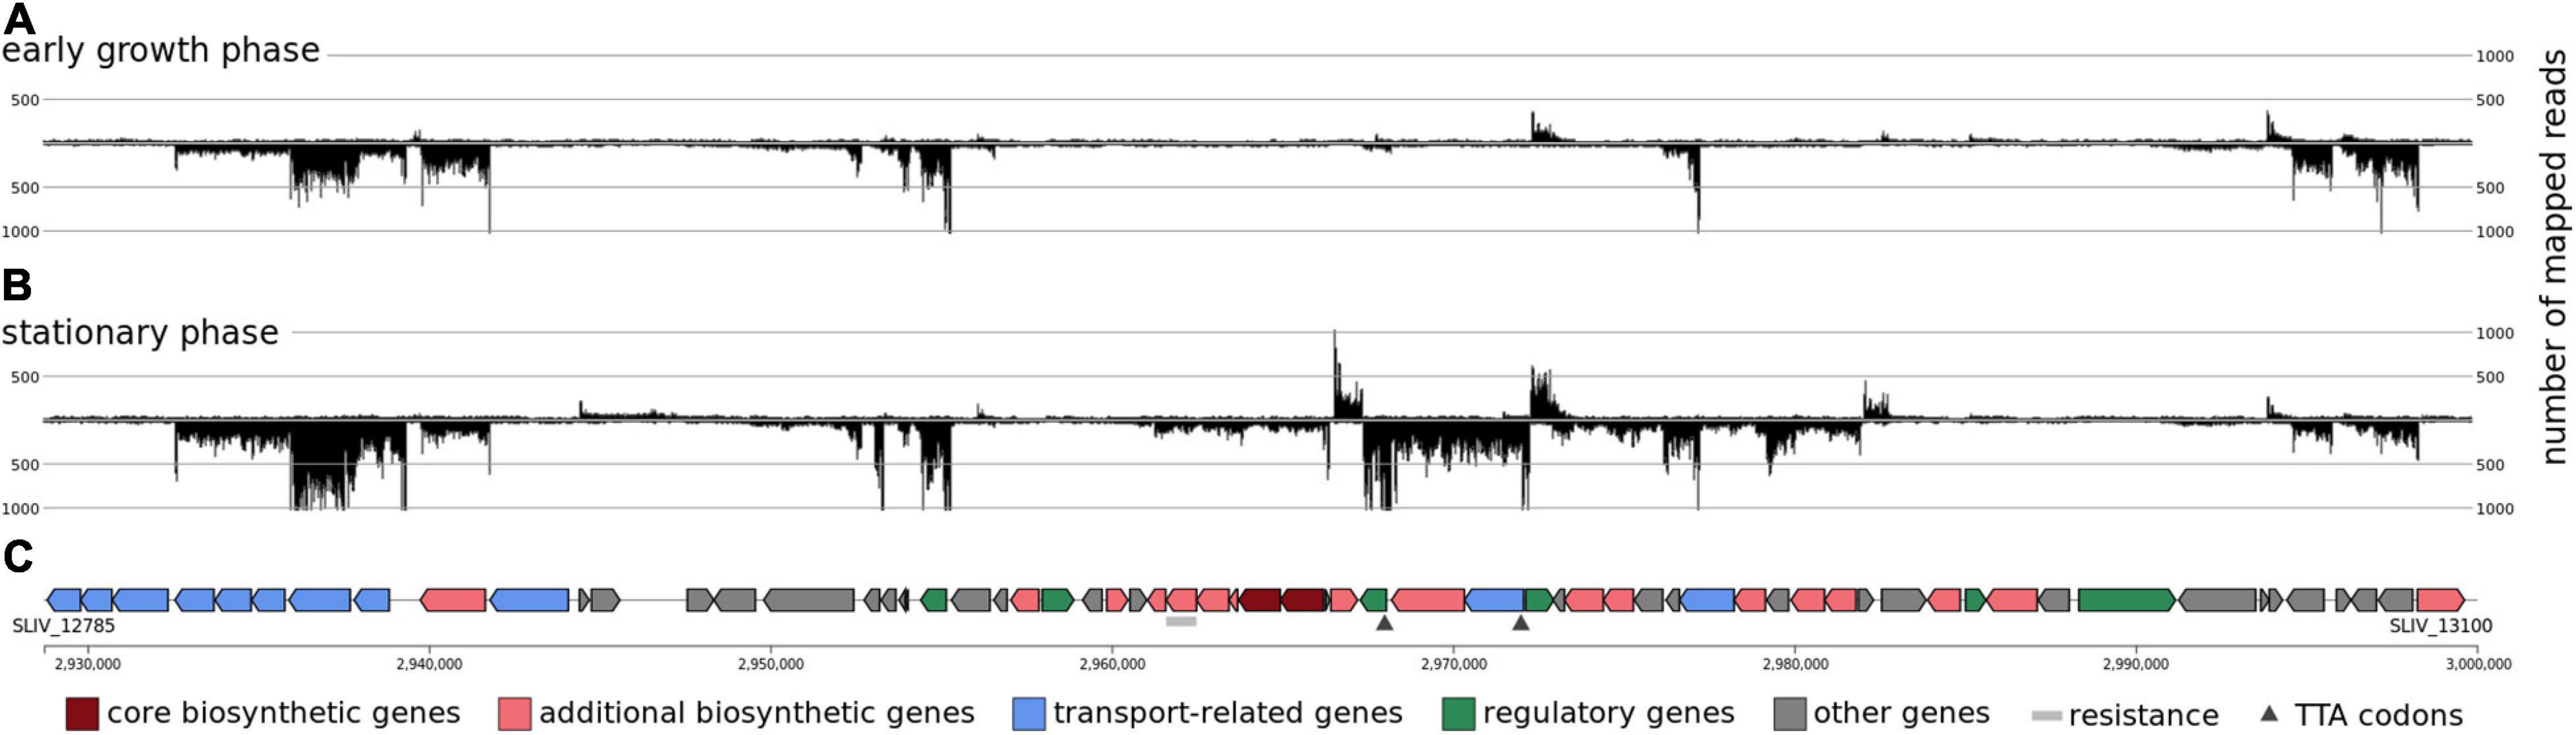
Figure 9. The transcriptional organization of the actinorhodin biosynthetic gene cluster. Screenshot from ReadXplorer 2 (Hilker et al., 2016) depicting gene transcription during early (A) and stationary phase (B) growth phase. (C) denotes the antiSMASH 5.0 (Blin et al., 2019) predictions of the transcribed CDS.
Methods
Cultivation Conditions of S. lividans TK24
Streptomyces lividans TK24 cultivation was carried out in bioreactor cultivations. Bioreactors were inoculated with biomass harvested from a two-step preculture in phage medium (10 g L1 glucose, 5 g L1 tryptone, 5 g L1 yeast extract, 5 g L1 Lab Lemco powder, 0.74 g L1 CaCl2 × 2H2O, 0.5 g L1 MgSO4 x 7H2O, pH: 7.2). A loop of frozen mycelium was transferred to 100 mL phage medium and incubated at 30°C for 72 h under moderate stirring. Next, 25 mL culture was centrifuged, supernatants removed, and the pellet was resuspended in 100 mL fresh medium and incubated for 24 h under the same conditions. This culture was harvested, centrifuged, and washed 3 times in fresh bioreactor medium. A ratio of 25 mL preculture per liter bioreactor volume throughout all experiments was maintained resulting in an average start cell dry weight of 20 mg L1. Experiments for transcriptomics were performed in a BioFlo3000 bioreactor (Eppendorf) filled with 3.5 L medium. Experiments for proteomic analysis were performed in a DASGIP parallel bioreactor system (Eppendorf) filled with 1 L medium. Temperature, agitation, aeration, and pH were set at 30°C, 400 rpm (BioFlo3000)/500 rpm (DASGIP), 120 standard L h1 (0.4% vvm) (BioFlo3000)/60 standard L h1 (1% vvm) (DASGIP) and 6.8, respectively. pH control was done by the addition of 1M KOH or 1M H2SO4 into BioFlo3000 vessels and 4M KOH or 2M H2SO4 to DASGIP vessels. 1 mL antifoam Y-30 emulsion (Sigma-Aldrich) was added to avoid formation foam. Bioreactor experiments are performed in minimal medium (10 g L1 glucose, 3 g L1 (NH4)2SO4, 2.6 g L1 K2HPO4, 1.8 g L1 NaH2PO4, 0.6 g L1 MgSO4 x 7H2O, 1 mg L1 ZnSO4 x 7H2O, 1 mg L1 FeSO4 x 7H2O, 1 mg L1 CaCl2, 1 mg L1 MnCl2 x 4H2O) and minimal medium supplemented with casamino acids (5 g.L-1 Casamino Acids Technical). Mid-log, late-lag and stationary phase samples were taken. For transcriptomic analysis, 8 × 1 mL samples per time point were centrifuged at 21,000 × g for 30 s, supernatant was removed, and pellets were snapfrozen in liquid nitrogen. For proteomic analysis, samples of 10 mL were centrifuged at 3220 × g for 10 min, supernatant was transferred and filtrated over 0.2 PES membrane, pellet and supernatant were snapfrozen in liquid nitrogen. All samples were stored at −80°C upon further analysis.
Total RNA Isolation and Sequencing of cDNA Libraries Made From mRNA
RNA was isolated using a Qiagen RNeasy mini kit in combination with an RNase-free DNase kit (Qiagen, Hilden, Germany). Absence of DNA was assayed by PCR with primers binding to genomic S. lividans TK24 DNA. RNA quantity as well as quality were checked with the Trinean Xpose system (Gentbrugge, Belgium) and an Agilent RNA 6000 Pico kit run on an Agilent Bioanalyzer 2100 (Agilent Technologies, Böblingen, Germany). RNA was isolated from S. lividans TK24 fermenter cultures grown in minimal media with and without casamino acids. Of each cultivation condition, RNA was isolated from early and late growth phase as well as from stationary phase.
Two different cDNA libraries were prepared from the RNA samples. The RNAs for the sequencing of 5′-ends of primary transcripts were pooled prior to library construction whereas the RNAs for whole transcriptome libraries were handled separately. Prior to library construction stable RNA was depleted by using the Ribo-Zero kit (Epicentre, Madison, WI, United States). The manufacturer’s instructions were adjusted due to the high G + C content of S. lividans TK24 and the potentially resulting secondary structures of the transcripts. Therefore, the incubation temperature of the probe hybridization samples with magnetic beads was elevated from 50°C to 65°C. Successful rRNA depletion was checked by an Agilent RNA 6000 Pico kit run on an Agilent Bioanalyzer 2100 (Agilent Technologies, Böblingen, Germany). The protocol for the 5′-end library was conducted as described previously (Pfeifer-Sancar et al., 2013) with the modifications according to (Irla et al., 2015). The resulting 5′-enriched cDNA libraries were sequenced on the MiSeq system (Illumina, San Diego, CA, United States). The whole transcriptome library was prepared essentially according to the standard protocol of the TruSeq Stranded mRNA Library Prep Kit (Illumina, San Diego, CA, United States) but omitting the polyA-purification step. Both cDNA libraries were sequenced using TruSeq kits (Illumina, San Diego, CA, United States). The 5′-enriched library was sequenced on a MiSeq system (Illumina, San Diego, CA, United States) in single read (75 nt) mode. The whole transcriptome library was sequenced on a HiSeq 1500 sequencer (Illumina, San Diego, CA, United States) in paired end mode (2 × 75 nt).
Read Mapping and Determination of Transcription Start Sites
After Illumina base-calling and demultiplexing with Illumina bcl2fastq2 Conversion Software v2.19.1trimming was performed with the software Trimmomatic v0.33 (Bolger et al., 2014) and mapping with Bowtie v2.2.7 (Langmead and Salzberg, 2012) with standard parameters except for increased pair size (-X 600) for the whole transcriptome data set. For the 5′-end enriched library reads were trimmed to 25 bp and for the whole transcriptome library paired-end reads were quality trimmed only. Both were mapped to the already published genome sequence of S. lividans TK24 (Rückert et al., 2015) with a minimum read length of 20 nt.
For examination and visualization of the RNA-seq data, the software ReadXplorer 2 (Hilker et al., 2016) was used. The tools included in ReadXplorer 2 were used for TSS and operon prediction as well as for the identification of novel transcripts. The automatic classification of intragenic TSS was used to examine potential changes of incorrectly predicted translation start sites. Initially, putative TSS were automatically predicted with a minimum of 10 read starts and a coverage increase from −1 to + 1 of 1000%. The maximal distance of the putative TSS to the next TLS was set to 500 nt. The described settings were empirically established with a random set of TSS and resulted in good signal to noise ratio as well as specificity (data not shown). To detect low abundance transcripts and their corresponding TSS the low coverage setting of min. 10 read starts and a coverage increase of 100% was chosen. All predicted TSS were manually reviewed to exclude false positive results. TSS with inconclusive or indistinct read stacks were discarded, which often applies to highly transcribed regions downstream of a primary TSS. Coding sequences were automatically predicted as transcribed polycistronically, if at least five reads of the whole transcriptome data set bridged the intergenic regions of the genes.
Putative translation start site (TLS) alterations were called automatically by ReadXplorer 2 and the described TSS prediction tools, if an intragenic TSS, as well as an in-frame start codon (ATG, GTG, TTG) downstream of this TSS, was identified. For this, the first 25% of the nucleotides of every CDS were analyzed. The TLS was only altered, if read starts were also manually identified in the whole transcriptome track and no reads in this track were mapped to the originally predicted TLS. A further condition was that no additional TSS upstream of the intragenic TSS was identified. As a further control step, the conservation of the TLS for the corresponding CDS was verified by BLASTX (Altschul et al., 1997) using standard NCBI parameters.
Proteomics Experimental Design and Statistical Rationale
For the proteomic characterization of S. lividans TK24 secretome 6 to 8 biological repeats were prepared for each experimental condition. Raw MS files from the mass spectrometer were analyzed by MaxQuant v1.5.3.30, a quantitative proteomics software package designed for analyzing large mass spectrometric data sets (Cox and Mann, 2008). MS/MS spectra were searched against the re-annotated S. lividans TK24 proteome (Rückert et al., 2015) (7505 proteins) and common contaminants, using the Andromeda search engine (Cox et al., 2011). Enzyme specificity was set to trypsin, allowing for a maximum of two missed cleavages. Dynamic (methionine oxidation and N-terminal acetylation) and fixed (S-Carbamidomethylation of cysteinyl residues) modifications were selected. Precursor ion mass tolerance was set to 20 ppm and fragment ion tolerance to 20 ppm for Orbitrap QE or 0.5 Da for Orbitrap Elite. Protein and peptide False Discovery Rate (FDR) were set to 1%. Peptide features were aligned between different runs and masses were matched (“match between runs” feature), with a match time window of 2 min and a mass alignment window of 20 min. Label-free, relative protein quantification was performed using the iBAQ algorithm through the MaxQuant software (Cox and Mann, 2008; Schwanhäusser et al., 2011).
Data analysis (filtering, transformation, and statistical analysis) was performed using custom scripts in R language (R Core Team, 2017). Functional characterization of the detected proteins was performed based on the manually annotated proteome of S. lividans obtained from SToPSdb2 (Tsolis et al., 2018).
LC-MS/MS Analysis
Lyophilized peptide samples were first dissolved in an aqueous solution containing 0.1% v/v formic acid (FA) and 5% v/v ACN and were analyzed using nano-Reverse Phase LC coupled to a Q ExactiveTM Hybrid Quadrupole - Orbitrap or Orbitrap Elite Hybrid Iontrap - Orbitrap mass spectrometer (Thermo Scientific, Bremen, Germany) through a nanoelectrospray ion source (Thermo Scientific, Bremen, Germany). Peptides were initially separated using a Dionex UltiMate 3000 UHPLC or a Thermo EASY-nLCTM -1200 system on an EasySpray C18 column (Thermo Scientific, OD 360 μm, ID 50 μm, 15 cm length, C18 resin, 2 μm bead size) at a nanoLC flow rate of 300 nL min–1. The LC mobile phase consisted of two different buffer solutions, an aqueous solution containing 0.1% v/v FA (Buffer A) and an aqueous solution containing 0.1% v/v FA and 80% v/v ACN (Buffer B). A 60 min gradient was used from Buffer A to Buffer B (percentages from each in parentheses below) as follows: 0–3 min constant (96:4), 3–35 min (65:35); 35–40 min (35:65); 40–41 min (5:95); 41–50 min (5:95); 50–51 min (95:5); 51–60 min (95:5). Peptides were analyzed in the Orbitrap QE or an Orbitrap Elite as separate complete experimental datasets. Orbitrap QE operated in positive ion mode (nanospray voltage 1.6 kV, source temperature 250°C), in data-dependent acquisition (DDA) mode with a survey MS scan at a resolution of 70,000 FWHM for the mass range of 400-1,600 m/z for precursor ions, followed by MS/MS scans of the top 10 most intense peaks with + 2, + 3, and + 4 charged ions above a threshold ion count of 16,000 at a resolution of 35,000 FWHM. Orbitrap Elite was operated in positive ion mode (nanospray voltage 1.8 kV, source temperature 275°C), in DDA mode with a survey scan at a resolution of 240,000 FWHM for a mass range of 375-1500 m/z for precursor ions, followed by MS/MS scans of the 20 most intense peaks with charge + 2 or higher, above a threshold count of 500 at a resolution of 17,000 FWHM. MS/MS in Orbitrap QE was performed using normalized collision energy (NCE) of 25% with an isolation window of 3.0 m/z, an apex trigger 5–15 s and a dynamic exclusion of 10 s. In Orbitrap Elite, MS/MS collisional induced dissociation (CID) was performed using 35% NCE with an isolation window of 2.0 m/z, and a dynamic exclusion list of 30 s. Data were acquired with Xcalibur 2.2 software (Thermo Scientific).
Additional Software Tools
Re-Annotation
As a basis, the original annotation (Rückert et al., 2015) done with the prokka pipeline (Seemann, 2014) was used and compared to the automated annotation provided by RefSeq as well as to the S. coelicolor A3(2) genome (AL645882), using EDGAR (Blom et al., 2009). Additional CDS and differences in the translation start sites were manually compared and resolved in GenDB (Meyer et al., 2003) using the transcriptome and proteome data obtained in this study (see above). For tRNA detection the tool tRNAscan-SE 1.21 (Schattner et al., 2005) and ARAGORN (Laslett and Canback, 2004) as part of the prokka pipeline (Seemann, 2014) were used with standard parameters. Possible protein coding regions in novel transcripts were examined through BLASTX (Altschul et al., 1997). ARNold (Naville et al., 2011) was applied to find transcriptional terminators. The software package Infernal (Nawrocki and Eddy, 2013) with Rfam as a database (Nawrocki et al., 2015) was used with an E-value cut-off of 0.01 and standard parameters otherwise.
antiSMASH 5.0 (Blin et al., 2019) was used for the prediction of biosynthetic gene clusters. Promoter motif prediction was carried out using the tool Improbizer (Ao et al., 2004). Therefore, 80 nt upstream of all annotated TSS were used as input for Improbizer. For the prediction of the core genome, EGDAR (Blom et al., 2009) was used with the following Streptomyces genomes besides that of S. lividans TK24: S. coelicolor A3(2) (AL645882), S. avermitilis MA-4680 (BA000030), S. cattleya DSM 46488 (CP003219), S. collinus Tu 365 (CP006259), S. davawensis JCM 4913 (HE971709), S. pratensis ATCC 33331 (CP002475), S. fulvissimus DSM 40593 (CP005080), S. griseus subsp. griseus NBRC 13350 (AP009493), S. hygroscopicus subsp. jinggangensis 5008 (CP003275), S. rimosus subsp. rimosus ATCC 10970 (ANSJ00000000), S. scabiei 87.22 (FN554889), Streptomyces sp. PAMC26508 (CP003990), Streptomyces sp. SirexAA-E (CP002993), S. venezuelae ATCC 10712 (FR845719), S. violaceusniger Tu 4113 (CP002994), and S. albidoflavus (CP004370).
Conclusion
In this study, the genome annotation of S. lividans TK24 was noticeably improved by the use of transcriptome and proteome data. The detailed analyses presented here provide a basis for future studies to the scientific community working on Streptomyces and highlight the importance of a high quality genome and up to date annotation. An accurate genome annotation is the basis for subsequent research regarding biochemical pathways or biotechnological optimization and use of this strain. It is needed for genetic engineering as well as omics-based experiments.
The identification of transcription start sites, promoter elements and the analysis of the operon structure is very important for a better understanding of transcriptional regulation in S. lividans TK24 as a model organism for several Streptomyces spp. Several regulatory elements, like riboswitches or antisense RNAs were described, which could help to understand the regulation of single pathways.
The identification of secondary metabolite gene clusters and the transcriptional organization of these clusters play an important role for the identification of novel biotechnological products. Furthermore, the up to date identification of gene clusters and genomic regions, which seem to be not transcribed, could point out targets for genome reduction and therefore decrease metabolic burden during the production of industrial relevant products.
Data Availability Statement
The datasets presented in this study can be found in online repositories. All RNAseq data is available via the SRA project SRP144344. The updated genome is accessible via GenBank accession CP009124. All proteomic data is available via PRIDE projects PXD009675, PXD006819, and PXD006818.
Author Contributions
AE designed, planned, and interpreted the experimental work of this study and supervised the proteomics work. KB carried out bacterial fermentation. TB carried out the transcriptomic experiments. KS and MH carried out analysis of the proteomic experiments. JD carried out all analyses of the transcriptomic data and drafted the manuscript. JA, JK, TB, AE, and CR assisted in interpreting the data and revised the manuscript. JK and TB coordinated this study. All authors read and approved the final manuscript.
Funding
We acknowledge support for the publication costs by the Deutsche Forschungsgemeinschaft (DFG) and the Open Access Publication Fund of Bielefeld University. JD acknowledge support from the CLIB-Graduate Cluster Industrial Biotechnology at Bielefeld University, Germany, which is supported by the Ministry of Innovation, Science and Research (MIWF) of the federal state North Rhine-Westphalia, Germany and Bielefeld University, Germany. This work was supported by the EU (FP7 KBBE.2013.3.6-02: Synthetic Biology toward applications; #613877 StrepSynth; to KB, JA, AE, and JK). MH is an Egyptian government doctoral scholar.
Conflict of Interest
The authors declare that the research was conducted in the absence of any commercial or financial relationships that could be construed as a potential conflict of interest.
Acknowledgments
We thank K.C. Tsolis for preliminary analyses. The basic structure for figure 1 was published in (Wolf et al., 2017) figure 2 Elsevier Copyright (2017) and was adapted in this manuscript with an Elsevier license agreement.
Supplementary Material
The Supplementary Material for this article can be found online at: https://www.frontiersin.org/articles/10.3389/fmicb.2021.604034/full#supplementary-material
Supplementary Table 1 | Novel coding regions.
Supplementary Table 2 | Corrections of translation start sites.
Supplementary Table 3 | Protein-coding genes validated by proteome data.
Supplementary Table 4 | Transcription start sites (TSS).
Supplementary Table 5 | Promoter analysis.
Footnotes
References
Aaron, J. A., Lin, X., Cane, D. E., and Christianson, D. W. (2010). Structure of epi-isozizaene synthase from Streptomyces coelicolor A3(2), a platform for new terpenoid cyclization templates. Biochemistry 49, 1787–1797. doi: 10.1021/bi902088z
Abduljalil, J. M. (2018). Bacterial riboswitches and RNA thermometers: nature and contributions to pathogenesis. Noncod. RNA Res. 3, 54–63. doi: 10.1016/j.ncrna.2018.04.003
Adamek, M., Spohn, M., Stegmann, E., and Ziemert, N. (2017). Mining bacterial genomes for secondary metabolite gene clusters. Methods Mol. Biol. 1520, 23–47. doi: 10.1007/978-1-4939-6634-9_2
Altschul, S. F., Madden, T. L., Schäffer, A. A., Zhang, J., Zhang, Z., Miller, W., et al. (1997). Gapped BLAST and PSI-BLAST: a new generation of protein database search programs. Nucleic Acids Res. 25, 3389–3402. doi: 10.1093/nar/25.17.3389
Anné, J., Vrancken, K., van Mellaert, L., van Impe, J., and Bernaerts, K. (2014). Protein secretion biotechnology in Gram-positive bacteria with special emphasis on Streptomyces lividans. Biochim. Biophys. Acta 1843, 1750–1761. doi: 10.1016/j.bbamcr.2013.12.023
Ao, W., Gaudet, J., Kent, W. J., Muttumu, S., and Mango, S. E. (2004). Environmentally induced foregut remodeling by PHA-4/FoxA and DAF-12/NHR. Science 305, 1743–1746. doi: 10.1126/science.1102216
Baral, B., Akhgari, A., and Metsä-Ketelä, M. (2018). Activation of microbial secondary metabolic pathways: avenues and challenges. Synthet. Syst. Biotechnol. 3, 163–178. doi: 10.1016/j.synbio.2018.09.001
Barrick, J. E., Corbino, K. A., Winkler, W. C., Nahvi, A., Mandal, M., Collins, J., et al. (2004). New RNA motifs suggest an expanded scope for riboswitches in bacterial genetic control. Proc. Natl. Acad. Sci. U.S.A. 101, 6421–6426. doi: 10.1073/pnas.0308014101
Bednarz, B., Kotowska, M., and Pawlik, K. J. (2019). Multi-level regulation of coelimycin synthesis in Streptomyces coelicolor A3(2). Appl. Microbiol. Biotechnol. 103, 6423–6434. doi: 10.1007/s00253-019-09975-w
Belin, B. J., Busset, N., Giraud, E., Molinaro, A., Silipo, A., and Newman, D. K. (2018). Hopanoid lipids: from membranes to plant-bacteria interactions. Nat. Rev. Microbiol. 16, 304–315. doi: 10.1038/nrmicro.2017.173
Bentley, S. D., Chater, K. F., Cerdeño-Tárraga, A.-M., Challis, G. L., Thomson, N. R., James, K. D., et al. (2002). Complete genome sequence of the model actinomycete Streptomyces coelicolor A3(2). Nature 417, 141–147. doi: 10.1038/417141a
Bertram, R., Schlicht, M., Mahr, K., Nothaft, H., Saier, M. H., and Titgemeyer, F. (2004). In silico and transcriptional analysis of carbohydrate uptake systems of Streptomyces coelicolor A3(2). J. Bacteriol. 186, 1362–1373.
Bibb, M. J. (2005). Regulation of secondary metabolism in streptomycetes. Curr. Opin. Microbiol. 8, 208–215. doi: 10.1016/j.mib.2005.02.016
Blin, K., Shaw, S., Steinke, K., Villebro, R., Ziemert, N., Lee, S. Y., et al. (2019). antiSMASH 5.0: updates to the secondary metabolite genome mining pipeline. Nucleic Acids Res. 47, W81–W87. doi: 10.1093/nar/gkz310
Block, K. F., Hammond, M. C., and Breaker, R. R. (2010). Evidence for widespread gene control function by the ydaO riboswitch candidate. J. Bacteriol. 192, 3983–3989. doi: 10.1128/JB.00450-10
Blom, J., Albaum, S. P., Doppmeier, D., Pühler, A., Vorhölter, F.-J., Zakrzewski, M., et al. (2009). EDGAR: a software framework for the comparative analysis of prokaryotic genomes. BMC Bioinform. 10:154. doi: 10.1186/1471-2105-10-154
Blom, J., Kreis, J., Spänig, S., Juhre, T., Bertelli, C., Ernst, C., et al. (2016). EDGAR 2.0: an enhanced software platform for comparative gene content analyses. Nucleic Acids Res. 44, W22–W28. doi: 10.1093/nar/gkw255
Bolger, A. M., Lohse, M., and Usadel, B. (2014). Trimmomatic: a flexible trimmer for Illumina sequence data. Bioinformatics 30, 2114–2120. doi: 10.1093/bioinformatics/btu170
Brocks, J. J., Love, G. D., Summons, R. E., Knoll, A. H., Logan, G. A., and Bowden, S. A. (2005). Biomarker evidence for green and purple sulphur bacteria in a stratified Palaeoproterozoic sea. Nature 437, 866–870. doi: 10.1038/nature04068
Burger, A., Brandt, B., Süsstrunk, U., Thompson, C. J., and Wohlleben, W. (1998). Analysis of a Streptomyces coelicolor A3(2) locus containing the nucleoside diphosphate kinase (ndk) and folylpolyglutamate synthetase (folC) genes. FEMS Microbiol. Lett. 159, 283–291. doi: 10.1111/j.1574-6968.1998.tb12873.x
Bursy, J., Kuhlmann, A. U., Pittelkow, M., Hartmann, H., Jebbar, M., Pierik, A. J., et al. (2008). Synthesis and uptake of the compatible solutes ectoine and 5-hydroxyectoine by Streptomyces coelicolor A3(2) in response to salt and heat stresses. Appl. Environ. Microbiol. 74, 7286–7296. doi: 10.1128/AEM.00768-08
Busche, T., Tsolis, K. C., Koepff, J., Rebets, Y., Rückert, C., Hamed, M. B., et al. (2018). Multi-omics and targeted approaches to determine the role of cellular proteases in streptomyces protein secretion. Front. Microbiol. 9:1174. doi: 10.3389/fmicb.2018.01174
Chiani, M., Akbarzadeh, A., Farhangi, A., and Mehrabi, M. R. (2010). Production of desferrioxamine B (Desferal) using corn steep liquor in Streptomyces pilosus. Pak. J. Biol. Sci. 13, 1151–1155. doi: 10.3923/pjbs.2010.1151.1155
Coisne, S., Béchet, M., and Blondeau, R. (1999). Actinorhodin production by Streptomyces coelicolor A3(2) in iron-restricted media. Lett. Appl. Microbiol. 28, 199–202. doi: 10.1046/j.1365-2672.1999.00509.x
Cox, J., and Mann, M. (2008). MaxQuant enables high peptide identification rates, individualized p.p.b.-range mass accuracies and proteome-wide protein quantification. Nat. Biotechnol. 26, 1367–1372. doi: 10.1038/nbt.1511
Cox, J., Neuhauser, N., Michalski, A., Scheltema, R. A., Olsen, J. V., and Mann, M. (2011). Andromeda: a peptide search engine integrated into the MaxQuant environment. J. Proteome Res. 10, 1794–1805. doi: 10.1021/pr101065j
Craster, H. L., Potter, C. A., and Baumberg, S. (1999). End-product control of expression of branched-chain amino acid biosynthesis genes in Streptomyces coelicolor A3(2): paradoxical relationships between DNA sequence and regulatory phenotype. Microbiology 145(Pt 9), 2375–2384. doi: 10.1099/00221287-145-9-2375
Crooks, G. E., Hon, G., Chandonia, J.-M., and Brenner, S. E. (2004). WebLogo: a sequence logo generator. Genome Res. 14, 1188–1190. doi: 10.1101/gr.849004
Damsté, J. S. S., Schouten, S., and van Duin, A. C. (2001). Isorenieratene derivatives in sediments: possible controls on their distribution. Geochim. Cosmochim. Acta 65, 1557–1571. doi: 10.1016/S0016-7037(01)00549-X
Davis, N. K., and Chater, K. F. (1990). Spore colour in Streptomyces coelicolor A3(2) involves the developmentally regulated synthesis of a compound biosynthetically related to polyketide antibiotics. Mol. Microbiol. 4, 1679–1691.
Fischer, W. W., Summons, R. E., and Pearson, A. (2005). Targeted genomic detection of biosynthetic pathways: anaerobic production of hopanoid biomarkers by a common sedimentary microbe.”. Geobiology 3, 33–40. doi: 10.1111/j.1472-4669.2005.00041.x
Fowler, C. C., Brown, E. D., and Li, Y. (2010). Using a riboswitch sensor to examine coenzyme B(12) metabolism and transport in E. coli. Chem. Biol. 17, 756–765. doi: 10.1016/j.chembiol.2010.05.025
Gaskell, A. A., Giovinazzo, J. A., Fonte, V., and Willey, J. M. (2012). Multi-tier regulation of the streptomycete morphogenetic peptide SapB. Mol. Microbiol. 84, 501–515. doi: 10.1111/j.1365-2958.2012.08041.x
Gomez-Escribano, J. P., Song, L., Fox, D. J., Yeo, V., Bibb, M. J., and Challis, G. L. (2012). Structure and biosynthesis of the unusual polyketide alkaloid coelimycin P1, a metabolic product of the cpk gene cluster of Streptomyces coelicolor M145. Chem. Sci. 3:2716. doi: 10.1039/C2SC20410J
Goto, Y., Li, B., Claesen, J., Shi, Y., Bibb, M. J., and van der Donk, W. A. (2010). Discovery of unique lanthionine synthetases reveals new mechanistic and evolutionary insights. PLoS Biol. 8:e1000339. doi: 10.1371/journal.pbio.1000339
Gramajo, H. C., Takano, E., and Bibb, M. J. (1993). Stationary-phase production of the antibiotic actinorhodin in Streptomyces coelicolor A3(2) is transcriptionally regulated. Mol. Microbiol. 7, 837–845. doi: 10.1111/j.1365-2958.1993.tb01174.x
Grundy, F. J., and Henkin, T. M. (1998). The S box regulon: a new global transcription termination control system for methionine and cysteine biosynthesis genes in gram-positive bacteria. Mol. Microbiol. 30, 737–749.
Gusarov, I., and Nudler, E. (1999). The mechanism of intrinsic transcription termination. Mol. Cell 3, 495–504. doi: 10.1016/S1097-2765(00)80477-3
Haiser, H. J., Yousef, M. R., and Elliot, M. A. (2009). Cell wall hydrolases affect germination, vegetative growth, and sporulation in Streptomyces coelicolor. J. Bacteriol. 191, 6501–6512. doi: 10.1128/JB.00767-09
Hamed, M. B., Vrancken, K., Bilyk, B., Koepff, J., Novakova, R., van Mellaert, L., et al. (2018). Monitoring protein secretion in streptomyces using fluorescent proteins. Front. Microbiol. 9:3019. doi: 10.3389/fmicb.2018.03019
Harrison, J., and Studholme, D. J. (2014). Recently published Streptomyces genome sequences. Microb. Biotechnol. 7, 373–380. doi: 10.1111/1751-7915.12143
Hilker, R., Stadermann, K. B., Schwengers, O., Anisiforov, E., Jaenicke, S., Weisshaar, B., et al. (2016). ReadXplorer 2-detailed read mapping analysis and visualization from one single source. Bioinformatics 32, 3702–3708.
Hobbs, G., Frazer, C. M., Gardner, D. C. J., Flett, F., and Oliver, S. G. (1990). Pigmented antibiotic production by Streptomyces coelicolor A3(2): kinetics and the influence of nutrients. J. Gen. Microbiol. 136, 2291–2296. doi: 10.1099/00221287-136-11-2291
Hohmann, S., and Meacock, P. A. (1998). Thiamin metabolism and thiamin diphosphate-dependent enzymes in the yeast Saccharomyces cerevisiae: genetic regulation. Biochim. Biophys. Acta Protein Struct. Mol. Enzymol. 1385, 201–219. doi: 10.1016/S0167-4838(98)00069-7
Hopwood, D. A. (1999). Forty years of genetics with Streptomyces: from in vivo through in vitro to in silico. Microbiology 145(Pt 9), 2183–2202. doi: 10.1099/00221287-145-9-2183
Hopwood, D. A., Chater, K. F., and Bibb, M. J. (1995). Genetics of antibiotic production in Streptomyces coelicolor A3(2), a model streptomycete. Biotechnology 28, 65–102.
Hopwood, D. A., Kieser, T., Wright, H. M., and Bibb, M. J. (1983). Plasmids, recombination and chromosome mapping in Streptomyces lividans 66. J. Gen. Microbiol. 129, 2257–2269. doi: 10.1099/00221287-129-7-2257
Hyatt, D., Chen, G.-L., Locascio, P. F., Land, M. L., Larimer, F. W., and Hauser, L. J. (2010). Prodigal: prokaryotic gene recognition and translation initiation site identification. BMC Bioinform. 11:119. doi: 10.1186/1471-2105-11-119
Irla, M., Neshat, A., Brautaset, T., Rückert, C., Kalinowski, J., and Wendisch, V. F. (2015). Transcriptome analysis of thermophilic methylotrophic Bacillus methanolicus MGA3 using RNA-sequencing provides detailed insights into its previously uncharted transcriptional landscape. BMC Genomics 16:73. doi: 10.1186/s12864-015-1239-4
Jarrige, A. C., Mathy, N., and Portier, C. (2001). PNPase autocontrols its expression by degrading a double-stranded structure in the pnp mRNA leader. EMBO J. 20, 6845–6855. doi: 10.1093/emboj/20.23.6845
Jeong, Y., Kim, J.-N., Kim, M. W., Bucca, G., Cho, S., Yoon, Y. J., et al. (2016). The dynamic transcriptional and translational landscape of the model antibiotic producer Streptomyces coelicolor A3(2). Nat. Commun. 7:11605. doi: 10.1038/ncomms11605
Jiang, J., He, X., and Cane, D. E. (2006). Geosmin biosynthesis. Streptomyces coelicolor germacradienol/germacrene D synthase converts farnesyl diphosphate to geosmin. J. Am. Chem. Soc. 128, 8128–8129. doi: 10.1021/ja062669x
Jüttner, F., and Watson, S. B. (2007). Biochemical and ecological control of geosmin and 2-methylisoborneol in source waters. Appl. Environ. Microbiol. 73, 4395–4406. doi: 10.1128/AEM.02250-06
Kolter, R., and Yanofsky, C. (1982). Attenuation in amino acid biosynthetic operons. Annu. Rev. Genet. 16, 113–134. doi: 10.1146/annurev.ge.16.120182.000553
Komatsu, M., Tsuda, M., Omura, S., Oikawa, H., and Ikeda, H. (2008). Identification and functional analysis of genes controlling biosynthesis of 2-methylisoborneol. Proc. Natl. Acad. Sci. U.S.A. 105, 7422–7427. doi: 10.1073/pnas.0802312105
Krügel, H., Krubasik, P., Weber, K., Saluz, H. P., and Sandmann, G. (1999). Functional analysis of genes from Streptomyces griseus involved in the synthesis of isorenieratene, a carotenoid with aromatic end groups, revealed a novel type of carotenoid desaturase. Biochim. Biophys. Acta 1439, 57–64. doi: 10.1016/s1388-1981(99)00075-x
Langmead, B., and Salzberg, S. L. (2012). Fast gapped-read alignment with Bowtie 2. Nat. Methods 9, 357–359. doi: 10.1038/nmeth.1923
Laslett, D., and Canback, B. (2004). ARAGORN, a program to detect tRNA genes and tmRNA genes in nucleotide sequences. Nucleic Acids Res. 32, 11–16. doi: 10.1093/nar/gkh152
Laslett, D., and Canbäck, B. (2008). ARWEN: a program to detect tRNA genes in metazoan mitochondrial nucleotide sequences. Bioinformatics 24, 172–175. doi: 10.1093/bioinformatics/btm573
Leblond, P., Redenbach, M., and Cullum, J. (1993). Physical map of the Streptomyces lividans 66 genome and comparison with that of the related strain Streptomyces coelicolor A3(2). J. Bacteriol. 175, 3422–3429. doi: 10.1128/jb.175.11.3422-3429.1993
Lee, H. S., Ohnishi, Y., and Horinouchi, S. (2001). A sigmaB-like factor responsible for carotenoid biosynthesis in Streptomyces griseus. J. Mol. Microbiol. Biotechnol. 3, 95–101.
Lee, J. S., Chi, W.-J., Hong, S.-K., Yang, J.-W., and Chang, Y. K. (2013). Bioethanol production by heterologous expression of Pdc and AdhII in Streptomyces lividans. Appl. Microbiol. Biotechnol. 97, 6089–6097. doi: 10.1007/s00253-013-4951-5
Liu, W., Sakr, E., Schaeffer, P., Talbot, H. M., Donisi, J., Härtner, T., et al. (2014). Ribosylhopane, a novel bacterial hopanoid, as precursor of C35 bacteriohopanepolyols in Streptomyces coelicolor A3(2). Chembiochem 15, 2156–2161. doi: 10.1002/cbic.201402261
Lowe, T. M., and Eddy, S. R. (1997). tRNAscan-SE: a program for improved detection of transfer RNA genes in genomic sequence. Nucleic Acids Res. 25, 955–964.
Luo, H.-D., Tao, Y., Wang, W.-G., Lin, T., Wang, Y.-Y., and Jiang, H. (2017). Design of ribosome binding sites in Streptomyces coelicolor. Current Proteomics 14, 287–292. doi: 10.2174/1570164614666170724120325
Magnolo, S. K., Leenutaphong, D. L., DeModena, J. A., Curtis, J. E., Bailey, J. E., Galazzo, J. L., et al. (1991). Actinorhodin production by Streptomyces coelicolor and growth of Streptomyces lividans are improved by the expression of a bacterial hemoglobin. Biotechnology 9, 473–476. doi: 10.1038/nbt0591-473
Mandal, M., Lee, M., Barrick, J. E., Weinberg, Z., Emilsson, G. M., Ruzzo, W. L., et al. (2004). A glycine-dependent riboswitch that uses cooperative binding to control gene expression. Science 306, 275–279. doi: 10.1126/science.1100829
McClure, R., Balasubramanian, D., Sun, Y., Bobrovskyy, M., Sumby, P., Genco, C. A., et al. (2013). Computational analysis of bacterial RNA-Seq data. Nucleic Acids Res. 41:e140. doi: 10.1093/nar/gkt444
Mehra, S., Charaniya, S., Takano, E., and Hu, W.-S. (2008). A bistable gene switch for antibiotic biosynthesis: the butyrolactone regulon in Streptomyces coelicolor. PLoS One 3:e2724. doi: 10.1371/journal.pone.0002724
Meyer, F., Goesmann, A., McHardy, A. C., Bartels, D., Bekel, T., Clausen, J., et al. (2003). GenDB–an open source genome annotation system for prokaryote genomes. Nucleic Acids Res. 31, 2187–2195. doi: 10.1093/nar/gkg312
Millman, A., Dar, D., Shamir, M., and Sorek, R. (2017). Computational prediction of regulatory, premature transcription termination in bacteria. Nucleic Acids Res. 45, 886–893. doi: 10.1093/nar/gkw749
Nahvi, A., Barrick, J. E., and Breaker, R. R. (2004). Coenzyme B12 riboswitches are widespread genetic control elements in prokaryotes. Nucleic Acids Res. 32, 143–150. doi: 10.1093/nar/gkh167
Naville, M., and Gautheret, D. (2010a). Premature terminator analysis sheds light on a hidden world of bacterial transcriptional attenuation. Genome Biol. 11:R97. doi: 10.1186/gb-2010-11-9-r97
Naville, M., and Gautheret, D. (2010b). Transcription attenuation in bacteria: theme and variations. Brief. Funct. Genomics 9, 178–189. doi: 10.1093/bfgp/elq008
Naville, M., Ghuillot-Gaudeffroy, A., Marchais, A., and Gautheret, D. (2011). ARNold: a web tool for the prediction of Rho-independent transcription terminators. RNA Biol. 8, 11–13. doi: 10.4161/rna.8.1.13346
Nawrocki, E. P., Burge, S. W., Bateman, A., Daub, J., Eberhardt, R. Y., Eddy, S. R., et al. (2015). Rfam 12.0: updates to the RNA families database. Nucleic Acids Res. 43, D130–D137. doi: 10.1093/nar/gku1063
Nawrocki, E. P., and Eddy, S. R. (2013). Infernal 1.1: 100-fold faster RNA homology searches. Bioinformatics 29, 2933–2935. doi: 10.1093/bioinformatics/btt509
Nelson, J. W., Sudarsan, N., Furukawa, K., Weinberg, Z., Wang, J. X., and Breaker, R. R. (2013). Riboswitches in eubacteria sense the second messenger c-di-AMP. Nat. Chem. Biol. 9, 834–839. doi: 10.1038/nchembio.1363
Neshat, A., Mentz, A., Rückert, C., and Kalinowski, J. (2014). Transcriptome sequencing revealed the transcriptional organization at ribosome-mediated attenuation sites in Corynebacterium glutamicum and identified a novel attenuator involved in aromatic amino acid biosynthesis. J. Biotechnol. 190, 55–63. doi: 10.1016/j.jbiotec.2014.05.033
Okamoto, S., Taguchi, T., Ochi, K., and Ichinose, K. (2009). Biosynthesis of actinorhodin and related antibiotics: discovery of alternative routes for quinone formation encoded in the act gene cluster. Chem. Biol. 16, 226–236. doi: 10.1016/j.chembiol.2009.01.015
Omotajo, D., Tate, T., Cho, H., and Choudhary, M. (2015). Distribution and diversity of ribosome binding sites in prokaryotic genomes. BMC Genomics 16:604. doi: 10.1186/s12864-015-1808-6
Osbourn, A. (2010). Secondary metabolic gene clusters: evolutionary toolkits for chemical innovation. Trends Genet. 26, 449–457. doi: 10.1016/j.tig.2010.07.001
Passalacqua, K. D., Varadarajan, A., Ondov, B. D., Okou, D. T., Zwick, M. E., and Bergman, N. H. (2009). Structure and complexity of a bacterial transcriptome. J. Bacteriol. 191, 3203–3211. doi: 10.1128/JB.00122-09
Peselis, A., and Serganov, A. (2012). Structural insights into ligand binding and gene expression control by an adenosylcobalamin riboswitch. Nat. Struct. Mol. Biol. 19, 1182–1184. doi: 10.1038/nsmb.2405
Peters, P., Galinski, E. A., and Trüper, H. G. (1990). The biosynthesis of ectoine. FEMS Microbiol. Lett. 71, 157–162. doi: 10.1111/j.1574-6968.1990.tb03815.x
Pfeifer-Sancar, K., Mentz, A., Rückert, C., and Kalinowski, J. (2013). Comprehensive analysis of the Corynebacterium glutamicum transcriptome using an improved RNAseq technique. BMC Genomics 14:888. doi: 10.1186/1471-2164-14-888
Poralla, K., Muth, G., and Härtner, T. (2000). Hopanoids are formed during transition from substrate to aerial hyphae in Streptomyces coelicolor A3(2). FEMS Microbiol. Lett. 189, 93–95. doi: 10.1111/j.1574-6968.2000.tb09212.x
R Core Team (2017). R: A Language and Environment for Statistical computing. Vienna: R Foundation for Statistical Computing.
Ringquist, S., Shinedling, S., Barrick, D., Green, L., Binkley, J., Stormo, G. D., et al. (1992). Translation initiation in Escherichia coli: sequences within the ribosome-binding site. Mol. Microbiol. 6, 1219–1229.
Rosinski-Chupin, I., Soutourina, O., and Martin-Verstraete, I. (2014). Riboswitch discovery by combining RNA-seq and genome-wide identification of transcriptional start sites. Methods Enzymol. 549, 3–27. doi: 10.1016/B978-0-12-801122-5.00001-5
Rückert, C., Albersmeier, A., Busche, T., Jaenicke, S., Winkler, A., Friðjónsson, ÓH., et al. (2015). Complete genome sequence of Streptomyces lividans TK24. J. Biotechnol. 199, 21–22. doi: 10.1016/j.jbiotec.2015.02.004
Schattner, P., Brooks, A. N., and Lowe, T. M. (2005). The tRNAscan-SE, snoscan and snoGPS web servers for the detection of tRNAs and snoRNAs. Nucleic Acids Res. 33, W686–W689. doi: 10.1093/nar/gki366
Schwanhäusser, B., Busse, D., Li, N., Dittmar, G., Schuchhardt, J., Wolf, J., et al. (2011). Global quantification of mammalian gene expression control. Nature 473, 337–342. doi: 10.1038/nature10098
Seca, A. M. L., and Pinto, D. C. G. A. (2018). Plant secondary metabolites as anticancer agents: successes in clinical trials and therapeutic application. Int. J. Mol. Sci. 19:263. doi: 10.3390/ijms19010263
Seemann, T. (2014). Prokka: rapid prokaryotic genome annotation. Bioinformatics 30, 2068–2069. doi: 10.1093/bioinformatics/btu153
Seipke, R. F., and Loria, R. (2009). Hopanoids are not essential for growth of Streptomyces scabies 87-22. J. Bacteriol. 191, 5216–5223. doi: 10.1128/JB.00390-09
Seliverstov, A. V., Putzer, H., Gelfand, M. S., and Lyubetsky, V. A. (2005). Comparative analysis of RNA regulatory elements of amino acid metabolism genes in Actinobacteria. BMC Microbiol. 5:54. doi: 10.1186/1471-2180-5-54
Serganov, A., and Patel, D. J. (2009). Amino acid recognition and gene regulation by riboswitches. Biochim. Biophys. Acta 1789, 592–611. doi: 10.1016/j.bbagrm.2009.07.002
Shine, J., and Dalgarno, L. (1974). The 3’-terminal sequence of Escherichia coli 16S ribosomal RNA: complementarity to nonsense triplets and ribosome binding sites. Proc. Natl. Acad. Sci. U.S.A. 71, 1342–1346.
Singh, S. S., Typas, A., Hengge, R., and Grainger, D. C. (2011). Escherichia coli σ70 senses sequence and conformation of the promoter spacer region. Nucleic Acids Res. 39, 5109–5118. doi: 10.1093/nar/gkr080
Sorek, R., and Cossart, P. (2010). Prokaryotic transcriptomics: a new view on regulation, physiology and pathogenicity. Nat. Rev. Genet. 11, 9–16. doi: 10.1038/nrg2695
Sousa, P. M. F., Videira, M. A. M., Bohn, A., Hood, B. L., Conrads, T. P., Goulao, L. F., et al. (2012). The aerobic respiratory chain of Escherichia coli: from genes to supercomplexes. Microbiology 158, 2408–2418. doi: 10.1099/mic.0.056531-0
Stormo, G. D., Schneider, T. D., and Gold, L. M. (1982). Characterization of translational initiation sites in E. coli. Nucleic Acids Res. 10, 2971–2996. doi: 10.1093/nar/10.9.2971
Takano, E., Chakraburtty, R., Nihira, T., Yamada, Y., and Bibb, M. J. (2001). A complex role for the gamma-butyrolactone SCB1 in regulating antibiotic production in Streptomyces coelicolor A3(2). Mol. Microbiol. 41, 1015–1028.
Tsolis, K. C., Hamed, M. B., Simoens, K., Koepff, J., Busche, T., Rückert, C., et al. (2019). Secretome dynamics in a gram-positive bacterial model. Mol. Cell Proteomics 18, 423–436. doi: 10.1074/mcp.RA118.000899
Tsolis, K. C., Tsare, E.-P., Orfanoudaki, G., Busche, T., Kanaki, K., Ramakrishnan, R., et al. (2018). Comprehensive subcellular topologies of polypeptides in Streptomyces. Microb. Cell Fact. 17:43. doi: 10.1186/s12934-018-0892-0
Vitreschak, A. G., Lyubetskaya, E. V., Shirshin, M. A., Gelfand, M. S., and Lyubetsky, V. A. (2004). Attenuation regulation of amino acid biosynthetic operons in proteobacteria: comparative genomics analysis. FEMS Microbiol. Lett. 234, 357–370. doi: 10.1111/j.1574-6968.2004.tb09555.x
Waters, L. S., and Storz, G. (2009). Regulatory RNAs in bacteria. Cell 136, 615–628. doi: 10.1016/j.cell.2009.01.043
Williamson, N. R., Fineran, P. C., Leeper, F. J., and Salmond, G. P. C. (2006). The biosynthesis and regulation of bacterial prodiginines. Nat. Rev. Microbiol. 4, 887–899. doi: 10.1038/nrmicro1531
Wolf, T., Schneiker-Bekel, S., Neshat, A., Ortseifen, V., Wibberg, D., Zemke, T., et al. (2017). Genome improvement of the acarbose producer Actinoplanes sp. SE50/110 and annotation refinement based on RNA-seq analysis. J. Biotechnol. 251, 112–123. doi: 10.1016/j.jbiotec.2017.04.013
Zhang, Y., Wang, W. C., and Li, Y. (2004). Cloning, expression, and purification of soluble human interleukin-4 receptor in Streptomyces. Protein Expr. Purif. 36, 139–145. doi: 10.1016/j.pep.2004.04.010
Zhao, B., Lin, X., Lei, L., Lamb, D. C., Kelly, S. L., Waterman, M. R., et al. (2008). Biosynthesis of the sesquiterpene antibiotic albaflavenone in Streptomyces coelicolor A3(2). J. Biol. Chem. 283, 8183–8189. doi: 10.1074/jbc.M710421200
Keywords: Streptomyces lividans TK24, reannotation, promoter, RNA sequencing (RNA-seq), cis-regulatory elements, attenuation, secondary metabolite gene clusters
Citation: Droste J, Rückert C, Kalinowski J, Hamed MB, Anné J, Simoens K, Bernaerts K, Economou A and Busche T (2021) Extensive Reannotation of the Genome of the Model Streptomycete Streptomyces lividans TK24 Based on Transcriptome and Proteome Information. Front. Microbiol. 12:604034. doi: 10.3389/fmicb.2021.604034
Received: 08 September 2020; Accepted: 12 March 2021;
Published: 14 April 2021.
Edited by:
Wen-Jun Li, Sun Yat-sen University, ChinaReviewed by:
Wenli Li, Ocean University of China, ChinaKay Nieselt, University of Tübingen, Germany
Copyright © 2021 Droste, Rückert, Kalinowski, Hamed, Anné, Simoens, Bernaerts, Economou and Busche. This is an open-access article distributed under the terms of the Creative Commons Attribution License (CC BY). The use, distribution or reproduction in other forums is permitted, provided the original author(s) and the copyright owner(s) are credited and that the original publication in this journal is cited, in accordance with accepted academic practice. No use, distribution or reproduction is permitted which does not comply with these terms.
*Correspondence: Tobias Busche, dGJ1c2NoZUBjZWJpdGVjLnVuaS1iaWVsZWZlbGQuZGU=