 Stefanie A. Hetz
 Marcus A. Horn
- Institute of Microbiology, Leibniz University Hannover, Hannover, Germany
Cryoturbated peat circles (pH 4) in the Eastern European Tundra harbor up to 2 mM pore water nitrate and emit the greenhouse gas N2O like heavily fertilized agricultural soils in temperate regions. The main process yielding N2O under oxygen limited conditions is denitrification, which is the sequential reduction of nitrate/nitrite to N2O and/or N2. N2O reduction to N2 is impaired by pH < 6 in classical model denitrifiers and many environments. Key microbes of peat circles are important but largely unknown catalysts for C- and N-cycling associated N2O fluxes. Thus, we hypothesized that the peat circle community includes hitherto unknown taxa and is essentially unable to efficiently perform complete denitrification, i.e., reduce N2O, due to a low in situ pH. 16S rRNA analysis indicated a diverse active community primarily composed of the bacterial class-level taxa Alphaproteobacteria, Acidimicrobiia, Acidobacteria, Verrucomicrobiae, and Bacteroidia, as well as archaeal Nitrososphaeria. Euryarchaeota were not detected. 13C2- and 12C2-acetate supplemented anoxic microcosms with endogenous nitrate and acetylene at an in situ near pH of 4 were used to assess acetate dependent carbon flow, denitrification and N2O production. Initial nitrate and acetate were consumed within 6 and 11 days, respectively, and primarily converted to CO2 and N2, suggesting complete acetate fueled denitrification at acidic pH. Stable isotope probing coupled to 16S rRNA analysis via Illumina MiSeq amplicon sequencing identified acetate consuming key players of the family Burkholderiaceae during complete denitrification correlating with Rhodanobacter spp. The archaeal community consisted primarily of ammonia-oxidizing Archaea of Nitrososphaeraceae, and was stable during the incubation. The collective data indicate that peat circles (i) host acid-tolerant denitrifiers capable of complete denitrification at pH 4–5.5, (ii) other parameters like carbon availability rather than pH are possible reasons for high N2O emissions in situ, and (iii) Burkholderiaceae are responsive key acetate assimilators co-occurring with Rhodanobacter sp. during denitrification, suggesting both organisms being associated with acid-tolerant denitrification in peat circles.
Introduction
Nitrous oxide (N2O) is a potent greenhouse gas with a global warming potential about 300 times higher than CO2, and a long atmospheric half-life of estimated 120 years (Prather et al., 2015; Stocker et al., 2018). The main source of N2O is microbial denitrification, i.e., the sequential reduction of nitrate (NO3–) or nitrite (NO2–) via the intermediates nitric oxide (NO) and N2O to dinitrogen gas (N2) under the exclusion of oxygen (Zumft, 1997). Different reductases are involved in this process. The first step in the process is facilitated via the dissimilatory nitrate reductase Nar, a membrane bound enzyme (Zumft, 1997). The reduction of NO2– to NO can be executed by either the cytochrome cd1 dependent nitrite reductase cd-Nir or one of three known types of copper-dependent nitrite reductases CuNir (Zumft, 1997; Helen et al., 2016). The cytotoxic gas NO can then be further reduced to N2O via the NO reductases cNOR, associated with cytochrome c, the copper-dependent Cu-qNor or the quinol dependent qNOR (Zumft, 2005). The last step of denitrification is catalyzed by the copper-containing N2O-reductases NosZ, the only known enzyme capable of this reaction (Zumft, 1997; Jones et al., 2008). More than 60 genera, within archaea, bacteria, and fungi, are known to be capable of denitrification, displaying a broad phylogenetic and functional variability (Zumft, 1997; Philippot et al., 2007). Since many organisms only possess the genetic potential to perform parts of the whole denitrification process, truncated forms lacking N2O reductases exist, which can lead to the release of N2O as end product, contributing to N2O emissions from soils (Cofman Anderson and Levine, 1986; Stein and Klotz, 2016).
Many studies focus on denitrification and associated fluxes N2O in diverse environments including permafrost affected soils and sediments (Braker and Conrad, 2011; Albina et al., 2019; Kumar et al., 2020; Hetz and Horn, 2021). Tropical rainforest soils have the highest known N2O emission potentials (Potter et al., 1996; Werner et al., 2007). These soils offer ideal conditions for denitrification, with a high supply of mineral nitrogen and an optimum soil moisture (Breuer et al., 2000). In contrast, permafrost affected soils are traditionally viewed as sources of the greenhouse gas methane rather than N2O, nitrogen limited, slowly mineralizing organic matter, and not contributing significantly to the global N2O budget (Nadelhoffer et al., 1991; Shaver et al., 1992; Jonasson et al., 1999). Permafrost soils cover approximately 17% of Earth’s surface, and only a decade ago cryoturbated peat circles were found to emit N2O in the range of temperate agricultural and (sub)tropical rainforest soils during growing season (1.9–31 mg N2O m–2 d–1; Repo et al., 2009; Marushchak et al., 2011; Gruber, 2012), emphasizing the emerging awareness of permafrost regions for N-cycle derived greenhouse gas emissions (reviewed in Hetz and Horn, 2021). Such peat circles are thus significant sources of N2O accounting for up to 0.6% of annual global N2O emissions (Christensen, 1993; Denman et al., 2007; Repo et al., 2009). A low C/N ratio of old peat material, an oxic/anoxic interface, the lack of vegetation as competitor for nitrogen, high nitrification activities by archaeal ammonia-oxidizers, and intermediate water content, account for high NO3– concentrations of up to 2 mM in the pore water of peat circles, which is one of the main sources of N2O in soils and readily available for denitrifiers (Repo et al., 2009; Siljanen et al., 2019). A major parameter determining the emission ratio of N2O/N2 from soils is pH, leading to an increased release of N2O relative to N2 at low pH due to an impaired N2O reduction (Simek and Cooper, 2002; Cuhel et al., 2010; Bergaust et al., 2012), suggesting that a low pH is a major reason for high N2O emissions of peat circles. Indeed, only very few strains, all belonging to the genus Rhodanobacter, have been associated with N2O reduction at low pH to date (Van Den Heuvel et al., 2010; Prakash et al., 2012; Lycus et al., 2017).
Denitrifier community analysis revealed that peat circle denitrifiers are only distantly related to known denitrifiers (Palmer et al., 2012). Functional gene analysis identified the genetic potentials for complete denitrification to N2. Phylogenetic affiliations of nosZ genes showed a high relative abundance of Alphaproteobacterial nosZ (Mesorhizobium sp.), of which 60 % were only distantly related to nosZ of cultured microorganisms, indicating a new, specific, and acid-tolerant denitrifier community with little N2O reduction capacity in these soils (Palmer et al., 2012). In contrast, unturbated vegetated peat soils from the same study site with the same acidic pH, do not emit N2O in situ (Repo et al., 2009; Marushchak et al., 2011). Phylogenetic functional gene data show that denitrifier communities differ between bare cryoturbated and vegetated unturbated peat soils, and are likely accountable for contrasting N2O emissions between soils rather than soil pH alone (Repo et al., 2009; Marushchak et al., 2011; Palmer et al., 2012). However, functional gene based phylogeny might be biased due to horizontal gene transfer and gene duplication events. 16S rRNA genes as phylogenetic markers are thus preferable for the analysis of community structure and to verify phylogenetic novelty. Interactions of microbes potentially impacting N2O fluxes, e.g., via competition for electron donors and carbon sources demand the analysis of the whole microbial community rather than denitrifiers alone.
Denitrifiers use low molecular weight organic carbon (LMWOC) as carbon source and electron donors in many peatland systems and sediments (Castaldelli et al., 2013; Boylan et al., 2020). LMWOC represents common intermediates in the anerobic food chain (McInerney and Bryant, 1981; Wüst et al., 2009). The anaerobic food chain is also referred to as intermediary ecosystem metabolism to highlight the complex network of trophically interacting physiological groups of microorganisms finally leading to methane in the absence of alternative electron acceptors other than CO2 (Wüst et al., 2009). The intermediary ecosystem metabolism includes hydrolysis of biopolymers to monomers, primary and secondary fermentations, acetogenesis, and finally methanogenesis. Acetate is one of the most often detected intermediates in peatlands and a prominent methane precursor (Zeikus et al., 1975). Methanogenesis and most of the other reactions are catalyzed by methanogenic Euryarchaeota and Bacteria, respectively. When alternative electron acceptors like nitrate are present, intermediary electron and carbon flow is diverged from methanogenesis to nitrate reduction and/or denitrification as terminal electron accepting processes (Tiedje, 1988). Indeed, high denitrification potentials were identified in cryoturbated peat circles in the presence of nitrate under anoxic conditions, and acetate was shown to stimulate denitrification (Palmer et al., 2012). Although acetate is undoubtedly an important intermediate in intermediary ecosystem metabolism, acetate derived carbon and electron flow and divergence to CO2 and/or nitrate in cryoturbated peat circles are unclear to date. Key players catalyzing such reactions in peat circle sediments are likewise unknown. Thus, we hypothesize that the peat circle community couples acetate consumption to incomplete denitrification yielding primarily N2O as end product due to a low in situ pH. Therefore, the main objectives of this study were 1) to determine the diversity of peat circle Bacteria and Archaea by 16S rRNA analysis, 2) analyze acetate derived carbon- and nitrate derived nitrogen-flow in anoxic microcosms, and 3) determine key acetate assimilators during active denitrification by rRNA dependent stable isotope probing. Many acetate assimilating microbes are chemoorganoheterotrophs that utilize acetate as carbon source and electron donor, i.e., dissimilate acetate to conserve energy in the form of a proton motive force and ATP by oxidizing acetate to CO2. It is general knowledge that acetate assimilation and dissimilation proceed via central metabolic pathways like the citric acid cycle, thus allowing for an easy partitioning of acetate carbon to oxidation to CO2 and assimilation. Our experimental approach included 13C-tracing, i.e., determining oxidation of 13C-labeled acetate carbon to 13CO2 during denitrification in peat circle sediments, calculation of assimilated acetate carbon, and sequence analysis of 16S rRNA of microbes that assimilated 13C-acetate carbon.
Materials and Methods
Site Description and Sampling
The study site was located in the Northeastern European Tundra in Russia within the discontinuous permafrost zone (67°03′N, 62°57′E, 100 m a.s.l.) with a mean annual air temperature of −5.6°C (Marushchak et al., 2011). Samples were taken from cryoturbated peat circles, which were previously described (Repo et al., 2009; Hugelius et al., 2011; Biasi et al., 2014). Generally, the carbon to nitrogen (C/N) ratio is low (23 ± 2) in cryoturbated peat circles and during growing season high amounts of N2O are emitted (1.9–31 mg N2O m–2 d–1) (Repo et al., 2009). Thawed sediment from the upper 10 cm of three peat circles was sampled from the active layer in summer 2014 (total thaw depth approximately 60 cm; 13.0 ± 0.3 °C mean temperature in 2 cm of depth; Marushchak et al., 2011), placed in gas-tight ZipLoc bags, and stored at 4°C until further processing to minimize potential changes in the microbial community during transport and storage. Experiments were conducted within three months after sampling. Soil moisture content was determined via weighing soil samples before and after drying at 60°C for 1 week, and was 74 ± 8.6% (n = 3).
Preparation of Microcosms, Incubation and Sampling
Sediment of three sampled peat circles was pooled to provide a representative sample for peat circles with low variability, homogenized, and larger debris was removed prior to incubation. Soil slurries with an in situ near pH of 4.4 were prepared by mixing soil with deionized water (1:12) to a final volume of 300 ml in 500 ml veral bottles. The bottles were sealed with an airtight rubber stopper. Microcosms were prepared in triplicates for each treatment and incubated in the dark at 15°C, which is representative of the in situ peat circle temperature in 2 cm of depth during the growing season of 13.0 ± 0.3°C (Marushchak et al., 2011). Microcosms were rigorously shaken twice a day to minimize the formation of micro-gradients. The gas phase consisted of 100% nitrogen. In order to differentiate between complete and incomplete denitrification to N2O, microcosms with and without acetylene (10% vol/vol headspace) were prepared. Acetylene blocks the N2O reductase, hence N2O cannot be further reduced to N2 (Yoshinari et al., 1977). All microcosms contained the peat circle sediment endogenous nitrate (app. 300 μM). A nitrate depletion step and thus controls without nitrate were omitted due to modification of the microbial community and little in situ relevance. In total, 12 anoxic microcosms were prepared [2 (+/− acetylene) × 2 ([13C2]- or ([12C]- acetate) × 3 (triplicates); Supplementary Figure S1]. Microcosms were supplemented with 600 μM nitrate as soon as endogenous nitrate was depleted. Isotope labeling of microorganisms was initiated by supplementing 13C-labeled [13C2]-acetate (99 atom-%, Sigma-Aldrich, MO, United States) to a final concentration of 400 μM, which was refed three times to maximize 13C-labeling of acetate assimilators. Control microcosms received unlabeled acetate. N2O, nitrate, and acetate were determined at regular intervals (Palmer et al., 2010). For the microbial community analyses, microcosms were sampled at the start and the end of incubation (16 day time span). A total of 20 ml slurry sample were immediately suspended in 2.5 ml RNA stabilization buffer (100 mM sodium acetate, 100 mM EDTA, pH 5.2) together with 1 ml 20% SDS, 64 μl mercaptoethanol, and 2 ml equilibrated phenol. In order to avoid decomposition of nucleic acids, samples were flash-frozen in liquid nitrogen and stored at −80°C until further processing.
Analytical Methods and Statistics
Gases (N2O, CH4, and CO2) were measured via gaschromatography coupled to electron capture, flame ionization, andthermal conductivity detection, respectively (Horn et al., 2003; Palmer et al., 2010; Hunger et al., 2011). [13C/12C]-isotope ratios of CO2 were determined by GC combustion-isotope ratio mass spectrometry (GC-C-IRMS; BayCEER – Laboratories for Isotopic-Biogeochemistry, University of Bayreuth, GER). Liquid samples were analyzed for soluble organic compounds via high performance liquid chromatography (Palmer et al., 2010). Determination of 13C labeled soluble compounds was done via HPLC-ESI-MS (BayCEER – Atmospheric Chemistry, University of Bayreuth, GER). Sulfate, nitrate, nitrite, ammonium, and iron(II) were measured by colorimetric assays (Harrigan and McCance, 1966; Cataldo et al., 1975; Gadkari, 1984; Wüst et al., 2009). Statistical analyses were performed in OriginPro 2020 (OriginalLab Corporation, Northampton, MA, United States). Prior to statistical tests, basic data analyses were performed, including visual inspection of all measured variables coupled with the Shapiro–Wilk normality test. Analysis of variance (ANOVA) was used to test for the treatment effect, i.e., differences between controls and supplemented microcosms.
RNA Extraction and Density Gradient Fractionation
Prior to nucleic acid extraction, it was assured that all solutions and glassware were RNase free by either treatment with DEPC or heat sterilization (180°C, 8 h), respectively. Utilized plasticware was certified DNase- and RNase-free. Nucleic acids were extracted in triplicates, samples analyzed included t0 (before incubation) and tend (after incubation) of treatments incubated without acetylene. The coextraction of DNA and RNA followed a modified protocol of Griffiths et al. (2000). Prior to extraction, a wash step modified after Placella et al. (2012) was implemented to remove humic substances that were highly present in the samples. Pure RNA was retrieved by treating pooled nucleic acid extracts with DNAse I (RNase free, New England Biolabs, MA, United States). Digestion success was verified via 16S rRNA gene amplification and visualization on agarose gel. RNA was quantified with RiboGreen (Thermo Fisher Scientific, MA, United States), and 500 ng of RNA per sample were loaded onto a CsTFA gradient buffer (Whiteley et al., 2007). After isopycnic density gradient centrifugation for 67 h at 20°C at 130,000 gav, 10 fractions of each sample were collected, and RNA precipitated for subsequent community analyses (Dallinger and Horn, 2014). Buoyant density (BD) of each fraction was determined by weighing of fractions obtained from a blank gradient. Heavy and light fractions were defined according to values from literature, with heavy fractions ranging between 1.818 and 1.824 g ml–1 and light fractions ranging between 1.770 and 1.784 g ml–1 (Lueders et al., 2003).
Denaturing Gradient Gel Electrophoresis (DGGE) Analysis of Density-Resolved rRNA
RNA fractions were pairwise pooled resulting in five pooled fractions (1–2, 3–4, 5–6, 7–8, and 9–10) per gradient and subjected to reverse transcription (SuperScript IV, Thermo Fisher Scientific, MA, United States) according to the manufacturer’s protocol. Pooled fractions recovered from CsTFA gradients were compared by denaturing gradient gel electrophoresis (DGGE) fingerprinting to determine the success of labeling prior to amplicon sequencing. Primers Bact340F (TAC GGG AGG CAG CAG; Li et al., 2010) and 907R (CCG TCA ATT CMT TTG AGT TT; Muyzer et al., 1995) were used to amplify the 16S rRNA gene for DGGE, with the forward primer containing a G + C rich sequence at the 5′ end (CGC CCG CCG CGC CCC GCG CCC GTC CCG CCG CCC CCG CCC GCC; clamp; Muyzer et al., 1993). PCR reactions were carried out as 40 μl reactions, containing 1× SensiMix SYBR & Fluorescein (Bioline, London, United Kingdom), 500 nM of each primer and 4 μl of template cDNA. Initial denaturation was performed at 94°C for 8 min. Denaturation, annealing and elongation were at 94°C for 30 s, 55°C for 30 s and 72°C for 60 s, respectively, with a total of 35 cycle, followed by a final elongation at 72°C for 5 min. Amplification was checked on a 1% agarose gel. Amplicons were then resolved on a 35 – 65% DGGE gradient gel (63 V, 60°C, 16.5 h) and imaged after the run was complete (Supplementary Figure S5) (Horn et al., 2003).
16S rRNA Gene Amplification and Amplicon Sequencing
Paired end Illumina MiSeq amplicon sequencing of the archaeal and bacterial 16S rRNA gene of representative pooled fractions was performed. Amplicon libraries for Archaea and Bacteria were generated with primer pairs A519F (CAG CMG CCG CGG TAA; Wang and Qian, 2009)/Arch1017R (GGC CAT GCA CCW CCT CTC; Yoshida et al., 2005) and 341F (CCT ACG GGN GGC WGC AG; Herlemann et al., 2011)/805R (GAC TAC HVG GGT ATC TAA TCC; Herlemann et al., 2011), respectively. Both forward and reverse primers were fused to adapter sequences at their 5′ end (TCG TCG GCA GCG TCA GAT GTG TAT AAG AGA CAG and GTC TCG TGG GCT CGG AGA TGT GTA TAA GAG ACA G, respectively). For each PCR, 40 μl reactions were set up, containing 1× SensiMix SYBR & Fluorescein (Bioline, London, United Kingdom), 500 nM of each primer and 4 μl of template cDNA. Initial denaturation was performed at 94°C for 8 min. Denaturation, annealing and elongation were at 94°C for 40 s, 53°C for 40 s and 72°C for 50 s for amplification of bacterial 16S rRNA derived cDNA, with a total of 30 cycles. For amplification of archaeal 16S rRNA derived cDNA, denaturation, annealing, and elongation were at 94°C for 30 s, 55.5°C for 30 s and 72°C for 30 s, with a total of 30 cycles. Terminal elongation was at 72°C for 5 min, for both protocols. PCR products were checked for right amplicon size on a 1% agarose gel and then purified with the GeneRead Size Selection Kit (Qiagen, Hilden, GER), before sequencing on the Illumina MiSeq platform (v3 chemistry) at the University of Göttingen (Genomic and Applied Microbiology, University of Göttingen, Germany).
Sequence Processing
Sequence analysis was performed using mothur v.1.39.5 (Schloss et al., 2009) and a modified standard operational protocol for MiSeq data (Kozich et al., 2013). After paired-end joining of sequence reads, sequences were filtered by amplicon length, and sequences with ambiguous bases as well as duplicate sequences were removed. Next, sequences were aligned according to a reference database (Silva database1 v138; Quast et al., 2012; Yilmaz et al., 2014), formatted to be compatible with mothur2 (2019 Patrick D. Schloss, PhD), with maximum homopolymer length ≤8. Sequences were pre-clustered, allowing one difference for every 100 bp of sequence, and chimeras were identified and removed using VSEARCH (v2.6.0; Rognes et al., 2016). After classification against the Silva database (Silva database v138; Quast et al., 2012; Yilmaz et al., 2014) non-target sequences (e.g., fragments of mitochondria, eukaryota) were removed. Operational taxonomic units (OTUs) were assigned at 97% similarity level using the OptiClust algorithm (OTU assembly using metrics to determine the quality of clustering). Coverage and α-diversity indices were calculated using Good’s coverage (Good, 1953) and the Inverse Simpson diversity index (Simpson, 1949), respectively, and Bray–Curtis dissimilarity matrices were used for comparison of β-diversity (Bray and Curtis, 1957). Quantification and statistical inference of systematic changes between conditions were tested with the differential analysis of count data (DESeq2 package; Love et al., 2014). All other analyses were performed with the Microbiome Analyst pipeline after total sum scaling (Dhariwal et al., 2017) or Galaxy server3.
Results
Acetate-Driven Carbon Flow
Acetate was below the detection limit (i.e., <20 μM) in anoxic cryoturbated peat circle sediment incubations prior to supplementation. Initially supplemented acetate was consumed without apparent delay and primarily converted to CO2 in all treatments (Figures 1A–D, Table 1, and Supplementary Figure S2). Traces of CH4 were detected, suggesting a marginal role of methanogenesis for carbon and electron flow (Supplementary Figure S3). Acetate was refed after day 11, when initial acetate was depleted in treatments without acetylene, and on days 14 as well as 15 (Figures 1A,C). Acetate consumption accelerated with incubation time. Acetate and CO2 concentrations from the different treatments were similar per timepoint (p > 0.05, ANOVA). 0.72 to 1.01 mM acetate were supplemented in total by the end of the incubation. Carbon recoveries based on total C-flow suggest that 56 and 83% of acetate carbon was oxidized to CO2 during phase I (6 days) and II (9 days), respectively (Figure 1 and Table 2), the non-recovered acetate carbon of 27–44% being indicative of assimilation.
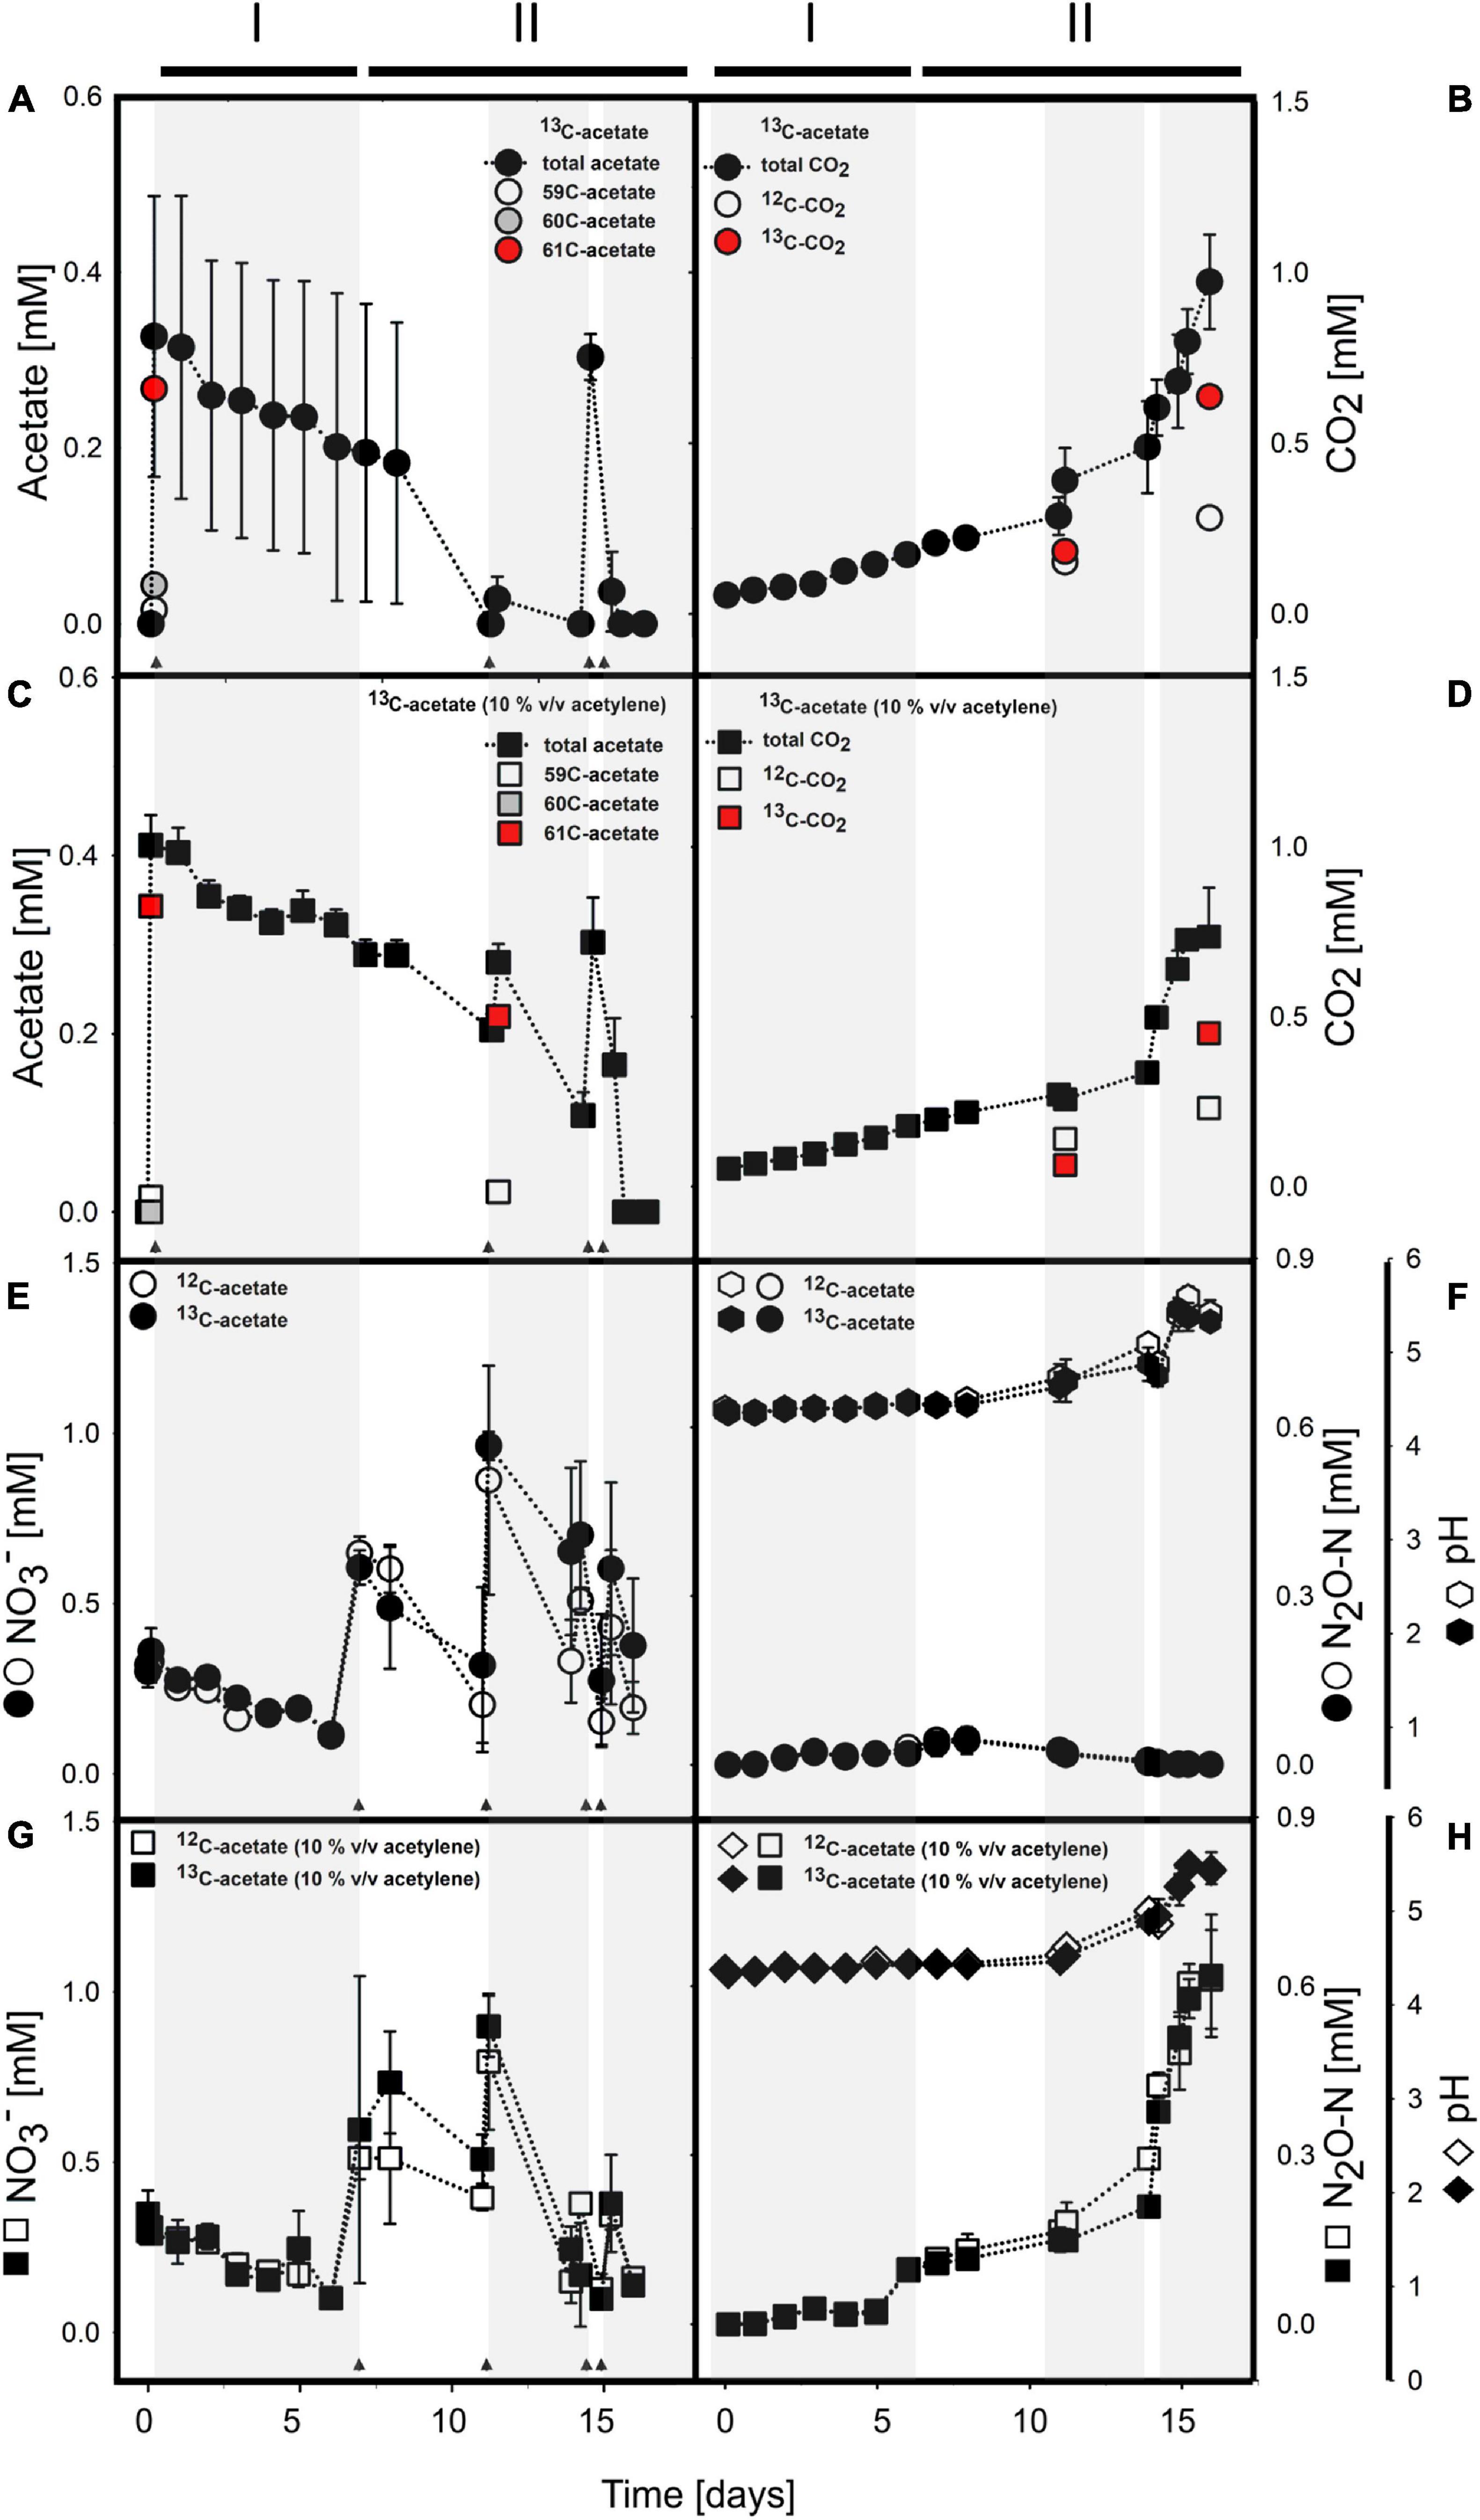
Figure 1. Acetate (A,C) and nitrate (E,G) consumption concomitant to CO2 (B,D) and N2O (F,H) production in anoxic incubations of acetate supplemented cryoturbated peat circle sediments without (A,B,E,F) and with (C,D,G,H) acetylene. pH is shown in panels (F) and (H). Arrows indicate time of acetate or nitrate supplementation. Shaded and non-shaded areas highlight different periods of nitrate consumption, and lines above the graphs indicate phases (see Table 2). (A–D) show 13C-acetate treatments only. For details on acetate and CO2 in 12C-acetate treatments, please refer to Supplementary Figure S1. (E–H) include data of 13C- and 12C-acetate treatments as indicated in the insert. 59C-acetate, unlabeled 12C2-acetate; 60C-acetate, half-labeled 13C1-acetate; and 61C-acetate, fully labeled 13C2-acetate. Values are means ± standard deviation of triplicate incubations except for isotope analyses where 1-3 values were obtained (see text for details).
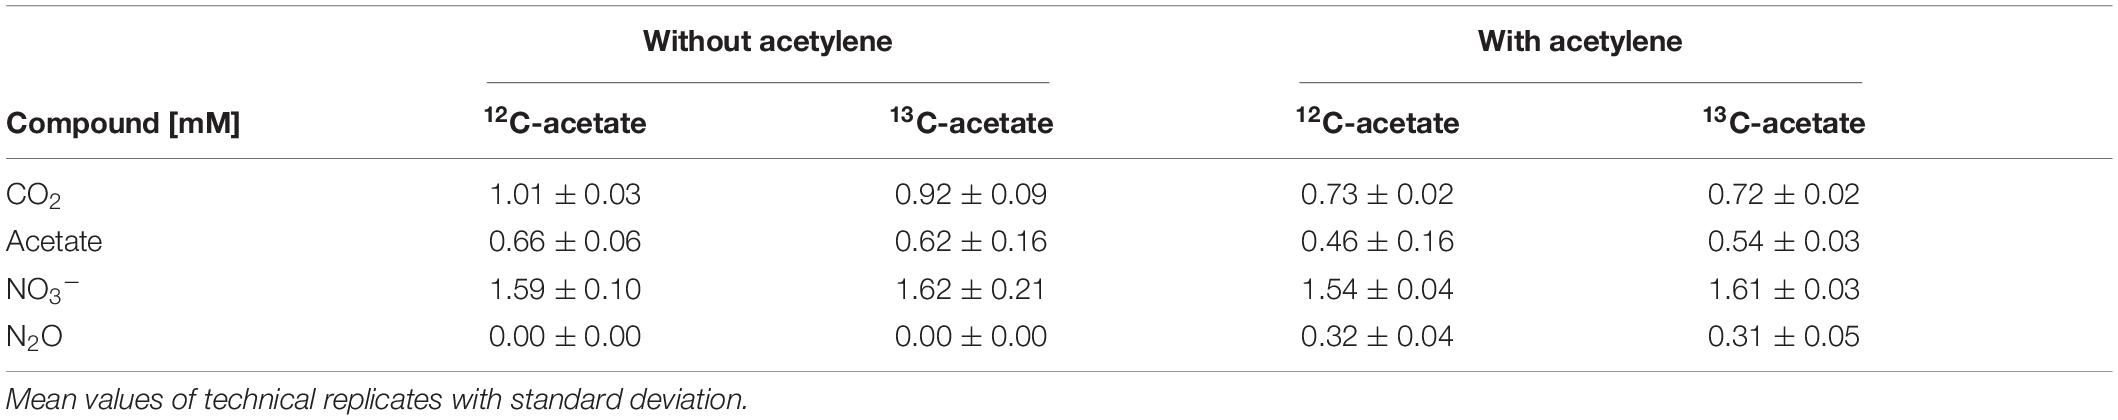
Table 1. Cumulated supplementation of acetate and nitrate, and cumulated production of carbon dioxide and nitrous oxide during incubations in treatments with and without acetylene.
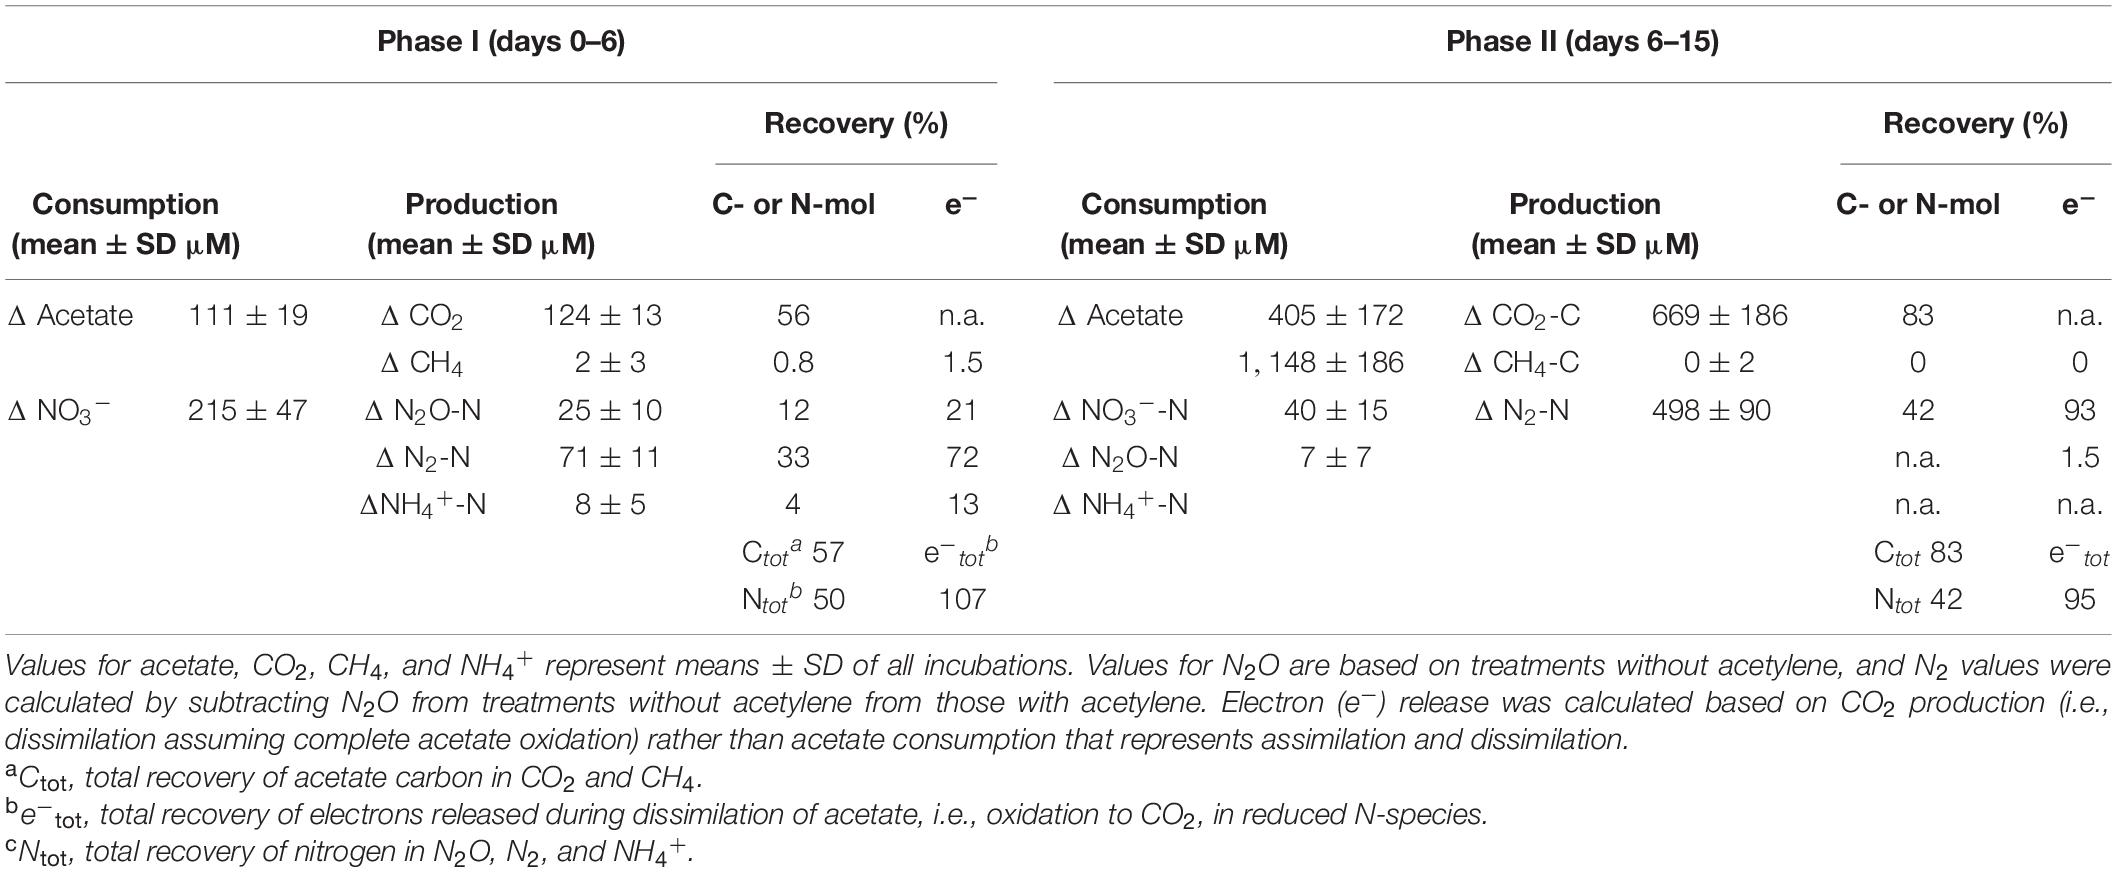
Table 2. Mass- and electron balances during anoxic incubations of cryoturbated peat circle sediments in the presence of supplemental acetate and nitrate (see Figure 1).
Mean proportions relative to total acetate of 13C2- (m/z = 61; fully labeled) and 13C1-acetate (m/z = 60) in 13C-acetate treatments at day 1 were 82.6 ± 1.2% and 12.9 ± 0.5%, respectively, suggesting a moderate portion of 12C- in treatments with 13C2-acetate (Figure 1A). Proportions were essentially the same for 13C-acetate treatments with acetylene, i.e., 78.3 ± 2.0% and 13.6 ± 7.9.0 for 13C2- (m/z = 61; fully labeled) and 13C1-acetate (m/z = 60), respectively (Figure 1C). Such proportions were the same at day 11 when 13C2- and 13C1-acetate was spot checked. At the end of incubation, acetate values were near the detection limit. Thus, the majority of data for isotopic composition of acetate in 13C-acetate treatments were not obtained. One replicate, however, showed an 13C2-acetate proportion of 99.6%. Volatile organic acids other than acetate representing typical fermentations products like propionate and butyrate were negligible (<1 μM) during and after incubation, hence 13C-labeled carbon in organic acids was not detectable. 12C2-acetate (m/z = 59; unlabeled) proportions of total acetate in 12C-acetate treatments after initial supplementation was 98.7 ± 1.9%, representing the natural proportion of the 13C-isotope. Acetate consumption and CO2 production in 12C-acetate treatments were highly similar to those in 13C-acetate treatments (Figures 1A,C, Table 1, and Supplementary Figure S2). Means from treatments irrespective of acetylene supplementation of acetate consumption rates (in μM day–1) were 17.92 ± 22.92 and 17.25 ± 20.42 for 13C- and 12C-acetate treatments, respectively, during phase I. Corresponding CO2-production rates (in μM day–1) were 20.42 ± 1.92 and 21.00 ± 2.17 for 13C- and 12C-acetate treatments, respectively. Acetate consumption and CO2 production rates increased during phase II and ranged from 15 to 530 μM day–1 for all treatments per re-feeding. Mean 13C- and 12C-acetate consumption rates of all treatments irrespective of acetylene supplementation during phase II were 173 ± 192 and 186 ± 224 μM day–1, respectively.
13CO2 was spot checked at days 11 and 16 (Figures 1B,D). CO2 of 13C-acetate treatments without and with acetylene had mean 13C-proportions of 54.7 ± 1.4%, and 31.1 ± 0.4%, respectively, at day 11. At the end of incubation at day 16, the mean 13C-CO2 abundance in 13C-acetate treatments without acetylene was 69.4 ± 3.4%. For 13C-acetate treatments with acetylene, only one replicate was measured with an 13C-proportion of 66.2%.
Acetate-Driven Electron Flow and pH
Acetate consumption was concomitant to consumption of endogenous nitrate without apparent delay (Figure 1). Endogenous nitrate was depleted within 6 days of incubation, which was similar in all treatments (phase I; Figures 1E,G and Table 2). Nitrate was the most abundant endogenous inorganic electron acceptor detected in cryoturbated peat sediments and approximated 300 μM (Figures 1E,G). Sulfate and iron(II) were almost always below the detection limit in all treatments, suggesting that sulfate and iron respiration were negligible for electron flow. Initial nitrate consumption was concomitant to the production of minor amounts of N2O in the absence of acetylene in phase I when the pH was stable at in situ levels of 4.4 (Figures 1E,F). Larger quantities of N2O were produced in the presence of acetylene (Figures 1E–H). Minor amounts of NH4+ in the μM range were likewise produced during phase I (Supplementary Figure S4). Recovery of nitrate N in N2-N was approximately 3- and 8-fold higher than in N2O and ammonium, respectively, at the end of phase I (Table 2). When nitrate was refed upon first depletion to concentrations reflecting endogenous levels (phase II), N2O was consumed together with nitrate and N2 was the primary reduced end product (Figures 1E–H and Table 2). Electron flow to N2 accounted for 72 and 93% of electrons released during acetate oxidation to CO2 after phase I and II, respectively. Mean N2O to (N2 + N2O) ratios were 92% during the first days of phase I, and dropped to 25 and <1% from days 6–13 and 14–18 during phase II, respectively. The pH remained in the acidic range but increased from 4.4 to 5.5 during phase II from day 11–14 onward, which was concomitant to an increase in N2O production and consumption in treatments with and without acetylene, respectively (Figures 1F,H). Indeed, the pH was significantly different from the start of incubation from day 11 and 14 on in treatments without and with acetylene, respectively (p < 0.05, ANOVA). Nitrate concentrations in all treatments were similar during the incubation period (p > 0.05, ANOVA). A total of about 1.5 mM NO3– was consumed during the incubation time (Table 1).
Stable Isotope Probing of Bacterial and Archaeal 16S rRNA
16S rRNA-SIP was applied to trace and identify Bacteria and Archaea thriving under nitrate reducing conditions, i.e., putative nitrate reducers and denitrifiers, which are capable of 13C-acetate assimilation in acidic peat circle sediments. DGGE of heavy and light fractions showed visible differences in banding patterns, suggesting distinct community composition in “heavy” and “light” 16S rRNA fractions, and successful 13C-labeling of 13C-acetate assimilating bacteria during incubation (Supplementary Figure S5).
An average of 26,152 ± 9,481 sequences and a mean Good’s coverage (Good, 1953) of 95.64 ± 0.9 % per sample were obtained for the bacterial communities characterized in triplicates. In total 9,923 genus-level OTUs (97% criterion) were retrieved. Alpha diversity measured by the Inverse Simpson index that covers both richness and evenness were highest for samples before incubation (Table 3). Archaeal communities characterized in triplicates (except for t0 heavy fraction, from which only two samples were obtained) had an average of 12,590 ± 6,669 sequences among all samples and a mean coverage of 96.4 ± 0.6% per sample. 6,818 archaeal OTUs were retrieved. Inverse Simpson indices of Archaea were lower than those of Bacteria for all samples (Tables 3, 4). The phyla Actinobacteriota (24.0 ± 2.4% in heavy and 30.2 ± 1.3% in light fraction) and Proteobacteria (30.8 ± 2.0% in heavy and 23.0 ± 2.1% in light fraction) with associated families were most prominent prior to incubation (Figure 2A and Supplementary Figure S6). Interestingly, Rhodanobacteraceae of the Gammaproteobacteria were detected at an overall relative abundance of 3‰. The classes Acidimicrobiia (8.6 ± 0.4% in heavy, 15.5 ± 0.3% in light fraction), Actinobacteria (7.7 ± 1.6% in heavy, 6.7 ± 0.3% in light fraction), Thermoleophilia (7.6 ± 0.6% in heavy and 8.0 ± 1.2% in light fraction), Alpha- and Gammaproteobacteria (19.1 ± 1.6% and 11.7 ± 0.9% in heavy and 19.9 ± 2.0% and 3.2 ± 0.1% in light fraction, respectively) of the two dominant phyla were prevalent (Supplementary Figure S6). Archaeal communities consisted almost exclusively of sequences affiliating with the class Nitrososphaeria of the phylum Crenarchaeota (former Thaumarchaeota). Nitrososphaeria included unclassified sequences, Nitrososphaeraceae, Nitrosotaleaceae, and Group 1.1c related sequences (Figures 2B,C and Supplementary Figure S8) and dominated with a relative abundance of 99.99 ± 0.01% across all treatments the overall archaeal community. Only one OTU was classified to the genus level, i.e., Cand. Nitrosocosmicus that accounted for <0.5% of all archaeal sequences. Interestingly, typical methanogenic Euryarchaeota were not detected. Thermoplasmatota related sequences (one OTU only) rarely occurred and accounted for 0.01% of sequences from all samples (Figures 2B,C). This OTU was classified as member of the Thermoplasmata and showed 86% 16S rRNA identity to Methanomassilicoccus luminyensis B10 (NR_118098.1). Most archaeal sequences were generally only distantly related to described species, highlighting the high degree of phylogenetic novelty of peat circle Archaea. Archaeal communities were essentially stable during the incubation and similar between treatments (Supplementary Figure S8).
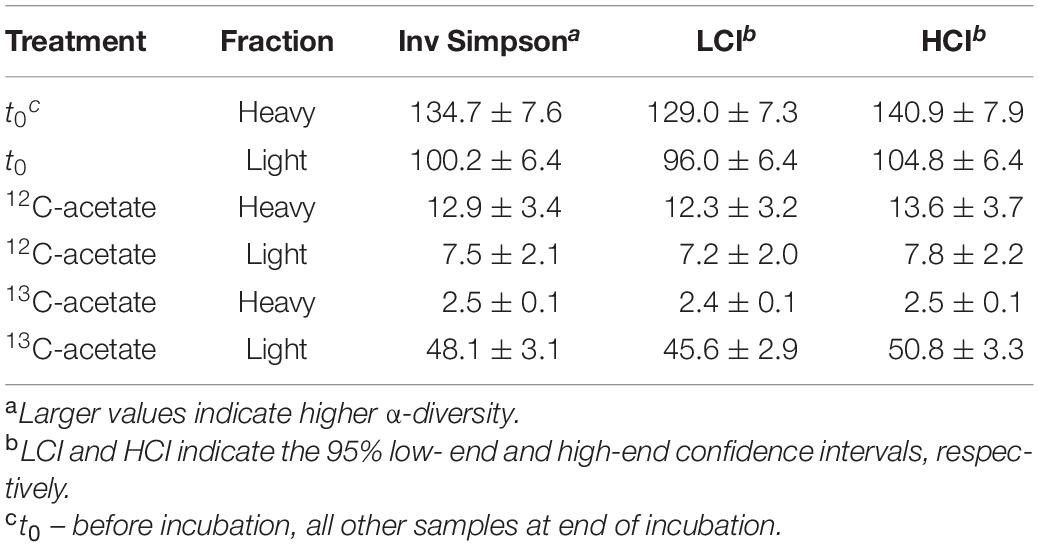
Table 3. Inverse Simpson values for bacterial 16S rRNA amplicon sequences. Mean values of biological replicates with standard deviation.
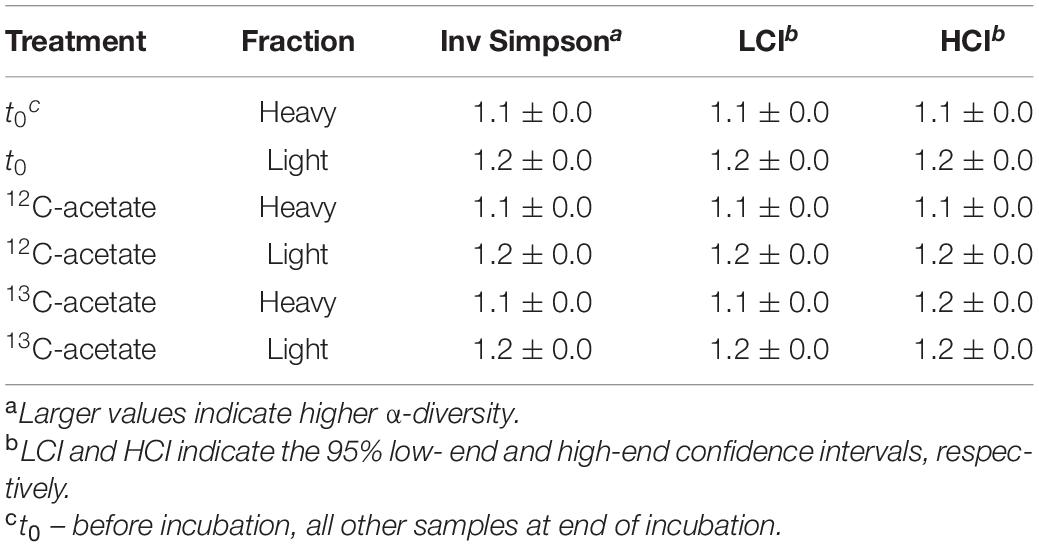
Table 4. Inverse Simpson values for archaeal 16S rRNA amplicon sequences. Mean values of biological replicates with standard deviation.
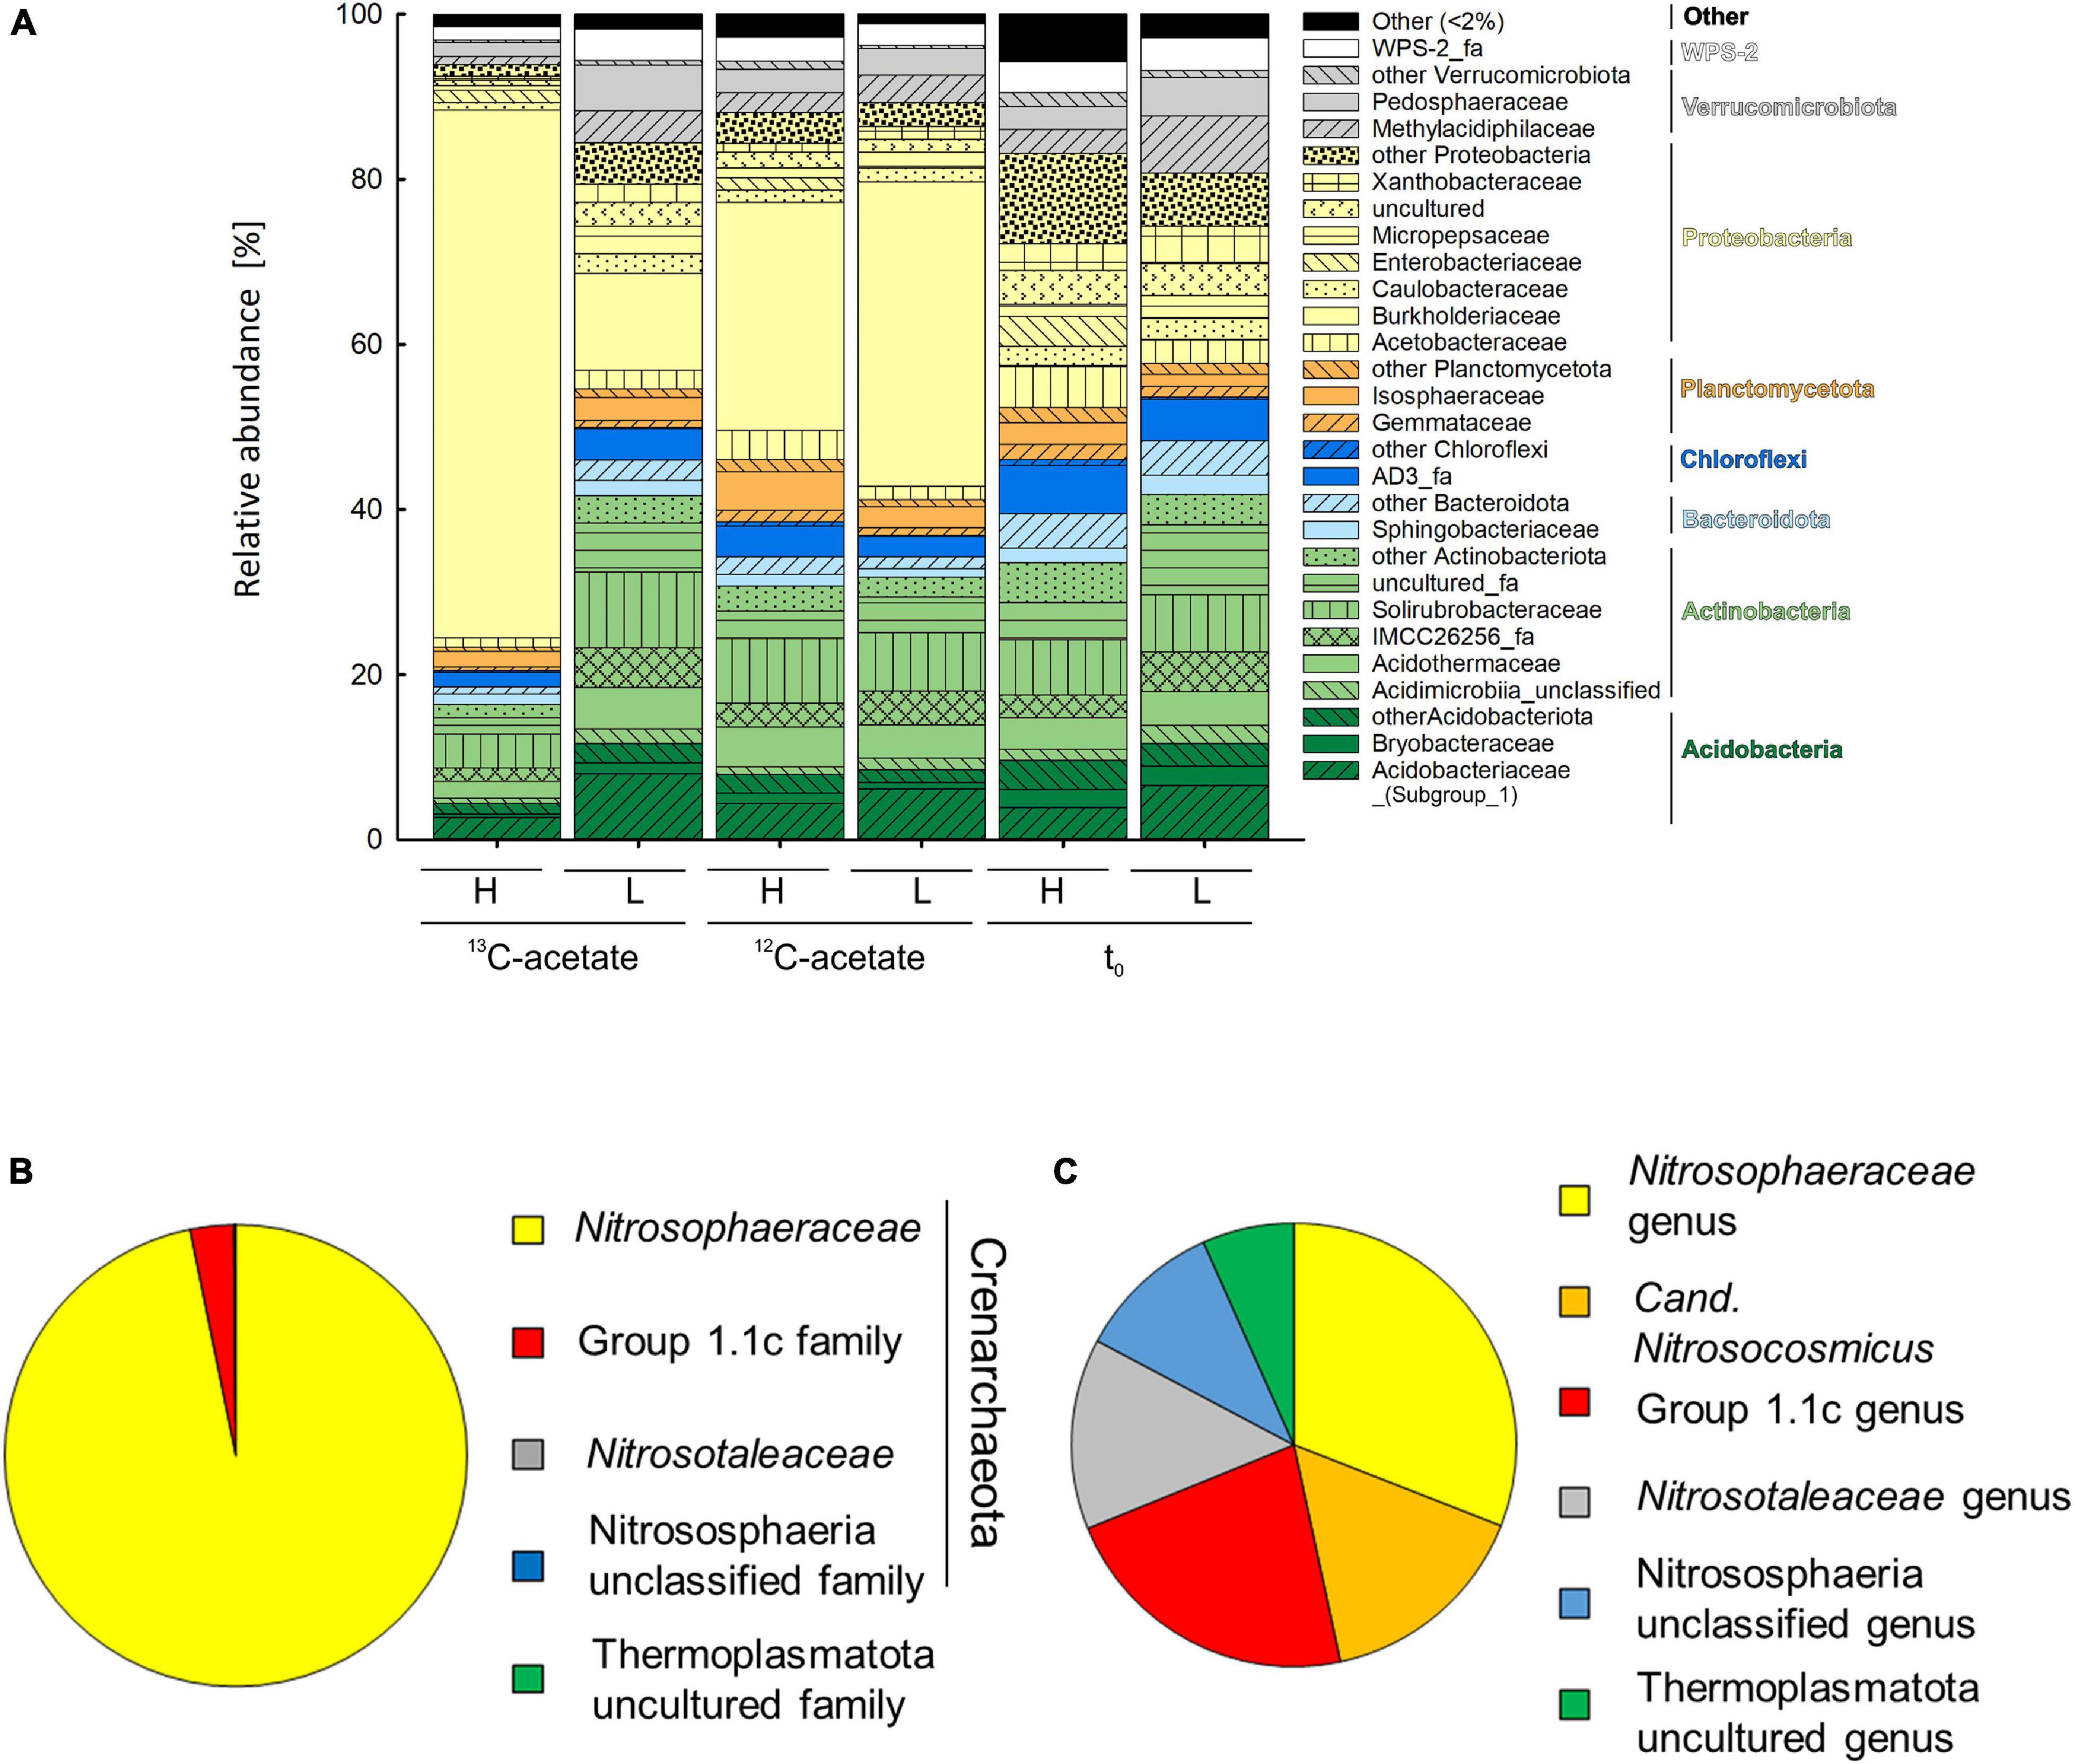
Figure 2. Mean relative abundance of bacterial families (>2% of relative abundance in at least one sample, A) delineated from analysis of density resolved 16S rRNA sequences retrieved from cryoturbated peat circle sediments prior to and after 16 days of anoxic incubation (see Figure 1). Values are means of triplicate incubations. Heavy (H) and Light (L) indicate fractions representing relative abundances of 13C-labeled and unlabeled 16S rRNA sequences after isopycnic centrifugation (see section “Materials and Methods” for further details) where sequences have been retrieved from. 13C- and 12C-acetate refer to treatments with 13C- and 12C-acetate, respectively. t0 indicates peat circle sediments prior to incubation. Relative abundances in amplicon libraries of archaeal family (B) and genus (C) level taxa in all samples are displayed. Please note that Log10 of sequence counts per genus are given to highlight rare genera (C). For a more detailed overview of archaeal taxa see Supplementary Figure S7.
In contrast, bacterial community structure changed during incubation, which was reflected in the dominant phyla retrieved after incubation. Bacterial communities were dominated by Proteobacteria primarily consisting of Gammaproteobacteria, with relative abundances of 31.5 ± 3.9 and 38.4 ± 4.7 in heavy and light fractions of 12C-acetate treatments, respectively, and relative abundances of 66.4 ± 2.7 and 14.7 ± 0.4 in heavy and light fractions of 13C-acetate treatments, respectively (Figure 2A and Supplementary Figure S7). OTU 1, associated with the Burkholderia-Caballeronia-Paraburkholderia (Burkholderiaceae; Burkholderiales; former Betaproteobacteriales) dominated in both 13C- and 12C-acetate treatments with relative abundances of up to 91% of all Gammaproteobacteria after 16 days of incubation, compared to a relative abundance of only about 1% of all Gammaproteobacteria before incubation (Figure 2A and Supplementary Figure S7). Such data suggest a strong enrichment of Gammaproteobacteria during incubation.
Density resolved bacterial communities after and prior to the incubation differed, while the replicates showed high similarities (Figure 3 and Supplementary Figure S7A). Differences in bacterial β-diversity evaluated by ANOVA did not differ significantly by replicates (p = 0.4871) but were different by treatment and fraction (p < 0.001). This was supported by principal coordinate analysis (PCoA), which revealed clustering by replicate and fraction of treatments (Figure 3A). The PCoA plot shows a clear separation on axis 1 explaining 68.1% of variability, and separates 13C-acetate heavy fractions from the associated light fractions, as well as from 12C-acetate treatments and t0 samples obtained prior to incubation. Heavy and light fractions of 12C-acetate control treatments clustered together with light fractions of 13C-acetate treatments (Figure 3B). Most communities retrieved prior to incubation (t0) formed a distinct cluster (Figure 3B). Heavy fractions from 13C-acetate treatments likewise showed a distinct clustering pattern, supporting successful 13C-labeling of 16S rRNA. PCoA did not show clear trends for Archaea (Supplementary Figure S9) with neither treatments, nor fractions clustering together. ANOVA revealed no significant difference between replicates (p = 1) or treatments and fractions (p > 0.091–0.714).
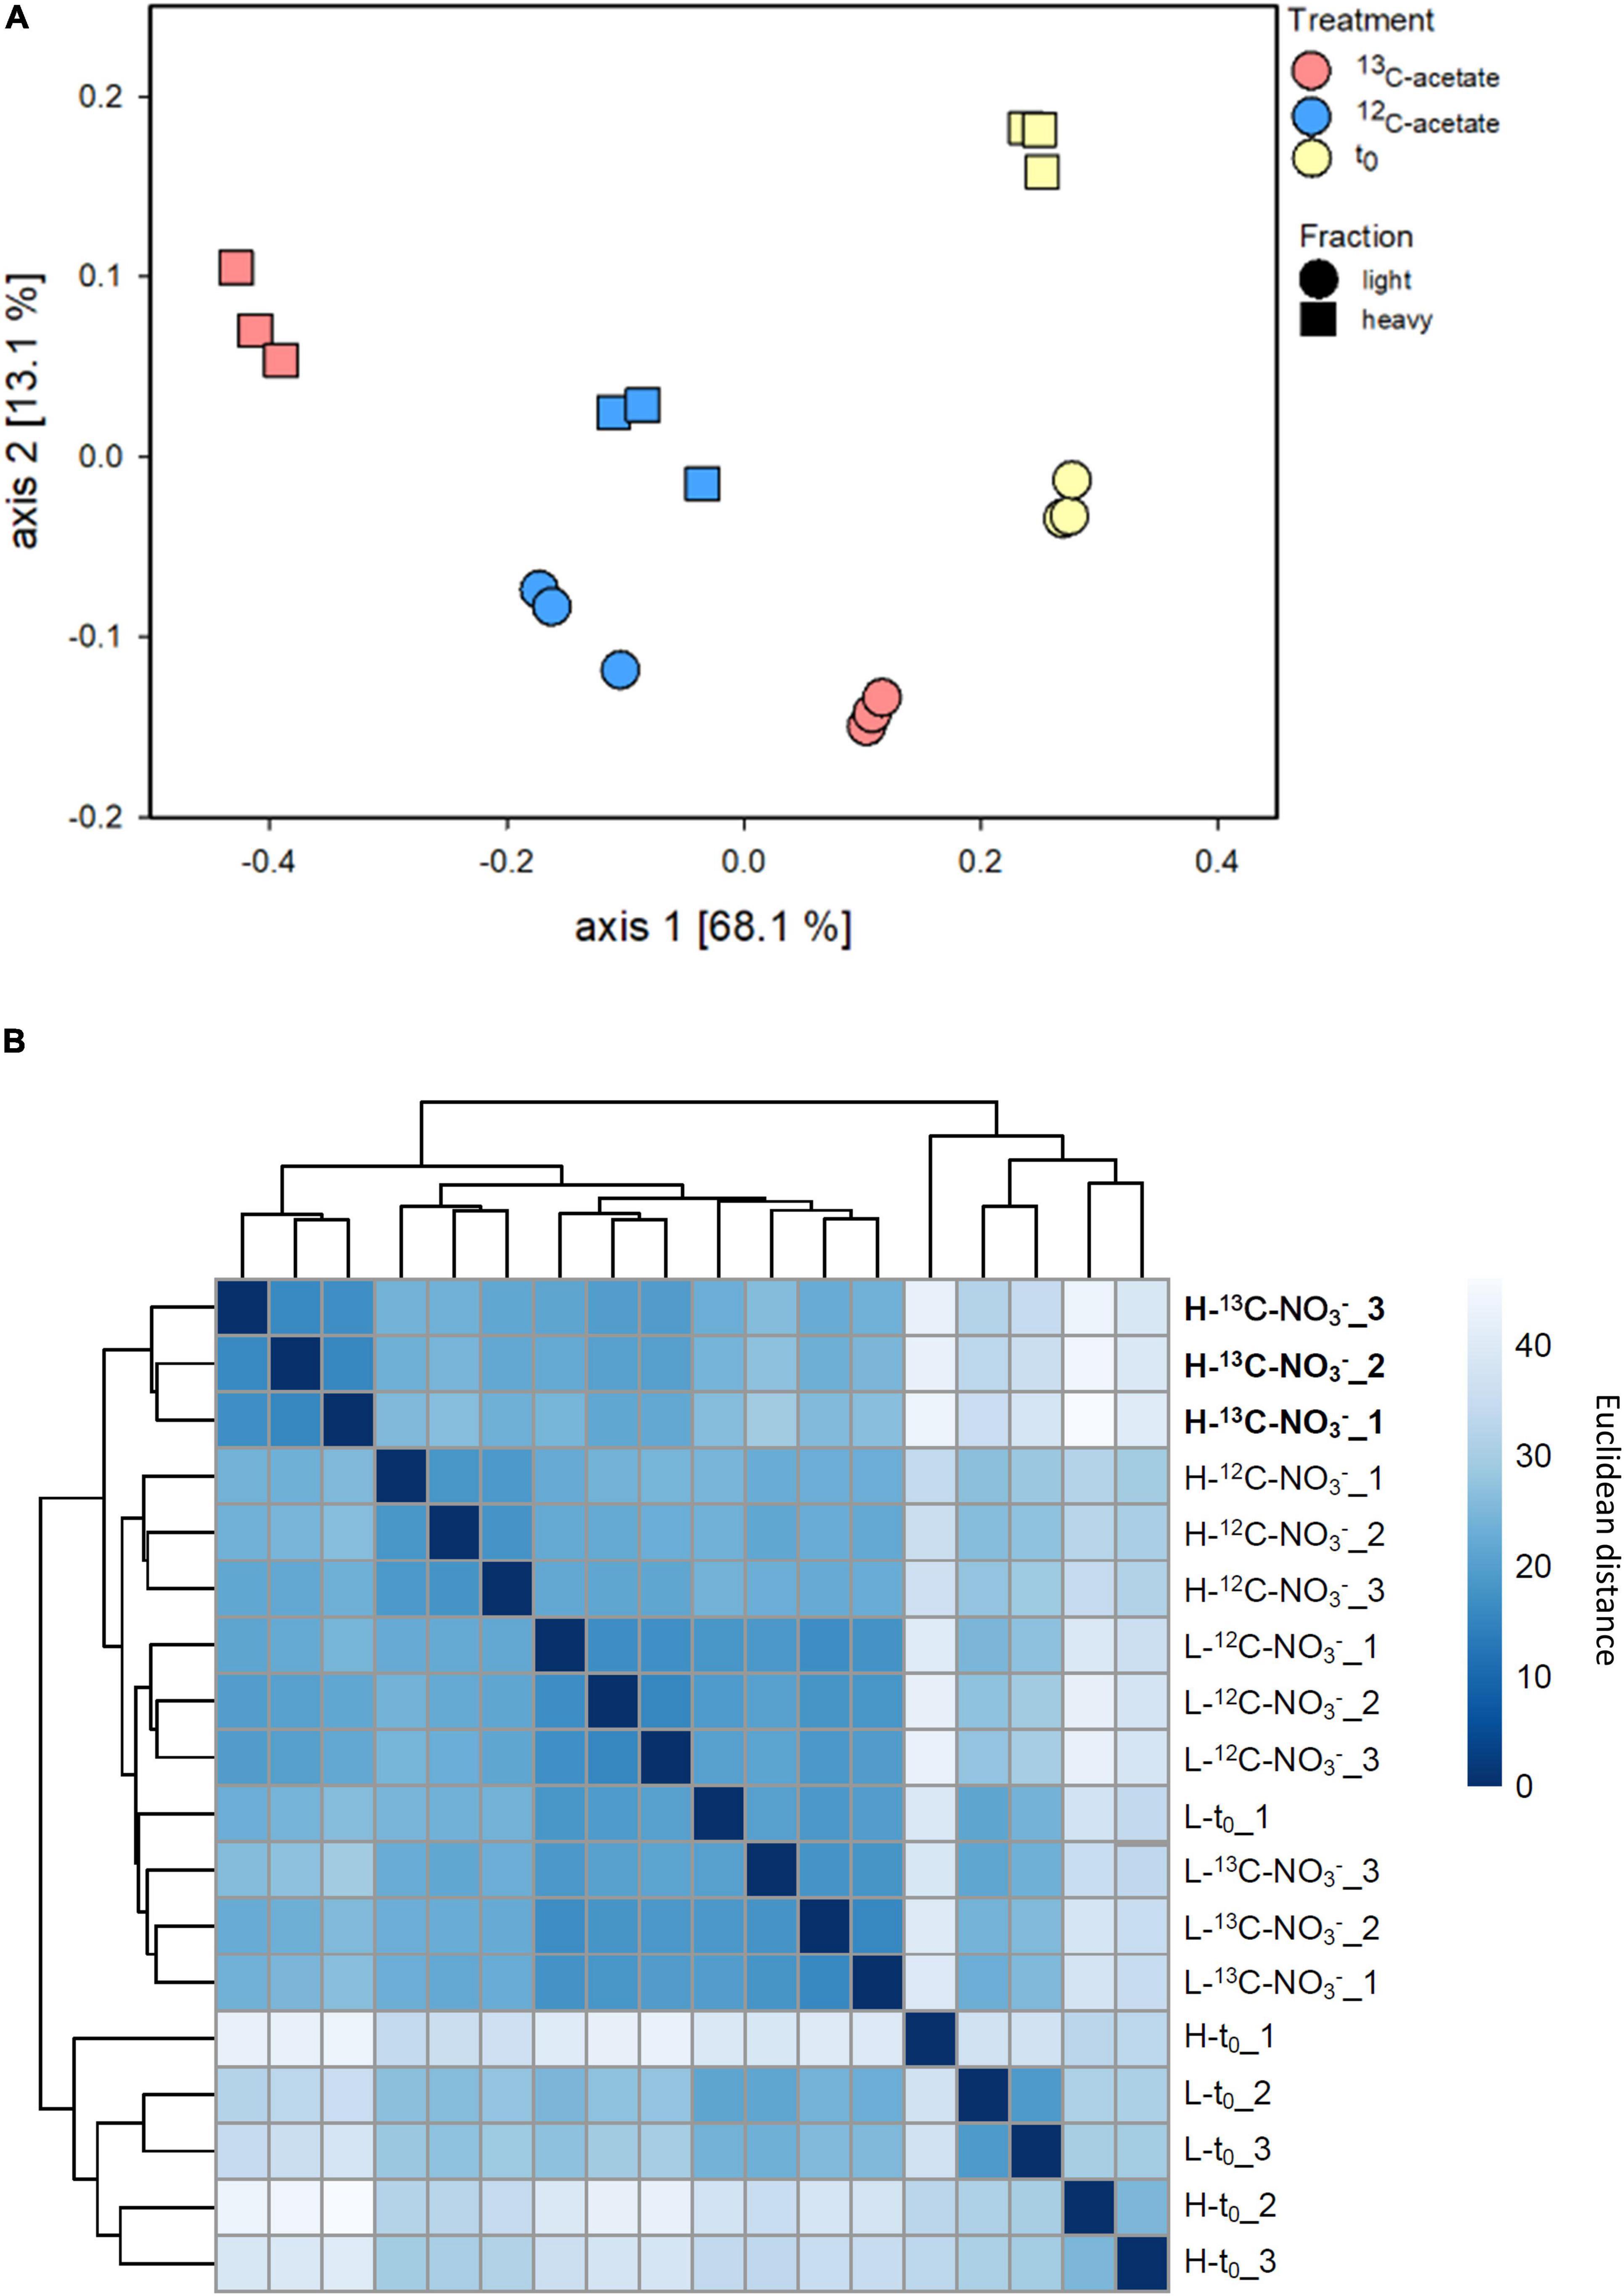
Figure 3. Principal coordinates analysis (PCoA; A) based onBray–Curtis dissimilarity calculated from relative abundance data of bacterial species-level OTUs from density resolved 16S rRNA sequences retrieved from cryoturbated peat circle sediments prior to (t0) and after 16 days of anoxic incubation (see Figure 1). Hierarchical heat map clustering is presented in panel (B). Color code indicates levels of dissimilarity. Sample code: H and L indicate heavy and light fractions, respectively; t0, 13C- and 12C- represent peat circle sediments prior to incubation, 13C- and 12C-acetate treatments, respectively. Numbers are indicative of replicate. Heavy fractions of treatemnts with labelled acetate are printed in bold.
Differential abundance values (Log2Fold change; p < 0.05) were computed between heavy and light fractions of each treatment and compared across all treatments (Figure 4). The only OTU that was significantly more abundant in the heavy fractions of 13C-acetate treatments compared to those of t0 samples and those of 12C-acetate treatments was OTU 1 affiliating with Burkholderiales (Burkholderiaceae, Burkholderia-Caballeronia-Paraburkholderia group). OTU 1 representatives showed 99% identity to 16S RNA genes of Paraburkholderia ginsengisoli NBRC 100965. Correlation network analysis indicated a positive interaction of Burkholderiaceae OTU 1 with many genus level taxa including Rhodanobacter spp. (98 and 96% identity of OTU 70 to Rhodanobacter ginsengisoli GR17-7, NR_044127, and Rhodanobacter denitrificans 2APBS1, NR_102497.1, respectively), and OTUs affiliating with Isosphaeraceae (95% identity of OTU 44 to Singulisphaera rosea, NR_116969.1), Solirubrobacteraceae (95% identity of OTU 3 to Conexibacter arvalis KV-962 NR_113264.1), as well as Gemmatimonadaceae (91% identity of OTU 447 to Gemmatimonas aurantiaca T-27, NR_074708; Figures 2A, 5A and Supplementary Table S1). The relative abundance of OTU 1 increased by several orders of magnitude in amplicon libraries during incubation and represented a dominant genus at the end of incubations (Figure 5B), and Isosphaeraceae (Planctomycetes) related OTUs were the second most important taxa in terms of increase in relative abundance during incubation (Figure 2A). In total, 35 positive and 5 negative correlations were observed for OTU 1 (Figure 5A and Supplementary Table S1). Rhodanobacter spp. were present in cryoturbated peat sediments prior to incubation, less affected by incubation than OTU 1, and showed 56 positive and 12 negative correlations with e.g., Burkholderiaceaea, Occallatibacter, Iamia, and Tundrisphaera (Figures 5A,C and Supplementary Table S1). Abundances of some archaeal OTUs were significantly different between heavy and light fractions within treatments as judged by Log2FoldChange, but did not show differences between 13C- and 12C-acetate treatments, demonstrating that Archaea did not assimilate significant amounts of acetate carbon.
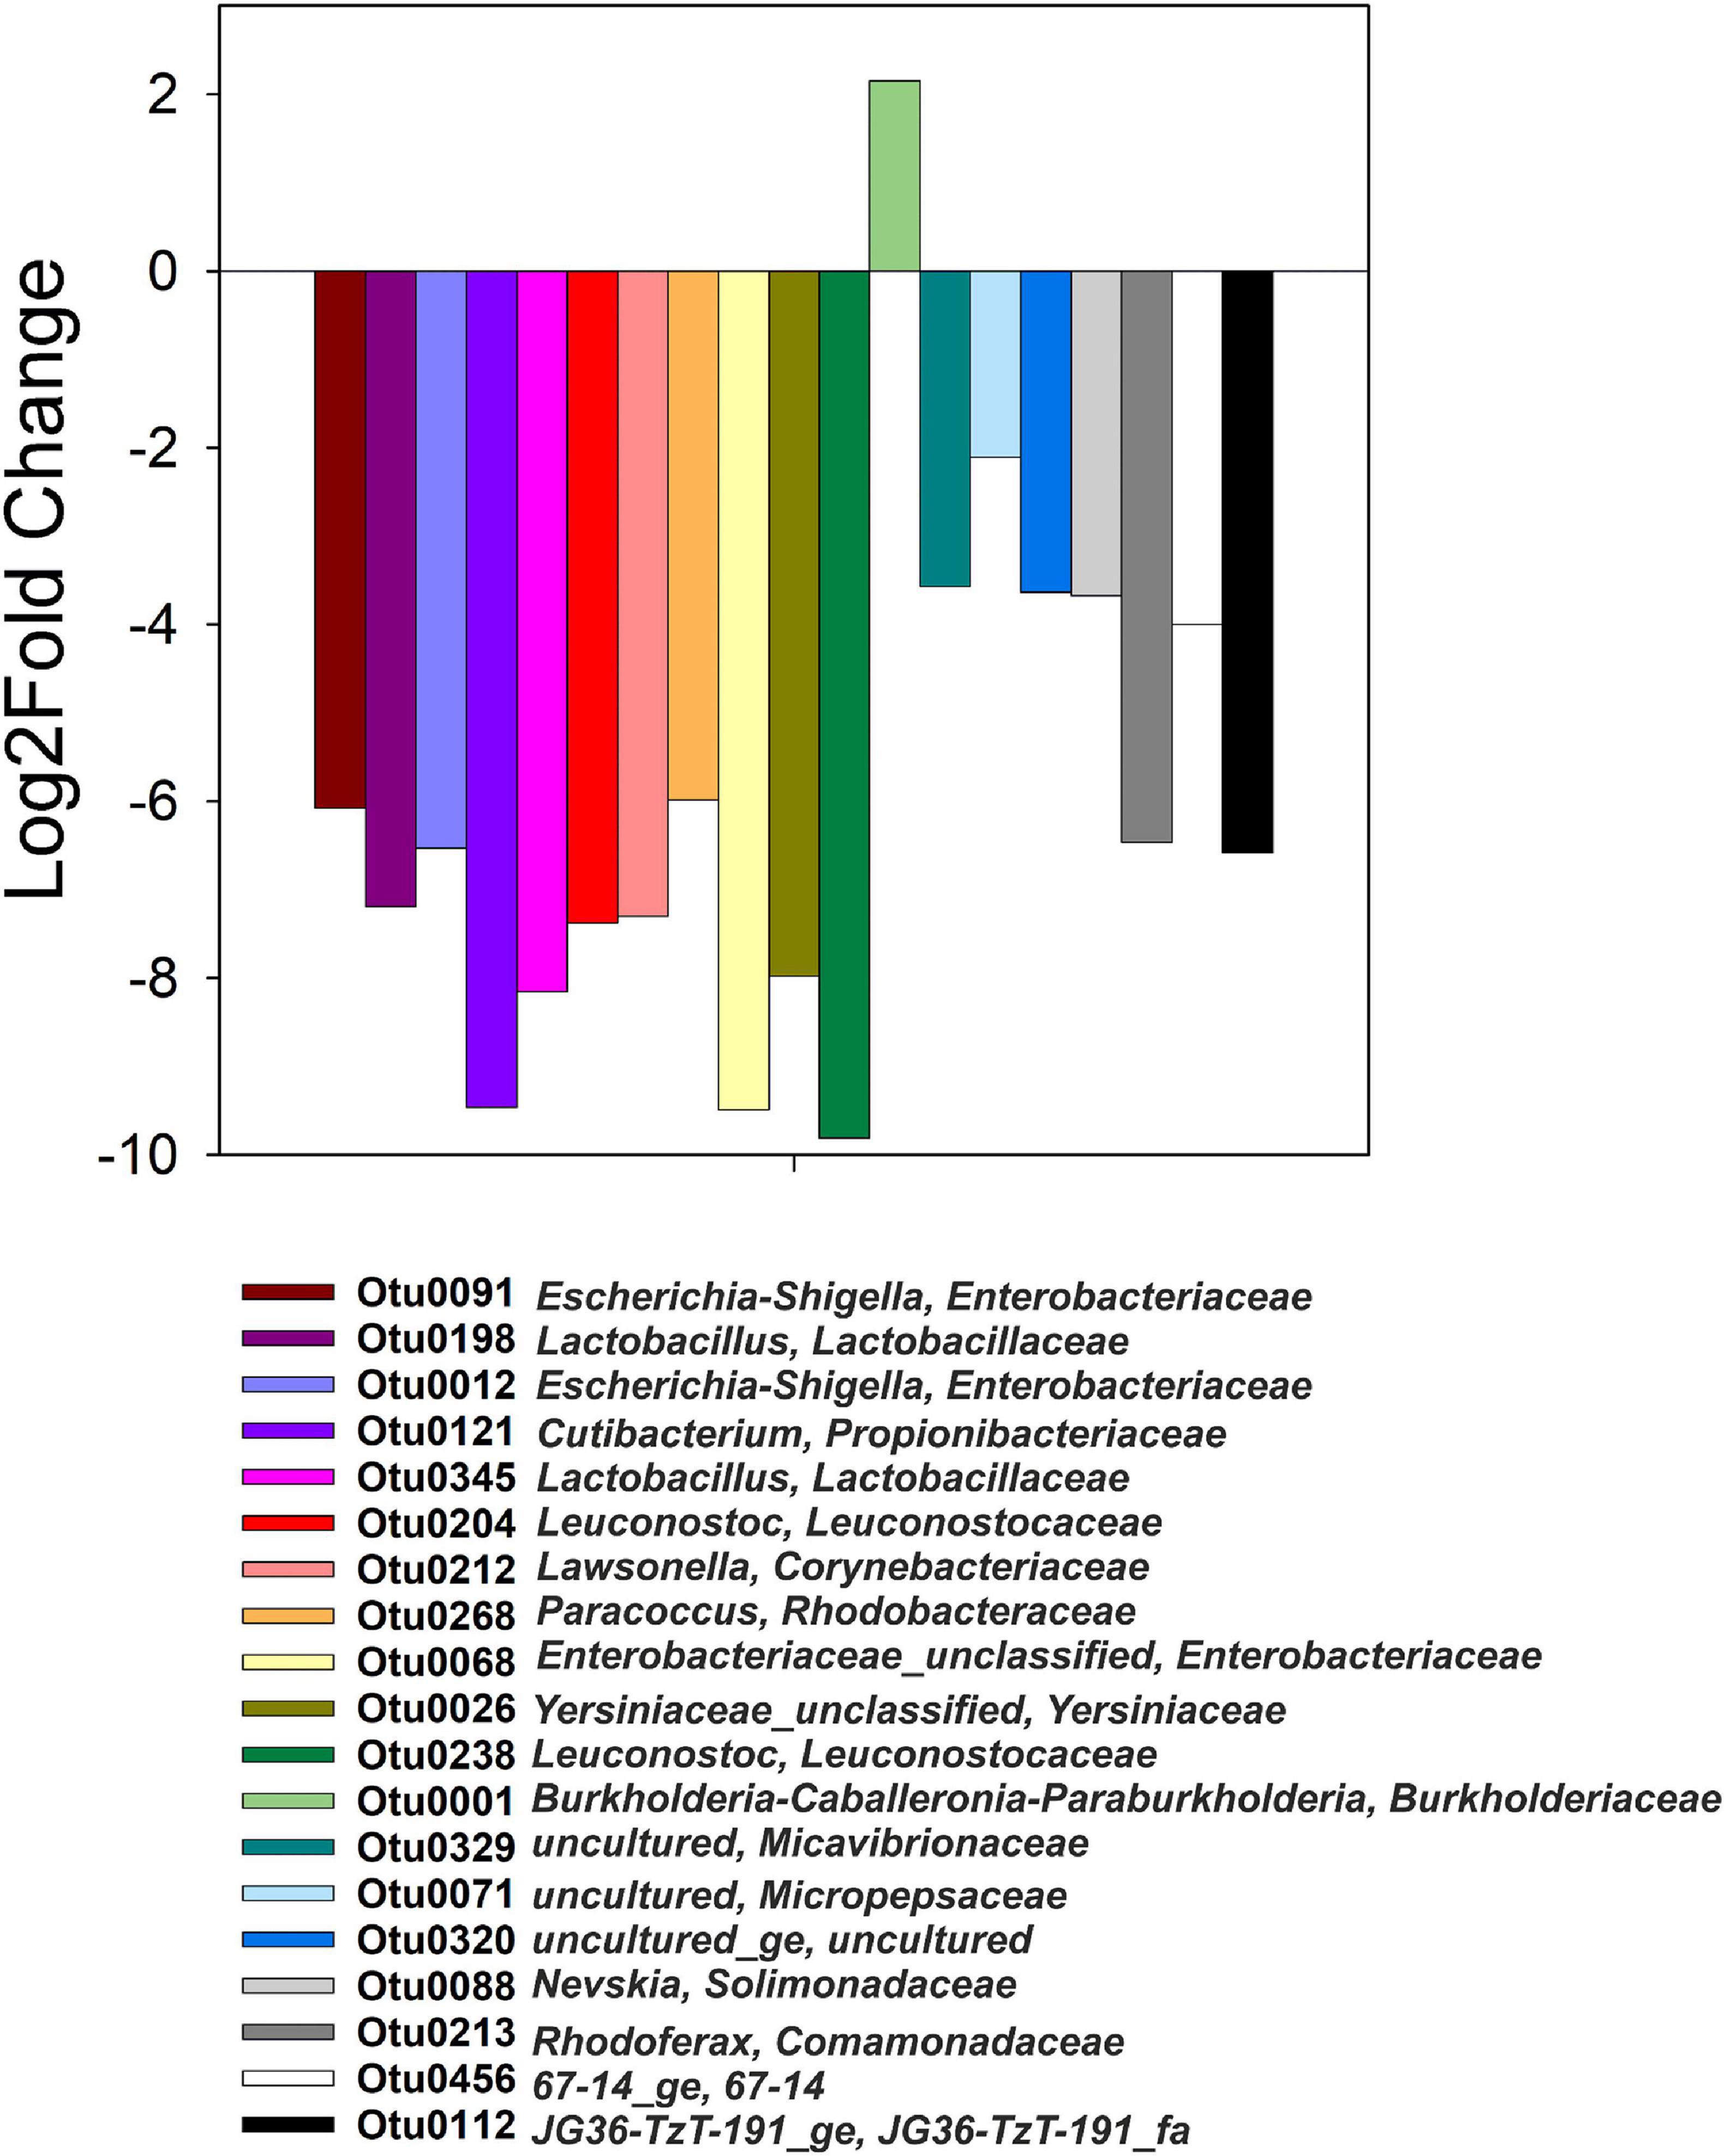
Figure 4. Genus-level taxa with significantly different relative abundances (p < 0.05) in heavy and light fractions of 13C-acetate treatments only, i.e., such taxa were not differentially abundant in heavy than light fractions at t0 or 12C-acetate treatments.
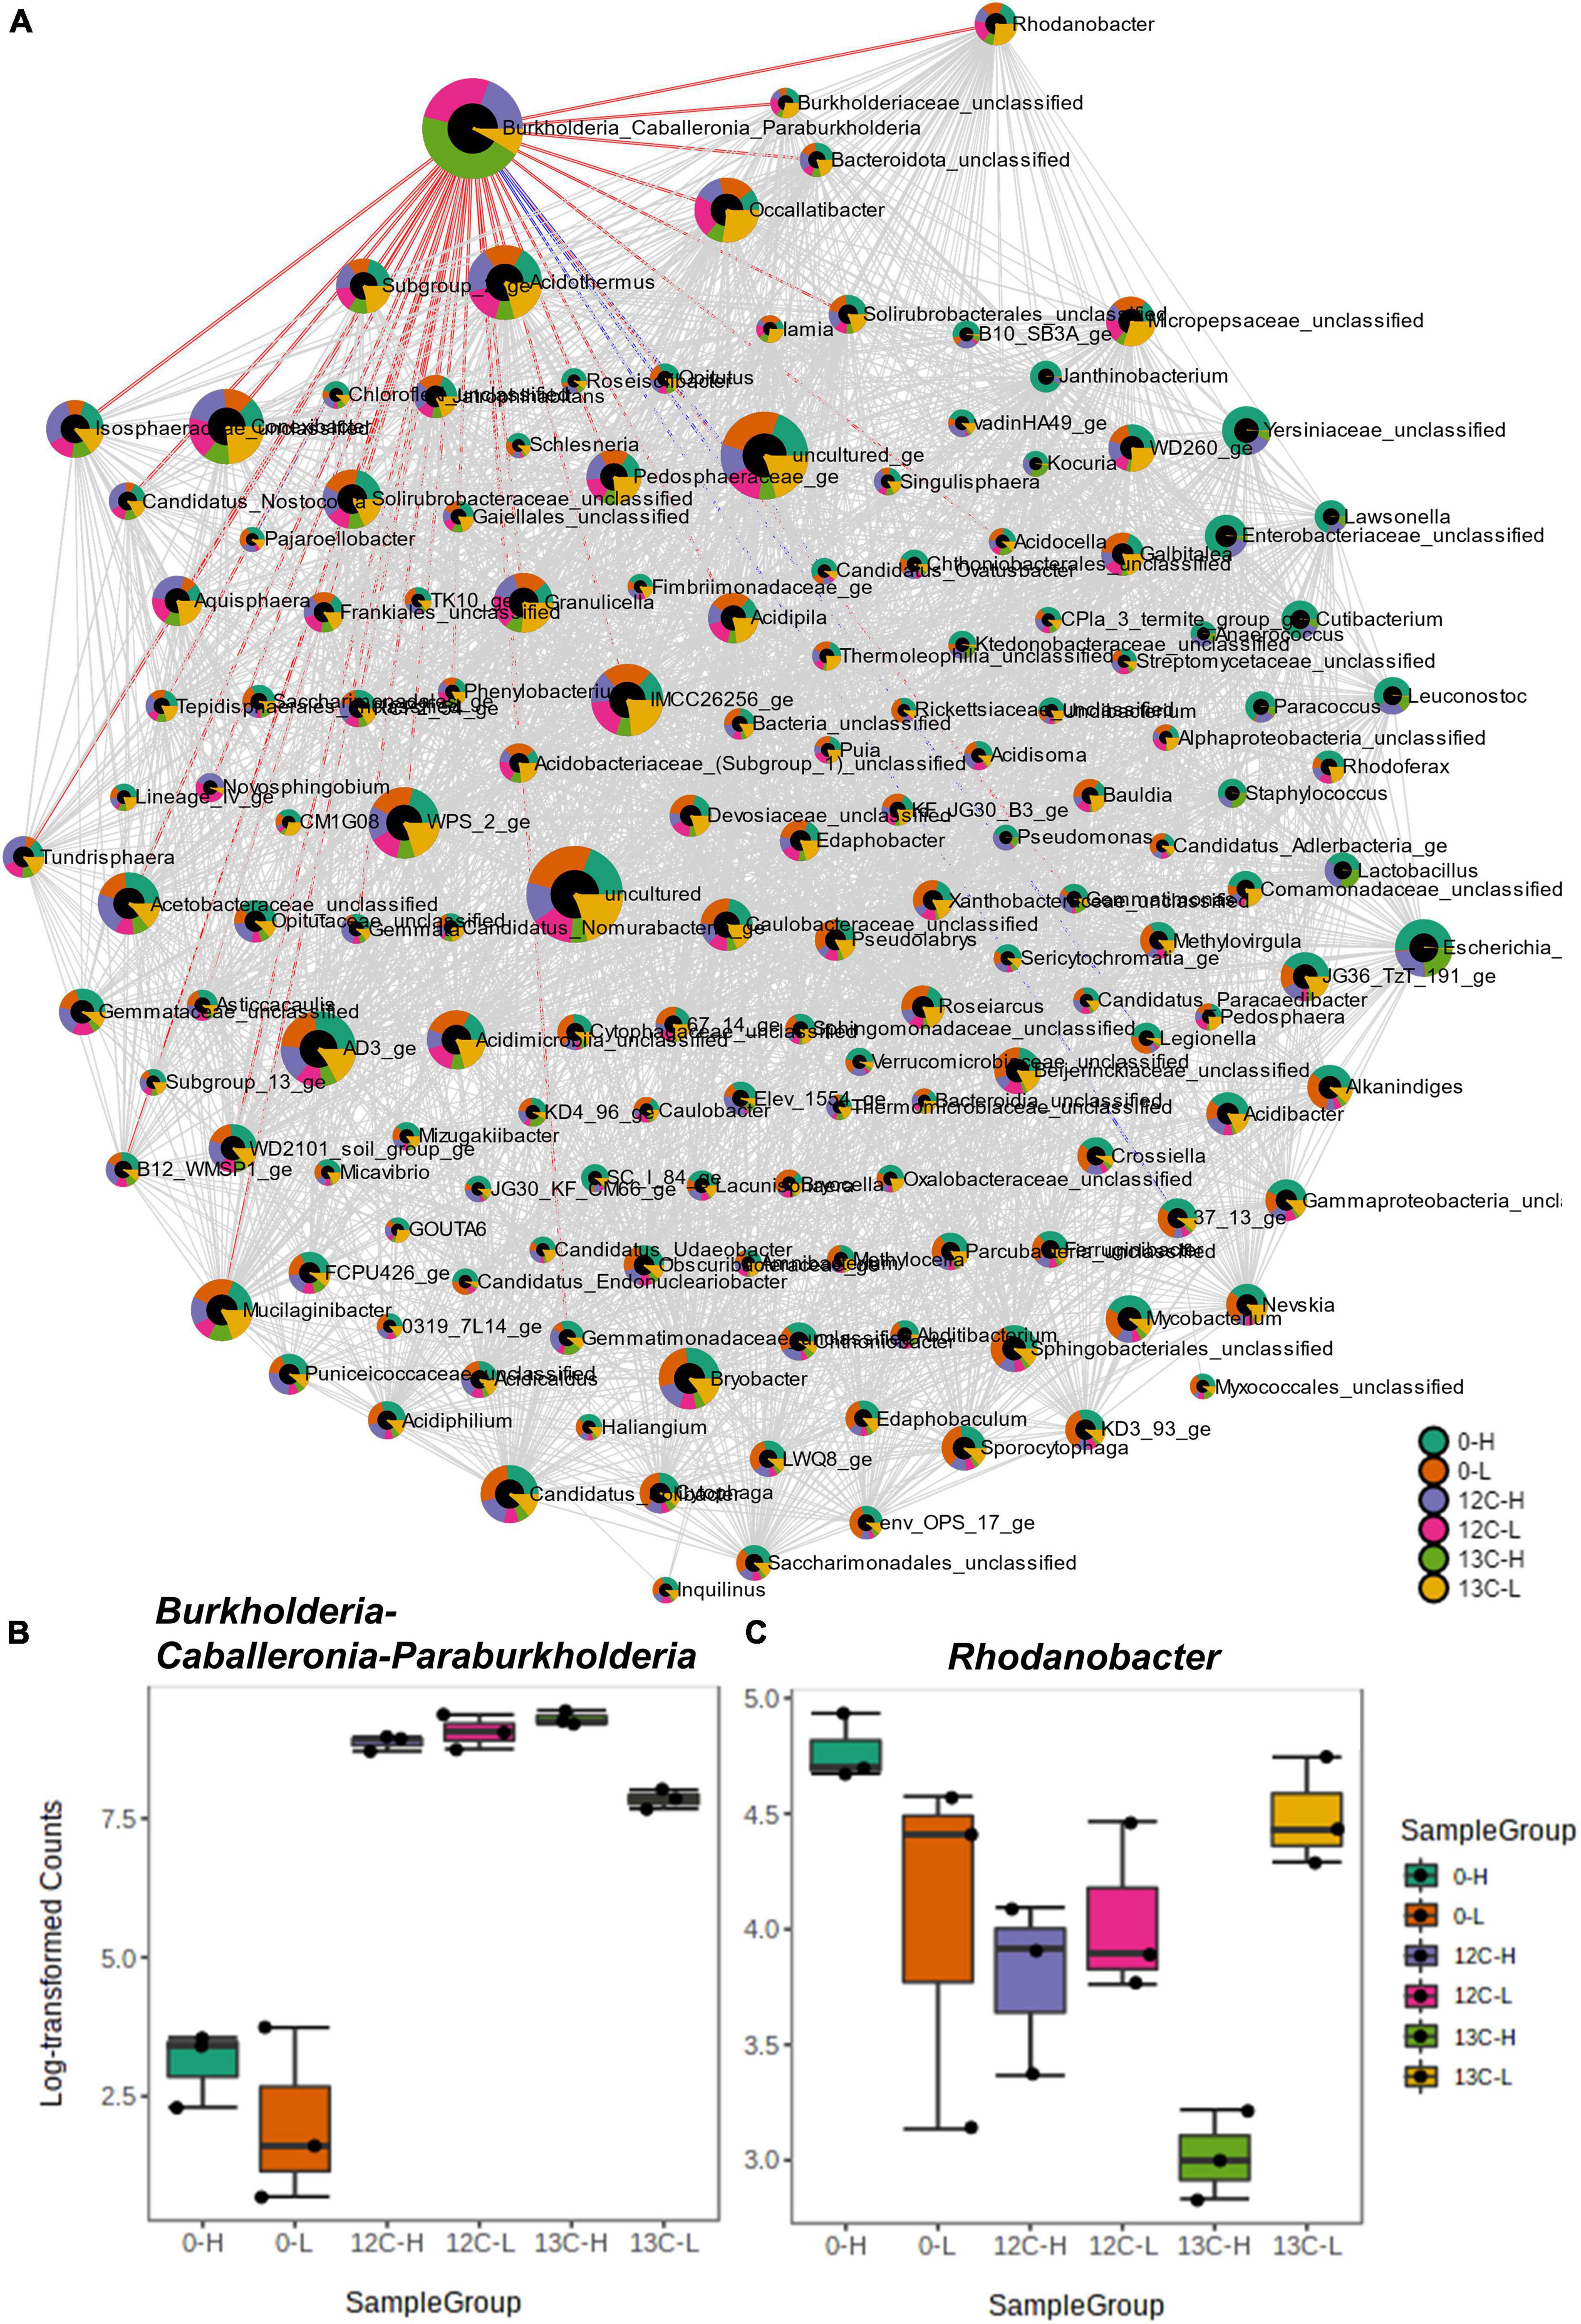
Figure 5. Correlation network analysis of density resolved 16S rRNA sequences retrieved from cryoturbated peat circle sediment incubations (see Figure 1) using the SparCC algorithm (A). Nodes represent genus-level taxa, and red and blue edges represent positive and negative correlations of labeled OTU 1 (Burkholderia-Caballeronia-Paraburkholderia). For more details on correlations please refer to Supplementary Table S1. Node size reflects taxon abundance and colors indicate the relative proportion per sample. The box plots (B,C) show the abundances of Burkholderia-Caballeronia-Paraburkholderia (B) and of one positively correlated taxon (Rhodanobacter spp.; C). Sample code: H and L indicate heavy and light fractions, respectively; 0, 13 C-, and 12C- represent peat circle sediments prior to incubation, 13C- and 12C-acetate treatments, respectively.
Discussion
Complete Denitrification in Acidic Peat Circle Sediment Microcosms
Cryoturbated peat circles of the subarctic tundra with an in situ pH 4 emit high amounts of N2O, which is in the range of heavy fertilized agricultural and tropical rainforest soils (Potter et al., 1996; Werner et al., 2007; Repo et al., 2009). Despite this high propensity to emit N2O in situ, and an abundant as well as an unusual, hitherto poorly described denitrifier community associated with anaerobic N2O production (Palmer et al., 2012), we demonstrated the capacity of the peat circle community to perform complete denitrification rather than nitrate ammonification at pH 4.4 with only minor intermediary accumulation of N2O (Figure 1, Table 2, and Supplementary Figure S4). Such an N2O consumption at low pH is in line with the previous detection of nosZ in peat circle sediments, evidence from peatlands suggesting ongoing N2O consumption at low pH, and thus the emerging view that acidic peatlands might temporarily act as a sink for N2O (Chapuis-Lardy et al., 2007; Kolb and Horn, 2012; Palmer et al., 2010, 2012). Thus, N2O reduction in acidic peat lands including cryoturbated peat circles is a possible mitigator of greenhouse gas emissions at low pH.
Regulation of Denitrification Associated Net N2O Production
Peat circles show a remarkably high total denitrification capacity at in situ pH and in situ near nitrate concentrations, which is much higher than that of many other peatlands, including pH neutral ones, suggesting an acid-tolerant denitrifier community (Figure 1; Palmer et al., 2010, 2012; Palmer and Horn, 2012, 2015). Acid-tolerant denitrifier communities and N2O consumption in situ at pH <6 were previously shown for other peat lands, demonstrating that our findings are in line with previous studies (e.g., Chapuis-Lardy et al., 2007; Palmer et al., 2010; Kolb and Horn, 2012). The increase in N2O consumption and denitrification rate in phase II of peat circle microcosms was associated with an increase in pH to 5.5, suggesting that the optimal pH for complete denitrification is higher than the in situ pH (Figure 1 and Table 2). Nevertheless, this is a remarkable finding that is in stark contrast to the well-studied neutrophilic model denitrifiers like Paracoccus denitrificans that accumulate N2O when pH falls below 7, and suggests that strains capable of N2O-reduction at pH <6 are more important than previously thought (Bergaust et al., 2010; Liu et al., 2014; Lycus et al., 2017). Evidence for microbial N2O consumption at low pH comes from few isolates of the genus Rhodanobacter capable of N2O reduction at pH 4 to 5.7, and the detection of Rhodanobacter sp. in this study (Figure 5C; Van Den Heuvel et al., 2010; Prakash et al., 2012; Lycus et al., 2017). Notably, one of such strains reduced N2O to N2 at pH 5.7, but not at more neutral or acidic pHs tested, suggesting the existence of a small ecological niche in terms of pH optimum for N2O reduction for certain acid-tolerant N2O reducers The formation of more pH neutral microsites in local denitrification “hot spots” during peat storage or during microcosm incubations, where functional N2O reductases of “classical” denitrifiers might have developed represent alternative explanations for the observed N2O reduction capacities at low overall pH. However, although the existence of such pH-neutral “hot spot” microsites cannot be fully excluded, electron flow to N2O was of minor importance during the first day of incubation, and substantially increased during the course of the 16 day incubation (Figure 1 and Table 2). Such findings rule out the existence of large amounts of functional N2O reductases at the beginning of the incubation, i.e., at the end of the storage period. Regular shaking of microcosms and a high buffering capacity of peat material as indicated by the stable pH during phase I (Figures 1F,H) minimize the likelihood for the occurrence of pH neutral “hot spot” microsites during our incubations. Notably, the peat material is static in situ during the growing season, and has thus a higher probability than during our incubations to form pH neutral microsites, where classical functional N2O reductases might develop. However, large quantities of functional N2O reductases were absent as evidenced by the little initial electron flow to N2O in the peat material and high in situ N2O emission rates (Table 2 and Figure 1; Marushchak et al., 2011; Palmer et al., 2012). Thus, it is more likely that the observed N2O reduction at pH <6 can be explained by the existence of a truly acid-tolerant or acidophilic N2O-reducer community, rather than by the formation of more pH neutral microsites by clustering of active denitrifiers.
Consequently, low pH as a reason for the impairment ofN2O reduction in situ and a regulation of N2Ofluxes appears to be of minor importance for certain low pHenvironments. Interestingly, Palmer et al. (2012) investigated apparentMichaelis-Menten kinetics of nitrate-dependent denitrification inanoxic microcosms and found that peat circle denitrifiers weresaturated with less than half of the NO3– concentrations occurring in situ, and suggested a limitationof electron donor availability that restricts denitrification incryoturbated peat circles (Palmer et al., 2012). Expression of notableN2O reductase activity occurred at the end of phase I in ourexperiments (Figure 1), suggesting thatN2O consumers were stimulated by the incubation in thepresence of supplemental acetate. Regulation of N2O reduction by the availability of electron donors is well known for denitrifiers like the bacterial denitrifier Alcaligenes faecalis. A. faecalis immediately reduces accumulated NO2– and increases N2 production while not changing N2O production upon pulses of the electron donor acetate in steady state culture (Schalk-Otte et al., 2000). The increase of 13C2-acetate derived 13CO2 proportion from 50 to about 70% over time suggests that substantial amounts of endogenous carbon were utilized along with the supplemental acetate during phase I, and that microbially available endogenous carbon pools became more and more depleted during incubation. 13C2-Acetate derived 13CO2 represented most of the total CO2 at the end of phase II, suggesting a preferential mineralization (i.e., complete oxidation) of supplemental acetate during denitrification in peat circle sediments toward the end of the incubation. Such an acetate utilization was concomitant to increased N2 production, providing a link between acetate consumption and complete denitrification (Figure 1). In contrast, the endogenous carbon appears to support N2O production by denitrification in situ and is provided by slightly to moderately decomposed peat (H4-5 on the Von Post Scale) at a rather low C/N ratio of 24 (Marushchak et al., 2011). Humified organic matter and plant remnants containing hard to degrade lignocellulose, hemicellulose, polysaccharides, covalently bound amino acids, and aromatic moieties occur in peat and might fuel denitrification after hydrolysis or pre-oxidation (Black et al., 1955; Coulson et al., 1959; Martin and Manu-Tawiah, 1989; Kuder and Kruge, 2001). Due to such hard-to-degrade organic carbon (“slow release electron donors”), it is not surprising that microbial biomass N is substantially lower in the upper peat circles than in adjacent vegetated tundra peat (Voigt et al., 2017a, b). Low availability of electron donors, eventually reflected in a rather narrow C/N ratio, is well known to limit denitrification and favor N2O relative to N2 production (van Cleemput, 1998; Marushchak et al., 2011). Thus, combined results support the view that a limitation of microbe-available electron donors in cryoturbated peat circle sediments favors the release of N2O, despite the demonstrated potential of the microbial community for complete denitrification that might be unleashed by easily available electron donors (Figure 1).
Electron Flow and Active Archaeal Community Capable of Anaerobiosis
Complete denitrification rather than nitrate ammonification was the primary nitrate respiration pathway as indicated by the N-mass balance (Table 2). Alternative anaerobic respirations other than nitrate respiration were negligible, demonstrating the divergence of electron flow from the classical anaerobic food chain toward methane to denitrification (Table 2). This was in agreement with the absence of typical endogenous fermentation products, classical euryarchaeal methanogens, and a negligible number of Thermoplasmatota affiliated sequences (0.007%) that were distantly related to Methanomassilicoccus spp. (Figure 2). Methanomassilicoccus spp. represent a new group of recently discovered methylotrophic methanogens that occur in peatlands, suggesting the possibility that related Archaea of the same order were associated with the production of methane traces in peat circles (Borrel et al., 2013; Söllinger et al., 2016). Detection of the second most important group of Archaea represented by group 1.1c Crenarchaeota after 16 days of anoxic incubation suggest anaerobic capabilities of this group. Indeed, group 1.1c prefers low pH environments, was enriched with methane under oxic and anoxic conditions, frequently detected in peatlands, showed glutamate dependent growth, and was not capable of ammonia oxidation, suggesting a heterotrophic, facultative life style (Lehtovirta et al., 2009; Wüst et al., 2009; Bomberg et al., 2010; Schmidt et al., 2015; Weber et al., 2015). Thus, group 1.1c might play a role in cycling of organic nitrogen in peat circles.
Ammonia-Oxidizing Archaea Rather Than Bacteria as Major Sources of Nitrate
The by far greatest share of archaeal 16S rRNA sequences was represented by Crenarchaeota (former Thaumarchaeota) of the class Nitrososphaeria/family Nitrososphaeraceae. Such “Thaumarchaeota” were recently re-integrated into the phylum Crenarchaeota (Parks et al., 2018), and are well-known ammonia-oxidizing Achaea (AOA) that prefer ammonia at low concentration and environments with a low pH of less than 5.5 (De La Torre et al., 2008; Prosser and Nicol, 2008; Gubry-Rangin et al., 2010; Lehtovirta-Morley et al., 2011). AOA in permafrost-affected soils showed a high β-diversity of “Thaumarchaeota,” with niche differentiation of AOA clades following soil moisture and nitrogen content (Alves et al., 2013). N2O fluxes from unvegetated (sub)arctic peat soil surfaces in Finland and Siberia were in the range or even higher (76.8 μg N2O-N m–2 h–1) than from managed peatland soils from northern countries and showed a positive correlation with nitrate concentration of soils and amoA gene abundance (Siljanen et al., 2019; Hetz and Horn, 2021). Such amoA genes mainly affiliated with the Nitrosophaerales clades NS-gamma (NS-γ; distantly related to Nitrososphaera NS-α) and NS-zeta (NS-ζ; Cand. Nitrosocosmicus related), which is in agreement with our 16S rRNA data (Alves et al., 2018; Siljanen et al., 2019). Notably, gross nitrification rates were unaffected by inhibition of bacterial nitrification, which is in line with less than 0.01% of 16S rRNA sequences attributed to bacterial nitrifiers (i.e., Nitrosomonadaceae) in amplicon libraries in this study. This is well in agreement with the current view that ammonia-oxidizing Archaea are generally wide spread in permafrost affected acidic environments (reviewed in Hetz and Horn, 2021). Potential nitrite oxidizing bacteria (NOB) of the genera Nitrospira and Nitrobacter (0.008 and 0.001% relative abundance in 16S rRNA derived aplicon libraries, respectively) were detected. The genus Nitrospira has been found in low pH as well as cold environments, is widely distributed in (permafrost-)soils (reviewed in Hetz and Horn, 2021 and references therein), and might therefore be associated with nitrite oxidation to nitrate. Vertical fluctuating oxygen gradients in peat circles due to rainfall events, micro-gradients of oxygen across peat aggregates, and cryoturbation fueled mixing of peat might contribute to high in situ nitrification activities and transfer of nitrate and/or nitrite to denitrifiers. Indeed, along with the previously discovered generally high nitrification rates at the low in situ pHs, these findings highlight the importance of AOA for the provision of nitrite to nitrite oxidizers and/or denitrifiers, and thus as essential contributors to N2O fluxes from permafrost affected northern peatlands including cryoturbated peat circles (Siljanen et al., 2019).
Active Bacterial Community Capable of Anaerobiosis
Investigated bacterial communities from the microcosm experiment revealed high relative abundances of Actinobacteria and Alphaproteobacteria before supplementation and incubation of peat circle sediment. This is congruent with a high relative abundance of narG sequences affiliating with Actinobacteria, which clearly dominated the investigated community of nitrate reducers in this environment and accounted for up to 95% of the overall relative sequence abundance (Palmer et al., 2012). Interestingly, sequences affiliating with Conexibater sp. (Solirubrobacteraceae) that are known to grow via nitrate respiration, were third most abundant in amplicon libraries (Figure 2A; Seki et al., 2012). Nitrite reductase genes were indicative of Alpha- and Gammaproteobacteria including Rhizobia and Rhodanobacter sp. related sequences. Many nitrite reductase genes affiliated with Betaproteobacterales (Seki et al., 2012). Indeed, Xanthobacteraceae (Alphaproteobacteria/Rhizobiales/Rhodoplanes spp.) and Burkholderiaceae (Gammaproteobacteria/Betaproteobacteriales) were frequently detected on 16S rRNA level in cryoturbated peat circle (Figure 2A). Capabilities for dissimilatory nitrate reduction and denitrification are widespread among Burkholderiaceae and Rhodoplanes spp., suggesting a contribution to nitrate dissimilation and denitrification of such taxa (Oren, 2014; Mariñán et al., 2019). Alphaproteobacteria (mostly uncultured) and Betaproteobacteriales affiliated nosZ were retrieved from peat circle sediments, demonstrating the genetic potential of such organisms to consume N2O (Palmer et al., 2012). This is in line with the widespread occurrence of such nosZ I genes in arctic environments (reviewed in Hetz and Horn, 2021). However, the abundance of typical nosZ I genes was low in peat circle sediments, accounting for only 0.002% of 16S rRNA genes, thus suggesting a minor fraction of the bacterial community with the genetic potential for N2O reduction (Palmer et al., 2012). During incubation, the bacterial community structure shifted toward the Gammaproteobacteria that became the most abundant class, with sequences affiliating with Burkholderia-Caballeronia-Paraburkholderia. Closely related nosZ sequences retrieved from a comparable acidic palsa peat site in Finish Lapland were affiliated with Burkholderia pseudomallei (Palmer and Horn, 2012). Burkholderia-Caballeronia-Paraburkholderia correlated with Rhodanobacter sp. that include acid-tolerant nitrite- and N2O reducers (Lycus et al., 2017; Figure 5 and Supplementary Table S1), suggesting phylogenetically associated organisms as possible candidates for the reduction of N2O to N2 in peat circle sediments.
Key 13C-Acetate Assimilators During Complete Denitrification
OTU1 affiliating with Burkholderia-Caballeronia-Paraburkholderia represented the only, highly competitive acetate assimilator during denitrifying conditions as indicated by 13C-acetate SIP (Figure 4) that was likewise enriched on total RNA level (Figure 2A). Cross-feeding by 13C-labeled substrate derived intermediates of substrate degradation, heterotrophic and autotrophic 13CO2 fixation as well as mineralization of 13C-labeled decaying microorganisms that primarily consumed the 13C-labeled substrate are well known issues when applying stable isotope probing (Neufeld et al., 2007). However, the use of low concentrations of essentially non-fermentable 13C2-acetate, the absence of organic acids like propionate and butyrate that might eventually be produced via carboxylation or condensation of acetate, respectively, intracellular metabolism of acetate via the tricarboxylic acid cycle, recoveries of app. 70% of the 13C2-acetate carbon in 13CO2, and the clear 13C-labeling of only one taxon (rather than a dilution of the label among many taxa) argue in favor of neglectable cross-feeding. Thus, Burkholderia-Caballeronia-Paraburkholderia affiliated taxa were important organisms for acetate-dependent carbon flow, primary acetate consumers, and associated with electron flow to nitrate under anoxic conditions in acidic peat circle sediments. Genomes of two new, recently isolated Caballeronia strains (Burkholderiaceae) originating from peat circles revealed the presence of multiple nitrate reductases, a nirBD encoded nitrite reductase, as well as the NO reductase NorV, suggesting that these isolates are nitrate ammonifiers with the capability to detoxify NO (Hetz et al., 2020). Genome sequences of other Burkholderia representatives showed the presence of nosZ as well as nirK genes (Sanford et al., 2012). Isolates from Sphagnum mosses that cover a Finnish acidic mire included isolates from Burkholderia sp. that have their optimum pH at around 5 and emit N2O, when NO3– was supplemented during incubation (Nie et al., 2015). All isolates possessed the narG gene for nitrate reduction, but amplification of either typical or atypical nosZ gene was not successful, suggesting these Burkholderia sp. as incomplete denitrifiers. Sequencing of 16S rRNA targeted DGGE bands from overall microbial community incubations of the same Sphagnum tissue retrieved from incubations at 15°C that showed N2O production, revealed Burkholderia sp. as major representatives of the bacterial community (Nie et al., 2015). Although associated with Burkholderiaceae via co-occurrence network analysis (Figure 5A), Rhodanobacter spp. affiliating sequences had low relative abundances in amplicon libraries from heavy fractions of 13C2-acetate treatments (Figure 5C), which is in agreement with the high relative abundance of Burkholderiaceae related sequences (Figure 5B), suggesting that peat circle Rhodanobacter spp. were unable to assimilate acetate. Indeed, acetate assimilation is a rare feature among members of this genus (Prakash et al., 2012). Such collective findings demonstrate that organisms of the Burkholderia-Caballeronia-Paraburkholderia group are widespread in peatlands, and include competitive, acid-tolerant acetate-consumers coupling acetate consumption to dissimilatory nitrate reduction and/or denitrification in peat circle sediments.
Conclusion
Acid-tolerant microbes from permafrost-affected cryoturbated peat circle sediment of the Arctic tundra were capable of complete denitrification at pH 4 in the presence of acetate as electron donor, demonstrating that N2O reduction was not drastically impaired by the low pH (Figure 1 and Table 2). Burkholderiaceae were most competitive acetate assimilators during denitrification, suggesting a prominent role of this taxon in dissimilatory nitrate reduction including denitrification, and demonstrating that very few key taxa can be responsible for most of the activities under certain conditions (Figures 1, 4). Rhodanobacter related taxa known for N2O-reduction at acidic pH and for the rare ability of members of the genus to assimilate acetate (Prakash et al., 2012; Lycus et al., 2017) co-occurred with Burkholderiaceae, suggesting a trophic inter-species interaction responsible for complete denitrification at acidic pH, e.g., via transfer of nitrite and/or N2O (Figure 5). However, peat circles emit large amounts of N2O, and increasing temperatures increase permafrost thaw, N-availability and emission of multiple greenhouse gases including N2O (Salmon et al., 2016; Voigt et al., 2017a, b). Peat circles are thus prone to respond to global change by increased N2O emissions. High denitrification associated N2O production potentials of peat circle sediments and other permafrost affected peatlands were previously shown and confirmed in this study, despite the high potential for N2O consumption demonstrated in this study (Figure 1; Palmer et al., 2012; Palmer and Horn, 2012). Such a paradoxon might be resolved when the rather low fraction of mineralized endogenous organic carbon is taken into account (Figures 1B,D), suggesting a possible limitation of denitrifiers in accessible electron donors yielding high N2O to (N2 + N2O) ratios due to an impairment of electron flow to N2O. More research is certainly needed to address this thesis in future studies.
Data Availability Statement
The datasets presented in this study can be found in online repositories. Datasets of bacterial and archaeal 16S rRNA gene sequences derived from amplicon sequencing were deposited at the NCBI sequence read archive under BioSample accession numbers SAMN14211851 to SAMN14211856 and SAMN14210576 to SAMN14210581 respectively, in BioProject PRJNA608855.
Author Contributions
SH and MH designed the SIP experiments, wrote the original manuscript, and interpreted data. SH set up microcosms and performed all laboratory work, if not stated otherwise. MH conceived the original idea and supervised all laboratory work. Both authors contributed to the article and approved the submitted version.
Funding
This work was financially supported by the Deutsche Forschungsgemeinschaft (DFG HO4020/3-1) and the Leibniz University Hannover, Germany.
Conflict of Interest
The authors declare that the research was conducted in the absence of any commercial or financial relationships that could be construed as a potential conflict of interest.
Acknowledgments
Dr. A. Poehlein is gratefully acknowledged for Illumina sequencing. We are thankful to Ph.D. C. Biasi for provision of peat circle samples. We also thank Prof. G. Gebauer for analysis of gas samples with GC-C-IRMS and Dr. S. Kernchen for analyzing organic acids via HPLC-ESI-MS. Thomas Kaupper is gratefully acknowledged for preparing DGGE analyses. This work was financially supported by the Deutsche Forschungsgemeinschaft (DFG, HO4020/3-1).
Supplementary Material
The Supplementary Material for this article can be found online at: https://www.frontiersin.org/articles/10.3389/fmicb.2021.628269/full#supplementary-material
Footnotes
- ^ https://www.arb-silva.de/download/arb-files/
- ^ https://mothur.org/blog/2020/SILVA-v138-reference-files/#legalese
- ^ https://usegalaxy.eu/
References
Albina, P., Durban, N., Bertron, A., Albrecht, A., Robinet, J. C., and Erable, B. (2019). Influence of hydrogen electron donor, alkaline pH, and high nitrate concentrations on microbial denitrification: a review. Int. J. Mol. Sci. 20, 5163. doi: 10.3390/ijms20205163
Alves, R. J. E., Minh, B., Urich, T., von Haeseler, A., and Schleper, C. (2018). Unifying the global phylogeny and environmental distribution of ammonia-oxidising archaea based on amoA genes. Nat. Commun. 9, 1517. doi: 10.1038/s41467-018-03861-1
Alves, R. J. E., Wanek, W., Zappe, A., Richter, A., Svenning, M. M., Schleper, C., et al. (2013). Nitrification rates in Arctic soils are associated with functionally distinct populations of ammonia-oxidizing archaea. ISME J. 7, 1620–1631. doi: 10.1038/ismej.2013.35
Bergaust, L., Mao, Y., Bakken, L. R., and Frostegård, A. (2010). Denitrification response patterns during the transition to anoxic respiration and posttranscriptional effects of suboptimal pH on nitrogen oxide reductase in Paracoccus denitrificans. Appl. Environ. Microbiol. 76, 6387–6396. doi: 10.1128/aem.00608-10
Bergaust, L., van Spanning, R. J. M., and Frostegård, Å, and Bakken, L. R. (2012). Expression of nitrous oxide reductase in Paracoccus denitrificans is regulated by oxygen and nitric oxide through FnrP and NNR. Microbiology 158, 826–834. doi: 10.1099/mic.0.054148-0
Biasi, C., Jokinen, S., Marushchak, M. E., Hämäläinen, K., Trubnikova, T., Oinonen, M., et al. (2014). Microbial respiration in Arctic upland and peat soils as a source of atmospheric carbon dioxide. Ecosystems 17, 112–126. doi: 10.1007/s10021-013-9710-z
Black, W. A. P., Cornhill, W. J., and Woodward, F. N. (1955). A preliminary investigation on the chemical composition of Sphagnum moss and peat. J. Appl. Chem. 5, 484–492. doi: 10.1002/jctb.5010050907
Bomberg, M., Montonen, L., and Timonen, S. (2010). Anaerobic Eury- and Crenarchaeota inhabit ectomycorrhizas of boreal forest Scots pine. Eur. J. Soil Biol. 46, 356–364. doi: 10.1016/j.ejsobi.2010.09.002
Borrel, G., O’Toole, P. W., Harris, H. M. B., Peyret, P., Brugère, J.-F., and Gribaldo, S. (2013). Phylogenomic data support a seventh order of methylotrophic methanogens and provide insights into the evolution of methanogenesis. Genome Biol. Evol. 5, 1769–1780. doi: 10.1093/gbe/evt128
Boylan, A. A., Stewart, D. I., Graham, J. T., and Burke, I. T. (2020). The behavior of low molecular weight organic carbon-14 containing compounds in contaminated groundwater during denitrification and iron-reduction. Geomicrobiol. J. 37, 486–495. doi: 10.1080/01490451.2020.1728442
Braker, G., and Conrad, R. (2011). Diversity, structure, and size of N2O-producing microbial communities in soils - what matters for their functioning? Adv. Appl. Microbiol. 75, 33–70. doi: 10.1016/b978-0-12-387046-9.00002-5
Bray, J. R., and Curtis, J. T. (1957). An ordination of the upland forest communities of Southern Wisconsin. Ecol. Monogr. 27, 325–349. doi: 10.2307/1942268
Breuer, L., Papen, H., and Butterbach-Bahl, K. (2000). N2O emission from tropical forest soils of Australia. J. Geophys. Res. Atmos. 105, 26353–26367. doi: 10.1029/2000jd900424
Castaldelli, G., Colombani, N., Vincenzi, F., and Mastrocicco, M. (2013). Linking dissolved organic carbon, acetate and denitrification in agricultural soils. Environ. Earth Sci. 68, 939–945. doi: 10.1007/s12665-012-1796-7
Cataldo, D. A., Maroon, M., Schrader, L. E., and Youngs, V. L. (1975). Rapid colorimetric determination of nitrate in plant tissue by nitration of salicylic acid. Commun. Soil Sci. Plant Anal. 6, 71–80. doi: 10.1080/00103627509366547
Chapuis-Lardy, L., Wrage, N., Metay, A., Chotte, J. L., and Bernoux, M. (2007). Soils, a sink for N2O? A review. Glob. Change Biol. 13, 1–17. doi: 10.1111/j.1365-2486.2006.01280.x
Christensen, T. R. (1993). Methane emission from Arctic tundra. Biogeochemistry 21, 117–139. doi: 10.1007/bf00000874
Cofman Anderson, I., and Levine, J. S. (1986). Relative rates of nitric oxide and nitrous oxide production by nitrifiers, denitrifiers, and nitrate respirers. Appl. Environ. Microbiol. 51, 938–945. doi: 10.1128/aem.51.5.938-945.1986
Coulson, C. B., Davies, R. I., and Khan, E. J. A. (1959). Chemical studies on upland peat in North Wales. J. Sci. Food Agric. 10, 209–217. doi: 10.1002/jsfa.2740100403
Cuhel, J., Simek, M., Laughlin, R. J., Bru, D., Cheneby, D., Watson, C. J., et al. (2010). Insights into the effect of soil pH on N2O and N2 emissions and denitrifier community size and activity. Appl. Environ. Microbiol. 76, 1870–1878. doi: 10.1128/aem.02484-09
Dallinger, A., and Horn, M. A. (2014). Agricultural soil and drilosphere as reservoirs of new and unusual assimilators of 2,4-dichlorophenol carbon. Environ. Microbiol. 16, 84–100. doi: 10.1111/1462-2920.12209
De La Torre, J. R., Walker, C. B., Ingalls, A. E., Könneke, M., and Stahl, D. A. (2008). Cultivation of a thermophilic ammonia oxidizing archaeon synthesizing crenarchaeol. Environ. Microbiol. 10, 810–818. doi: 10.1111/j.1462-2920.2007.01506.x
Denman, K. L., Brasseur, G., Chidthaisong, A., Ciais, P., Cox, P. M., Dickinson, R. E., et al. (2007). “Couplings between changes in the climate system and biogeochemistry,” in Climate Change 2007: The Physical Science Basis. Contribution of Working Group I to the Fourth Assessment Report of the Intergovernmental Panel on Climate Change, eds S. Solomon, D. Qin, M. Manning, Z. Chen, M. Marquis, K. B. Averyt, et al. (Cambridge: Cambridge University Press), 499–587.
Dhariwal, A., Chong, J., Habib, S., King, I. L., Agellon, L. B., and Xia, J. (2017). Microbiome Analyst: a web-based tool for comprehensive statistical, visual and meta-analysis of microbiome data. Nucleic Acids Res. 45, W180–W188.
Gadkari, D. (1984). Influence of the herbicides goltix and sencor on nitrification. Zentralbl. Mikrobiol. 139, 623–631. doi: 10.1016/s0232-4393(84)80056-6
Good, I. J. (1953). The population frequencies of species and the estimation of population parameters. Biometrika 40, 237. doi: 10.1093/biomet/40.3-4.237
Griffiths, R. I., Whiteley, A. S., O’Donnell, A. G., and Bailey, M. J. (2000). Rapid method for coextraction of DNA and RNA from natural environments for analysis of ribosomal DNA- and rRNA-based microbial community composition. Appl. Environ. Microbiol. 66, 5488–5491. doi: 10.1128/aem.66.12.5488-5491.2000
Gruber, S. (2012). Derivation and analysis of a high-resolution estimate of global permafrost zonation. Cryosph. Discuss. 6, 221–233. doi: 10.5194/tc-6-221-2012
Gubry-Rangin, C., Nicol, G. W., and Prosser, J. I. (2010). Archaea rather than bacteria control nitrification in two agricultural acidic soils. FEMS Microbiol. Ecol. 74, 566–574. doi: 10.1111/j.1574-6941.2010.00971.x
Harrigan, W. F., and McCance, M. E. (1966). Laboratory Methods in Microbiology. London: Academic Press.
Helen, D., Kim, H., Tytgat, B., and Anne, W. (2016). Highly diverse nirK genes comprise two major clades that harbour ammonium-producing denitrifiers. BMC Genomics 17:155. doi: 10.1186/s12864-016-2465-0
Herlemann, D. P. R., Labrenz, M., Jürgens, K., Bertilsson, S., Waniek, J. J., and Andersson, A. F. (2011). Transitions in bacterial communities along the 2000 km salinity gradient of the Baltic Sea. ISME J. 5, 1571–1579. doi: 10.1038/ismej.2011.41
Hetz, S. A., and Horn, M. A. (2021). “Microbial nitrogen cycling in permafrost soils: implications for atmospheric chemistry,” in Microbial Life in the Cryosphere and its Feedback on Global Change, eds S. Liebner and L. Ganzert (Berlin: Walter de Gruyter), 53–110. doi: 10.1515/9783110497083-004
Hetz, S. A., Poehlein, A., and Horn, M. A. (2020). Whole-genome sequences of two new Caballeronia strains isolated from cryoturbated peat circles of the permafrost-affected Eastern European Tundra. Microbiol. Resour. Announc. 9, 30–32.
Horn, M. A., Schramm, A., and Drake, H. L. (2003). The earthworm gut: an ideal habitat for ingested N2O-producing microorganisms. Appl. Environ. Microbiol. 69, 1662–1669. doi: 10.1128/aem.69.3.1662-1669.2003
Hugelius, G., Virtanen, T., Kaverin, D., Pastukhov, A., Rivkin, F., Marchenko, S., et al. (2011). High-resolution mapping of ecosystem carbon storage and potential effects of permafrost thaw in periglacial terrain, European Russian Arctic. J. Geophys. Res. 116, G03024.
Hunger, S., Schmidt, O., Hilgarth, M., Horn, M. A., Kolb, S., Conrad, R., et al. (2011). Competing formate- and carbon dioxide-utilizing prokaryotes in an anoxic methane-emitting fen Soil. Appl. Environ. Microbiol. 77, 3773–3785. doi: 10.1128/aem.00282-11
Jonasson, S., Michelsen, A., and Schmidt, I. K. (1999). Coupling of nutrient cycling and carbon dynamics in the Arctic, integration of soil microbial and plant processes. Appl. Soil Ecol. 11, 135–146. doi: 10.1016/s0929-1393(98)00145-0
Jones, C. M., Stres, B., Rosenquist, M., and Hallin, S. (2008). Phylogenetic analysis of nitrite, nitric oxide, and nitrous oxide respiratory enzymes reveal a complex evolutionary history for denitrification. Mol. Biol. Evol. 25, 1955–1966. doi: 10.1093/molbev/msn146
Kolb, S., and Horn, M. A. (2012). Microbial CH4 and N2O consumption in acidic wetlands. Front. Microbiol. 3:78. doi: 10.3389/fmicb.2012.00078
Kozich, J. J., Westcott, S. L., Baxter, N. T., Highlander, S. K., and Schloss, P. D. (2013). Development of a dual-index sequencing strategy and curation pipeline for analyzing amplicon sequence data on the MiSeq Illumina Sequencing Platform. Appl. Environ. Microbiol. 79, 5112–5120. doi: 10.1128/aem.01043-13
Kuder, T., and Kruge, M. A. (2001). Carbon dynamics in peat bogs: insights from substrate macromolecular chemistry. Global Biogeochem. Cycles. 15, 721–727. doi: 10.1029/2000gb001293
Kumar, A., Medhi, K., Fagodiya, R. K., Subrahmanyam, G., Mondal, R., Raja, P., et al. (2020). Molecular and ecological perspectives of nitrous oxide producing microbial communities in agro-ecosystems. Rev. Environ. Sci. Biotechnol. 19, 717–750. doi: 10.1007/s11157-020-09554-w
Lehtovirta, L. E., Prosser, J. I., and Nicol, G. W. (2009). Soil pH regulates the abundance and diversity of group 1.1c Crenarchaeota. FEMS Microbiol. Ecol. 70, 367–376. doi: 10.1111/j.1574-6941.2009.00748.x
Lehtovirta-Morley, L. E., Stoecker, K., Vilcinskas, A., Prosser, J. I., and Nicol, G. W. (2011). Cultivation of an obligate acidophilic ammonia oxidizer from a nitrifying acid soil. Proc. Natl. Acad. Sci. U.S.A. 108, 15892–15897. doi: 10.1073/pnas.1107196108
Li, D., Li, Z., Yu, J., Cao, N., Liu, R., and Yang, M. (2010). Characterization of bacterial community structure in a drinking water distribution system during an occurrence of red water. Appl. Environ. Microbiol. 76, 7171–7180. doi: 10.1128/aem.00832-10
Liu, B. B., and Frostegård, Å, and Bakken, L. R. (2014). Impaired reduction of N2O to N2 in acid soils is due to a posttranscriptional interference with the expression of nosZ. mBio 5, 2090–2095.
Love, M. I., Huber, W., and Anders, S. (2014). Moderated estimation of fold change and dispersion for RNA-seq data with DESeq2. Genome Biol. 15, 550.
Lueders, T., Manefield, M., and Friedrich, M. W. (2003). Enhanced sensitivity of DNA- and rRNA-based stable isotope probing by fractionation and quantitative analysis of isopycnic centrifugation gradients. Environ. Microbiol. 6, 73–78. doi: 10.1046/j.1462-2920.2003.00536.x
Lycus, P., Bøthun, K. L., Bergaust, L., Shapleigh, J. P., Bakken, L. R., and Frostegård, Å (2017). Phenotypic and genotypic richness of denitrifiers revealed by a novel isolation strategy. ISME J. 11, 2219–2232. doi: 10.1038/ismej.2017.82
Mariñán, N., Martínez, J. M., Leandro, T., and Amils, R. (2019). Draft genome sequence of Rhodoplanes sp. strain T2.26MG-98, isolated from 492.6 meters deep on the subsurface of the Iberian Pyrite Belt. Microbiol. Resour. Announc. 8, e70–e19. doi: 10.1128/MRA.00070-19
Martin, A. M., and Manu-Tawiah, W. (1989). Study on the acid hydrolysis of peat: composition of the extracts from Sphagnum peat. J. Chem. Technol. Biotechnol. 45, 171–179. doi: 10.1002/jctb.280450302
Marushchak, M. E., Pitkämäki, A., Koponen, H., Biasi, C., Seppälä, M., Martikainen, P. J., et al. (2011). Hot spots for nitrous oxide emissions found in different types of permafrost peatlands. Glob. Change Biol. 17, 2601–2614. doi: 10.1111/j.1365-2486.2011.02442.x
McInerney, M. J., and Bryant, M. P. (1981). Anaerobic degradation of lactate by syntrophicassociations of Methanosarcina barkeri and Desulfovibrio species and effect of H2 on acetate degradation. Appl. Environ. Microbiol. 41, 346–354. doi: 10.1128/aem.41.2.346-354.1981
Muyzer, G., de Waal, E. C., and Uitterlinden, A. G. (1993). Profiling of complex microbial populations by denaturing gradient gel electrophoresis analysis of polymerase chain reaction-amplified genes coding for 16S rRNA. Appl. Environ. Microbiol. 59, 695–700. doi: 10.1128/aem.59.3.695-700.1993
Muyzer, G., Teske, A., Wirsen, C. O., and Jannasch, H. W. (1995). Phylogenetic relationships of Thiomicrospira species and their identification in deep-sea hydrothermal vent samples by denaturing gradient gel electrophoresis of 16S rDNA fragments. Arch. Microbiol. 164, 165–172. doi: 10.1007/s002030050250
Nadelhoffer, K. J., Giblin, A. E., Shaver, G. R., and Laundre, J. A. (1991). Effects of temperature and substrate quality on element mineralization in six Arctic soils. Ecology 72, 242–253. doi: 10.2307/1938918
Neufeld, J. D., Dumont, M. G., Vohra, J., and Murrell, J. C. (2007). Methodological considerations for the use of stable isotope probing in microbial ecology. Microb. Ecol. 53, 435–442. doi: 10.1007/s00248-006-9125-x
Nie, Y., Li, L., Wang, M., Tahvanainen, T., and Hashidoko, Y. (2015). Nitrous oxide emission potentials of Burkholderia species isolated from the leaves of a boreal peat moss Sphagnum fuscum. Biosci. Biotechnol. Biochem. 79, 2086–2095. doi: 10.1080/09168451.2015.1061420
Oren, A. (2014). “The family xanthobacteraceae,” in The Prokaryotes: Alphaproteobacteria and Betaproteobacteria, eds E. Rosenberg, E. F. DeLong, S. Lory, E. Stackebrandt, and F. Thompson (Berlin: Springer), 709–726. doi: 10.1007/978-3-642-30197-1_258
Palmer, K., Biasi, C., and Horn, M. A. (2012). Contrasting denitrifier communities relate to contrasting N2O emission patterns from acidic peat soils in arctic tundra. ISME J. 6, 1058–1077. doi: 10.1038/ismej.2011.172
Palmer, K., Drake, H. L., and Horn, M. A. (2010). Association of novel and highly diverse acid-tolerant denitrifiers with N2O fluxes of an acidic fen. Appl. Environ. Microbiol. 76, 1125–1134. doi: 10.1128/aem.02256-09
Palmer, K., and Horn, M. A. (2012). Actinobacterial nitrate reducers and proteobacterial denitrifiers are abundant in N2O-metabolizing palsa peat. Appl. Environ. Microbiol. 78, 5584–5596. doi: 10.1128/aem.00810-12
Palmer, K., and Horn, M. A. (2015). Denitrification activity of a remarkably diverse fen denitrifier community in Finnish Lapland is N-oxide limited. PLoS One 10:e0123123. doi: 10.1371/journal.pone.0123123
Parks, D. H., Chuvochina, M., Waite, D. W., Rinke, C., Skarshewski, A., Chaumeil, P.-A., et al. (2018). A standardized bacterial taxonomy based on genome phylogeny substantially revises the tree of life. Nat. Biotechnol. 36, 996–1004. doi: 10.1038/nbt.4229
Philippot, L., Hallin, S., and Schloter, M. (2007). “Ecology of denitrifying prokaryotes in agricultural soil,” in Advances in Agronomy, ed. L. S. Donald (Cambridge, MA: Academic Press), 249–305. doi: 10.1016/s0065-2113(07)96003-4
Placella, S. A., Brodie, E. L., and Firestone, M. K. (2012). Rainfall-induced carbon dioxide pulses result from sequential resuscitation of phylogenetically clustered microbial groups. Proc. Natl. Acad. Sci. U.S.A. 109, 10931–10936. doi: 10.1073/pnas.1204306109
Potter, C. S., Matson, P. A., Vitousek, P. M., and Davidson, E. A. (1996). Process modeling of controls on nitrogen trace gas emissions from soils worldwide. J. Geophys. Res. Atmos. 101, 1361–1377. doi: 10.1029/95jd02028
Prakash, O., Green, S. J., Jasrotia, P., Overholt, W. A., Canion, A., Watson, D. B., et al. (2012). Rhodanobacter denitrificans sp. nov., isolated from nitrate-rich zones of a contaminated aquifer. Int. J. Syst. Evol. Microbiol. 62, 2457–2462. doi: 10.1099/ijs.0.035840-0
Prather, M. J., Hsu, J., DeLuca, N. M., Jackman, C. H., Oman, L. D., Douglass, A. R., et al. (2015). Measuring and modeling the lifetime of nitrous oxide including its variability. J. Geophys. Res. Atmos. 120, 5693–5705. doi: 10.1002/2015jd023267
Prosser, J. I., and Nicol, G. W. (2008). Relative contributions of archaea and bacteria to aerobic ammonia oxidation in the environment. Environ. Microbiol. 10, 2931–2941. doi: 10.1111/j.1462-2920.2008.01775.x
Quast, C., Pruesse, E., Yilmaz, P., Gerken, J., Schweer, T., Yarza, P., et al. (2012). The SILVA ribosomal RNA gene database project: improved data processing and web-based tools. Nucleic Acids Res. 41, D590–D596.
Repo, M. E., Susiluoto, S., Lind, S. E., Jokinen, S., Elsakov, V., Biasi, C., et al. (2009). Large N2O emissions from cryoturbated peat soil in tundra. Nat. Geosci. 2, 189–192. doi: 10.1038/ngeo434
Rognes, T., Flouri, T., Nichols, B., Quince, C., and Mahé, F. (2016). VSEARCH: a versatile open source tool for metagenomics. PeerJ. 4, e2584. doi: 10.7717/peerj.2584
Salmon, V. G., Soucy, P., Mauritz, M., Celis, G., Natali, S. M., Mack, M. C., et al. (2016). Nitrogen availability increases in a tundra ecosystem during five years of experimental permafrost thaw. Glob. Change Biol. 22, 1927–1941. doi: 10.1111/gcb.13204
Sanford, R. A., Wagner, D. D., Wu, Q., Chee-Sanford, J. C., Thomas, S. H., Cruz-Garcia, C., et al. (2012). Unexpected nondenitrifier nitrous oxide reductase gene diversity and abundance in soils. Proc. Natl. Acad. Sci. U.S.A. 109, 19709–19714. doi: 10.1073/pnas.1211238109
Schalk-Otte, S., Seviour, R. J., Kuenen, J. G., and Jetten, M. S. M. (2000). Nitrous oxide (N2O) production by Alcaligenes faecalis during feast and famine regimes. Water Res. 34, 2080–2088. doi: 10.1016/s0043-1354(99)00374-7
Schloss, P. D., Westcott, S. L., Ryabin, T., Hall, J. R., Hartmann, M., Hollister, E. B., et al. (2009). Introducing mothur: Open-source, platform-independent, community-supported software for describing and comparing microbial communities. Appl. Environ. Microbiol. 75, 7537–7541. doi: 10.1128/aem.01541-09
Schmidt, O., Horn, M. A., Kolb, S., and Drake, H. L. (2015). Temperature impacts differentially on the methanogenic food web of cellulose-supplemented peatland soil. Environ. Microbiol. 17, 720–734. doi: 10.1111/1462-2920.12507
Seki, T., Matsumoto, A., Shimada, R., Inahashi, Y., Ômura, S., and Takahashi, Y. (2012). Conexibacter arvalis sp. nov., isolated from a cultivated field soil sample. Int. J. Syst. Evol. Microbiol. 62, 2400–2404. doi: 10.1099/ijs.0.036095-0
Shaver, G. R., Billings, W. D., Chapin, F. S., Giblin, A. E., Nadelhoffer, K. J., Oechel, W. C., et al. (1992). Global change and the carbon balance of Arctic ecosystems. Bioscience 42, 433–441.
Siljanen, H. M. P. P., Alves, R. J. E. E., Ronkainen Jussi, G., Lamprecht, R. E., Bhattarai, H. R., Bagnoud, A., et al. (2019). Archaeal nitrification is a key driver of high nitrous oxide emissions from arctic peatlands. Soil Biol. Biochem. 53, 107539. doi: 10.1016/j.soilbio.2019.107539
Simek, M., and Cooper, J. E. (2002). The influence of soil pH on denitrification: progress towards the understanding of this interaction over the last 50 years. Eur. J. Soil Sci. 53, 345–354. doi: 10.1046/j.1365-2389.2002.00461.x
Söllinger, A., Schwab, C., Weinmaier, T., Loy, A., Tveit, A. T., Schleper, C., et al. (2016). Phylogenetic and genomic analysis of Methanomassiliicoccales in wetlands and animal intestinal tracts reveals clade-specific habitat preferences. FEMS Microbiol. Ecol. 92, fiv149. doi: 10.1093/femsec/fiv149
Stocker, T. F., Qin, D., Plattner, G.-K., Tignor, M., Allen, S. K., Boschung, J., et al. (2018). “IPCC 2018. Climate change 2013: The physical science basis,” in Contribution of working group I to the Fifth Assessment Report of the Intergovernmental Panel on Climate Change (Geneva: IPCC).
Tiedje, J. M. (1988). “Ecology of denitrification and dissimilatory nitrate reduction to ammonium,” in Biology of anaerobic microorganisms, ed. A. J. B. Zehnder (New York, NY: John Wiley & Sons), 179–244.
van Cleemput, O. (1998). Subsoils: chemo-and biological denitrification, N2O and N2 emissions. Nutr. Cycl. Agroecosyst. 52, 187–194.
Van Den Heuvel, R. N., Van Der Biezen, E., Jetten, M. S. M., Hefting, M. M., and Kartal, B. (2010). Denitrification at pH 4 by a soil-derived Rhodanobacter-dominated community. Environ. Microbiol. 12, 3264–3271. doi: 10.1111/j.1462-2920.2010.02301.x
Voigt, C., Lamprecht, R. E., Marushchak, M. E., Lind, S. E., Novakovskiy, A., Aurela, M., et al. (2017a). Warming of subarctic tundra increases emissions of all three important greenhouse gases – carbon dioxide, methane, and nitrous oxide. Glob. Change Biol. 23, 3121–3138. doi: 10.1111/gcb.13563
Voigt, C., Marushchak, M. E., Lamprecht, R. E., Jackowicz-Korczyński, M., Lindgren, A., Mastepanov, M., et al. (2017b). Increased nitrous oxide emissions from Arctic peatlands after permafrost thaw. Proc. Nat. Acad. Sci. U.S.A. 114, 6238–6243. doi: 10.1073/pnas.1702902114
Wang, Y., and Qian, P. Y. (2009). Conservative fragments in bacterial 16S rRNA genes and primer design for 16S ribosomal DNA amplicons in metagenomic studies. PLoS One 4:e7401. doi: 10.1371/journal.pone.0007401
Weber, E. B., Lehtovirta-Morley, L. E., Prosser, J. I., and Gubry-Rangin, C. (2015). Ammonia oxidation is not required for growth of group 1.1c soil Thaumarchaeota. FEMS Microbiol. Ecol. 91, fiv001.
Werner, C., Butterbach-Bahl, K., Haas, E., Hickler, T., and Kiese, R. (2007). A global inventory of N2O emissions from tropical rainforest soils using a detailed biogeochemical model. Global Biogeochem. Cycles 21, GB3010.
Whiteley, A. S., Thomson, B., Lueders, T., and Manefield, M. (2007). RNA stable-isotope probing. Nat. Protoc. 2, 838–844.
Wüst, P. K., Horn, M. A., and Drake, H. L. (2009). Trophic links between fermenters and methanogens in a moderately acidic fen soil. Environ. Microbiol. 11, 1395–1409. doi: 10.1111/j.1462-2920.2009.01867.x
Yilmaz, P., Parfrey, L. W., Yarza, P., Gerken, J., Pruesse, E., Quast, C., et al. (2014). The SILVA and “All-species Living Tree Project (LTP)” taxonomic frameworks. Nucleic Acids Res. 42, D643–D648.
Yoshida, N., Yagi, K., Sato, D., Watanabe, N., Kuroishi, T., Nishimoto, K., et al. (2005). Bacterial communities in petroleum oil in stockpiles. J. Biosci. Bioeng. 99, 143–149. doi: 10.1263/jbb.99.143
Yoshinari, T., Hynes, R., and Knowles, R. (1977). Acetylene inhibition of nitrous oxide reduction and measurement of denitrification and nitrogen fixation in soil. Soil Biol. Biochem. 9, 177–183. doi: 10.1016/0038-0717(77)90072-4
Zeikus, J. G., Weimer, P. J., Nelson, D. R., and Daniels, L. (1975). Bacterial methanogenesis: acetate as a methane precursor in pure culture. Arch. Microbiol. 104, 129–134. doi: 10.1007/bf00447312
Zumft, W. G. (1997). Cell biology and molecular basis of denitrification. Microbiol. Mol. Biol. Rev. 61, 533–616. doi: 10.1128/.61.4.533-616.1997
Keywords: 16S rRNA stable isotope probing, nitrous oxide, climatechange, permafrost affected soils, isotope tracing
Citation: Hetz SA and Horn MA (2021) Burkholderiaceae Are Key Acetate Assimilators During Complete Denitrification in Acidic Cryoturbated Peat Circles of the Arctic Tundra. Front. Microbiol. 12:628269. doi: 10.3389/fmicb.2021.628269
Received: 11 November 2020; Accepted: 18 January 2021;
Published: 05 February 2021.
Edited by:
Peter Stief, University of Southern Denmark, DenmarkReviewed by:
Matthias Winkel, University of Alaska Fairbanks, United StatesAsa Frostegard, Norwegian University of Life Sciences, Norway
Copyright © 2021 Hetz and Horn. This is an open-access article distributed under the terms of the Creative Commons Attribution License (CC BY). The use, distribution or reproduction in other forums is permitted, provided the original author(s) and the copyright owner(s) are credited and that the original publication in this journal is cited, in accordance with accepted academic practice. No use, distribution or reproduction is permitted which does not comply with these terms.
*Correspondence: Marcus A. Horn, aG9ybkBpZm1iLnVuaS1oYW5ub3Zlci5kZQ==