 Afsha Tabassum
 S. V. Ramesh
 Ying Zhai
 Romana Iftikhar
 Cristian Olaya
 Hanu R. Pappu
- 1Department of Plant Pathology, Washington State University, Pullman, WA, United States
- 2Indian Council of Agricultural Research-Central Plantation Crops Research Institute, Kasaragod, India
Iris yellow spot, caused by Iris yellow spot orthotospovirus (IYSV) (Genus: Orthotospovirus, Family: Tospoviridae), is an important disease of Allium spp. The complete N gene sequences of 142 IYSV isolates of curated sequence data from GenBank were used to determine the genetic diversity and evolutionary pattern. In silico restriction fragment length polymorphism (RFLP) analysis, codon-based maximum likelihood studies, genetic differentiation and gene flow within the populations of IYSV genotypes were investigated. Bayesian phylogenetic analysis was carried out to estimate the evolutionary rate. In silico RFLP analysis of N gene sequences categorized IYSV isolates into two major genotypes viz., IYSV Netherlands (IYSVNL; 55.63%), IYSV Brazil (IYSVBR; 38.73%) and the rest fell in neither group [IYSV other (IYSVother; 5.63%)]. Phylogenetic tree largely corroborated the results of RFLP analysis and the IYSV genotypes clustered into IYSVNL and IYSVBR genotypes. Genetic diversity test revealed IYSVother to be more diverse than IYSVNL and IYSVBR. IYSVNL and IYSVBR genotypes are under purifying selection and population expansion, whereas IYSVother showed decreasing population size and hence appear to be under balancing selection. IYSVBR is least differentiated from IYSVother compared to IYSVNL genotype based on nucleotide diversity. Three putative recombinant events were found in the N gene of IYSV isolates based on RDP analysis, however, RAT substantiated two among them. The marginal likelihood mean substitution rate was 5.08 × 10⁻⁵ subs/site/year and 95% highest posterior density (HPD) substitution rate between 5.11 × 10⁻⁵ and 5.06 × 10⁻⁵. Findings suggest that IYSV continues to evolve using population expansion strategies. The substitution rates identified are similar to other plant RNA viruses.
Introduction
Tospoviruses continue to be a major production constraint for a wide range of agronomic and horticultural crops worldwide (Gent et al., 2006; Pappu et al., 2009; Mandal et al., 2012; Mandal et al., 2012; Bag et al., 2015; Oliver and Whitfield, 2016; Turina et al., 2016; Resende et al., 2020). Iris yellow spot orthotospovirus (IYSV; genus: Orthotospovirus, family: Tospoviridae) (Resende et al., 2020) primarily infect Allium spp., which includes onion (Allium cepa), green onion (Allium fistulosum), garlic (Allium tuberosum), leek (Allium porrum) (Gent et al., 2006; Cordoba-Selles et al., 2007; Bag et al., 2015; Karavina et al., 2016; Tabassum et al., 2016. The virus was first described in southern Brazil in 1981 on infected onion (Allium cepa; family: Amaryllidaceae) inflorescence stalks (scapes). The disease was referred to as “Sapeca.” In the US, the disease was first described in the Treasure Valley of southwestern Idaho and southeastern Oregon in 1989 (Gent et al., 2006). In 2003, the disease epidemic in Colorado (United States) caused a crop loss estimated at US $ 2.5–5 million (Gent et al., 2006). The disease has spread to most of the onion-growing areas in Africa, Asia, Europe, the Americas, and the Oceania (Centre for Agriculture and Bioscience International (CABI) - Invasive Species Compendium, 2019).
The disease caused by IYSV is characterized by chlorotic or necrotic, straw-colored to white, dry, elongated or spindle shaped lesions along the scape (Figure 1A). Lesions are frequently at middle to lower portions of the scape. The diamond-shaped lesions tend to be less defined on leaves (Pappu et al., 2008; Bag et al., 2015). The photosynthetic activity is affected in the infected plants leading to reduced bulb size. As the disease progresses, the lesions girdle the scape causing the seed head to collapse leading to severe crop losses (Figure 1B; Gent et al., 2006).
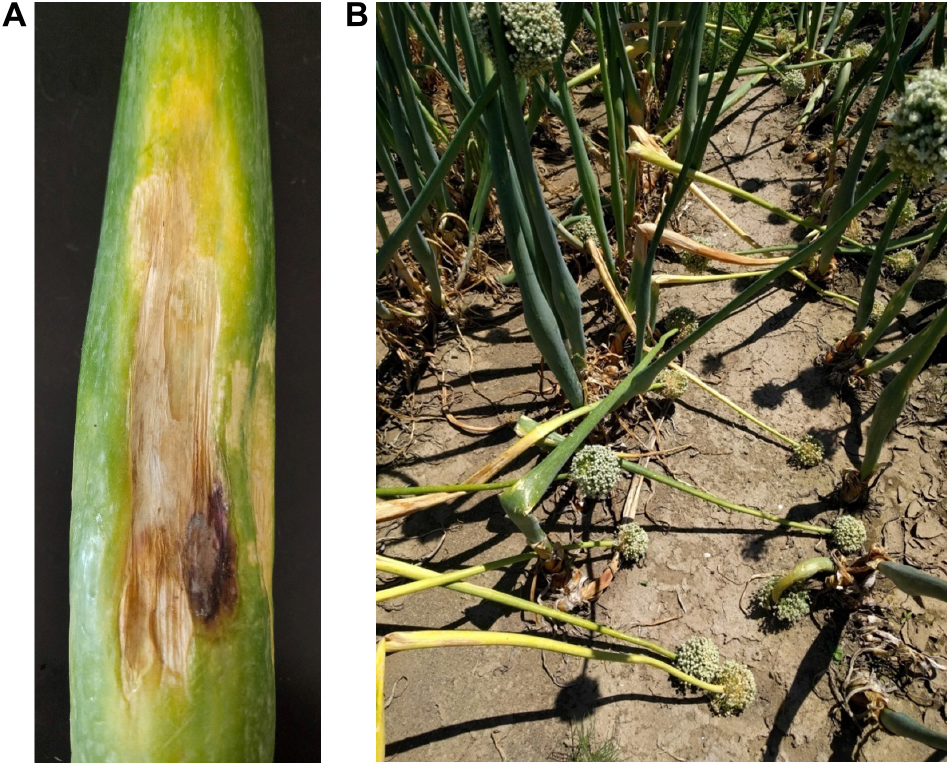
Figure 1. Symptoms associated with Iris yellow spot orthotospovirus infection on onion (A) on scapes; (B) toppling of the seed head.
IYSV, as other tospoviruses, consists of a tripartite genome: Small (S) and Medium (M) RNAs encode proteins in both sense and antisense orientations (ambisense) while the Large (L) RNA encodes protein from negative sense strand. The L RNA codes for RNA dependent RNA polymerase (RdRp), M RNA codes for glycoprotein precursors (GN and GC) and the non-structural movement protein (NSm), and the S RNA codes for nucleocapsid (N) and non-structural silencing suppressor protein (NSs) (reviewed in Bag et al., 2015; Pappu et al., 2020; Resende et al., 2020).
Genetic evolution of viruses directly impacts the host-virus interactions and as such is important to ascertain genetic diversity within a viral species (Sacristan and Garcia-Arenal, 2008; Gibbs and Ohsima, 2010). Genetic drift, migration, mutation, natural selection, segment reassortment, and recombination are the major sources of evolutionary changes in the genetic architecture of viral populations (Moya et al., 2004; Butkovic et al., 2021). Phylo-geographical analysis is a powerful tool to determine the geographical distribution pattern of virus, assessing their genetic variation, and historical events that are shaping the genetic architecture of the viral populations (Hewitt, 2004; Chen et al., 2012). Comprehensive genetic architecture and evolutionary genomic analysis of viral populations have become a subject of increasing attention in a number of viruses.
While IYSV is widely distributed in the world, the complete genome of only a few isolates are sequenced. Since the N gene is considered as one of the descriptors for tospovirus identification and classification, the N gene of a large number of isolates was sequenced and the genetic diversity was determined (de Avila et al., 1993; Pappu et al., 2006; Nischwitz et al., 2007; Iftikhar et al., 2014; Bag et al., 2015). The number of N gene sequences of IYSV isolates reported since the last study (Iftikhar et al., 2014) has been on the rise. Building on the earlier findings, we carried out a more detailed and a global analysis of the extent of genetic recombination, genetic diversity, genetic differentiation, and gene flow among different genotypes of IYSV isolates reported from different parts of the world. Further, Bayesian model-based coalescent approaches were used to gain insights into the molecular evolutionary pattern of IYSV population.
Materials and Methods
Data Source of Nucleocapsid (N) Gene Sequences
Complete nucleocapsid (N) gene sequences of 142 IYSV isolates reported from across the globe were obtained the nucleotide sequence repository, GenBank. IYSV isolates analyzed were from 19 countries spread over six continents—Africa, Asia, Australia and New Zealand, Europe, North America (Canada, Mexico and the United States) and South America, infecting 10 different hosts including Allium cepa (the most commonly reported host), Allium porrum, Eustoma russellianum, Allium tuberosum, Allium chinense, Wild onion, Alstroemeria sp., Allium sativum, and Allium fistulosum. The N gene sequence (HQ267713) derived from tomato spotted wilt orthotospovirus (TSWV) infecting pepper crop in South Korea was used as an outgroup (Supplementary Table 1). Only complete IYSV N gene sequences (822 nt-long open reading frame coding for a 273-amino acid protein) were considered for analysis.
In silico Restriction Fragment Length Polymorphism (RFLP) Analysis
N gene sequences were analyzed for sequence variations by performing in silico RFLP analysis using Restriction Mapper (Restriction Mapper, 2009). The complete N gene sequence was virtually digested, and sites were mapped as recognized by restriction enzyme HinfI (Zen et al., 2005). Based on HinfI digestion, IYSV isolates can be grouped into IYSV Netherlands (IYSVNL) or IYSV Brazil (IYSVBR) types. The size of the largest fragment generated by digestion is considered for differentiating the given isolate into two groups. The genotypes viz., IYSVNL and IYSVBR are differentiated based on the resultant 308 and 468 bp fragments, respectively. Those isolates that yielded any different fragment size upon restriction digestion were grouped into IYSVother.
Phylogeny Construction
Multiple sequence alignment (MSA) was performed using MUSCLE algorithm available in MEGA7 (Edgar, 2004). Best-fit model of nucleotide substitution was determined using MODEL TEST in MEGA7. Aligned sequence relatedness was evaluated using the Maximum Likelihood (default parameters with 1,000 bootstrap replicates) method based on Tamura parameter 3 model (T92) with Gamma distributed (G) available in MEGA7 (Kumar et al., 2016). The phylogenetic tree was rooted using TSWV N gene reported from South Korea as an outgroup.
Population Selection Studies and Neutrality Test
Mean rates of non-synonymous (dN) and synonymous substitutions (dS) were calculated using codon-based maximum likelihood methods, i.e., SLAC (single like ancestor counting), FEL (fixed effects likelihood), and REL (random effects likelihood). DATAMONKEY server (Weaver et al., 2018) was used to calculate dN/dS ratio. To test the theory of neutral evolution, the test statistics such as Tajimas’s D (Tajima, 1989), Fu and Li’s D, and Fu and Li’s F (Fu and Li, 1993; Fu, 1997) were computed in DnaSP software.
Genetic Differentiation and Gene Flow Estimates
DnaSP was used to compute nucleotide test statistics such as Ks, Kst (Kst value close to zero indicate no differentiation), Snn (Snn value close to one indicates differentiation) (Hudson, 2000) and haplotype statistics Hs, Hst (Hudson et al., 1992a,b). These tests estimate genetic differentiation within the populations of IYSV genotypes. Fst statistics was used to estimate the extent of the gene flow (panmixia or free gene flow has values close to zero whereas infrequent gene flow attains values close to one) (Hudson et al., 1992b).
Recombination Detection Analysis (RDA)
Unaligned sequences were loaded in SDT v1.2 program, pairwise scan was performed with the MUSCLE, and the sequence data was saved with minimum identity of 70% and maximum of 100% to ensure sequences were properly aligned. The aligned IYSV N sequences were then used as an input query and analyzed for recombination events using Recombination Detection Program (RDP) v 4.0 (Martin and Rybicki, 2000), BOOTSCAN (Salminen et al., 1995), 3SEQ, GENECONV (Sawyer, 1999), MAXCHI (Maynard, 1992), CHIMAERA (Posada and Crandall, 2001) and SISCAN (Gibbs et al., 2000) available in RDP 4 Beta 4.88. Default settings for the different recombination detection methods and a Bonferroni corrected P-value cut-off of 0.05 were used for analysis.
Recombination Analysis Tool (RAT)
Recombination analysis tool (RAT) was used for the analysis of aligned nucleotide sequences (Etherington et al., 2005). RAT algorithm uses pairwise comparisons between sequences based on the distance method to identify recombinants in nucleotide sequence alignment. Percentage of nucleotide similarities were compared using a sliding window size of 10% of the sequence length and an increment size being half of the window size.
Bayesian Evolutionary Analysis by Sampling Trees (BEAST)
Bayesian phylogenetic analysis was performed in BEAST v2.4.6 (Bouckaert et al., 2014) to estimate evolutionary rate. Strict, relaxed (exponential, lognormal) and random local clocks were utilized for comparison (Bouckaert et al., 2014). Demographic models—coalescent constant population, coalescent exponential population, coalescent Bayesian skyline and coalescent extended Bayesian skyline were used to infer demographic history. “Temporal signal” (i.e., genetic changes between sampling times are sufficient and there is statistical relationship between genetic divergence and time) in the dataset was assessed using TempEst program (Rambaut et al., 2016). Using Markov Chain Monte Carlo (MCMC) method Bayesian phylogenies were constructed in BEAST v2.4.6. First 10% of the samples were discarded as burn-in. Convergence of the chain to stationary distribution and adequate sampling were analyzed using Tracer v1.6 (Tracer, 2018). Tracer was used to analyze the Effective Sample Size (ESS) and other prior parameter values. Tree Annotator was used for generating Maximum Clade Credibility (MCC) phylogenetic trees with common heights node. FigTree (2018) was used to generate the dendrograms.
Results
In silico Restriction Fragment Length Polymorphism Analysis
Computational RFLP-based analysis of N gene sequences recognizing HinfI restriction site divided the population into two major groups [79 NL (55.63%), 55 BR (38.73%)]. Thus, the genotype IYSVNL was found to be predominant over IYSVBR while the rest (5.63%) fell in neither category (IYSVother) (Figure 2).
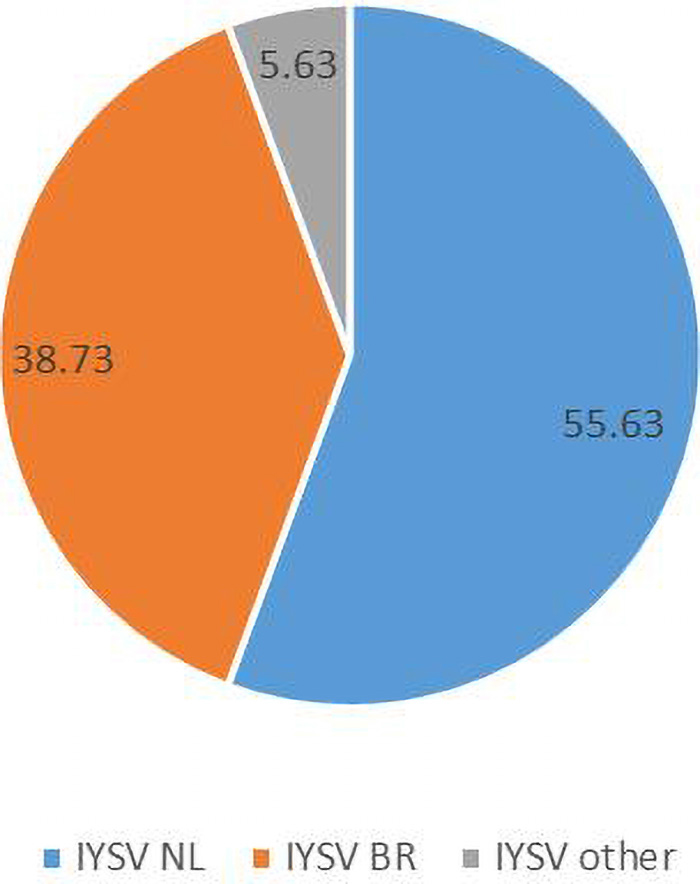
Figure 2. Relative distribution of the global collection of Iris yellow spot orthotospovirus genotypes (indicated as percentages) based on Restriction Fragment Length Polymorphism.
Molecular Phylogeny of IYSV N Gene
Phylogenetic tree of the N gene of IYSV constructed based on the aligned nucleotide sequences (Figure 3) using Maximum Likelihood method broadly clustered IYSV genotypes into two major clades (NL and BR types). Four IYSVother isolates (EU750697, KT27882, KT272883, and EU586203) and one IYSVBR isolate (FJ713700) clustered with the NL group. Similarly, four more IYSVother isolates (HQ148173, HQ148174, EU310290, and EU310291) and two IYSVNL isolates (FJ785835 and AF001387) clustered with the BR group. One IYSVBR isolate from Brazil (AF067070) formed a separate monophyletic clade along with a TSWV N gene isolate HQ267713 from South Korea (Outgroup). The clades also followed a geographical pattern as majority of IYSVNL genotypes are from North America and IYSVBR are from the Asian countries. Only one IYSV isolate has been reported from Brazil which formed a separate monophyletic clade even though in silico RFLP characterized it as an IYSVBR type.
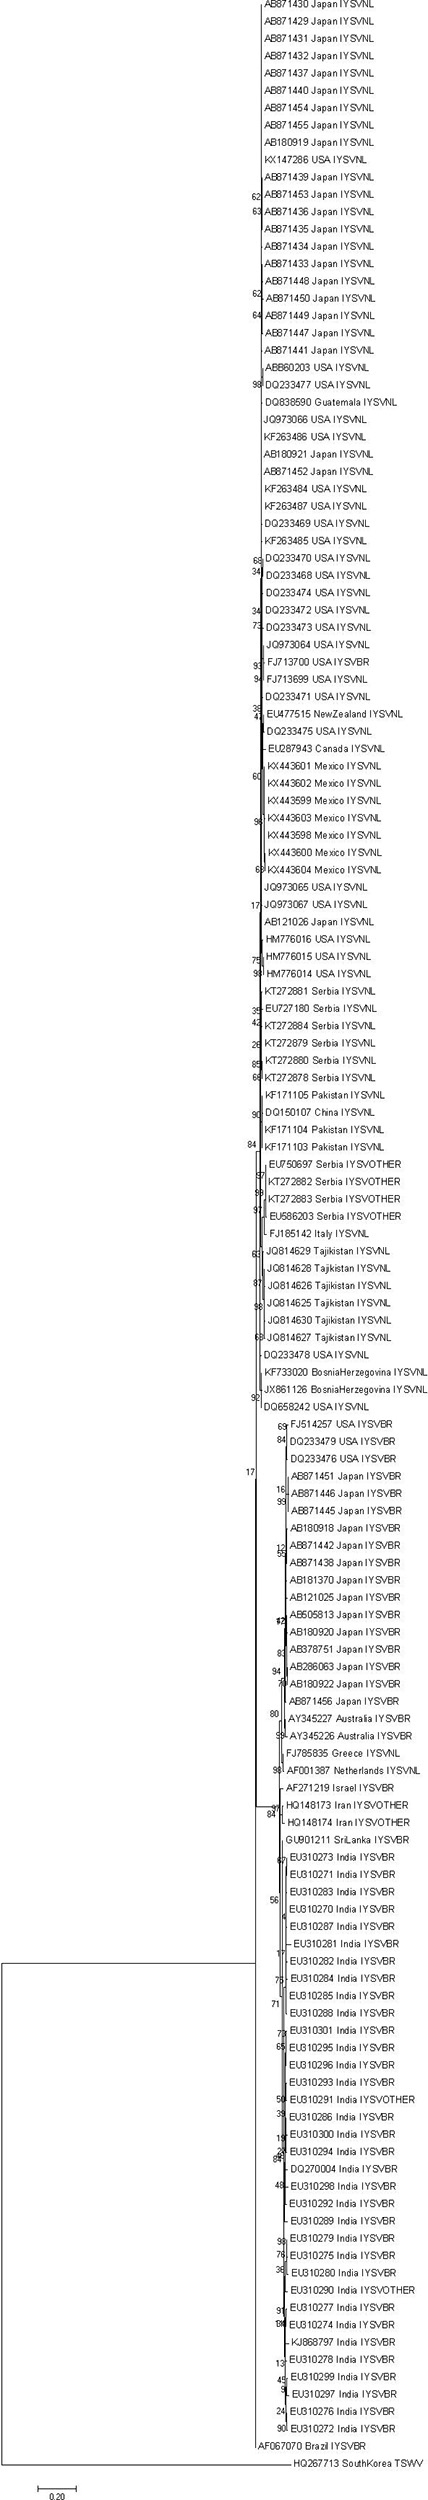
Figure 3. Dendrogram based on the nucleocapsid (N) gene nucleotide sequences of Iris yellow spot orthotospovirus (IYSV). Tomato spotted wilt orthotospovirus N gene isolate HQ267713.1 from South Korea was used as an outgroup. GenBank accession number, place of origin, and IYSV genotype are the indicators of each IYSV isolate.
Population Selection Studies, Neutrality Test, and Genetic Diversity Test
Gene codons that are in positive or negative selection pressure provide knowledge regarding the molecular evolution pattern of the N gene. The mean dN/dS (dN—rate of non-synonymous substitutions and dS—rate of synonymous substitutions) for N gene accessions belonging to IYSVNL group were found to be 0.192 with no positively selected codon site. SLAC methodology identified 20 negatively selected codons in the N gene of IYSVNL type. The data set when analyzed by FEL methodology revealed one positively selected codon site (codon no. 139) against 62 negatively selected codons. The dN-dS (mean difference between dN and dS) was –0.803 based on REL analysis denoting that the codon sites are under purifying selection acting against deleterious non-synonymous substitutions (Table 1).
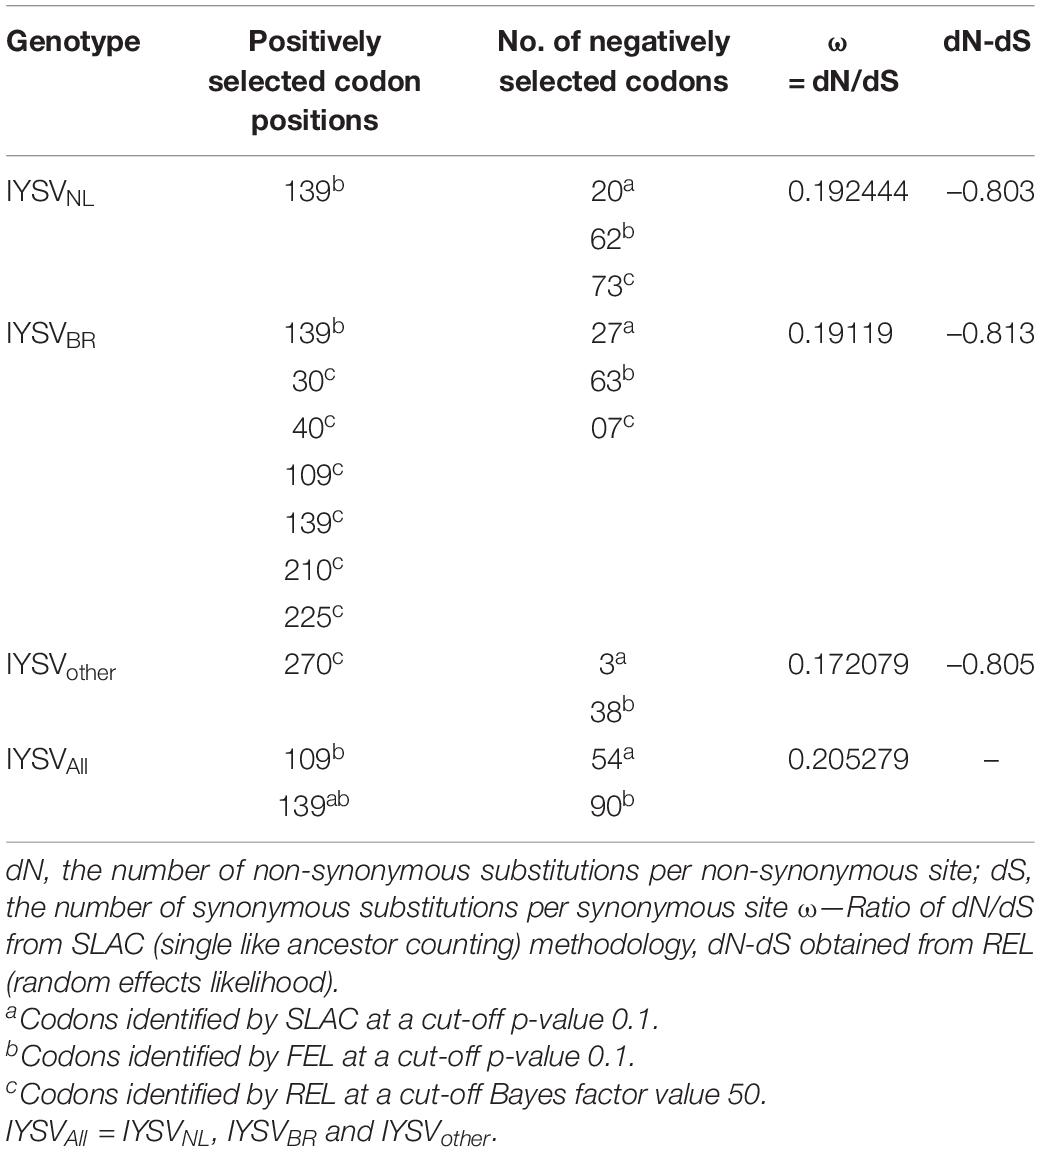
Table 1. Codon substitution in the nucleocapsid gene of Iris yellow spot orthotospovirus genotypes.
For N gene accessions derived from IYSVBR, the mean dN/dS was found to be 0.191 with no positively selected codon site. SLAC methodology identified 27 negatively selected codons. The data set when analyzed by FEL revealed one positively selected codon site (codon no. 139) against 63 negatively selected codons. The dN-dS was –0.813 based on REL analysis suggesting that the codon sites are under purifying selection acting against deleterious non-synonymous substitutions. Six positively selected codon (codon nos. 30, 40, 109, 139, 210, and 225) and seven negatively selected codons were identified by REL analysis, respectively (Table 1).
For N gene accessions of IYSVother group, the mean dN/dS was found to be 0.172 with no positively selected codon site. SLAC methodology identified three negatively selected codons. FEL methodology revealed no positively selected codon site against 38 negatively selected codons. The dN-dS was –0.805 based on REL analysis and it denotes codon sites are under purifying selection acting against deleterious non-synonymous substitutions. One positively selected codon (codon no. 270) and zero negatively selected codons were identified by REL analysis, respectively (Table 1).
Nucleotide diversity (π) of IYSVBR was about two folds higher than that for IYSVNL (0.04513 and 0.01990; respectively, Table 2). However, the highest nucleotide diversity among the IYSV isolates was found in IYSVother (0.08042) indicating IYSVother is more genetically diverse than the IYSVNL and IYSVBR (Table 2). Number of polymorphic sites (S) was 136 from the N gene sequences of eight isolates of IYSVother, IYSVNL showed 189 polymorphic sites among the N gene sequences obtained from the 79 isolates, whereas IYSVBR showed 230 polymorphic sites obtained from the 55 isolates (Table 2). IYSVother is more diverse than IYSV NL and BR based on number of polymorphic sites (S).
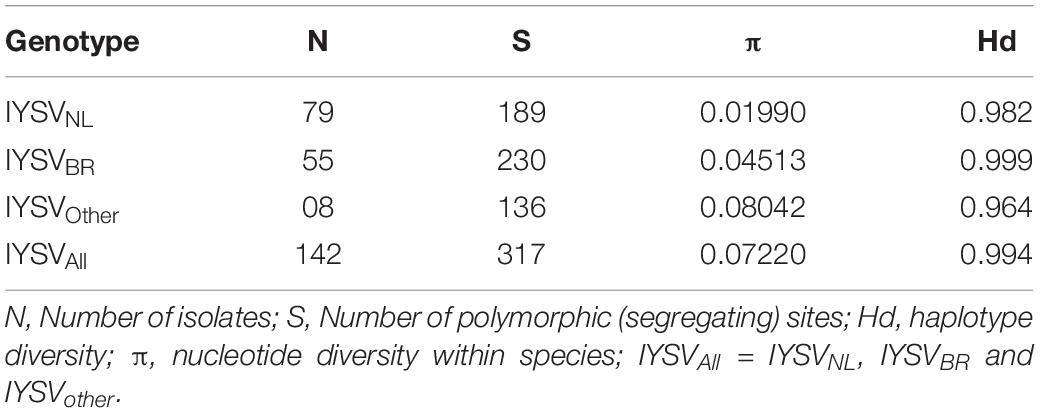
Table 2. Genetic diversity test of Iris yellow spot orthotospovirus genotypes.
Neutrality Test
The test of neutral evolution analyzed based on the total number of mutations and segregating sites, revealed statistically significant and non-significant negative values of test statistic Tajimas’s D for IYSVNL and IYSVBR, respectively (Tables 3, 4). It indicates the operation of purifying selection and population expansion in major IYSV genotypes (NL and BR). Similarly, negative values of other test statistics such as Fu and Li’s D and Fu and Li’s F also corroborate the above findings with regard to IYSVBR and IYSVNL genotypes. However, positive values of all the test statistics such as Tajimas’s D, Fu and Li’s D, and Fu and Li’s F with respect to the genotype IYSVother indicate the decrease in population size and act of balancing selection.
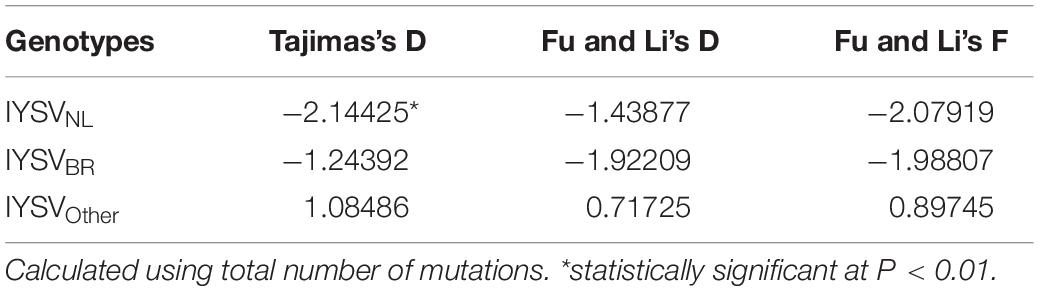
Table 3. Neutrality test of Iris yellow spot orthotospovirus genotypes based on total number of mutations.
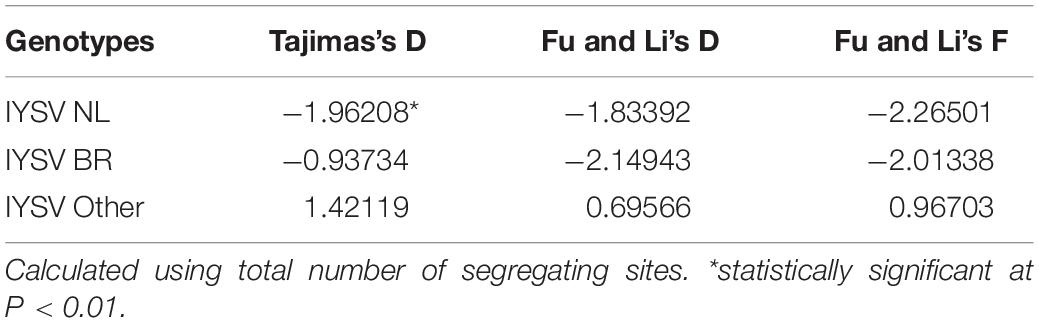
Table 4. Neutrality tests of Iris yellow spot orthotospovirus genotypes based on total number of segregating sites.
Genetic Differentiation and Gene Flow
Haplotype-based statistics (Hs and Hst) and nucleotide-based statistics (Ks, Kst, Snn) were estimated to evaluate genetic differentiation between the IYSV genotypes (Table 5). The statistically significant test values of Ks, Kst and Z reveals strong genetic differentiation among the IYSV genotypes studied. Snn value close to one indicates genetic differentiation even though insignificant test statistical values were obtained. IYSVBR is more differentiated from IYSVother (Kst value of 0.03724∗) compared to IYSVNL genotypes (0.21377∗) based on the Kst values. Fst values show that the extent of gene flow between major genotypes, IYSVBR and IYSVNL, is relatively high than the gene flow between individual BR and NL genotypes with IYSVother. Among the major genotypes, IYSVNL shows greater gene flow with IYSVother than IYSVBR.
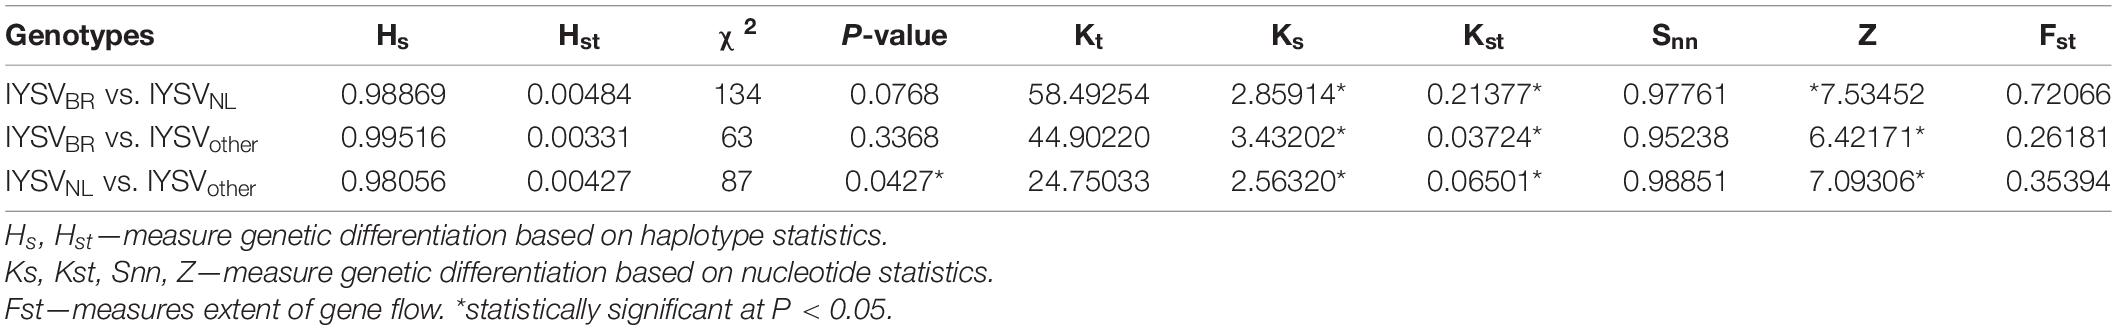
Table 5. Gene flow and genetic differentiation of Iris yellow spot orthotospovirus genotypes.
Recombination Detection Analysis
Three potential recombination events were detected among the IYSV N genes analyzed (Table 6 and Figure 4). AF067070 (BR type) IYSV isolate from Brazil is a potential recombinant of isolates: JX861126 Bosnia (major parent) and AY345226 Australia (minor parent). This recombinant was detected by GeneConv, 3Seq, algorithms in RDP. The recombination breakpoint begins at 789 in alignment (789 without gaps) with breakpoint clustering at 99% confidence interval ranging from 730 to 809 in alignment (730–809 without gaps) and breakpoint ends at 12 in alignment (12 without gaps) with breakpoint clustering at 99% confidence interval ranging from 822 to 44 in alignment (822–44 without gaps). The second recombination event involved isolate HQ148174 (IYSVother) from Iran putatively arising from EU310281 India (major parent) and AB180922 Japan (minor parent). However, only MaxChi algorithm detected this recombinant. The third recombinant, AB180918 (BR type) IYSV isolate from Japan, is the result of a potential recombination event 22 arising from HQ148174 Iran (major parent) and EU586203 Serbia (minor parent). This recombinant was detected by SiScan and 3Seq algorithms of recombination detection program. The recombination breakpoint begins at 20 in alignment (20 without gaps) with breakpoint clustering at 99% confidence interval ranging from 731 to 3 in alignment (731–3 without gaps) and breakpoint ends at 820 in alignment (820 without gaps) with breakpoint clustering at 99% confidence interval ranging from 731 to 3 in alignment (731–3 without gaps). Among the three putative recombinants detected, two belonged to IYSVBR type and the remaining one belonged to IYSVother type. IYSV isolate from Brazil is a potential recombinant and hence this isolate formed a separate monophyletic clade in the phylogenetic tree (Figure 3).
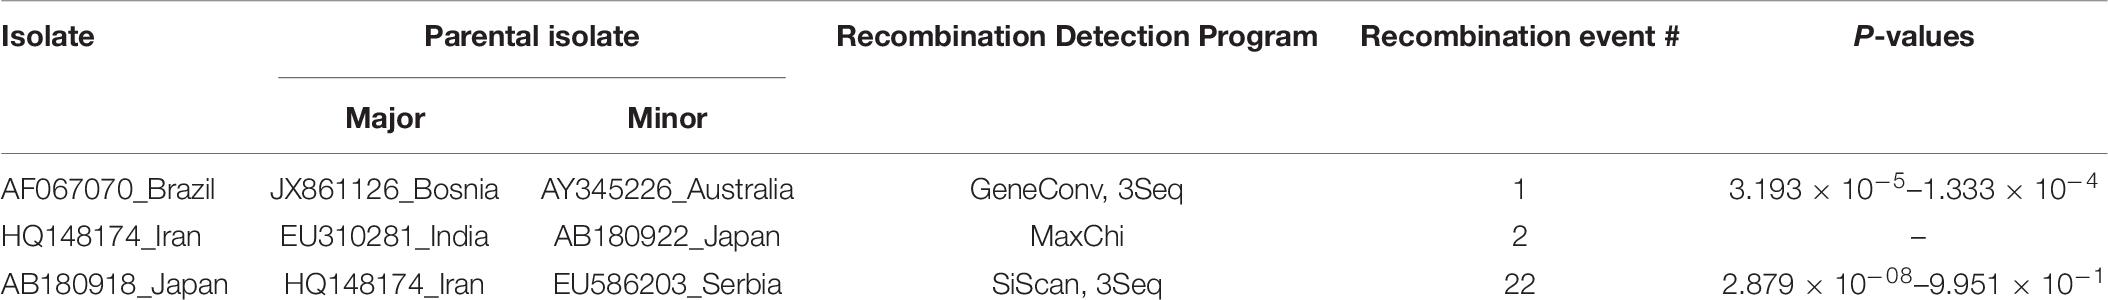
Table 6. Recombination events in Iris yellow spot orthotospovirus nucleocapsid (N) gene detected by Recombination Detection Program (RDP).
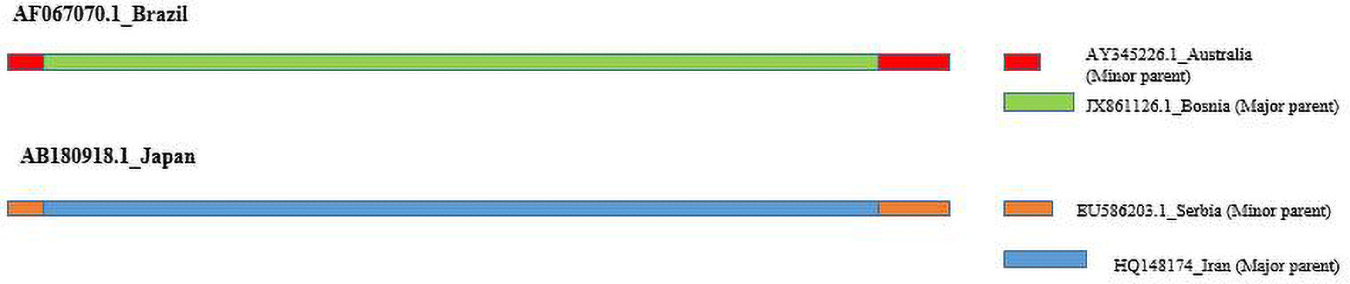
Figure 4. Potential recombinants detected in Iris yellow spot orthotospovirus nucleocapsid (N) gene by Recombination Detection Program (RDP4). Major and Minor parent for each recombinants are shown.
Recombination Analysis Tool
Recombination analysis tool (RAT) was used to substantiate the findings of the RDP. An isolate was considered recombinant when the major and minor parent isolates intersect at two points in the graph (Figure 5). Based on this criterion, HQ148174_Iran and AB180918_Japan were considered potential recombinants even though only MaxChi in the RDP4 program detected HQ148174_Iran as a recombinant.
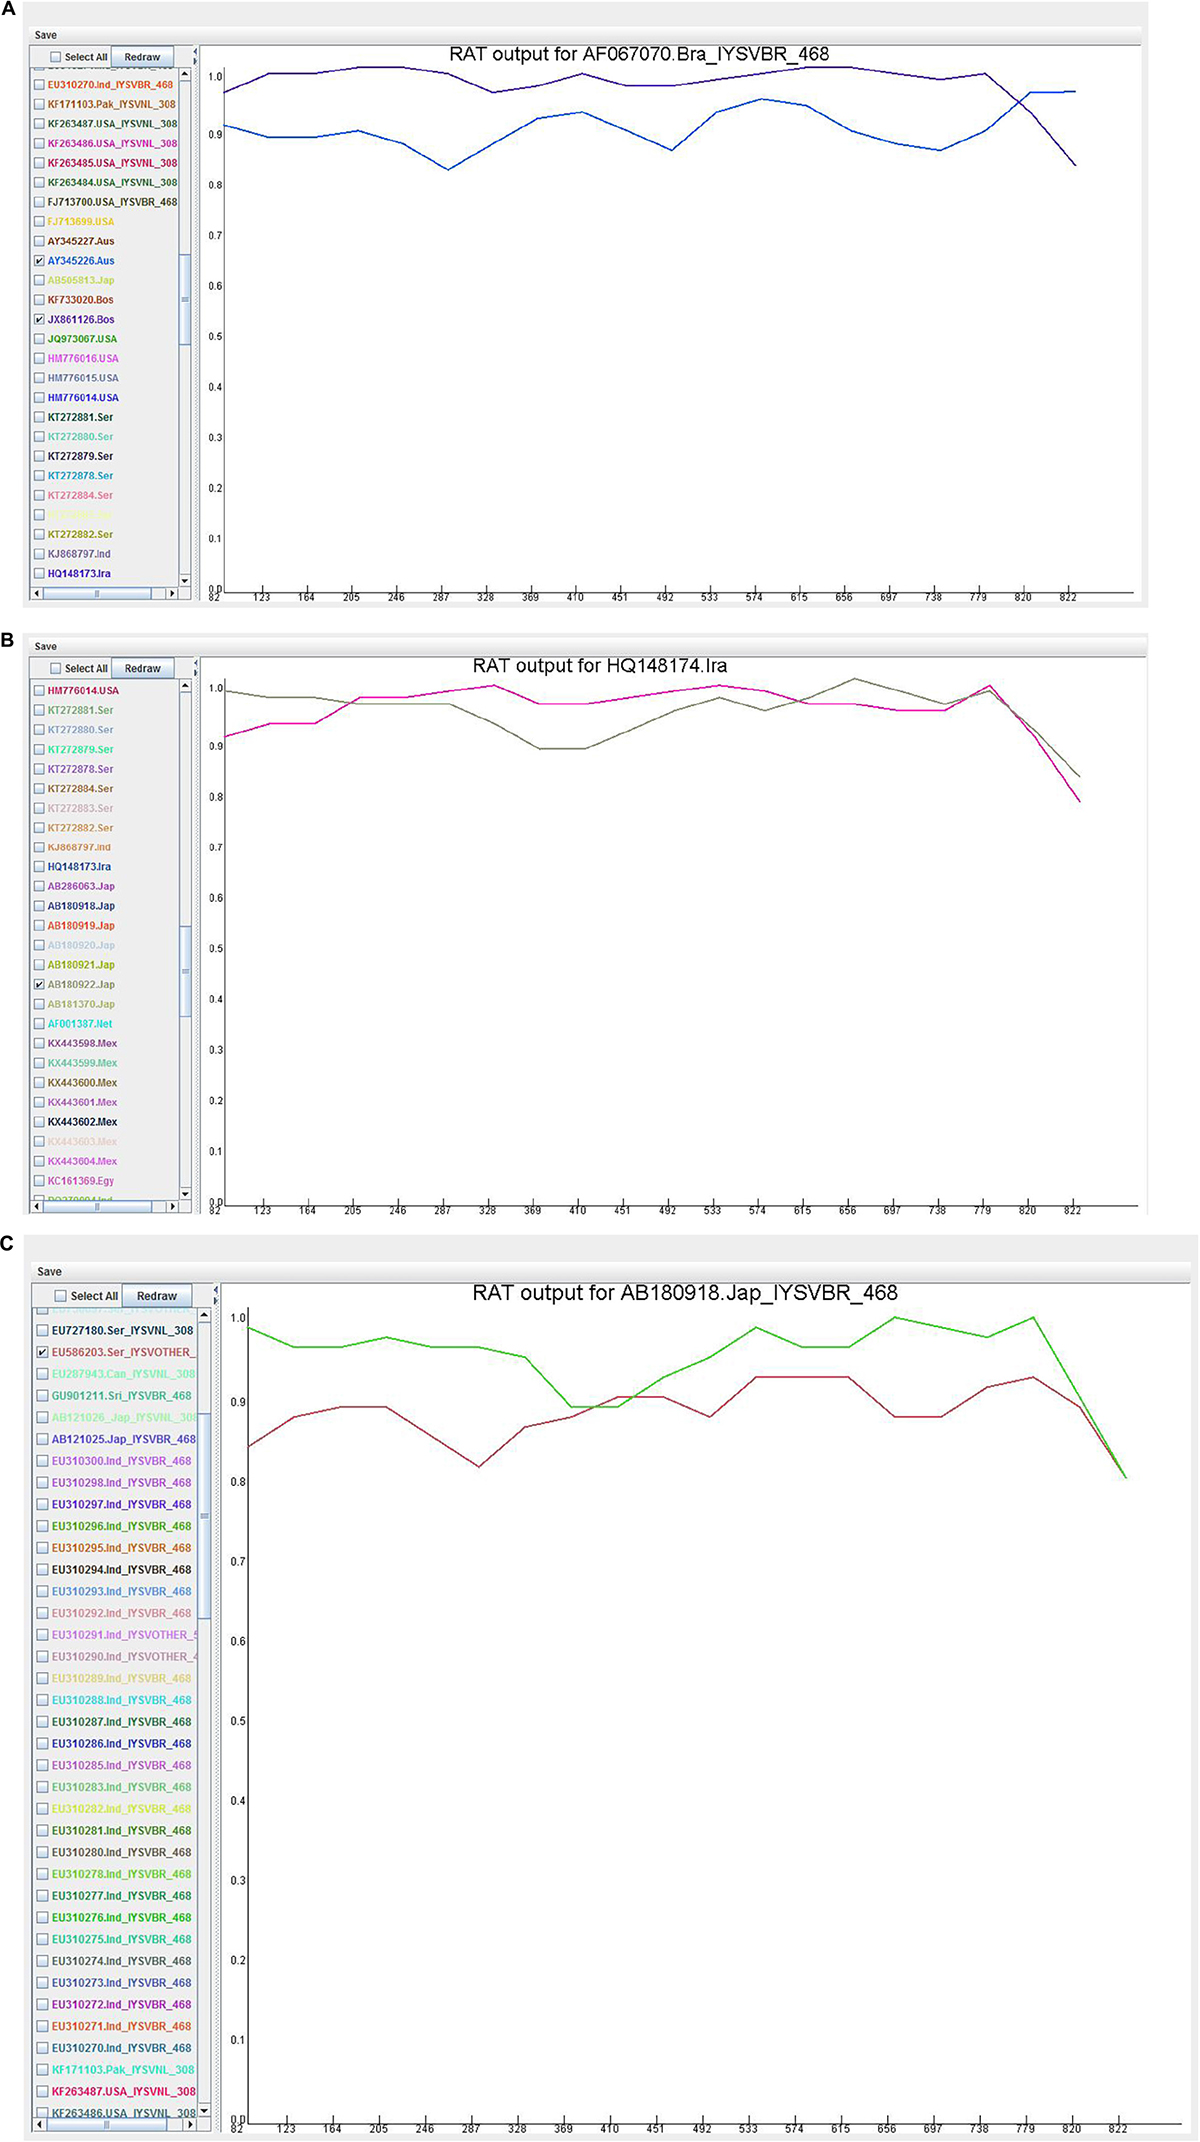
Figure 5. Recombination cross over sites in the Iris yellow spot orthotospovirus nucleocapsid (N) gene generated by Recombination Analysis Tool. The X-axis denotes sequence location along the genome and Y-axis represents the genetic distance. (A) AF067070_Brazil, the crossover site is located at 3′ end portion of the genome; (B) HQ148174_Iran, the crossover sites were located toward the 5′ and 3′ ends of the genome; (C) AB180918_Japan, the crossover site is located in the middle portion of the genome.
Bayesian Evolutionary Analysis by Sampling Trees (BEAST)
The rates of nucleotide substitution in tospovirus genomes have not been reported. Therefore, the global repository of IYSV N gene sequences was used to estimate the rates of nucleotide substitution and discern the rapidity with which molecular evolution might occur in the tospoviruses. Genetic recombinants were removed for BEAST analysis since their inclusion violates the assumption of coalescent-based analyses and thus could result in incorrect estimates of the rate of evolution. For nucleotide models, Hasegawa-Kishino-Yano (HKY)-based analysis was performed and it converged satisfactorily. While comparing two models if the marginal posterior distributions of the log-likelihoods do not overlap then the model with the higher posterior distribution of log-likelihood was preferred. Estimate is a better approximation of the true posterior distribution when larger Effective Sample Size (ESS) is available (ESS > 200 are desirable). Based on the above criteria, General Time Reversible (GTR) relaxed exponential growth clock model with coalescent constant population was found to be the best fit with a marginal likelihood mean substitution rate of 5.08 × 10⁻⁵ subs/site/year, 95% highest posterior density (HPD) substitution rate between 5.11 × 10⁻⁵ and 5.06 × 10⁻⁵ and ESS was 305 (Supplementary Table 2). Bayesian phylogenetic tree separated the IYSV isolates into two distinct clades, clade I comprising of IYSVBR isolates and clade II comprising IYSVNL isolates. The isolates that belonged to the same geographic region (or same country) clustered together (Figure 6).
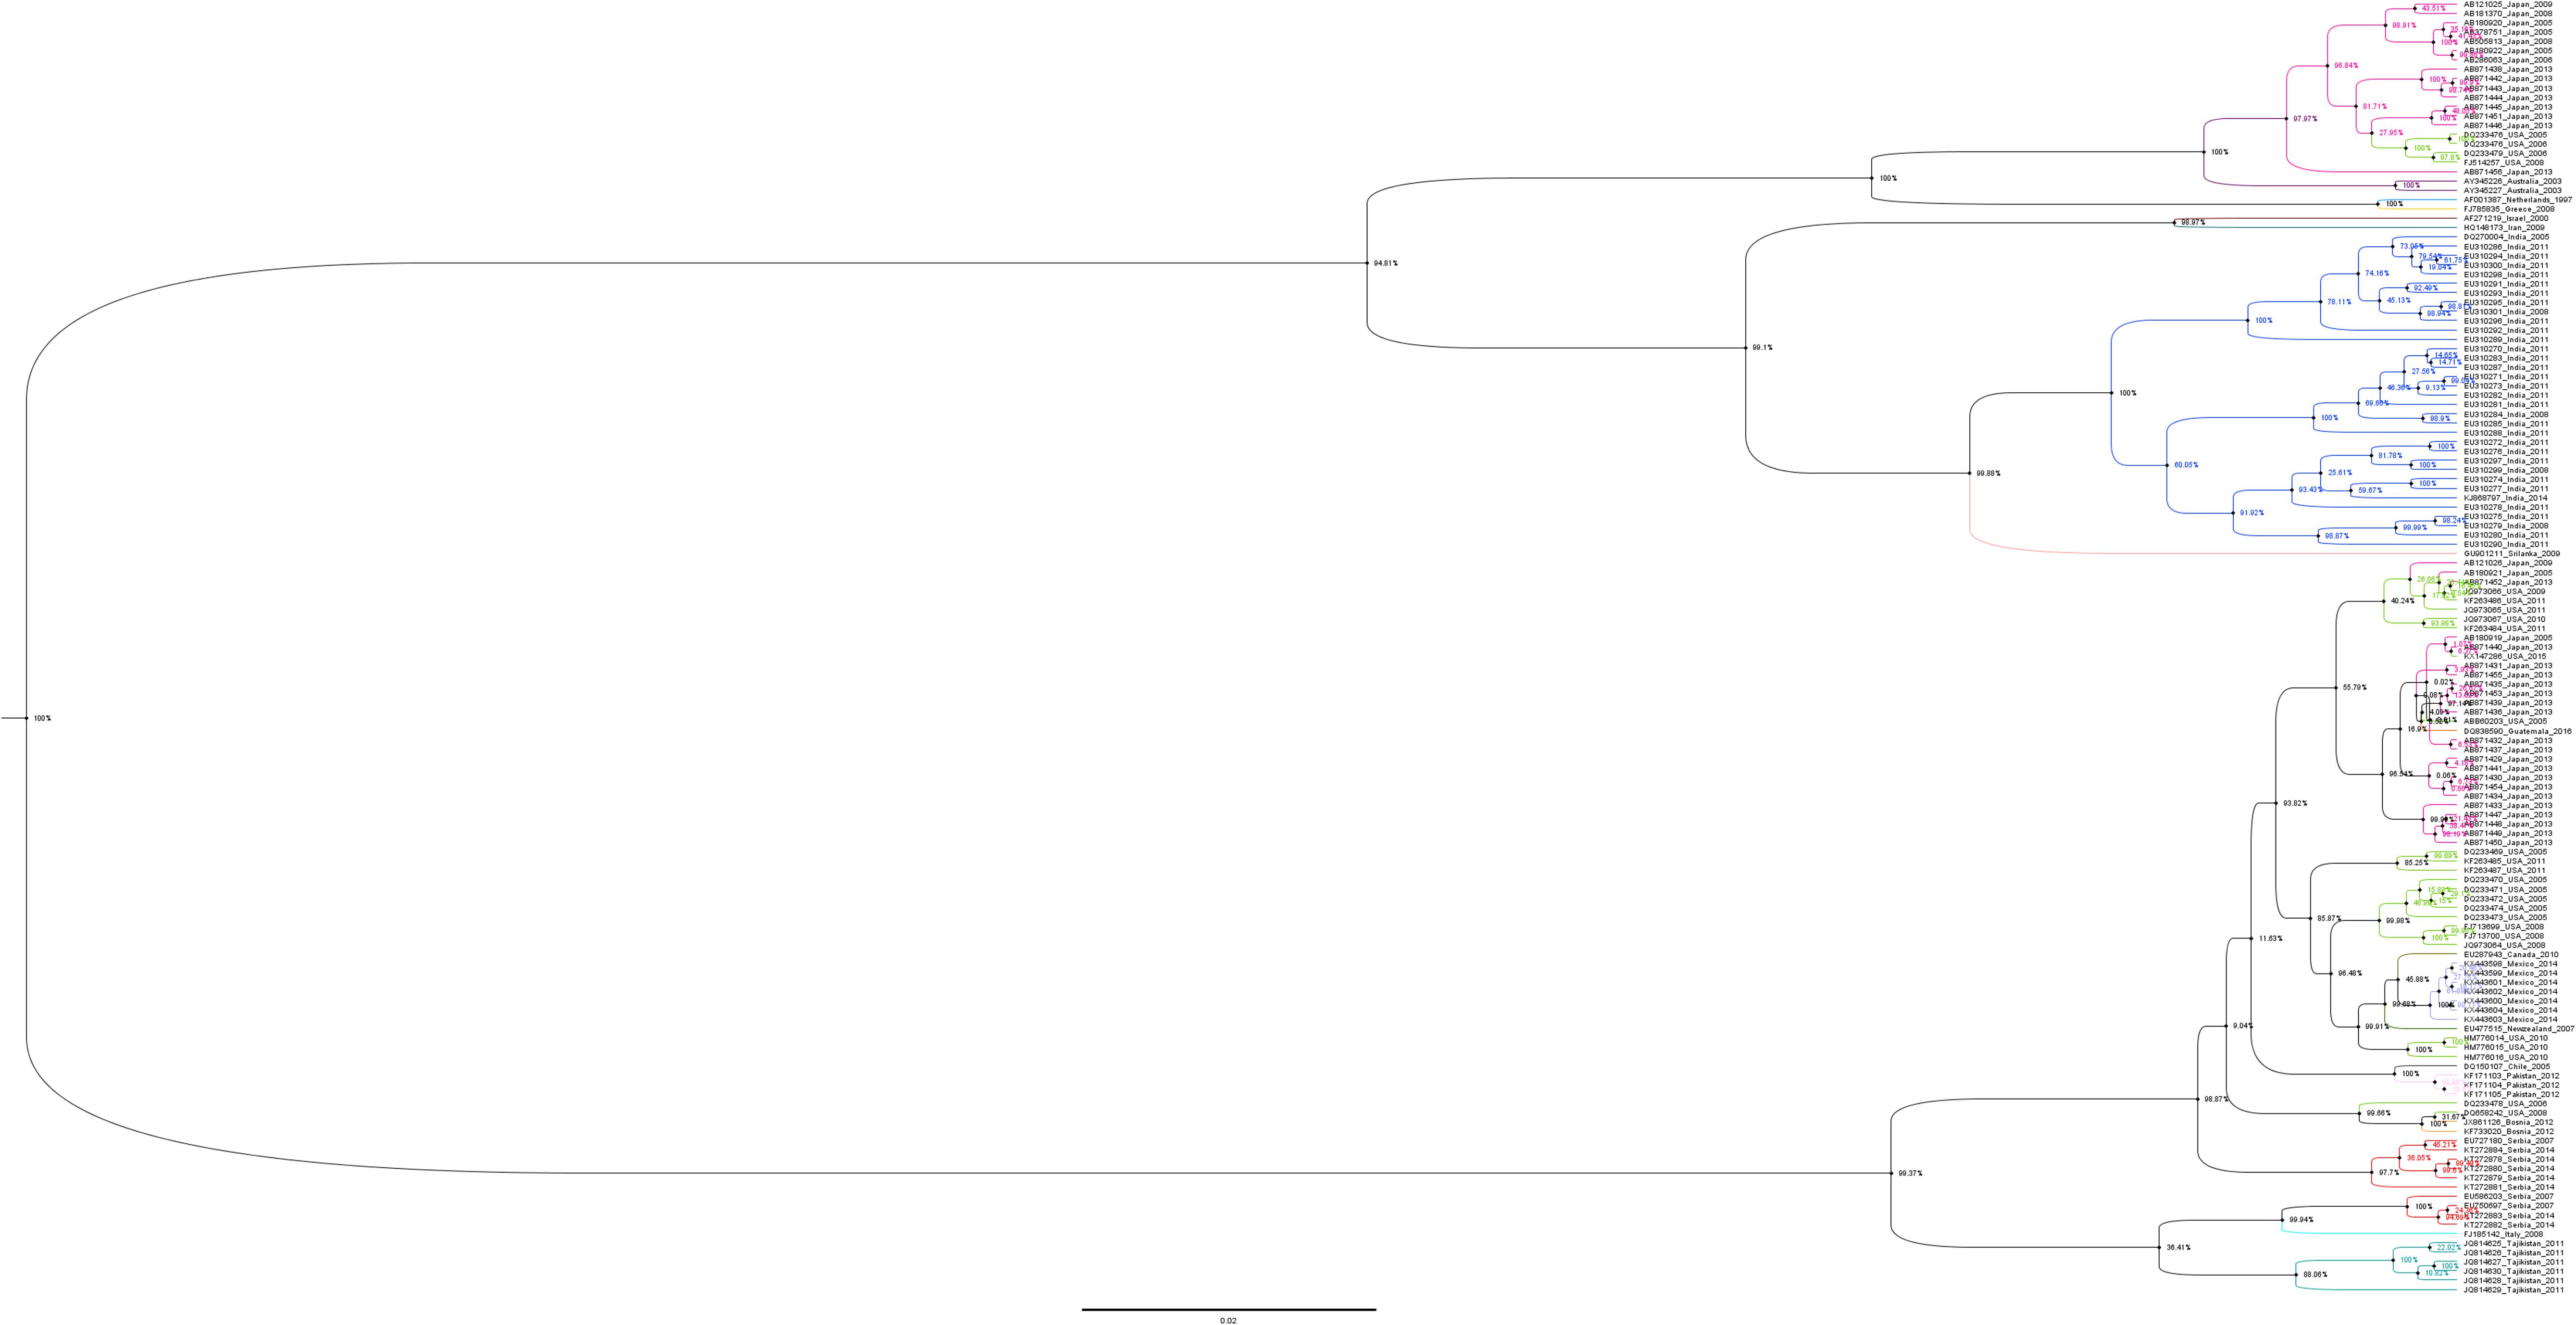
Figure 6. Maximum Clade Credibility (MCC) tree of Iris yellow spot orthotospovirus (IYSV) nucleocapsid (N) gene (nucleotide sequences) generated in BEAST v2.4.6. Nodes of IYSV isolates reported from different countries are colored.
Discussion
The global population structure and temporal dynamics of the IYSV conducted previously (Iftikhar et al., 2014) based on N gene sequences delineated that the viral isolates could be categorized into two major genotypes (IYSVBR and IYSVNL). Further, temporal dynamics of IYSV showed greater incidence of IYSVBR post-2005 compared to IYSVNL. Since the last publication, the number of N gene sequences added to the public repository has increased significantly. To gain a better understanding of the evolutionary genomics and to further gain deeper insights into the evolution rate of IYSV, we analyzed 142 complete N gene sequences using a wide range of computational tools to infer molecular evolutionary genomics.
In silico RFLP analysis to categorize the genotype of IYSV isolates showed that the majority of the isolates belonged to IYSVNL category (55.63%), whereas 38.73% of IYSVBR isolates were observed. There was an increment in IYSVNL genotype incidence or characterization compared to IYSVBR since the last report (Iftikhar et al., 2014). Interestingly, gene flow estimates showed greater gene flow between NL and BR genotypes, rather than between the individual major genotypes and the “other” category. Even between the major genotypes, IYSVNL exhibited a greater gene flow with IYSVother. Also, a greater genetic diversity was observed in IYSVother, compared to NL and BR. However, codon substitution analysis of N gene showed little change since the last study (Iftikhar et al., 2014). In fact, the positively selected codons (codon positions 139 in BR and NL and 270 in IYSVother) remained intact despite the substantial increase in the number of isolates examined, suggesting the importance of these codon positions in improving the fitness of nucleocapsid protein. The negative selections in the other codon positions imply that the deleterious mutations in those positions are effectively removed in the IYSV population as a whole. Most of the codons of the N gene are neither under positive nor negative selection suggesting the neutral evolution of these codons.
Recombination is a common phenomenon in RNA viruses but the implications of recombination for evolution is not well studied (Sztuba-Solinska et al., 2011). There is a serious limitation in understanding the contribution of recombination to evolution of IYSV due to lack of full-length genome sequences. The potential recombinants identified in this study belonged to BR type which seems to be evolving using population expansion strategies. The recombination breakpoints were at 5’ and 3’ ends suggesting that these are potential hot spots for recombination (Gawande et al., 2015).
In the BEAST analysis, General Time Reversible (GTR) relaxed exponential growth clock model with coalescent constant population was found to be the best fit model explaining the genetic architecture of IYSV population. In a similar analysis of PVY genomic sequences, it was found that the relaxed uncorrelated log normal clock was the best fit with a population of constant size (Gibbs et al., 2017). Further, similar topology of the phylogenetic tree was obtained by both ML method and Bayesian MCC based phylogeny for IYSV.
PVY dating was reported by comparing the estimated phylogenetic dates with historical events in the worldwide adoption of potato and other PVY hosts (Gibbs et al., 2017). While the potato-PVY analysis was based on the sample collection dates over several decades, onion-IYSV interactions are relatively new and hence predicting the phylodynamic patterns and demographic history of IYSV require more such data on temporal scale. The PVY demographic history and population expansion was deduced and compared with that of geographic distribution of host (potato) suggesting direct influence of potato cultivation area on the population size of the virus (Mao et al., 2019). In this context, further studies how expansion of onion cultivation area influences the population expansion of IYSV will be interesting.
Bayesian coalescent estimates of evolutionary dynamics of citrus tristeza virus, based on the p25 gene, showed that the rate of substitution was at 1.19 × 10⁻³ subs/site/year (Benítez-Galeano et al., 2017). Similarly, Bayesian phylogenetic reconstruction-based nucleotide substitution rates of CP gene derived from four species of viruses in Secoviridae family estimated it to range 9.29 × 10⁻³ to 2.74 × 10⁻³ (subs/site/year) (Thompson et al., 2014) while for tobamovirus the estimate ranged from 1 × 10⁻⁵ and 1.3 × 10⁻³ substitutions per site, per year (Pagan et al., 2010). Further, Bayesian analysis of VPg gene of PVY reveals that it has been evolving at a rate of 5.60 × 10⁻⁴ subs/site/year (Mao et al., 2019). Thus, the mean substitution rates identified for the IYSV N gene are comparable to those found in other plant-infecting RNA viruses. Substitution rates tend to be higher in RNA viruses as they are shown to mutate at faster rate. These mutations help in viral emergence on novel hosts but are not adaptive (Sacristan and Garcia-Arenal, 2008). Furthermore, the time of divergence of PVY clades, clade N and clade O, was found to be the year 1861 CE (95% credibility interval 1750–1948 CE) (Mao et al., 2019). Similar estimation of temporal divergence of IYSVBR and IYSVNL and the role of geographically driven adaptation of IYSV are worth exploring for a better understanding of the evolutionary dynamics of IYSV.
There are a very limited number of sequences of the other IYSV genes (NSm, NSs, GN/GC, RdRp) and even fewer complete genome sequences. Evolutionary analysis on such small sample size is not feasible. In the absence of complete genome sequences of a considerable number of the virus isolates (as is the case of IYSV) extrapolation of results of a single (or a few) gene(s) for the entire species is not uncommon. There are increasing number of studies on molecular evolutionary analysis, including phylodynamics and temporal evolutionary features of plant viruses based on a single or few viral gene sequences, such as VPg of PVY (Mao et al., 2019), NABP and CP genes of Potato virus M (PVM) (He et al., 2019) and P3, CI, Nib genes of (PVY) (Gao et al., 2020). However, to avoid any discrepancies in extrapolating the evolutionary analysis based on one or a few genes of a virus to the entire virus species, next generation sequencing–based sequencing followed by de novo assembly would provide a near complete genomic sequences that could be used to generate a more comprehensive picture of the genetic diversity of the virus populations (Zarghani et al., 2018).
Conclusion
IYSVNL was found to be the predominant genotype on a global scale. Interestingly, the IYSVother genotype is genetically more diverse than IYSVBR and IYSVNL genotypes. Population structure analysis revealed that it is under purifying selection and the phenomenon of population expansion is occurring. BEAST-based molecular clock analysis showed that the rates of molecular evolution of IYSV N gene are similar to other plant RNA viruses. This study is a step forward in identifying molecular factors that contribute to the evolution of IYSV, and serves as a foundation for further evolutionary genomic studies on one of the economically important plant virus groups.
Data Availability Statement
The raw data supporting the conclusions of this article will be made available by the authors, without undue reservation.
Author Contributions
AT and HP conceived and designed the experiments. AT and YZ performed the experiments. AT, SR, YZ, and HP analyzed the data. AT, CO, SR, YZ, RI, and HP contributed reagents, materials, and analysis tools. AT, SR, and HP wrote the manuscript, proof-read and finalized the manuscript. All authors read and approved the final manuscript.
Funding
This work was supported in part by the Specialty Crop Block Grant Program from the Washington State Department of Agriculture (Grant # K2527), USDA National Institute of Food and Agriculture (NIFA), Specialty Crop Research Initiative (Grant No. 2018-5118128435), and USDA-NIFA Hatch project Accession #1016563 “Reducing the Impact of Pests and Diseases Affecting Washington Agriculture.” The funders have no role in study design, data collection and analysis, decision to publish, or preparation of the manuscript.
Conflict of Interest
The authors declare that the research was conducted in the absence of any commercial or financial relationships that could be construed as a potential conflict of interest.
Publisher’s Note
All claims expressed in this article are solely those of the authors and do not necessarily represent those of their affiliated organizations, or those of the publisher, the editors and the reviewers. Any product that may be evaluated in this article, or claim that may be made by its manufacturer, is not guaranteed or endorsed by the publisher.
Acknowledgments
AT would like to thank the Indian Council of Agricultural Research and Washington State University for their fellowship and financial support.
Supplementary Material
The Supplementary Material for this article can be found online at: https://www.frontiersin.org/articles/10.3389/fmicb.2021.633710/full#supplementary-material
Abbreviations
IYSV, Iris yellow spot orthotospovirus; N gene, Nucleocapsid gene; RFLP, Restriction Fragment Length Polymorphism; RDP, Recombination Detection Program; RAT, Recombination Analysis Tool; BEAST, Bayesian Evolutionary Analysis by Sampling Trees.
References
Bag, S., Schwartz, H. F., Cramer, C. S., Havey, M. J., and Pappu, H. R. (2015). Iris yellow spot virus (Tospovirus: Bunyaviridae): from obscurity to research priority. Mol. Plant Pathol. 16, 224–237. doi: 10.1111/mpp.12177
Benítez-Galeano, M. J., Castells, M., and Colina, R. (2017). The evolutionary history and spatiotemporal dynamics of the NC lineage of citrus Tristeza Virus. Viruses 9:272. doi: 10.3390/v9100272
Bouckaert, R., Heled, J., Kühnert, D., Vaughan, T., Wu, C. H., Xie, D., et al. (2014). BEAST 2: a software platform for bayesian evolutionary analysis. PLoS Comput. Biol. 10:e1003537. doi: 10.1371/journal.pcbi.1003537
Butkovic, A., Gonzalez, R., and Elena, S. F. (2021). Revisiting Orthotospovirus phylogeny using full-genome data and testing the contribution of selection, recombination and segment reassortment in the origins of members of new species. Arch. Virol. 166, 491–499. doi: 10.1007/s00705-020-04902-1
Centre for Agriculture and Bioscience International (CABI) - Invasive Species Compendium (2019). Available online at: https://www.cabi.org/isc/datasheet/28848 (accessed March 29, 2021).
Chen, S., Xing, Y., Su, T., Zhou, Z., Dilcher, D. L., and Soltis, D. E. (2012). Phylogeographic analysis reveals significant spatial genetic structure of Incarvillea sinesisas a product of mountain building. BMC Plant Biol. 12:58. doi: 10.1186/1471-2229-12-58
Cordoba-Selles, C., Cebrián-Mico, C., Alfaro-Fernández, A., Muñoz-Yerbes, M. J., and Jordá-Gutiérrez, C. (2007). First report of Iris yellow spot virus in commercial leek (Allium porrum) in Spain. Plant Dis. 91:1365. doi: 10.1094/PDIS-91-10-1365B
de Avila, A. C., de Haan, P., Kormelink, R., Resende, R. O., Goldbach, R. W., and Peters, D. (1993). Classification of tospoviruses based on phylogeny of nucleoprotein gene sequences. J. Gen. Virol. 74, 153–159. doi: 10.1099/0022-1317-74-2-153
Edgar, R. C. (2004). MUSCLE: multiple sequence alignment with high accuracy and high throughput. Nucleic Acids Res. 32, 1792–1797. doi: 10.1093/nar/gkh340
Etherington, G. J., Dicks, J., and Roberts, I. N. (2005). Recombination Analysis Tool (RAT): a program for the high-throughput detection of recombination. Bioinformatics 21, 278–281. doi: 10.1093/bioinformatics/bth500
FigTree (2018). Available online at: http://tree.bio.ed.ac.uk/software/figtree/ (accessed March 29, 2021).
Fu, Y. (1997). Statistical tests of neutrality of mutations against population growth, hitchhiking and background selection. Genetics 147, 915–925.
Fu, Y. X., and Li, W. H. (1993). Statistical tests of neutrality of mutations. Genetics 133, 693–709.
Gao, F., Kawakubo, S., Ho, S. Y., and Ohshima, K. (2020). The evolutionary history and global spatio-temporal dynamics of potato virus Y. Virus Evol. 6:veaa056. doi: 10.1093/ve/veaa056
Gawande, S., Gurav, V. S., Ingle, A. A., Martin, D. P., Asokan, R., and Gopal, J. (2015). Sequence analysis of Indian iris yellow spot virus ambisense genome segments: evidence of interspecies RNA recombination. Arch. Virol. 160, 1285–1289. doi: 10.1007/s00705-015-2354-x
Gent, D. H., Mohan, S. K., du Toit, L. J., Pappu, H. R., Fichtner, S. F., and Schwartz, H. F. (2006). Iris Yellow Spot Virus: an emerging threat to onion bulb and seed production. Plant Dis. 90, 1468–1480. doi: 10.1094/PD-90-1468
Gibbs, A. J., and Ohsima, K. (2010). Potyviruses and the digital revolution. Annu. Rev. Phytopathol. 48, 205–223. doi: 10.1146/annurev-phyto-073009-114404
Gibbs, A., Ohshima, K., Yasaka, R., Mohammadi, M., Gibbs, M. J., and Jones, R. A. C. (2017). The phylogenetics of the global population of potato virus Y and its necrogenic recombinants. Virus Evol. 3:vex002. doi: 10.1093/ve/vex002
Gibbs, M. J., Armstrong, J. S., and Gibbs, A. J. (2000). Sister – scanning: a monte carlo procedure for assessing signals in recombinant sequences. Bioinformatics 16, 573–582. doi: 10.1093/bioinformatics/16.7.573
He, Z., Chen, W., Yasaka, R., Chen, C., and Chen, X. (2019). Temporal analysis and adaptive evolution of the global population of potato virus M. Infect. Genet. Evol. 73, 167–174. doi: 10.1016/j.meegid.2019.04.034
Hewitt, G. M. (2004). Genetic consequences of climatic oscillations in the quaternary. Philos. Trans. R. Soc. Lond. B. Biol. Sci. 359, 183–195. doi: 10.1098/rstb.2003.1388
Hudson, R. R. (2000). A new statistic for detecting genetic differentiation. Genetics 155, 2011–2014.
Hudson, R. R., Boos, D. D., and Kaplan, N. L. (1992a). A statistical test for detecting geographic subdivision. Mol. Biol. Evol. 9, 138–151. doi: 10.1093/oxfordjournals.molbev.a040703
Hudson, R. R., Slatkin, M., and Maddison, W. P. (1992b). Estimations of levels of gene flow from DNA sequence data. Genetics 132, 583–589.
Iftikhar, R., Ramesh, S. V., Bag, S., Ashfaq, M., and Pappu, H. R. (2014). Global analysis of population structure, spatial and temporal dynamics of genetic diversity, and evolutionary lineages of Iris yellow spot virus (Tospovirus:Bunyaviridae). Gene 547, 111–118. doi: 10.1016/j.gene.2014.06.036
Karavina, C., Ibaba, J. D., Gubba, A., and Pappu, H. R. (2016). First report of Iris yellow spot virus infecting garlic and leek in Zimbabwe. Plant Dis. 100:657. doi: 10.1094/PDIS-09-15-1022-PDN
Kumar, S., Stecher, G., and Tamura, K. (2016). MEGA7: molecular evolutionary genetics analysis version 7.0 for bigger datasets. Mol. Biol. Evol. 33, 1870–1874. doi: 10.1093/molbev/msw054
Mandal, B., Jain, R. K., Krishnareddy, M., KrishnaKumar, N. K., Ravi, K. S., and Pappu, H. R. (2012). Emerging problems of Tospoviruses (Bunyaviridae) and their management in the Indian subcontinent. Plant Dis. 96, 468–479. doi: 10.1094/PDIS-06-11-0520
Mao, Y., Bai, Y., Shen, J., Gao, F., Sun, X., Qiu, G., et al. (2019). Molecular evolutionary analysis of potato virus Y infecting potato based on the VPg gene. Front. Microbiol. 10:1708. doi: 10.3389/fmicb.2019.01708
Martin, D., and Rybicki, E. (2000). RDP: detection of recombination amongst aligned sequences. Bioinformatics 16, 562–563. doi: 10.1093/bioinformatics/16.6.562
Maynard, S. J. (1992). Analyzing the mosaic structure of genes. J. Mol. Evol. 34, 126–129. doi: 10.1007/BF00182389
Moya, A., Holmes, E. C., and Gonzalez-Candelas, F. (2004). The population genetics and evolutionary epidemiology of RNA viruses. Nat. Rev. Microbiol. 2, 279–288. doi: 10.1038/nrmicro863
Nischwitz, C., Pappu, H. R., Mullis, S. W., Sparks, A. N., Langston, D., Csinos, A. S., et al. (2007). Phylogenetic analysis of Iris yellow spot virus isolates from onion (Allium cepa) in Georgia (USA) and Peru. J. Phytopathol. 155, 531–535.
Oliver, J. E., and Whitfield, A. E. (2016). The genus Tospovirus: emerging Bunyaviruses that threaten food security. Annu. Rev. Virol. 3, 101–124. doi: 10.1146/annurev-virology-100114-055036
Pagan, I., Firth, C., and Holmes, E. C. (2010). Phylogenetic analysis reveals rapid evolutionary dynamics in the plant RNA virus genus Tobamovirus. J. Mol. Evol. 71, 298–307. doi: 10.1007/s00239-010-9385-4
Pappu, H. R., du Toit, L. J., Schwartz, H. F., and Mohan, K. (2006). Sequence diversity of the nucleoprotein gene of Iris yellow spot virus (genus Tospovirus family Bunyaviridae) isolates from the western region of the United States. Arch. Virol. 151, 1015–1023. doi: 10.1007/s00705-005-0681-z
Pappu, H. R., Jones, R. A. C., and Jain, R. K. (2009). Global status of tospovirus epidemics in diverse cropping systems: successes gained and challenges ahead. Virus Res. 141, 219–236. doi: 10.1016/j.virusres.2009.01.009
Pappu, H. R., Rosales, I. M., and Druffel, K. L. (2008). Serological and molecular assays for rapid and sensitive detection of Iris yellow spot virus infection of bulb and seed onion crops. Plant Dis. 92, 588–594. doi: 10.1094/pdis-92-4-0588
Pappu, H. R., Whitfield, A. E., and Oliveira, A. (2020). Tomato Spotted Wilt Virus. Encylopedia of Virology, Reference Module in Life Sciences, 4th Edn, Cambridge, MA: Elsevier Press. doi: 10.1016/B978-0-12-809633-8.21329-0
Posada, D., and Crandall, K. A. (2001). Evaluation of methods for detecting recombination from DNA sequences: computer simulations. Proc. Natl. Acad. Sci. U.S.A. 98, 13757–13762. doi: 10.1073/pnas.241370698
Rambaut, A., Lam, T. T., Carvalho, L. M., and Pybus, O. G. (2016). Exploring the temporal structure of heterochronous sequences using TempEst (formerly Path-O-Gen). Virus Evol. 2:vew007. doi: 10.1093/ve/vew007
Resende, R.,, Whitfield, A. E., and Pappu, H. R. (2020). “Orthotospoviruses (Tospoviridae),” in Encylopedia of Virology, 4th Edn., eds D. H. Bamford and M. Zuckerman (Cambridge, MA: Academic Press), 507–515. doi: 10.1016/B978-0-12-809633-8.21337-X
Restriction Mapper (2009). Available online at: www.restrictionmapper.org (accessed March 29, 2021).
Sacristan, S., and Garcia-Arenal, F. (2008). The evolution of virulence and pathogenicity in plant. Mol. Plant Pathol. 9, 369–384. doi: 10.1111/j.1364-3703.2007.00460.x
Salminen, M. O., Carr, J. K., Burke, D. S., and McCutchan, F. E. (1995). Identification of breakpoints in intergenotypic recombinants of HIV type 1 by Bootscanning. AIDS Res. Hum. Retrovir. 11, 1423–1425. doi: 10.1089/aid.1995.11.1423
Sawyer, S. A. (1999). Geneconv: A Computer Package for the Statistical Detection of Gene Conversion. St. Louis, MI: Department of Mathematics, Washington University.
Sztuba-Solinska, J., Urbanowicz, A., Figlerowicz, M., and Bujarski, J. J. (2011). RNA-RNA recombination in plant virus replication and evolution. Annu. Rev. Phytopathol. 49, 415–443. doi: 10.1146/annurev-phyto-072910-095351
Tabassum, A., Reitz, S., Rogers, P., and Pappu, H. R. (2016). First report of Iris yellow spot virus infecting green onion (Allium fistulosum) in the United States. Plant Dis. 100:2539. doi: 10.1094/PDIS-05-16-0599-PDN
Tajima, F. (1989). Statistical method for testing the neutral mutation hypothesis by DNA polymorphism. Genetics 123, 585–595.
Thompson, J. R., Kamath, N., and Perry, K. L. (2014). An evolutionary analysis of the Secoviridae family of viruses. PLoS One 10:e0119267. doi: 10.1371/journal.pone.0119267
Tracer (2018). Available online at: http://tree.bio.ed.ac.uk/software/tracer/ (accessed March 29, 2021).
Turina, M., Kormelink, R., and Resende, R. O. (2016). Resistance to Tospoviruses in vegetable crops: epidemiological and molecular aspects. Annu. Rev. Phytopathol. 54, 347–371. doi: 10.1146/annurev-phyto-080615-095843
Weaver, S., Shank, S. D., Spielman, S. J., Li, M., Muse, S. V., and Pond, S. L. K. (2018). Datamonkey 2.0: a modern web application for characterizing selective and other evolutionary processes. Mol. Biol. Evol. 35, 773–777. doi: 10.1093/molbev/msx335
Zarghani, S. N., Hily, J. M., Glasa, M., Marais, A., Wetzel, T., Faure, C., et al. (2018). Grapevine virus T diversity as revealed by full-length genome sequences assembled through high-throughput sequence data. PLoS One 13:e0206010. doi: 10.1371/journal.pone.0206010
Zen, S., Okuda, M., Ebihara, K., Uematsu, S., Hanada, K., Iwanami, T., et al. (2005). Genetic differentiation of Iris yellow spot virus on onion (Allium cepa) and pathogenicity of two IYSV strains on onion and leaf onion (A. schoenoprasum). Jpn. J. Phytopathol. 71, 123–126. doi: 10.3186//jjphytopath.71.123
Keywords: BEAST, evolutionary genomics, gene flow, genetic differentiation, genetic recombination, iris yellow spot orthotospovirus, in silico RFLP, phylogenetics
Citation: Tabassum A, Ramesh SV, Zhai Y, Iftikhar R, Olaya C and Pappu HR (2021) Viruses Without Borders: Global Analysis of the Population Structure, Haplotype Distribution, and Evolutionary Pattern of Iris Yellow Spot Orthotospovirus (Family Tospoviridae, Genus Orthotospovirus). Front. Microbiol. 12:633710. doi: 10.3389/fmicb.2021.633710
Received: 26 November 2020; Accepted: 24 June 2021;
Published: 20 September 2021.
Edited by:
Akhtar Ali, University of Tulsa, United StatesReviewed by:
Steve Wylie, Murdoch University, AustraliaAdane Abraham, Botswana International University of Science and Technology, Botswana
Copyright © 2021 Tabassum, Ramesh, Zhai, Iftikhar, Olaya and Pappu. This is an open-access article distributed under the terms of the Creative Commons Attribution License (CC BY). The use, distribution or reproduction in other forums is permitted, provided the original author(s) and the copyright owner(s) are credited and that the original publication in this journal is cited, in accordance with accepted academic practice. No use, distribution or reproduction is permitted which does not comply with these terms.
*Correspondence: Hanu R. Pappu, aHJwQHdzdS5lZHU=