 Buu Minh Tran1*
 Conor O’Byrne
 Tjakko Abee
 Bert Poolman
- 1Department of Biochemistry, University of Groningen, Groningen, Netherlands
- 2School of Natural Sciences, National University of Ireland, Galway, Ireland
- 3Laboratory of Food Microbiology, Wageningen University Research, Wageningen, Netherlands
Protein mobility in the cytoplasm is essential for cellular functions, and slow diffusion may limit the rates of biochemical reactions in the living cell. Here, we determined the apparent lateral diffusion coefficient (DL) of GFP in Listeria monocytogenes as a function of osmotic stress, temperature, and media composition. We find that DL is much less affected by hyperosmotic stress in L. monocytogenes than under similar conditions in Lactococcus lactis and Escherichia coli. We find a temperature optimum for protein diffusion in L. monocytogenes at 30°C, which deviates from predicted trends from the generalized Stokes-Einstein equation under dilute conditions and suggests that the structure of the cytoplasm and macromolecular crowding vary as a function of temperature. The turgor pressure of L. monocytogenes is comparable to other Gram-positive bacteria like Bacillus subtilis and L. lactis but higher in a knockout strain lacking the stress-inducible sigma factor SigB. We discuss these findings in the context of how L. monocytogenes survives during environmental transmission and interaction with the human host.
Introduction
A universal property of life is that the components in a cell move around, and in bacteria, this motion is diffusive and not driven by metabolic energy. In an aqueous solution, the mobility or lateral diffusion coefficient (DL) of globular proteins is given by the Stokes-Einstein relation, and in living cells, DL values are lower because of a multitude of effects not limited to macromolecular crowding, phase separation, and compartmentalization (Konopka et al., 2009; Mika and Poolman, 2011; Parry et al., 2014; Joyner et al., 2016; Munder et al., 2016; Schavemaker et al., 2018). Knowing the DL of proteins, their possible confinement, and transient interactions are essential for a quantitative description of the biochemical processes in the cell.
The macromolecular crowdedness in the cell is conspicuous but still underappreciated (Ellis, 2001; Rivas and Minton, 2016; van den Berg et al., 2017). The inside of cells (and cell membranes) is filled with a high density of macromolecules. The concentration of cytoplasmic protein, RNA, and DNA range from 200–320 mg/ml, 75–120 mg/ml, and 11–18 mg/ml, respectively, that is, for Escherichia coli cells grown in media of osmolality varying from 0.1 to 1.02 Osm (Cayley et al., 1991). Although E. coli is by far best studied, similar numbers have been reported for other bacteria, and a crowding wherein the macromolecules occupy a volume of 15 to 20% of the cytosol may be generally valid for all forms of life (Zimmerman and Trach, 1991; Cayley and Record, 2003, 2004; Boersma et al., 2015; van den Berg et al., 2017). The excluded volume of the macromolecules influences the activities of cytoplasmic molecules, favors in general self-association of proteins, and impacts the condensation of nucleic acids (de Vries, 2010; Kim et al., 2011). Furthermore, the high excluded volume can influence reaction rates in the cell (Schavemaker et al., 2018).
At an ambient temperature of 298K (24.85°C) and in an aqueous solution, GFP has DL ∼87 μm2/s, which according to the Stokes-Einstein’s equation matches a globular particle with a Stokes radius of 2.82 nm (Miller, 1924; Terry et al., 1995; Swaminathan et al., 1997). The DL values of GFP in the cytosol vary from 20 to 30 μm2/s in Chinese hamster ovary (CHO) and Dictyostelium amoebae cells (Swaminathan et al., 1997; Potma et al., 2001; Verkman, 2002) to 3–14 μm2/s in bacterial cells (Elowitz et al., 1999; Konopka et al., 2009; Mika and Poolman, 2011; Mika et al., 2014), indicative of increased macromolecular crowding in prokaryotic compared to eukaryotic cells. Apart from macromolecular crowding, the lateral diffusion of macromolecules is also influenced by surface properties of the molecules; cationic proteins interact with the ribosomes, which slows down their diffusion both in prokaryotic (Schavemaker et al., 2017) and in mammalian cells (Xiang et al., 2020).
The mobility of proteins in the cell depends on the osmolality of the growth medium, and DL in the cytoplasm decreases upon osmotic upshift (hypertonicity) and can increase under hypotonic conditions. For instance, DL of GFP in the cytosol of the amoebae increases twofold (46 μm2/s) when cells are suspended in distilled water (hypoosmotic) and decrease to 17 μm2/s in 300 mM sorbitol solution (Potma et al., 2001). Similar trends are seen in other eukaryotic cells (Swaminathan et al., 1997; Xiang et al., 2020). The DL of GFP in E. coli drops from 14 to 6 μm2/s when the medium osmolality is increased from 0.28 to 1.45 Osm, and contrary to the observations in eukaryotic cells, the DL also decreases when cells are subjected to hypotonic conditions (0.1 Osm) (Konopka et al., 2009). We emphasize that the effect of medium osmolality is attenuated in cells with a high turgor, as initially the osmotic pressure difference across the membrane will be affected, which can be without much effect on the cell volume and thus the internal crowding. The turgor is small in cells without a wall but can vary from a few atmospheres in Gram-negative bacteria to more than 10 atm in Gram-positive bacteria (Whatmore and Reed, 1990; Cayley et al., 2000; Yao et al., 2002; Holland and Walsby, 2009; Deng et al., 2011; Mika et al., 2014). Cells adapt to changes in medium osmolality on the time scale of minutes to hours to maintain volume and crowding homeostasis (van den Berg et al., 2017). Bacterial cells exposed to hyperosmotic stress restore their volume by accumulating K+ ions and compensating anions and compatible solutes (Wood, 1999, 2011; Bremer and Krämer, 2019).
With the development of novel microscopy techniques and improvement of fluorescent probes, various methods are available to determine the lateral diffusion of molecules in the cell and to get insight into the dynamic structure of the cytoplasm (distinct phases, confined spaces, transient interactions between molecules) (Selvin, 2000; Sprague et al., 2004; Wawrezinieck et al., 2005; Hess et al., 2006; Fu et al., 2010). The method of fluorescent recovery after photo-bleaching (FRAP) is most often used to probe the diffusion of molecules; variations on FRAP approaches such as pulsed-FRAP, and whole-cell-FRAP can be advantageous for specific applications (Elowitz et al., 1999; Konopka et al., 2006; Mullineaux et al., 2006; van den Bogaart et al., 2007). In this paper, we employ conventional FRAP to determine the mobility of GFP (anionic and cationic derivatives) in L. monocytogenes, a Gram-positive bacterial pathogen.
L. monocytogenes is the causative agent for the foodborne infection listeriosis, which is a particular threat for pregnant, elderly, or immunocompromised individuals (Cossart and Toledo-Arana, 2008; Radoshevich and Cossart, 2018). L. monocytogenes is well-known for its resilience to osmotic challenges. For instance, the upper limit for growth under osmotic stress in the brain heart infusion (BHI) and chemically defined medium (CDM) are 2 and 1 M NaCl, respectively, which in CDM could be expanded to 1.5 M NaCl when the medium was supplied with the compatible solute glycine betaine (Amezaga et al., 1995). In L. monocytogenes, SigB plays essential roles in the general stress response, resistance to acid, oxidative and osmotic stress, growth at low temperatures, and the response to carbon starvation (Becker et al., 1998, 2000; Wiedmann et al., 1998; Ferreira et al., 2001; Fraser et al., 2003; Wemekamp-Kamphuis et al., 2004); and SigB also contributes to the virulence of the organism (Kazmierczak et al., 2003; Sue et al., 2004; Kim et al., 2005). While many studies have focused on the ability of this pathogen to survive different harsh environmental conditions (McClure et al., 1989; Walker et al., 1990; O’Driscoll et al., 1996; Chaturongakul et al., 2008; Chan and Wiedmann, 2009), little is known of the dynamic structure of the cytoplasm of L. monocytogenes under these conditions. The dynamics inside a bacterium can be assessed by the diffusion of proteins in its cytoplasm. Therefore, we determined the translational diffusion coefficients of GFP in L. monocytogenes as a function of temperature and osmotic stress, using wild type and stress-sensitive σB null (ΔsigB) strains. We also measured the volume and turgor pressure as these parameters are connected to macromolecular crowding and diffusion in the cell.
Materials and Methods
Strains and Plasmids
We used L. monocytogenes EGD-e, wild-type and ΔsigB strain. The L. monocytogenes EGD-e ΔsigB mutant strain was constructed by allelic replacement of the wild-type gene by homologous recombination, using the integrative shuttle vector pMAD (Arnaud et al., 2004). The deletion of 561 bases of the sigB gene was confirmed by whole-genome sequencing and the ΔsigB strain does not possess any additional mutations in the chromosome compared to the isogenic parental strain (Marinho et al., 2019; Guerreiro et al., 2020). The green fluorescent protein (GFP) was expressed from the constitutive promoter Pdlt using vector pNF8, which was provided by Tine Rask Licht at the Technical University of Denmark (Andersen et al., 2006). In the original paper, the vector bears the gfp-mut1 variant of GFP (Fortineau et al., 2000). However, according to the sequencing data (Supplementary Materials), we obtained the gfp-mut3b variant (Cormack et al., 1996), which has a net surface charge of −8 (at pH 7.5). We also constructed a vector expressing a GFP derivative with an overall surface charge of +25, namely pNFpos25GFP. Here, the gfp-mut3b gene of pNF8 was replaced by the +25gfp gene present in pBAD +25GFP (Schavemaker et al., 2017), using the USER® fusion method (Geu-Flores et al., 2007); the GFP +25 variant has an N-terminal his-tag. Competent L. monocytogenes cells were prepared and cells were transformed using the protocol previously described by Monk et al. (2008).
Preparation of Cells for FRAP Measurements
All cultures have been handled at the biosafety level II (BSLII). In brief, glycerol stocks of L. monocytogenes stored at −80°C freezer were inoculated in 3 mL Brain Heart Infusion (BHI) medium in 10 mL tubes and incubated overnight at 30°C with 200 rpm shaking. Unless indicated otherwise, the cultures for the FRAP measurements were supplied with erythromycin (15 μg/mL) and nalidixic acid (100 μg/mL) (Fortineau et al., 2000). On day 2, the culture in the stationary phase was diluted 1:250 into a fresh pre-warmed medium (BHI or chemically defined medium, CDM) and incubated under the same conditions. The CDM is based on the recipe of Amezaga et al. (1995), and the medium was supplemented with 0.4% w/v glucose. On day 3, the culture was diluted again in the fresh and pre-warmed medium to obtain OD600 0.15–0.2. The new culture was then incubated at 30°C with 200 rpm shaking until the OD600 reached 0.3–0.8 and thereafter used for FRAP measurements. All cultures were grown in 10 mL culturing tubes, and each FRAP experiment was repeated at least three times (independent biological replicates).
To determine the effect of medium osmolality, cells from an overnight culture in CDM were transferred to CDM supplemented with varying concentrations of NaCl. Osmolality values were measured with an Osmomat 030 cryoscopic osmometer (Gonotec, Berlin, and Germany). The osmolality of freshly prepared CDM medium is 0.23 Osm and was increased to maximally 2.37 Osm by the addition of NaCl. The cultures grown at higher osmolality required a longer time to reach the mid-exponential phase, and therefore, we adjusted the time of harvesting accordingly. For the osmotic shock experiments, cells from an overnight culture in CDM were diluted in CDM (0.23 Osm) and grown to the mid-exponential phase. Next, the cells were osmotically shocked in CDM supplied with NaCl and immediately prepared for microscopy experiments, which were completed within 30 to 50 min after the osmotic upshift.
To determine the effect of temperature, the cells were grown on day 1 and 2 at 30°C, and on day 3 at OD600 of 0.3–0.4 the cultures were brought to the new temperature and allowed to continue growing until OD600 0.6–0.8. At 7°C and 42°C, the cultures were shaken at 60–80 rpm (Angelidis and Smith, 2003). In case of a temperature up- or downshift (temperature shock), the cells were grown at 30°C to an OD600 of 0.6–0.8, after which they were transferred to an icebox (4–7°C) or heat block (37–48°C). The cells were analyzed under the microscope within 30 to 50 min after the temperature shock. The temperature of the microscopy stage and the objective were the same as the temperature of the last step in the cultivation or temperature shift. We used a climate chamber at the microscope for temperatures higher than room temperature and a custom-made silicon-tubing system for cooling below room temperature.
Glass Slide Preparation for Cell Immobilization
Cell immobilization on a glass slide is essential for FRAP measurements. We used (3-aminopropyl)triethoxysilane (APTES) to treat the glass slides. Glass slides were first cleaned by sonication in 5 M KOH for 1 h and rinsed thoroughly with Milli-Q. The slides were dried using an air gun, and the surface was activated with oxygen plasma (65 W) for 1 min. Then, the slides were deposited in 1% APTES in acetone and incubated for 20 min at room temperature. The glass slides were cleaned thoroughly by Milli-Q water and finally dried by pressurized nitrogen. The treated glass slides have primary amine groups on the surface that allow the binding of cells. After placing the cells on the glass slide, a coverslip was placed on top, and the system was sealed for biosafety purposes (BSLII) using a coverslip Sealant (Biotium). The slides were transferred to the microscopy facility and measurements were done immediately on the stand-by microscope.
FRAP Acquisition and Data Analysis
We used a Zeiss LSM710 confocal laser-scanning microscope (Zeiss, Oberkochen, Germany) with a C-apochromat 40x water immersion objective with NA of 1.2 for the acquisition of FRAP data. The measurements are similar to those described by Elowitz et al. (1999) with modifications described previously (Mika et al., 2014; Schavemaker et al., 2017). In brief, both the photobleaching and imaging were conducted at 488 nm, a high-intensity laser pulse was used for photobleaching, and a low-intensity laser for imaging of the cells. The fluorescent emission was collected from 493 to 700 nm. An ideal field of view has several discrete cells expressing GFP (Figure 1A). We took high-resolution (512 × 512 pixels) zoom-ins of cells to assure that (i) they flatly adhered to the glass surface; (ii) the fluorescent signals are homogeneously distributed; and (iii) the cells are not dividing. A square box was drawn over half of a cell at one of the poles designated as the bleaching area. Next, the resolution was decreased to 16 × 16 pixels before starting the acquisition to enable fast scanning and monitor fast fluorescent recovery. For FRAP measurements, the images were recorded for 200 cycles (total time of about 1.6 seconds with time intervals of 8 ms).
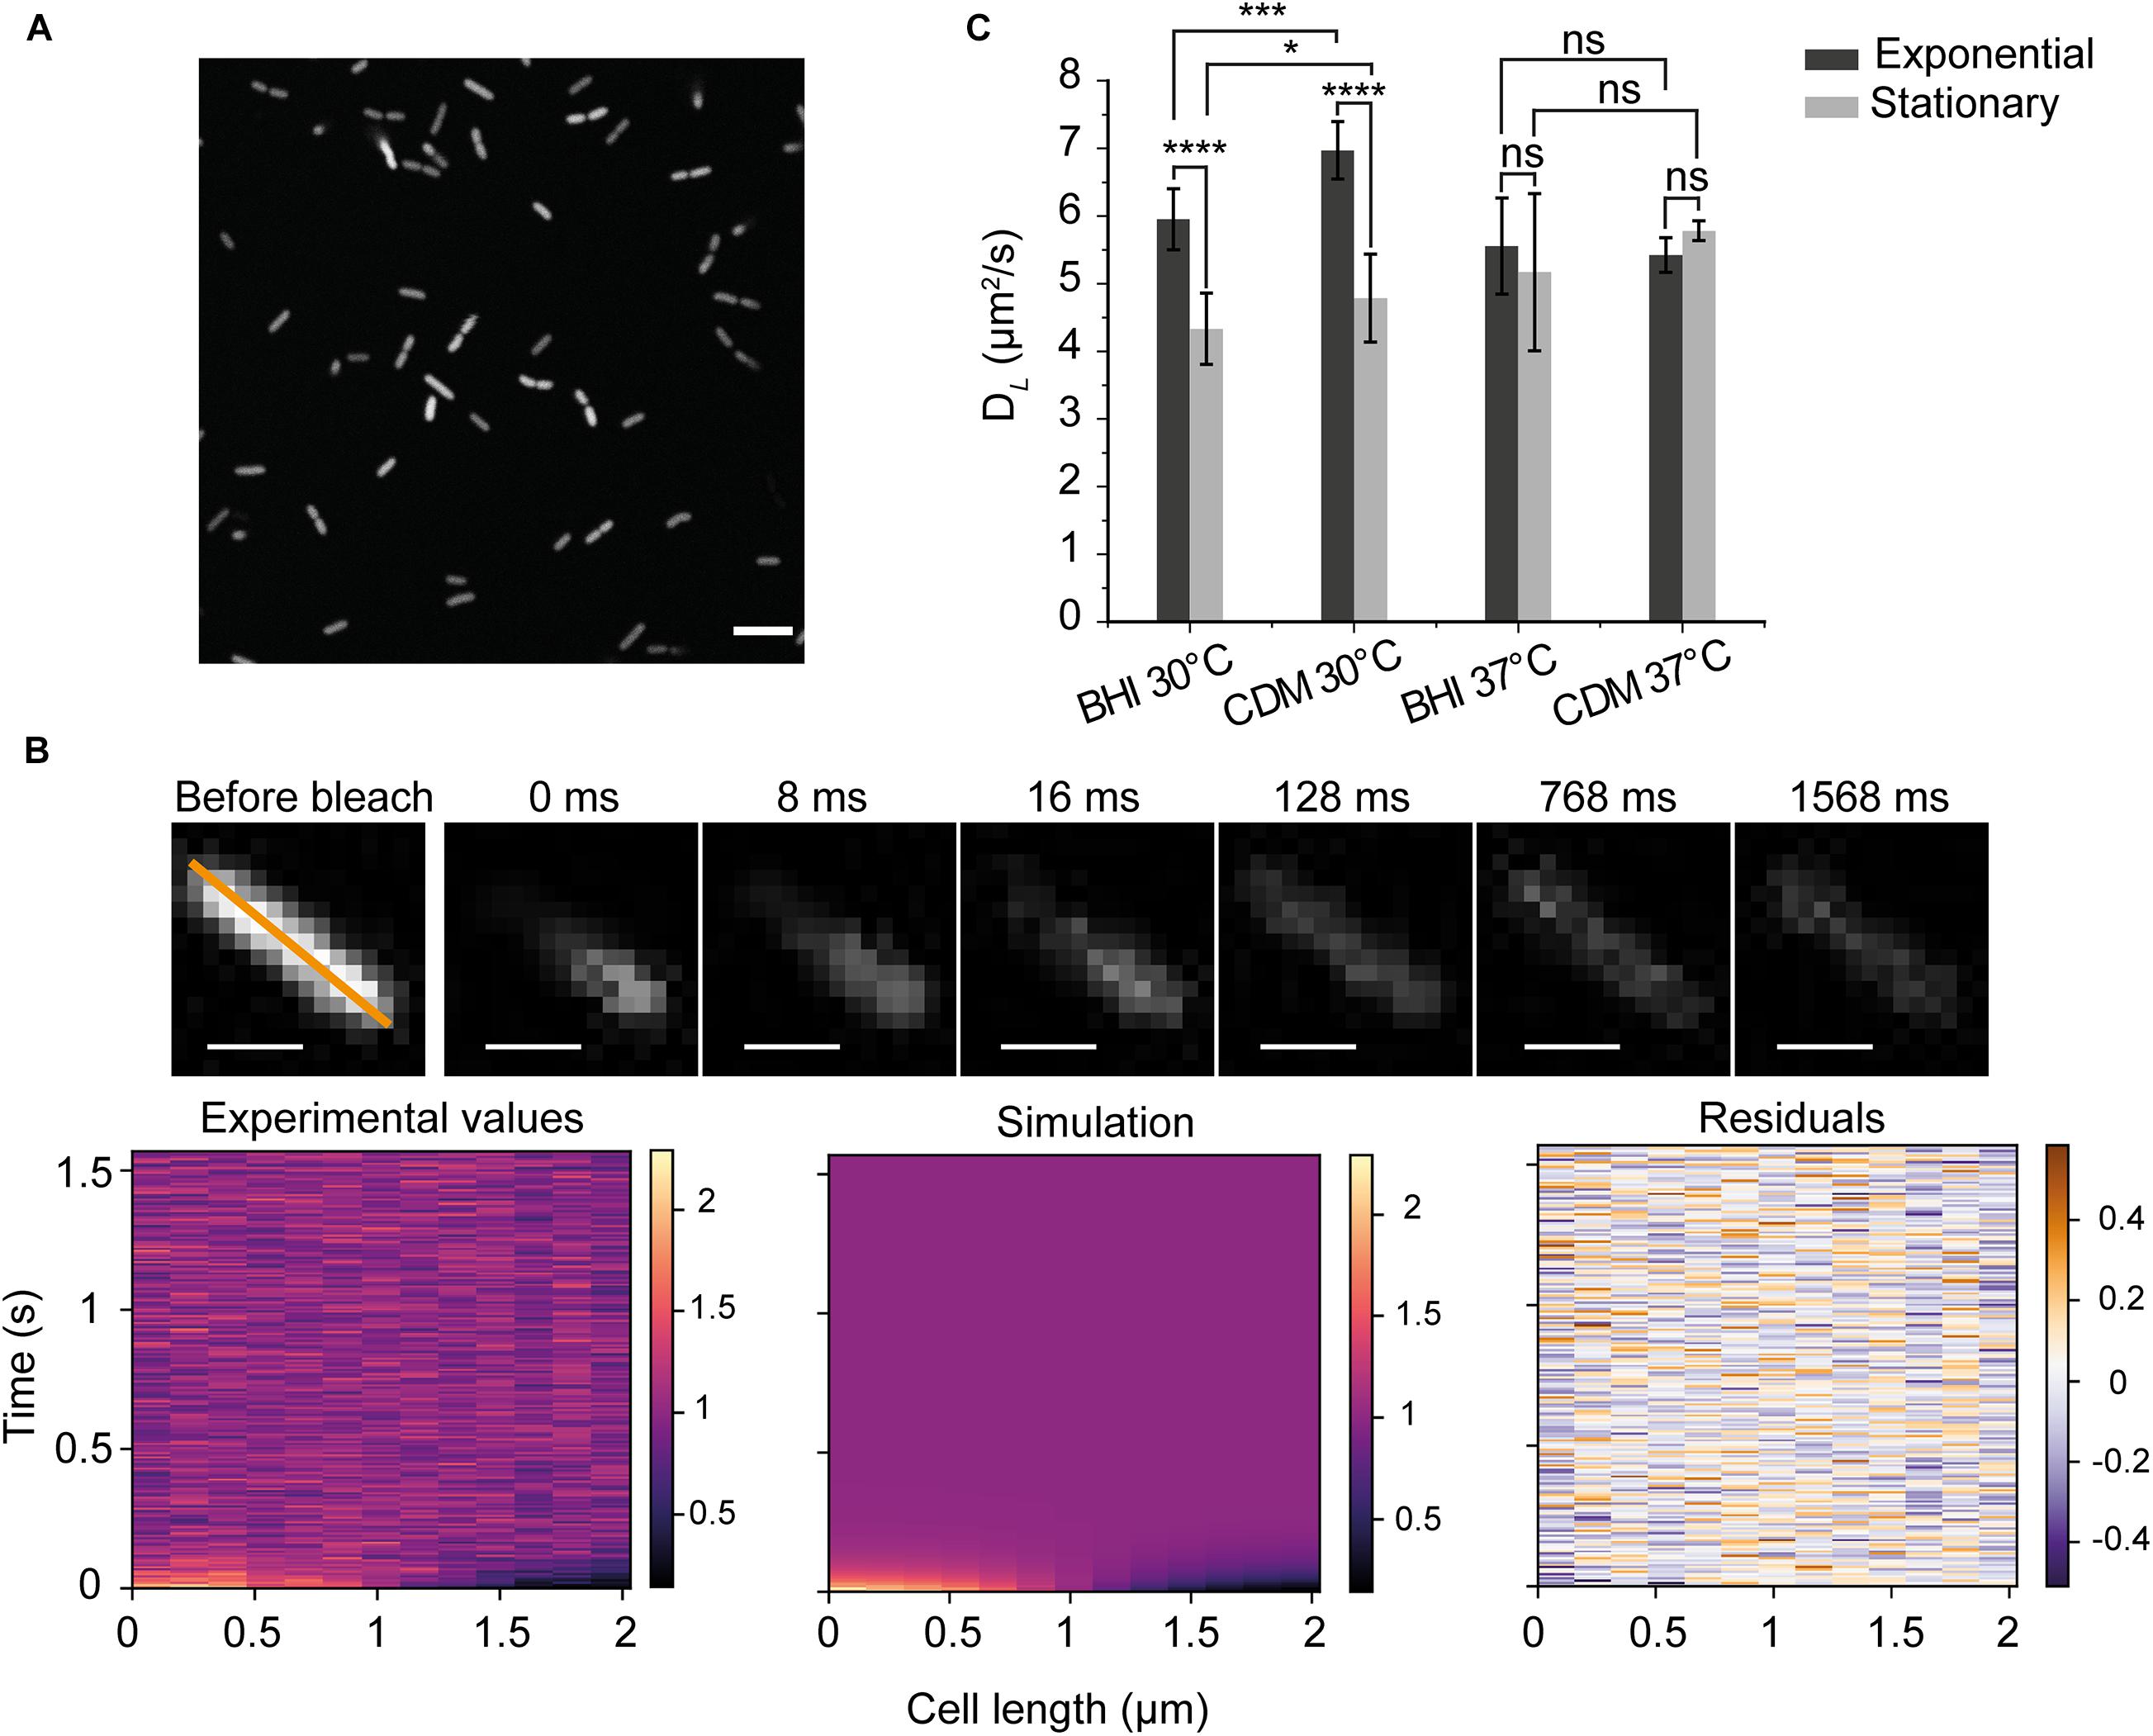
Figure 1. Principle of diffusion measurements in Listeria monocytogenes (A) An image of L. monocytogenes EGD-e/pNF8 expressing –8 GFP (scale bar 5 μm). (B) Data from FRAP acquisition. We show an example of the recovery of fluorescence for the diffusion constant of 6.8 ± 0.3 μm2/s. The orange line marks the analyzed region; each acquisition has 200 cycles, and the average intensity before bleaching (the first three cycles) was used for the normalization of the images. Time zero was recorded immediately after the photobleaching (scale bar 1 μm). Three graphs below indicate the fluorescent intensity along the orange line of the labeled cell in time, for the experimental data (left), the one-dimensional heat-equation simulation (middle), and the residuals (right). (C) DL of –8 GFP for cells grown in BHI and CDM and analyzed in the exponential and stationary phase. Standard deviation (SD) is based on the means of three replicate datasets. There were more than 30 cells analyzed in each replicate dataset and more than 100 cells for each conditions. One-way ANOVA test (p < 0.05) and Fisher LSD post hoc tests were applied for all measured cells. *significance at p < 0.05; ***at p < 0.001; ****at p < 0.0001 and ns, not significant.
The diffusion coefficients were calculated from the FRAP acquisition, as reported before (Mika et al., 2014). The home-written software was converted to Python language, executed by Fiji (ImageJ) and Python 3.7.1. The analysis was done in batch, with many cells done in parallel. Briefly, a line is automatically drawn along the long axis of the cell. The fluorescent profiles along the line are extracted for each frame. The fluorescence intensity before photobleaching was used to normalize the measured distributions (Figure 1B). To obtain the lateral diffusion coefficient (DL), a script was used to simulate the normalized fluorescence intensity distributions along the drawn line during the recovery process. The residuals displaying the differences between the actual data and simulated data are reported in Figure 1B. We employ the one-dimensional (1D) continuous diffusion equation for the simulation, which is given by:
With boundary condition:
Where I is the fluorescence intensity, and DL is the diffusion coefficient. The 1D diffusion simulation in Python is based on the heat diffusion equation of the Crank-Nicolson scheme (Crank and Nicolson, 1947).
Cell Size Measurements
We used the wide-field microscope Zeiss Axio Observer (Zeiss, Oberkochen, Germany) in phase contrast (Ph3) mode, using the Plan-Apochromat 100x, oil immersion with NA of 1.4 objective to capture images of the cells. Cell immobilization on glass slides was done as described above. The length and width of cells were extracted by using the plugin MicrobeJ from ImageJ (Ducret et al., 2016). The volume (V) of the cell is given by:
where w is the width, and l is the length of the cell. Here, one assumes that the geometry of L. monocytogenes is described by a hemispherical cylinder.
Computational Analysis of Proteome
The protein sequences from L. monocytogenes EGD-e (proteome ID: UP000000817) were retrieved from the UniProt server (Glaser et al., 2001). The pre-computed isoelectric point (pI) of each protein was calculated from the amino acid sequence, using the Isoelectric Point Calculator (IPC), was obtained from the Proteome Isoelectric Point Database (Kozlowski, 2016, 2017). We adapted the original IPC program to calculate the protein net charge based on the IPC_protein pKa dataset (Schavemaker et al., 2017). A pH value of 7.5 was chosen for the protein net charge calculation (Fang et al., 2004). We utilized the modified program to calculate the net charge of the GFP variants used in this work and to characterize the overall proteome of L. monocytogenes.
Histograms of the distribution of the isoelectric points (pI) and net charge of all proteins encoded by the whole genome and cytoplasmic subcellular localization of L. monocytogenes EGD-e were drawn. The cytoplasmic proteins are separated from the whole proteome based on a comprehensive secretomics-based subcellular localization database, which is available for L. monocytogenes EGD-e (Renier et al., 2012), together with the predictions from location prediction tools for bacterial proteins such as LocateP (Zhou et al., 2008) and SurfG+ (Barinov et al., 2009).
Results
Diffusion of GFP in the Cytoplasm of Listeria monocytogenes
We first measured the diffusion coefficient of GFP in the cytoplasm of L. monocytogenes EGD-e grown aerobically either in the complex brain heart infusion (BHI) or the chemically defined medium with glucose as the carbon source (CDM). The maximal growth rates (μMAX) of L. monocytogenes EGD-e at 30°C are 0.82 ± 0.04 and 0.33 ± 0.03 h–1 for BHI and CDM, respectively; while the ΔsigB strain grows faster with μMAX values of 0.91 ± 0.04 and 0.37 ± 0.04 h–1 for BHI and CDM, respectively. The net charge of GFP expressed from the pNF8 vector is −8 at pH 7.5. Figure 1A shows that GFP is homogeneously expressed with no indications of aggregation. A typical FRAP experiment and accompanying data analysis is illustrated in Figure 1B. In general, we found the diffusion coefficient of GFP in the cytoplasm of L. monocytogenes varied from approximately 4.5–7 μm2/s. Remarkably, we find statistically significant differences in the mobility at 30°C for cells in the exponential and stationary phase in both BHI and CDM (p < 0.0001) (Figure 1C). There are no significant differences in DL of GFP for cells grown at 37°C (Detailed statistics in Supplementary Table 1). Generally, the DL in cells grown in CDM are higher than those in BHI-grown cells at 30°C, which may relate to differences in the osmolality of BHI (0.44 Osm) and CDM (0.23 Osm).
Diffusion of Anionic Versus Cationic GFP
Next, we used a GFP variant with a net charge of +25 at pH 7.5 and determined its mobility in cells grown in BHI and CDM (Figures 2A,B). We find that DL of +25 GFP is one to two orders of magnitude slower than that of −8 GFP; we also find a broader distribution of diffusion coefficients for +25 GFP (Figure 2B), suggesting that +25 GFP is likely interacting transiently with macromolecules in the cytoplasm. Figure 2C benchmarks the (DL) −8 GFP and +25 GFP in L. monocytogenes against similar measurements in E. coli, L. lactis, and Hfx. volcanii (taken from Schavemaker et al. (2017); the median values are plotted, and the error bars show the interquartile ranges (IQR). We see that the (DL) −8 GFP is comparable in the four microorganisms, whereas the lateral diffusion coefficient of +25 GFP in L. monocytogenes, particularly for cells grown in BHI, is faster than in E. coli but slower than in Hfx. volcanii. We consistently observed faster diffusion of proteins in L. monocytogenes grown in CDM than in BHI (Figure 2C).
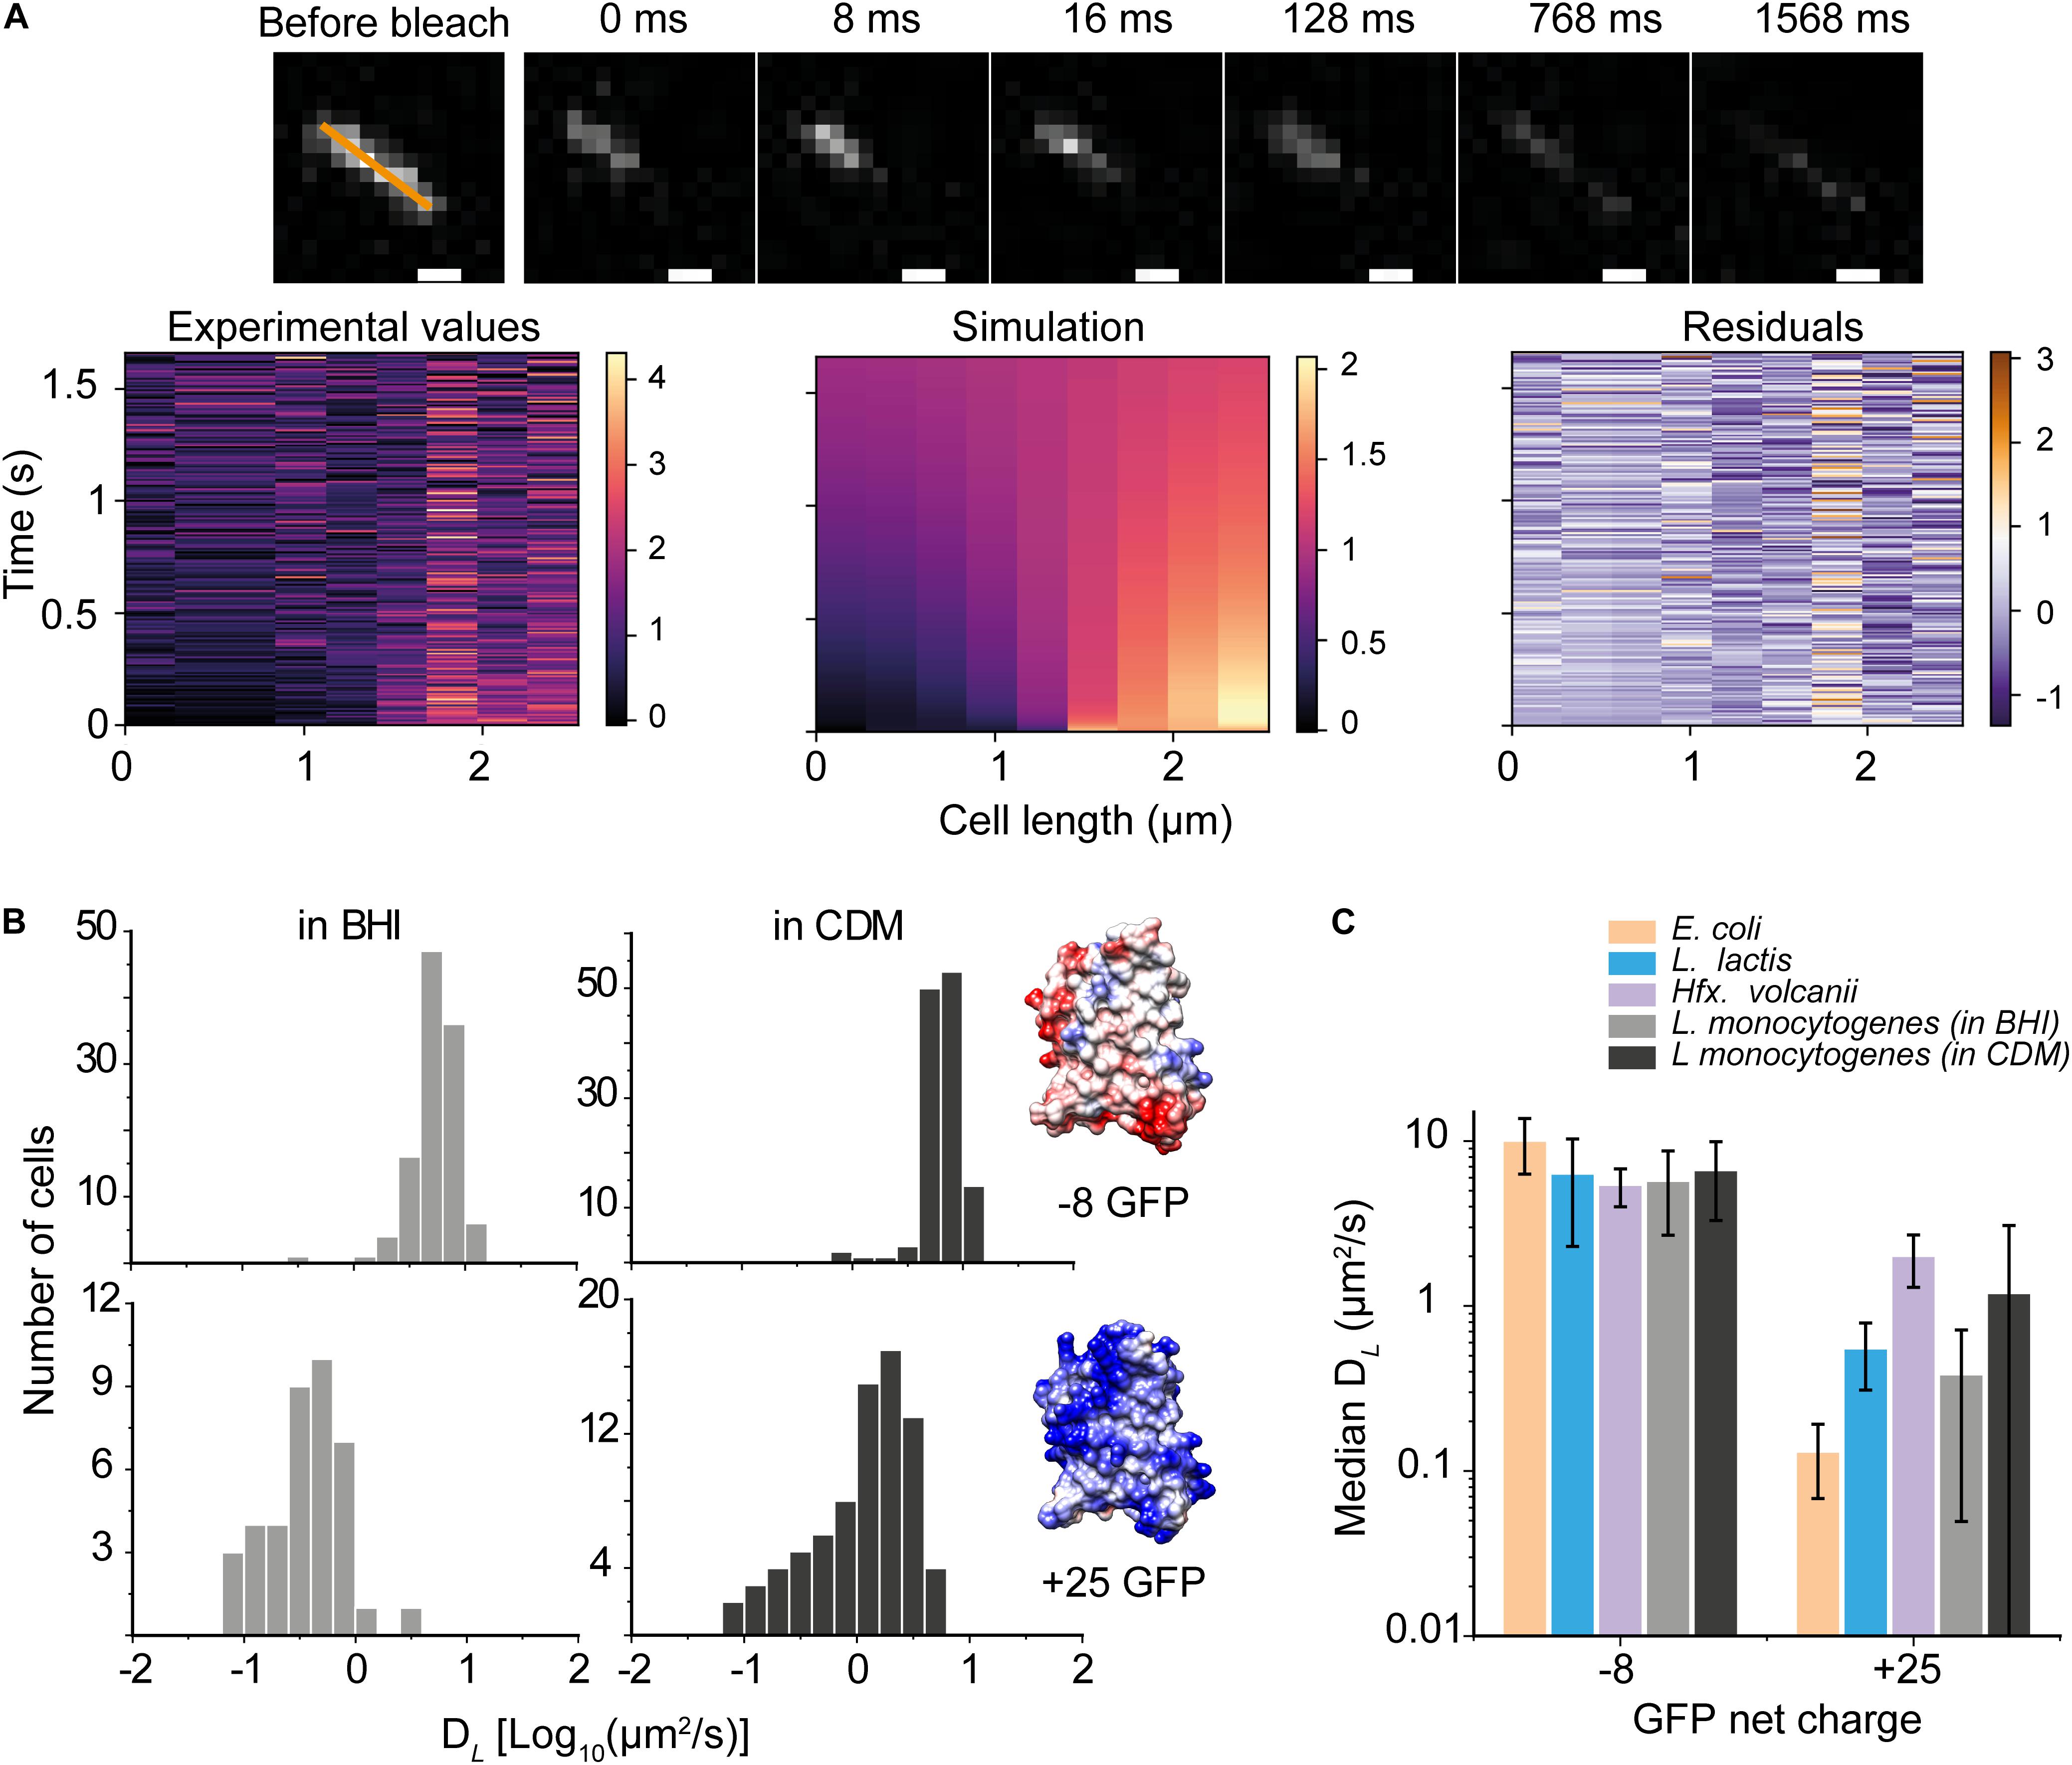
Figure 2. Diffusion of anionic and cationic GFP in Listeria monocytogenes. (A) (top) Recovery of +25 GFP fluorescence, corresponding to DL of 0.81 ± 0.042 μm2/s. (bottom) The fluorescent intensity along the orange line is shown as a function of time for the experimental data (left) and the one-dimensional heat-equation simulation (middle), and the residuals of the data (right). (B) Histograms of diffusion coefficients of –8 GFP (top) and +25 GFP (bottom) of cells grown in BHI and CDM as well as structural models the surface-modified GFP variants; the colors display the surface charge. The models are based on the structure of super-folder GFP (PDBID: 2B3P), and the images were created using UCSF Chimera (Pettersen et al., 2004). Poisson-Boltzmann electrostatics calculations and evaluations were done by PDB2PQR and APBS packages (Baker et al., 2001; Dolinsky et al., 2004). (C) The diffusion coefficient of –8 and +25 GFP in L. monocytogenes, and –7 and +25 GFP in E. coli, L. lactis, and Hfx. volcanii; the latter have been taken from Schavemaker et al. (2017). The bars indicate medians and the error bars show the interquartile range.
The consequences of slower diffusion of cationic GFP in the cytoplasm were evaluated in the light of the proteome composition of L. monocytogenes EGD-e, similar to that described previously for other microorganisms (Schavemaker et al., 2017). We computed the pI and net charge values of all proteins from L. monocytogenes EGD-e at pH 7.5 (Figure 3). There are 2,844 genome-encoded proteins, of which 1,941 (∼68%) are cytoplasmic as predicted by secretomics (Renier et al., 2012). We see that most proteins have pI values between 4 and 7 and thus a net negative charge at typical internal pH values of L. monocytogenes (Fang et al., 2004). There are 2,111 negatively-charged proteins (74%) and 733 positively-charged proteins (26%) in the whole genome. In the cytoplasm, the percentage of negatively-charged is 86%. Of the 270 positively charged cytoplasmic proteins, there are 50 with a charge larger than +10 and potentially having a surface that would allow them to bind to anionic surfaces. Indeed, 27 out of 50 are predicted to be ribosomal proteins, nine are DNA-binding, six are RNA-binding, three are known enzymes, and five are uncharacterized proteins. Thus, the vast majority of highly positively charged proteins are part of nucleoprotein assemblies, and their cationic surfaces are required for complex formation and may not cause unwanted interactions with other macromolecules. The anionic cytoplasmic proteome of L. monocytogenes warrants relatively fast diffusion in the crowded environment of the cell. More details of the proteome analysis can be found in the Supplementary Information.
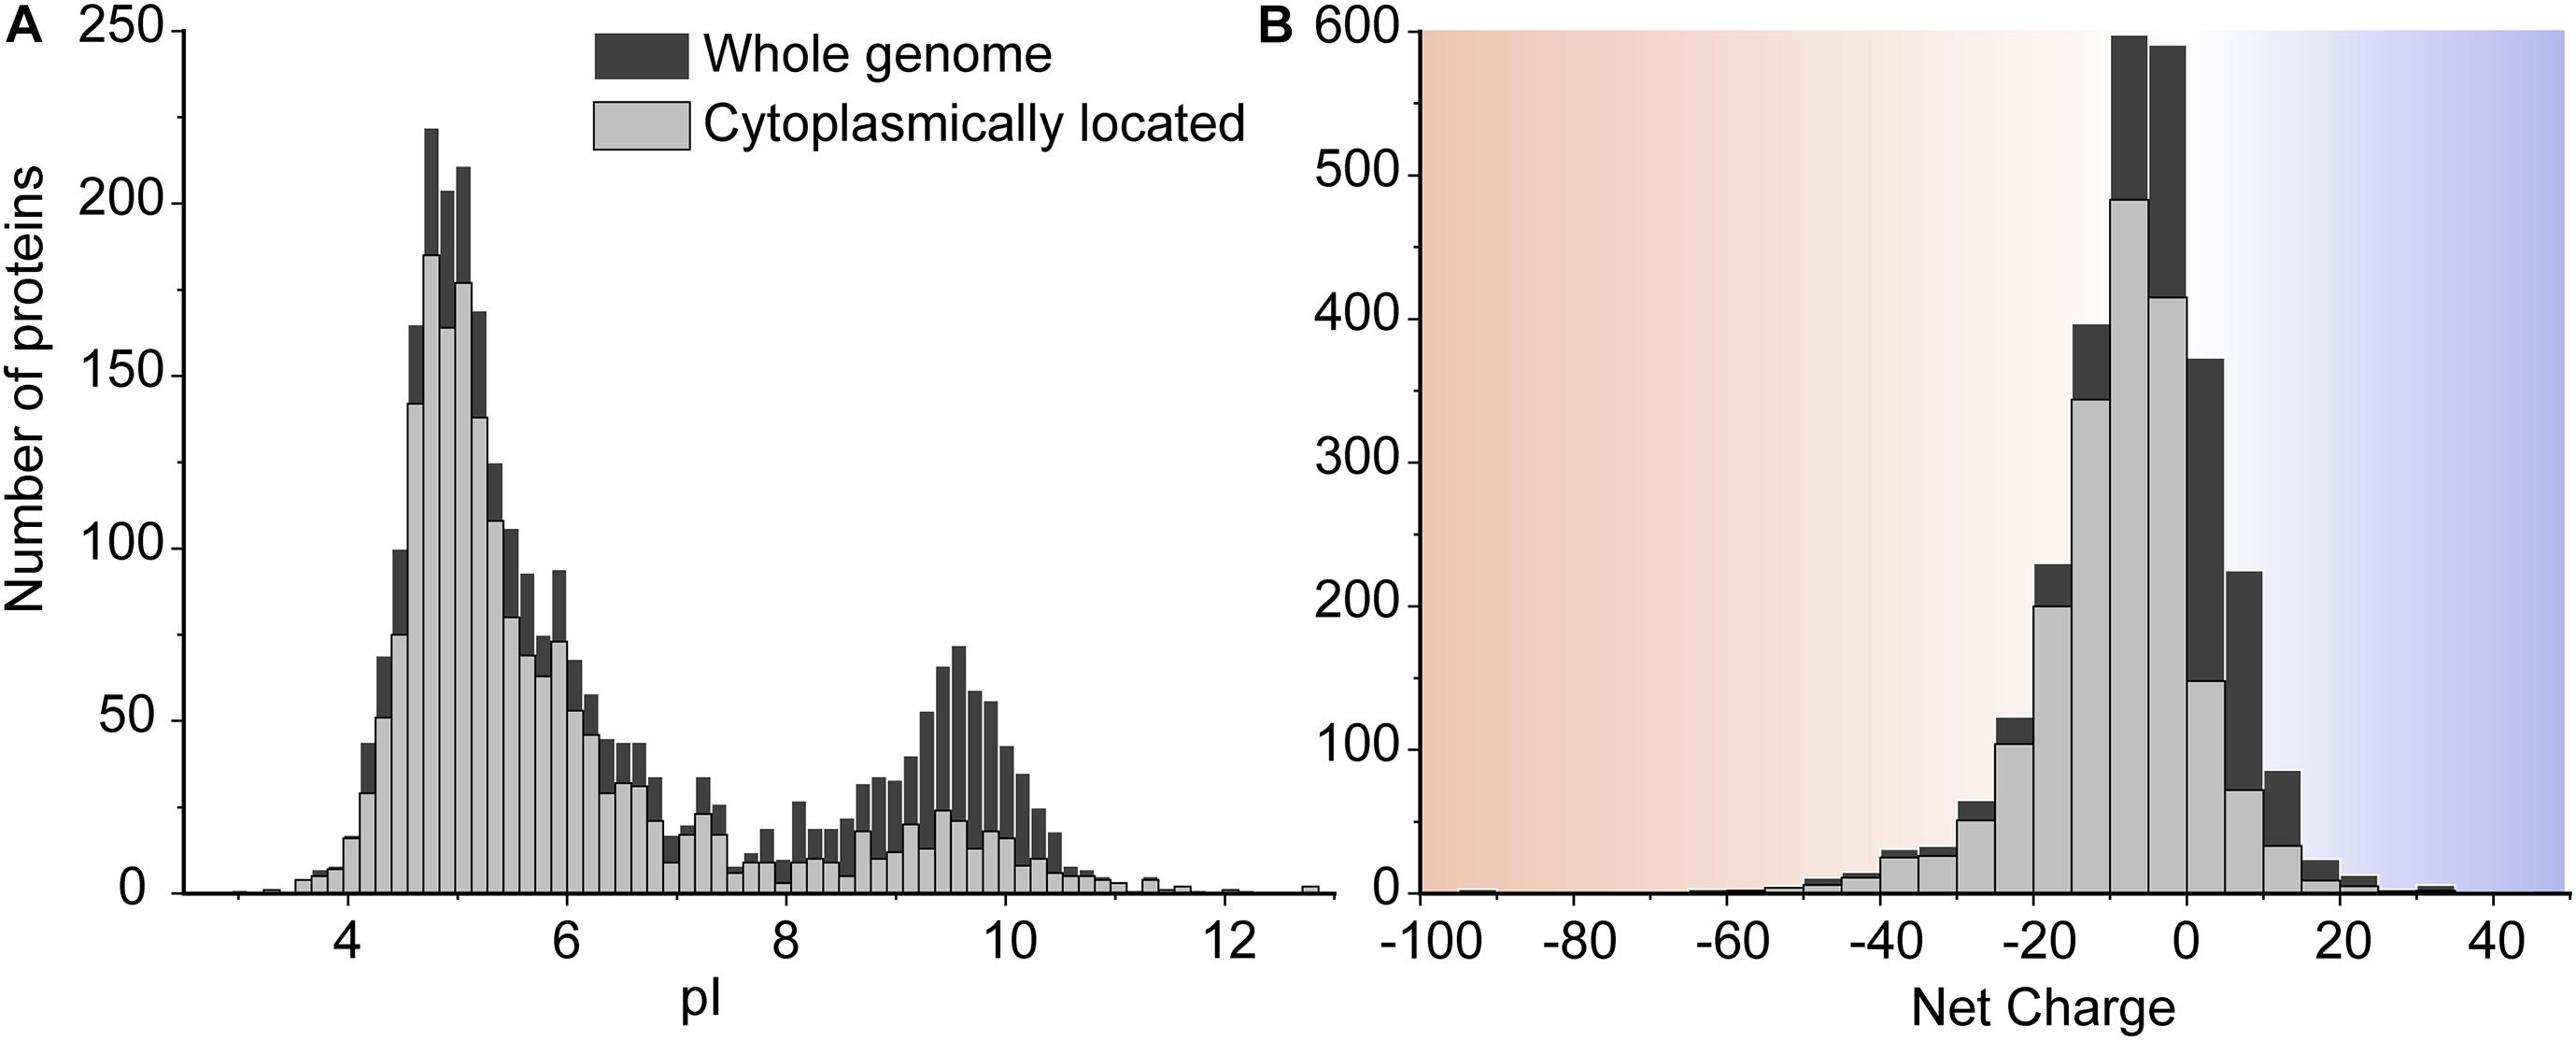
Figure 3. The pI (A) and net charge (B) distributions for proteins of L. monocytogenes EGD-e. The histograms show the number of genes that encode proteins for the whole genome scale and the proteins located in the cytoplasm. We used a pH of 7.5 to calculate the net charge. The cytoplasmic proteins are extracted from the whole proteome based on the secretomics-based subcellular localization database (Renier et al., 2012). To reveal more details in the histogram of the net charge, we removed four super-charged proteins which are outliers in the protein net charge distribution. These are three super-negatively charged cell-wall proteins including a putative peptidoglycan bound protein (with UniProt entry Q8Y697, Z = –241), a peptidoglycan anchored protein (Q8Y479, Z = –140), and Internalin I protein (Q8YA32, Z = –112); and one super-positively charged protein predicted to be on the cell membrane, a putative tape-measure protein of bacteriophage A118 (Q8Y4Z2, Z = 82).
Effect of Osmotic Stress on Protein Diffusion, Cell Volume, and Turgor Pressure
We determined the effect of hypertonic conditions on the diffusion of −8 GFP in osmotically-adapted and shocked cells. We grew cells in CDM medium and use CDM supplied with NaCl for osmotic upshifts. Remarkably, we find no difference in diffusion between adapted and shocked cells contrary to what is seen in L. lactis and E. coli (Figures 4A–C), suggesting that L. monocytogenes is rather insusceptible to osmotic upshift ranges used in this study. Data for L. lactis and E. coli are taken from Konopka et al., 2009 and Mika et al., 2014, and cells were grown in chemically defined media with initial medium osmolalities of 0.23, 0.53, and 0.28 Osm for L. monocytogenes, L. lactis, and E. coli, respectively. Taken together, in osmotic upshift measurements, DL values for GFP in the cytoplasm remain comparable suggesting a unique tolerance to osmotic stress of L. monocytogenes EGD-e. The data for the ΔsigB strain are similar to wild-type L. monocytogenes, except at the highest osmolalities where the ΔsigB strain seems even less affected in protein mobility. This suggests a difference in the intracellular environment between two strains due to the control of SigB to its regulon when subjected to significantly high salt media. We show the distributions of DL values for GFP in the cytoplasm of L. monocytogenes EGD-e and ΔsigB cells grown in chemically defined media (CDM) at different osmolality in the histograms in Supplementary Figure 1, 2.
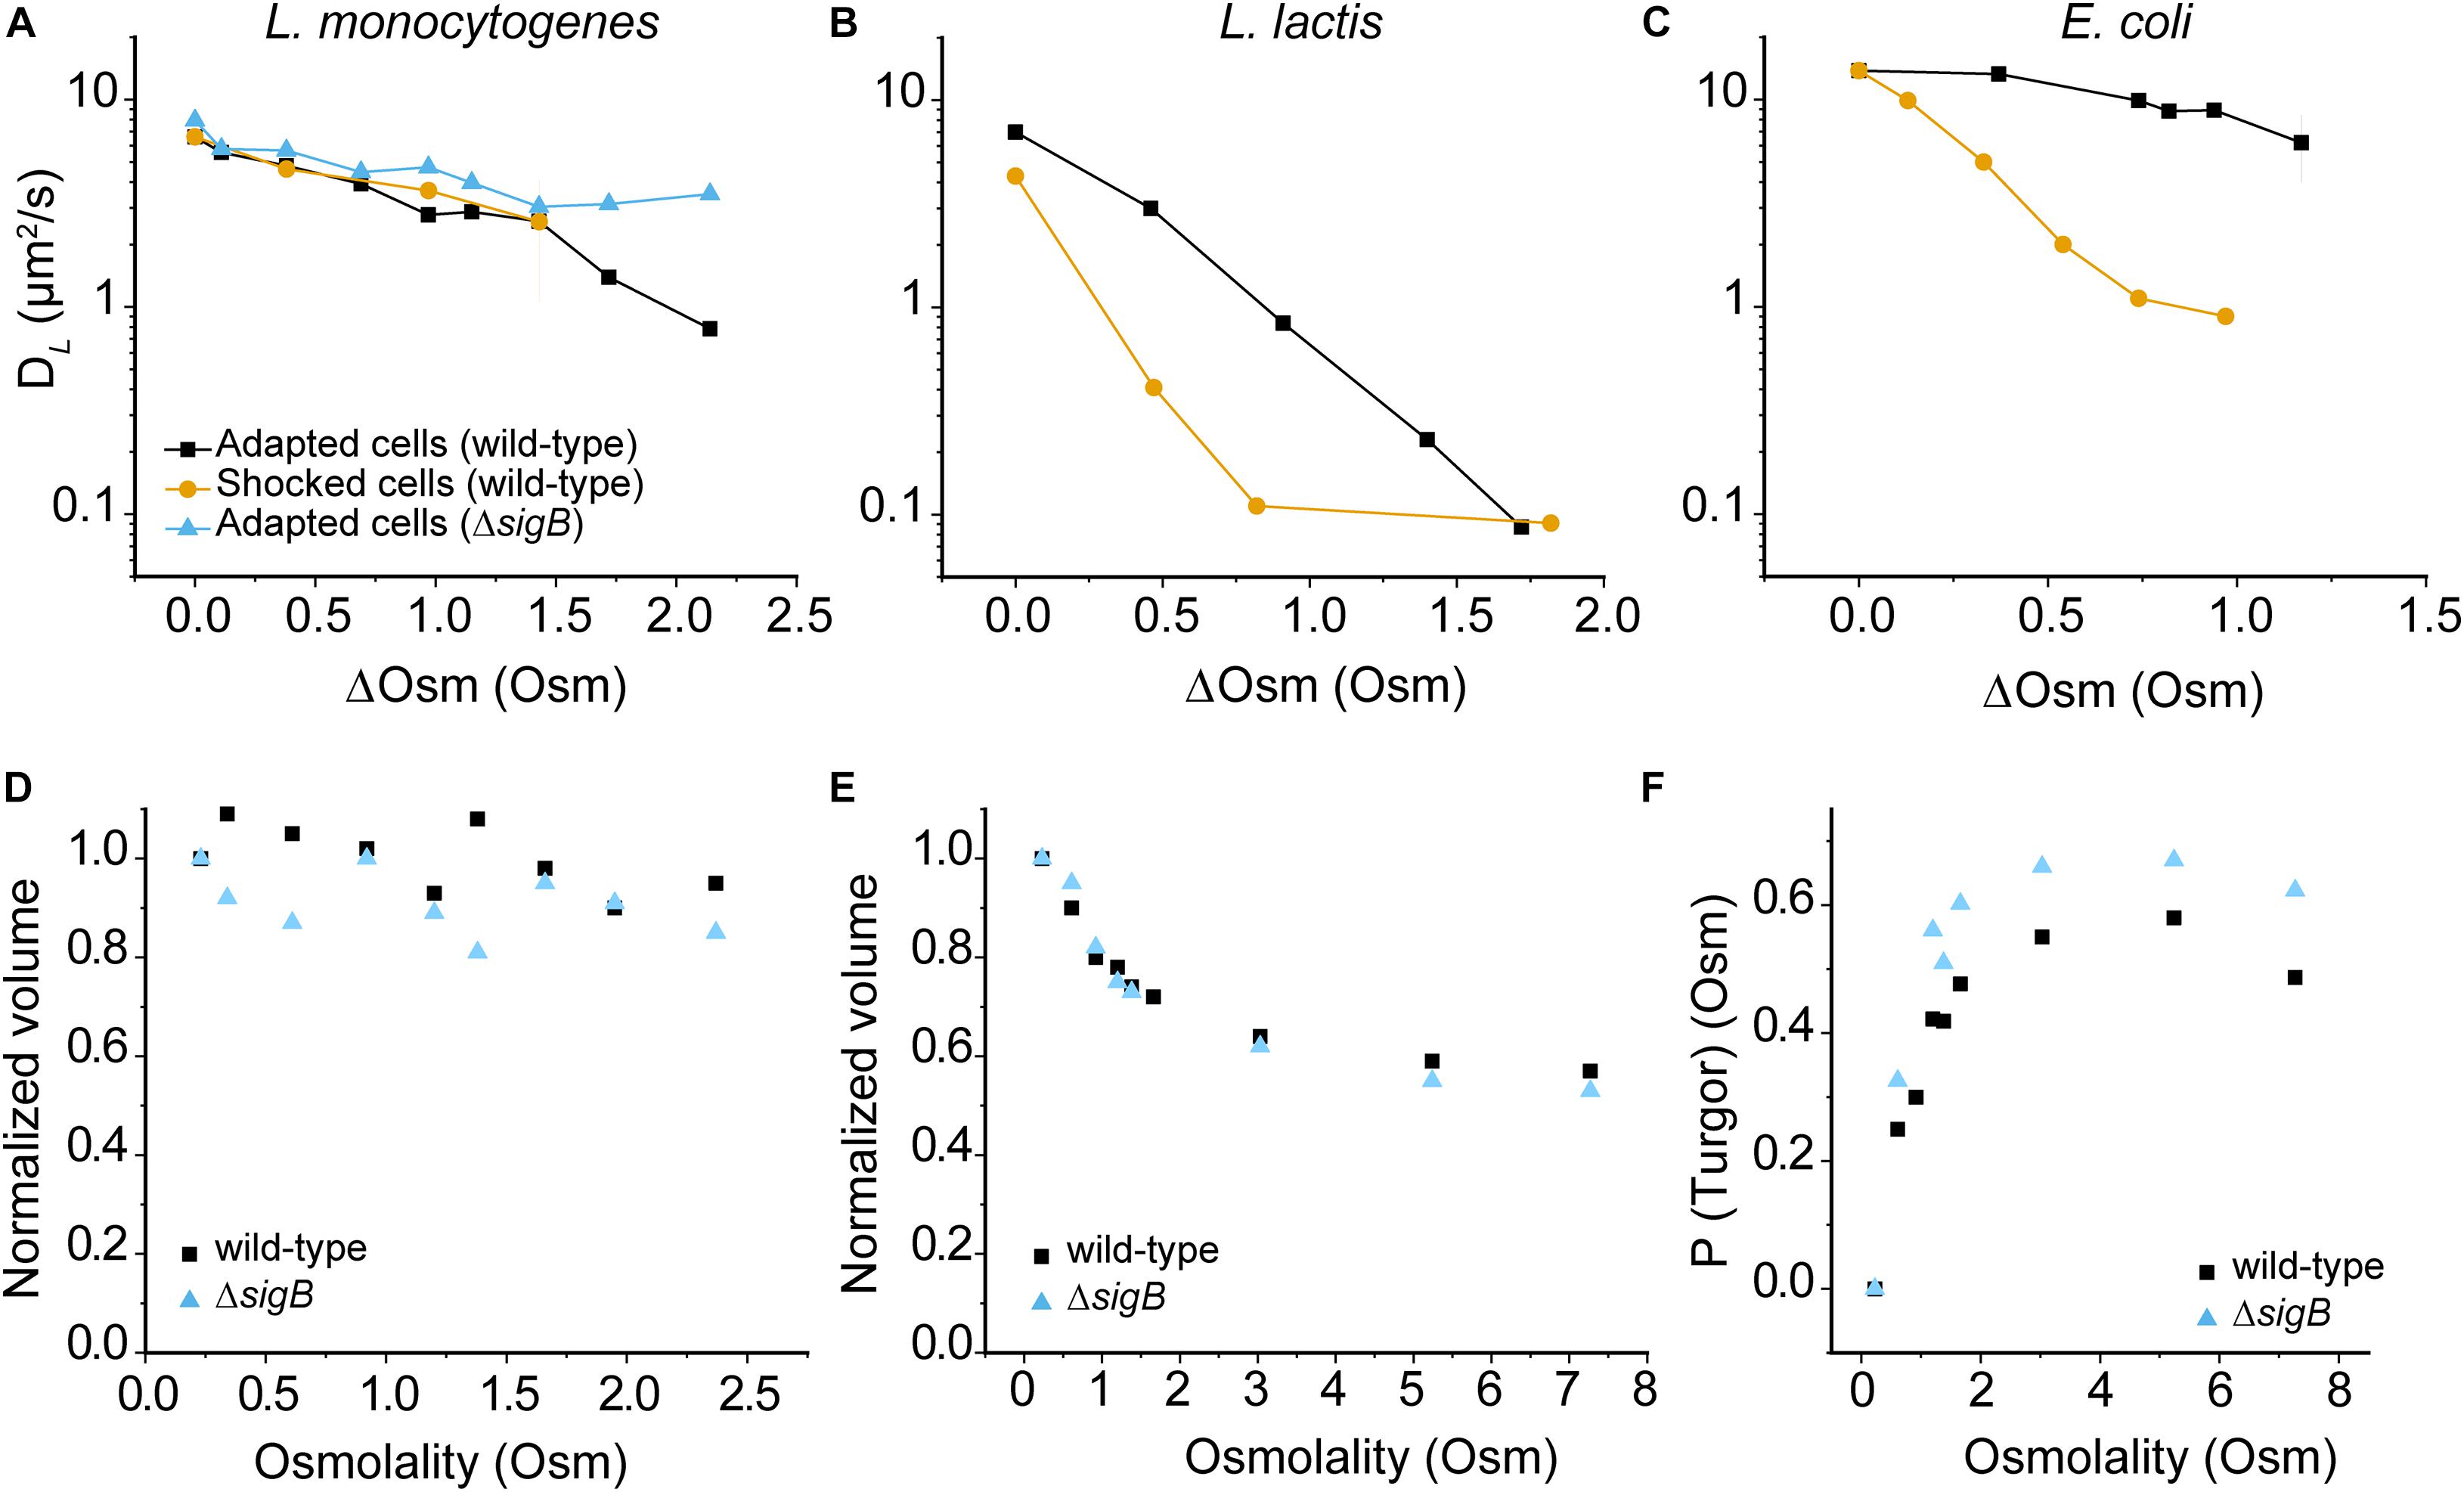
Figure 4. Effect of hypertonicity on the diffusion of GFP, cell volume and turgor pressure. (A) DL of GFP in osmotically-adapted and shocked cells of L. monocytogenes EGE-e and EGD-e ΔsigB. Panels (B) and (C) show similar data for L. lactis and E. coli, taken from Konopka et al., 2009 and Mika et al., 2014. Median values of DL are used for L. monocytogenes and L. lactis; and mean values for E. coli. Details of interquartile ranges and standard deviations are presented in the Supplementary Table 2. In all cases cells were grown in chemically defined media with initial medium osmolalities of 0.23, 0.53, and 0.28 Osm for L. monocytogenes, L. lactis, and E. coli, respectively; ΔOsm reflects the addition of NaCl to these media. (D) and (E) panels show the normalized volume of L. monocytogenes EGD-e and EGD-e ΔsigB of osmotically-adapted (D) and shocked cells (E); a minimum of 100 (up to 800) cells were analyzed for each condition. A value of 1 corresponds to a volume of 0.61 μm3 and 0.76 μm3 for L. monocytogenes EGD-e wild-type and ΔsigB cells, respectively. (F) Turgor pressure plots of L. monocytogenes EGD-e wild-type and ΔsigB.
We wondered why an osmotic upshift affects −8 GFP diffusion in L. monocytogenes much less than in L. lactis or E. coli (−7 GFP). Figure 4D shows that the volume of adapted L. monocytogenes cells drops at most 10%, and the instantaneous drop in volume upon osmotic upshift Figure 4E is also much less than in L. lactis or E. coli. Also, we did not observe any cellular invaginations typical of plasmolyzing E. coli cells (Koch, 1998; Konopka et al., 2006; Lewenza et al., 2006; Rojas et al., 2014). We noted that the volume of L. monocytogenes EGD-e ΔsigB (0.76 ± 0.26 μm3; N = 370) is significantly larger than that of wild-type cells (0.61 ± 0.21 μm3; N = 325) grown in CDM. We illustrate the changes in cell morphology that accompany the changes in cell volume upon osmotic upshift and subsequent adaptation phase in Supplementary Figure 4A; representative phase-contrast microscopy images are shown in Supplementary Figure 4B. We note that while a width remains constant following osmotic upshift, a significant decrease in length occurs and this affects the cell volume.
Next, we determined the turgor pressure (Pturgor) of L. monocytogenes by applying the osmotic upshift method as described by Whatmore and Reed, 1990. The internal osmolality calculation uses the relationship: Pturgor=πint−πext, where πint is the internal osmolality and πext is the external osmolality. Above a threshold level of the external osmolality, Pturgor=0, and πint=πext, and the cell should act as an ideal osmometer in accordance with the Boyle-van’t Hoff relationship (πV=constant). Thus, by calculating πint at Pturgor=0, this value can be used to determine πintat Pturgor > 0. The Boyle-van’t Hoff plot, i.e., cell volume versus reciprocal of the medium osmolality yields the non-osmotic volume (VNO), which is the intercept of the ordinate from the Boyle-van’t Hoff plot (Supplementary Figure 5). The VNO values are 0.32 and 0.35 μm3 for the wild-type and ΔsigB cells, respectively. We can now calculate the osmotic volume (VO) at any π where Pturgor=0 as VO = Vtotal – VNO. By applying the Boyle-van’t Hoff relationship, we get VOx⋅πx = VOm⋅πm, where VOx and πx are the osmotic volume and internal osmolality at any point where Pturgor=0; and VOm and πm are the osmotic volume and internal osmolality in the original medium (Whatmore and Reed, 1990). In Figure 4F, the turgor pressure at the plateau is the turgor pressure of the cells under growth conditions in the original medium (CDM). We estimate the turgor pressure of L. monocytogenes EGD-e and ΔsigB at 0.58 and 0.67 Osm (or ∼14.4 and ∼16.6 atm), respectively, which is in the range of that of L. lactis and B. subtilis (∼0.75 Osm) (Whatmore and Reed, 1990; Mika et al., 2014). Our results are in good agreement with previous measurements of the internal osmolality of L. monocytogenes (Patchett et al., 1992).
Effect of Temperature on Protein Diffusion
Listeria monocytogenes is a foodborne pathogen capable of growing at temperatures as low as −0.4°C, whereas the maximal growth temperature is 45°C. Thus, we determined the mobility of −8 GFP of cells grown in complex BHI broth and CDM in temperatures ranging from 7 to 42°C.
Lateral diffusion of globular proteins in an aqueous solution can be approximated by the Stokes-Einstein equation:
where DL is the diffusion coefficient, kB is Boltzmann’s constant, T is the temperature (K), μ is the solvent viscosity, and R0 is the radius of the protein. We used the Stokes-Einstein equation to estimate the diffusion coefficient of −8 GFP in aqueous media as a function of temperature and DL (−8 GFP) in the cytoplasm at 30°C as the benchmark (Figure 5A). Furthermore, we used the Stokes-Einstein equation and DL(−8 GFP) at 30°C to get a gross estimate of the viscosity of the L. monocytogenes cytoplasm (Figure 5B), assuming constant viscosity of the cytoplasm and constant interactions between the moving particle (GFP) and solvent. None of these assumptions is correct, but the analysis allows a first comparison of the experimental data with the Stokes-Einstein model. We take the calculated viscosity of 11.3 mPa.s at 30°C as an approximation of the crowding in the cytoplasm. We then estimated the temperature dependence of the cytoplasmic viscosity and calculated DL(−8 GFP). As seen in Figure 5B, the diffusion coefficient increases moderately with temperature; DL(−8 GFP) increases from 6.1 to 7.5 μm2/s when the temperature increases from 7 to 48°C. Remarkably, our measurements of DL(−8 GFP) in temperature-adapted cells grown in BHI or CDM increases with the temperature reaching a maximum at around 30°C (Figure 5C). In CDM, the dataset is limited to 37°C because the cells didn’t grow at higher temperatures. The drop in mobility at higher temperatures is not seen when cells are grown at 30°C (DL = 6.61 ± 3.30 μm2/s) and the diffusion is analyzed at 42°C (DL = 8.34 ± 4.42 μm2/s) or 48°C (DL = 8.70 ± 6.53 μm2/s) (Median ± IQR, Figure 5C, triangle symbols).
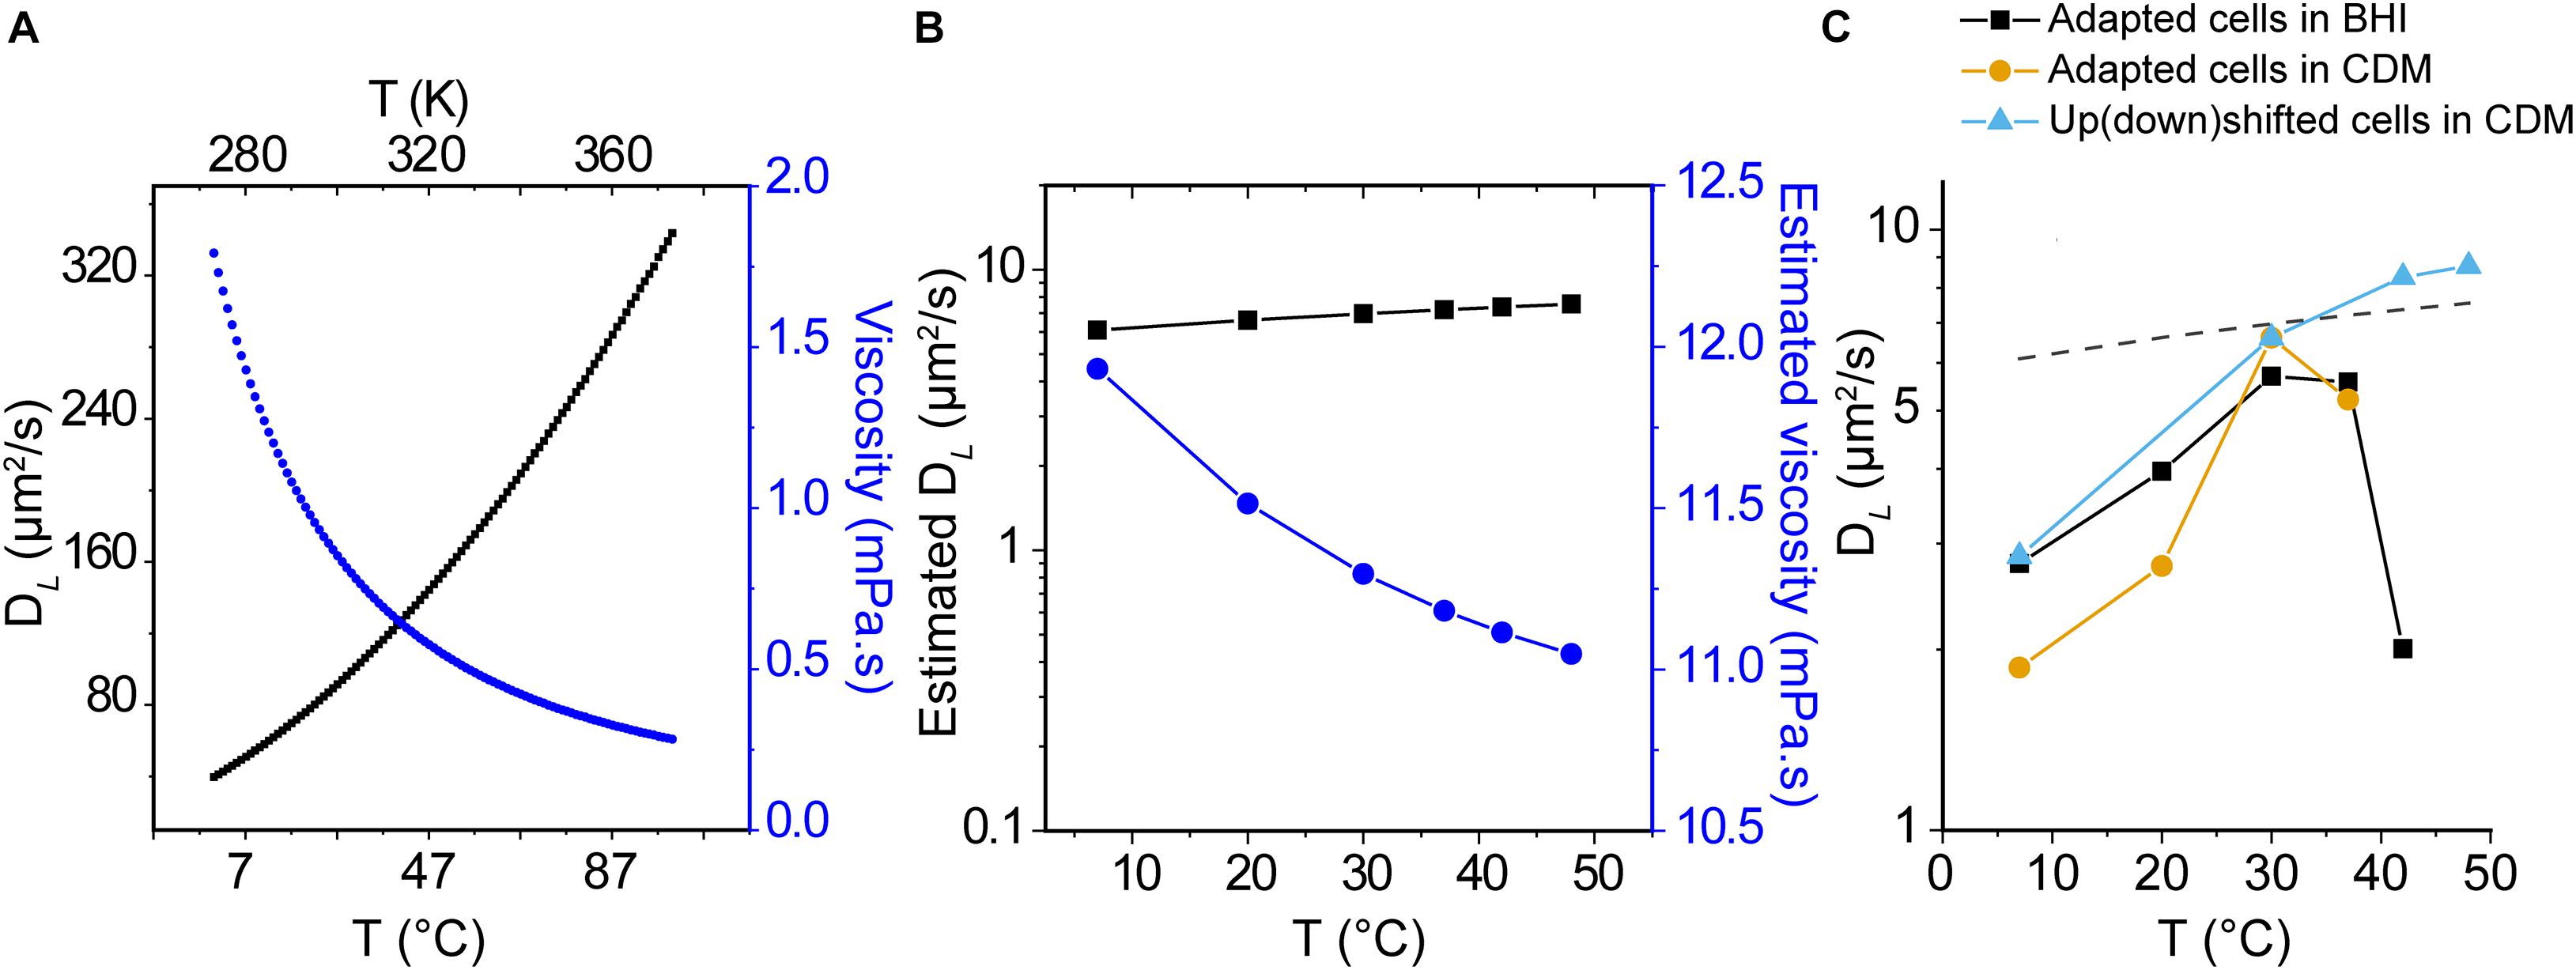
Figure 5. Temperature dependence of protein diffusion in L. monocytogenes. (A) Lateral diffusion coefficient of monomeric GFP with a Stokes radius RS = 2.82 nm (Liarzi and Epel, 2005) in water at different temperatures (black line), as calculated using the Stokes-Einstein equation. The viscosity of water (μ) as a function of temperature (T) is shown as blue points. (B) Estimated viscosity of the cytoplasm and DL(GFP) as a function of temperature, using the experimental DL(GFP) at 30°C as starting value and assuming constant viscosity of the cytoplasm and constant interactions between the moving particle (GFP) and solvent, and assuming that the viscosity of water and cytoplasm have the same temperature dependence. (C) Median values for DL(GFP) for cells grown and analyzed at the indicated temperatures; cells were grown in BHI (black squares) and CDM (yellow circles). In another set of experiments the cells were grown in CDM at 30°C and diffusion of GFP was determined at the indicated temperature (turquoise triangles). The dashed line illustrates the estimated DL(GFP) of panel (B). Details of interquartile ranges and statistical tests are presented in the Supplementary Table 3.
Histograms of DL in the cytoplasm of L. monocytogenes EGD-e grown at different conditions and analyzed at different temperatures are presented in Supplementary Figure 6. Supplementary Figure 7 shows DL as a function of the acquisition time of three replicated datasets, which shows that the values are not affected over a measuring period of at least 1 h. In summary, the trend in protein mobility in the cytoplasm of L. monocytogenes does not follow the temperature dependence given by the Stokes-Einstein relationship. The structure or apparent viscosity of the cytoplasm appears to change above 30–40°C, an effect that is seen in adapted cells but not in cells exposed to a temperature upshift.
Finally, in this paper, we report the mean and median values of DL, which allows direct comparison with many other studies. The variation in the DL values reflects the heterogeneity of cells within isogenic cultures, which increases when cells are stressed (Elowitz et al., 1999; Aertsen and Michiels, 2005; Lidstrom and Konopka, 2010). Elowitz et al. (1999) have estimated the cell-to-cell variation of DL and find a 32% deviation from the mean in isogenic cultures. We come to a similar conclusion and find that differences between means and medians are mostly less than 0.5 μm2/s, or differ about 10% from each other (on the basis of about 3,700 measurements), that is in cells grown under non-stressed or low-level stress conditions.
Discussion
In this paper, we probe the lateral diffusion of GFP in the cytoplasm of the Gram-positive pathogenic bacterium L. monocytogenes, and we benchmark our observations against E. coli and L. lactis. We choose L. monocytogenes because it is remarkably resistant to extreme stresses such as hypertonicity and capable of growth at temperatures well below 10°C, where organisms like E. coli and L. lactis do not grow. Besides, L. monocytogenes also survives the harshness of the host digestive tract and stresses imposed during the invasion, the translocation of the intestinal epithelial layer, and infection of other target organs in the human host. We analyzed the diffusion of −8 GFP in wild-type L. monocytogenes EGD-e and the stress-sensitive Sigma B (SigB or σB) null strain (ΔsigB). We grew and analyzed L. monocytogenes in complex BHI broth and chemical defined media (CDM), conditions typically used for physiological studies on L. monocytogenes.
We have analyzed the proteome of L. monocytogenes and find that the vast majority of cytoplasmic proteins are anionic and probably less hindered in their diffusion by electrostatic interactions than cationic proteins. We have previously shown for E. coli, L. lactis, and Hfx. volcanii that cationic proteins bind to ribosomes, which lowers the apparent diffusion coefficient by one to two orders of magnitude, depending on the ambient ionic strength of the cytoplasm (Schavemaker et al., 2017). We now observe that the diffusion +25 GFP is similarly reduced in L. monocytogenes, which we ascribe to binding of the protein to anionic surfaces as present on ribosomes. In L. monocytogenes 50 proteins have a net surface charge of +10 or higher, and more than 50% (26) of these are ribosomal proteins, which is even higher than in E. coli (18). The slowing of cationic GFP is less than in E. coli but more than in Hfx. volcanii, which most likely reflects the intermediate ionic strength.
When cells are exposed to high salt conditions, water will leave the cell, decreasing the volume. Cells then preferentially accumulate compatible solutes to increase the internal water concentration and thereby recover their volume (Ko et al., 1994; Amezaga et al., 1995; Verheul et al., 1997; Wood, 1999). When exposed to severe osmotic stress (>0.57 Osm), E. coli cells plasmolyze, which is observed as a lateral invagination of the cytoplasmic space (Konopka et al., 2006, 2009). These plasmolysis spaces are not seen in L. monocytogenes, but rather a decrease in cell size (mainly cell length) is observed. Further, the volume of L. monocytogenes decreases with increasing medium osmolality and remains devoid of plasmolysis spaces, even at 3.6 M of NaCl. Our observations indicate that L. monocytogenes can cope with severe hyperosmotic stress in CDM, even in the absence of added compatible solutes, conceivably due to its capacity to enlarge the intracellular pool of amino acids, as previously described by Amezaga et al. (1995).
The ΔsigB strain has a larger cytoplasmic volume and higher turgor pressure than the parental strain. This is a novel phenotype for the ΔsigB strain, but growth advantages under mild osmotic stress (0.5 M NaCl) (Abram et al., 2008), low-intensity blue light (O’Donoghue et al., 2016) and other mild stress conditions (Guerreiro et al., 2020) have previously been reported for ΔsigB. The SigB protein controls a large number of genes (>200) by binding to its promoters or neighboring regions (Gaballa et al., 2019). For example, in the stationary phase, SigB down-regulates genes involved in cell division (fts genes, division inhibitor minD), cell cycle control (smc), and cell wall biogenesis (mreD, iap, and spl) (Hain et al., 2008). The effects on cell division and cell cycle control may form the basis for the larger volume and higher turgor pressure of the ΔsigB strain.
The viscosity of aqueous solutions is well defined and can be experimentally determined (Viswanath et al., 2007), but the meaning of viscosity in the context of the crowded cytoplasm is less clear. Small molecules (osmolytes, compatible solutes) contribute to the micro-viscosity, but the diffusion of macromolecules will also be hindered by other macromolecules with which they may collide or transiently interact. Furthermore, the cytoplasm is not homogenous as certain macromolecules are excluded from the nucleoid (van den Bogaart et al., 2007). Following an osmotic upshift, the cytoplasm may even be compartmentalized. One can increase the macromolecular crowding, hence the “macro-viscosity,” by subjecting the cell to an osmotic upshift. We observe that protein mobility in L. monocytogenes is much less affected by an osmotic upshift than protein mobility in E. coli or L. lactis. This difference can be rationalized for E. coli, which has a much lower turgor pressure and already at a medium osmolality of 0.57 Osm, the cell plasmolyzes, and relative little solvent is left for diffusion (van den Bogaart et al., 2007). However, the turgor pressure of L. monocytogenes and L. lactis are similar and will decrease similarly when the external osmolality is increased. Yet, the impact of osmotic stress on the mobility of GFP in L. monocytogenes is much less, which is consistent with its higher stress tolerance compared to L. lactis. We have no simple mechanistic explanation for this difference since combinatorial effects at the cytoplasmic, membrane, and cell wall cannot be excluded and remain to be identified.
Many recent studies have shown an essential role of the second messenger c-di-AMP in the growth, cell wall biosynthesis, and osmoregulation of L. monocytogenes (Witte et al., 2013; Gibhardt et al., 2019). It is tempting to speculate that c-di-AMP plays a role in the ability of L. monocytogenes to resist osmotic stress as shown here by the relatively high mobility of proteins in the cytoplasm. We note that c-di-AMP is also present in L. lactis but not in E. coli, and thus there is not a simple correlation between resistance to osmotic stress and the regulation of the volume of these cells via the uptake and efflux of potassium ions and compatible solutes (Commichau et al., 2018; Gibhardt et al., 2020; Peterson et al., 2020; Sikkema et al., 2020). Besides, the physiological effect of c-di-AMP on the uptake of potassium in L. monocytogenes is less pronounced than in other Firmicutes (Gibhardt et al., 2019; Stülke and Krüger, 2020). Thus, the regulation by cyclic-di-AMP may not be the sole factor to explain the differences in osmotic stress resistance.
We are not aware of studies that report the temperature dependence of diffusion inside living cells even though the effect of temperature on the diffusion of lipids and proteins in membranes (Nenninger et al., 2014) and in vitro in media with synthetic crowders have been reported (Banks and Fradin, 2005). We find that DL of cytoplasmic GFP increases about threefold when the temperature is increased from 7 to 30°C (Figure 5C), which is more than the number predicted by the Stokes-Einstein equation. At temperatures higher than 30°C, the DL of cytoplasmic GFP decreases, but this effect is observed only in temperature-adapted cells and not in cells grown at 30°C and upshifted to a higher temperature (Figure 5C, blue triangles). The observed temperature effects above 30°C may arise from changes in the proteome composition of temperature-adapted cells, which may lead to a different cytoplasmic structure and composition, impacting protein diffusion. For example, the positive regulatory factor A (PrfA) in L. monocytogenes is a transcriptional activator that is thermally activated at 37°C and mediates the transcriptional reprogramming required to transition from a non-pathogenic to a pathogenic state (Johansson et al., 2002).
Not surprisingly, the Stokes-Einstein equation fails to predict the temperature-dependence of diffusion of proteins in heterogeneously crowded environments such as the bacterial cytoplasm. The current thinking is that weak, nonspecific interactions between the macromolecules of the cell slow their diffusion (Muramatsu and Minton, 1988; Zorrilla et al., 2007; Wang et al., 2010), which is dependent on the ambient proteome and metabolome. Deviations from Stokes-Einstein may also be caused by differences in binding equilibria, e.g., in many cases, the bound state is preferred at lower temperatures (Rothe et al., 2016). The macromolecular interactions in living cells change further when they are confronted with environmental insults. Our observations on the temperature dependence of protein diffusion in L. monocytogenes warrant further investigation in other cell types, not in the least because macromolecular viscosity or crowding is an important physicochemical factor in every living cell and temperature transients are common in many environments.
In summary, we have determined the lateral diffusion coefficient of GFP in the cytoplasm of L. monocytogenes under a range of physical and physiological conditions that influence the fitness and survival of the microorganism. Osmotic stress and a highly cationic surface of the target protein have significantly less impact on the diffusion in L. monocytogenes than it has in E. coli or L. lactis. Remarkably, the impact of osmotic stress is similar in shocked and adapted cells, and the temperature dependence of diffusion shows an optimum around the optimal growth temperature of L. monocytogenes. Further investigations, using additional mutants, may shed new light on the role of regulatory circuits and output signals on the structure of the cytoplasm in L. monocytogenes.
Data Availability Statement
The datasets presented in this study can be found in online repositories. The names of the repository/repositories and accession number(s) can be found in the article/Supplementary Material.
Author Contributions
BT, AI, and BP designed the study. BT conducted the experiments (with help from HP in studies on +25 GFP), analyzed the data, and wrote the first draft of the manuscript. BP, AI, CO, and TA supervised the work and edited the manuscript. All authors contributed to the article and approved the submitted version.
Funding
This project has received funding from the European Union’s Horizon 2020 Research and Innovation Program under the Marie Skłodowska-Curie grant agreement no. 721456.
Conflict of Interest
The authors declare that the research was conducted in the absence of any commercial or financial relationships that could be construed as a potential conflict of interest.
Acknowledgments
We would like to thank Tine Rask Licht at the Technical University of Denmark (DTU) for the vector pNF8, and Christiaan M. Punter and Wojciech M. Śmigiel for converting the FRAP analysis software to Python.
Supplementary Material
The Supplementary Material for this article can be found online at: https://www.frontiersin.org/articles/10.3389/fmicb.2021.640149/full#supplementary-material
References
Abram, F., Starr, E., Karatzas, K. A. G., Matlawska-Wasowska, K., Boyd, A., Wiedmann, M., et al. (2008). Identification of components of the sigma B regulon in Listeria monocytogenes that contribute to acid and salt tolerance. Appl. Environ. Microbiol. 74, 6848–6858. doi: 10.1128/AEM.00442-08
Aertsen, A., and Michiels, C. W. (2005). Diversify or die: generation of diversity in response to stress. Crit. Rev. Microbiol. 31, 69–78. doi: 10.1080/10408410590921718
Amezaga, M. R., Davidson, I., Debra, M., Verheul, A., Abee, T., and Booth, I. R. (1995). The role of peptide metabolism in the growth of Listeria monocytogenes ATCC 23074 at high osmolarity. Microbiology 141, 41–49. doi: 10.1099/00221287-141-1-41
Andersen, J. B., Roldgaard, B. B., Lindner, A. B., Christensen, B. B., and Licht, T. R. (2006). Construction of a multiple fluorescence labelling system for use in co-invasion studies of Listeria monocytogenes. BMC Microbiol. 6:86. doi: 10.1186/1471-2180-6-86
Angelidis, A. S., and Smith, G. M. (2003). Role of the glycine betaine and carnitine transporters in adaptation of Listeria monocytogenes to chill stress in defined medium. Appl. Environ. Microbiol. 69, 7492–7498. doi: 10.1128/AEM.69.12.7492-7498.2003
Arnaud, M., Chastanet, A., and Débarbouillé, M. (2004). New vector for efficient allelic replacement in naturally nontransformable, low-GC-content, gram-positive bacteria. Appl. Environ. Microbiol. 70, 6887–6891. doi: 10.1128/AEM.70.11.6887-6891.2004
Baker, N. A., Sept, D., Joseph, S., Holst, M. J., and McCammon, J. A. (2001). Electrostatics of nanosystems: application to microtubules and the ribosome. Proc. Natl. Acad. Sci. U.S.A. 98, 10037–10041. doi: 10.1073/pnas.181342398
Banks, D. S., and Fradin, C. (2005). Anomalous diffusion of proteins due to molecular crowding. Biophys. J. 89, 2960–2971. doi: 10.1529/biophysj.104.051078
Barinov, A., Loux, V., Hammani, A., Nicolas, P., Langella, P., Ehrlich, D., et al. (2009). Prediction of surface exposed proteins in Streptococcus pyogenes, with a potential application to other Gram-positive bacteria. Proteomics 9, 61–73. doi: 10.1002/pmic.200800195
Becker, L. A., Cetin, M. S., Hutkins, R. W., and Benson, A. K. (1998). Identification of the gene encoding the alternative sigma factor ςB from Listeria monocytogenes and its role in osmotolerance. J. Bacteriol. 180, 4547–4554. doi: 10.1128/JB.180.17.4547-4554.1998
Becker, L. A., Evans, S. N., Hutkins, R. W., and Benson, A. K. (2000). Role of ςB in adaptation of Listeria monocytogenes to growth at low temperature. J. Bacteriol. 182, 7083–7087. doi: 10.1128/JB.182.24.7083-7087.2000
Boersma, A. J., Zuhorn, I. S., and Poolman, B. (2015). A sensor for quantification of macromolecular crowding in living cells. Nat. Methods. 12, 227–229. doi: 10.1038/nmeth.3257
Bremer, E., and Krämer, R. (2019). Responses of microorganisms to osmotic stress. Annu. Rev. Microbiol. 73, 313–334. doi: 10.1146/annurev-micro-020518-115504
Cayley, D. S., Guttman, H. J., and Record, M. T. (2000). Biophysical characterization of changes in amounts and activity of Escherichia coli cell and compartment water and turgor pressure in response to osmotic stress. Biophys. J. 78, 1748–1764. doi: 10.1016/S0006-3495(00)76726-9
Cayley, S., Lewis, B. A., Guttman, H. J., and Record, M. T. Jr. (1991). Characterization of the cytoplasm of Escherichia coli K-12 as a function of external osmolarity: implications for protein-DNA interactions in vivo. J. Mol. Biol. 222, 281–300. doi: 10.1016/0022-2836(91)90212-O
Cayley, S., and Record, M. T. (2003). Roles of cytoplasmic osmolytes, water, and crowding in the response of Escherichia coli to osmotic stress: biophysical basis of osmoprotection by glycine betaine. Biochemistry 42, 12596–12609. doi: 10.1021/bi0347297
Cayley, S., and Record, M. T. (2004). Large changes in cytoplasmic biopolymer concentration with osmolality indicate that macromolecular crowding may regulate protein–DNA interactions and growth rate in osmotically stressed Escherichia coli K-12. J. Mol. Recognit. 17, 488–496. doi: 10.1002/jmr.695
Chan, Y. C., and Wiedmann, M. (2009). Physiology and genetics of Listeria monocytogenes survival and growth at cold temperatures. Crit. Rev. Food Sci. Nutr. 49, 237–253. doi: 10.1080/10408390701856272
Chaturongakul, S., Raengpradup, S., Wiedmann, M., and Boor, K. J. (2008). Modulation of stress and virulence in Listeria monocytogenes. Trends Microbiol. 16, 388–396. doi: 10.1016/j.tim.2008.05.006
Commichau, F. M., Gibhardt, J., Halbedel, S., Gundlach, J., and Stülke, J. (2018). A delicate connection: c-di-AMP affects cell integrity by controlling osmolyte transport. Trends Microbiol. 26, 175–185. doi: 10.1016/j.tim.2017.09.003
Cormack, B. P., Valdivia, R. H., and Falkow, S. (1996). FACS-optimized mutants of the green fluorescent protein (GFP). Gene 173, 33–38. doi: 10.1016/0378-1119(95)00685-0
Cossart, P., and Toledo-Arana, A. (2008). Listeria monocytogenes, a unique model in infection biology: an overview. Microb. Infect. 10, 1041–1050. doi: 10.1016/j.micinf.2008.07.043
Crank, J., and Nicolson, P. (1947). A practical method for numerical evaluation of solutions of partial differential equations of the heat-conduction type. Math. Proc. Cambridge Philos. Soc. 43, 50–67. doi: 10.1017/S0305004100023197
de Vries, R. (2010). DNA condensation in bacteria: interplay between macromolecular crowding and nucleoid proteins. Biochimie 92, 1715–1721. doi: 10.1016/j.biochi.2010.06.024
Deng, Y., Sun, M., and Shaevitz, J. W. (2011). Direct measurement of cell wall stress stiffening and turgor pressure in live bacterial cells. Phys. Rev. Lett. 107:158101. doi: 10.1103/PhysRevLett.107.158101
Dolinsky, T. J., Nielsen, J. E., McCammon, J. A., and Baker, N. A. (2004). PDB2PQR: an automated pipeline for the setup of Poisson–Boltzmann electrostatics calculations. Nucleic Acids Res. 32, W665–W667. doi: 10.1093/nar/gkh381
Ducret, A., Quardokus, E. M., and Brun, Y. V. (2016). MicrobeJ, a tool for high throughput bacterial cell detec‘tion and quantitative analysis. Nat. Microbiol. 1:16077. doi: 10.1038/nmicrobiol.2016.77
Ellis, R. J. (2001). Macromolecular crowding: obvious but underappreciated. Trends Biochem. Sci. 26, 597–604. doi: 10.1016/S0968-0004(01)01938-7
Elowitz, M. B., Surette, M. G., Wolf, P. E., Stock, J. B., and Leibler, S. (1999). Protein mobility in the cytoplasm of Escherichia coli. J. Bacteriol. 181, 197–203. doi: 10.1128/JB.181.1.197-203.1999
Fang, W., Siegumfeldt, H., Budde, B. B., and Jakobsen, M. (2004). Osmotic stress leads to decreased intracellular pH of Listeria monocytogenes as determined by fluorescence ratio-imaging microscopy. Appl. Environ. Microbiol. 70, 3176–3179. doi: 10.1128/AEM.70.5.3176-3179.2004
Ferreira, A., O’Byrne, C. P., and Boor, K. J. (2001). Role of ςB in heat, ethanol, acid, and oxidative stress resistance and during carbon starvation in Listeria monocytogenes. Appl. Environ. Microbiol. 67, 4454–4457. doi: 10.1128/AEM.67.10.4454-4457.2001
Fortineau, N., Trieu-Cuot, P., Gaillot, O., Pellegrini, E., Berche, P., and Gaillard, J. L. (2000). Optimization of green fluorescent protein expression vectors for in vitro and in vivo detection of Listeria monocytogenes. Res. Microbiol. 151, 353–360. doi: 10.1016/S0923-2508(00)00158-3
Fraser, K. R., Sue, D., Wiedmann, M., Boor, K., and O’Byrne, C. P. (2003). Role of σB in regulating the compatible solute uptake systems of Listeria monocytogenes: osmotic induction of opuC is σB dependent. Appl. Environ. Microbiol. 69, 2015–2022. doi: 10.1128/AEM.69.4.2015-2022.2003
Fu, G., Huang, T., Buss, J., Coltharp, C., Hensel, Z., and Xiao, J. (2010). In vivo structure of the E. coli FtsZ-ring revealed by photoactivated localization microscopy (PALM). PloS one 5:e12680. doi: /10.1371/journal.pone.0012680
Gaballa, A., Guariglia-Oropeza, V., Wiedmann, M., and Boor, K. J. (2019). Cross talk between SigB and PrfA in Listeria monocytogenes facilitates transitions between extra-and intracellular environments. Microbiol. Mol. Biol. Rev. 83:e00034-19. doi: 10.1128/MMBR.00034-19
Geu-Flores, F., Nour-Eldin, H. H., Nielsen, M. T., and Halkier, B. A. (2007). USER fusion: a rapid and efficient method for simultaneous fusion and cloning of multiple PCR products. Nucleic Acids Res. 35:e55. doi: 10.1093/nar/gkm106
Gibhardt, J., Heidemann, J. L., Bremenkamp, R., Rosenberg, J., Seifert, R., Kaever, V., et al. (2020). An extracytoplasmic protein and a moonlighting enzyme modulate synthesis of c-di-AMP in Listeria monocytogenes. Environ. Microbiol. 22, 2771–2791. doi: 10.1111/1462-2920.15008
Gibhardt, J., Hoffmann, G., Turdiev, A., Wang, M., Lee, V. T., and Commichau, F. M. (2019). c-di-AMP assists osmoadaptation by regulating the Listeria monocytogenes potassium transporters KimA and KtrCD. J. Biol. Chem. 294, 16020–16033. doi: 10.1074/jbc.RA119.010046
Glaser, P., Frangeul, L., Buchrieser, C., Rusniok, C., Amend, A., Baquero, F., et al. (2001). Comparative genomics of Listeria species. Science 294, 849–852. doi: 10.1126/science.1063447
Guerreiro, D. N., Wu, J., Dessaux, C., Oliveira, A. H., Tiensuu, T., Gudynaite, D., et al. (2020). Mild stress conditions during laboratory culture promote the proliferation of mutations that negatively affect Sigma B activity in Listeria monocytogenes. J. Bacteriol. 202:e00751-19. doi: 10.1128/JB.00751-19
Hain, T., Hossain, H., Chatterjee, S. S., Machata, S., Volk, U., Wagner, S., et al. (2008). Temporal transcriptomic analysis of the Listeria monocytogenes EGD-e σB regulon. BMC Microbiol. 8:20. doi: 10.1186/1471-2180-8-20
Hess, S. T., Girirajan, T. P., and Mason, M. D. (2006). Ultra-high resolution imaging by fluorescence photoactivation localization microscopy. Biophys. J. 91, 4258–4272. doi: 10.1529/biophysj.106.091116
Holland, D. P., and Walsby, A. E. (2009). Digital recordings of gas-vesicle collapse used to measure turgor pressure and cell–water relations of cyanobacterial cells. J. Microbiol. Methods 77, 214–224. doi: 10.1016/j.mimet.2009.02.005
Johansson, J., Mandin, P., Renzoni, A., Chiaruttini, C., Springer, M., and Cossart, P. (2002). An RNA thermosensor controls expression of virulence genes in Listeria monocytogenes. Cell 110, 551–561. doi: 10.1016/S0092-8674(02)00905-4
Joyner, R. P., Tang, J. H., Helenius, J., Dultz, E., Brune, C., and Holt, L. J. (2016). A glucose-starvation response regulates the diffusion of macromolecules. Elife 5:e09376. doi: 10.7554/eLife.09376
Kazmierczak, M. J., Mithoe, S. C., Boor, K. J., and Wiedmann, M. (2003). Listeria monocytogenes σB regulates stress response and virulence functions. J. Bacteriol. 185, 5722–5734. doi: 10.1128/JB.185.19.5722-5734.2003
Kim, H., Marquis, H., and Boor, K. J. (2005). σB contributes to Listeria monocytogenes invasion by controlling expression of inlA and inlB. Microbiology 151:3215. doi: 10.1099/mic.0.28070-0
Kim, J. S., Backman, V., and Szleifer, I. (2011). Crowding-induced structural alterations of random-loop chromosome model. Phys. Rev. Lett. 106:168102. doi: 10.1103/PhysRevLett.106.168102
Ko, R., Smith, L. T., and Smith, G. M. (1994). Glycine betaine confers enhanced osmotolerance and cryotolerance on Listeria monocytogenes. J. Bacteriol. 176, 426–431. doi: 10.1128/jb.176.2.426-431.1994
Koch, A. L. (1998). The biophysics of the gram-negative periplasmic space. Crit. Rev. Microbiol. 24, 23–59. doi: 10.1080/10408419891294172
Konopka, M. C., Shkel, I. A., Cayley, S., Record, M. T., and Weisshaar, J. C. (2006). Crowding and confinement effects on protein diffusion in vivo. J. Bacteriol. 188, 6115–6123. doi: 10.1128/JB.01982-05
Konopka, M. C., Sochacki, K. A., Bratton, B. P., Shkel, I. A., Record, M. T., and Weisshaar, J. C. (2009). Cytoplasmic protein mobility in osmotically stressed Escherichia coli. J. Bacteriol. 191, 231–237. doi: 10.1128/JB.00536-08
Kozlowski, L. P. (2016). IPC–isoelectric point calculator. Biol. Direct 11:55. doi: 10.1186/s13062-016-0159-9
Kozlowski, L. P. (2017). Proteome-pI: proteome isoelectric point database. Nucleic Acids Res. 45, D1112–D1116. doi: 10.1093/nar/gkw978
Lewenza, S., Vidal-Ingigliardi, D., and Pugsley, A. P. (2006). Direct visualization of red fluorescent lipoproteins indicates conservation of the membrane sorting rules in the family Enterobacteriaceae. J. Bacteriol. 188, 3516–3524. doi: 10.1128/JB.188.10.3516-3524.2006
Liarzi, O., and Epel, B. L. (2005). Development of a quantitative tool for measuring changes in the coefficient of conductivity of plasmodesmata induced by developmental, biotic, and abiotic signals. Protoplasma 225, 67–76. doi: 10.1007/s00709-004-0079-x
Lidstrom, M. E., and Konopka, M. C. (2010). The role of physiological heterogeneity in microbial population behavior. Nat. Chem. Biol. 6:705. doi: 10.1038/nchembio.436
Marinho, C. M., Dos Santos, P. T., Kallipolitis, B. H., Johansson, J., Ignatov, D., Guerreiro, D. N., et al. (2019). The σB-dependent regulatory sRNA Rli47 represses isoleucine biosynthesis in Listeria monocytogenes through a direct interaction with the ilvA transcript. RNA Biol. 16, 1424–1437. doi: 10.1080/15476286.2019.1632776
McClure, P. J., Roberts, T. A., and Oguru, P. O. (1989). Comparison of the effects of sodium chloride, pH and temperature on the growth of Listeria monocytogenes on gradient plates and in liquid medium. Lett. Appl. Microbiol. 9, 95–99. doi: 10.1111/j.1472-765X.1989.tb00299.x
Mika, J. T., and Poolman, B. (2011). Macromolecule diffusion and confinement in prokaryotic cells. Curr. Opin. Biotechnol. 22, 117–126. doi: 10.1016/j.copbio.2010.09.009
Mika, J. T., Schavemaker, P. E., Krasnikov, V., and Poolman, B. (2014). Impact of osmotic stress on protein diffusion in Lactococcus lactis. Mol. Microbiol. 94, 857–870. doi: 10.1111/mmi.12800
Miller, C. C. (1924). The Stokes-Einstein law for diffusion in solution. Proc. R. Soc. Lond. A 106, 724–749. doi: 10.1098/rspa.1924.0100
Monk, I. R., Gahan, C. G., and Hill, C. (2008). Tools for functional postgenomic analysis of Listeria monocytogenes. Appl. Environ. Microbiol. 74, 3921–3934. doi: 10.1128/AEM.00314-08
Mullineaux, C. W., Nenninger, A., Ray, N., and Robinson, C. (2006). Diffusion of green fluorescent protein in three cell environments in Escherichia coli. J. Bacteriol. 188, 3442–3448. doi: 10.1128/JB.188.10.3442-3448.2006
Munder, M. C., Midtvedt, D., Franzmann, T., Nueske, E., Otto, O., and Herbig, M. (2016). A pH-driven transition of the cytoplasm from a fluid- to a solid-like state promotes entry into dormancy. Elife 5:e09347. doi: 10.7554/eLife.09347
Muramatsu, N., and Minton, A. P. (1988). Tracer diffusion of globular proteins in concentrated protein solutions. Proc. Natl. Acad. Sci. U.S.A. 85, 2984–2988. doi: 10.1073/pnas.85.9.2984
Nenninger, A., Mastroianni, G., Robson, A., Lenn, T., Xue, Q., Leake, M. C., et al. (2014). Independent mobility of proteins and lipids in the plasma membrane of Escherichia coli. Mol. Microbiol. 92, 1142–1153. doi: 10.1111/mmi.12619
O’Donoghue, B., NicAogáin, K., Bennett, C., Conneely, A., Tiensuu, T., Johansson, J., et al. (2016). Blue-light inhibition of Listeria monocytogenes growth is mediated by reactive oxygen species and is influenced by σB and the blue-light sensor Lmo0799. Appl. Environ. Microbiol. 82, 4017–4027. doi: 10.1128/AEM.00685-16
O’Driscoll, B., Gahan, C. G., and Hill, C. (1996). Adaptive acid tolerance response in Listeria monocytogenes: isolation of an acid-tolerant mutant which demonstrates increased virulence. Appl. Environ. Microbiol. 62, 1693–1698. doi: 10.1128/AEM.62.5.1693-1698.1996
Parry, B. R., Surovtsev, I. V., Cabeen, M. T., O’Hem, C. S., Dufresne, E. R., and Jacobs-Wagner, C. (2014). The bacterial cytoplasm has glass-like properties and is fluidized by metabolic activity. Cell 156, 183–194. doi: 10.1016/j.cell.2013.11.028
Patchett, R. A., Kelly, A. F., and Kroll, R. G. (1992). Effect of sodium chloride on the intracellular solute pools of Listeria monocytogenes. Appl. Environ. Microbiol. 58, 3959–3963. doi: 10.1128/AEM.58.12.3959-3963.1992
Peterson, B. N., Young, M. K., Luo, S., Wang, J., Whiteley, A. T., Woodward, J. J., et al. (2020). (p) ppGpp and c-di-AMP homeostasis is controlled by CbpB in Listeria monocytogenes. Mbio 11:e01625-20. doi: 10.1128/mBio.01625-20
Pettersen, E. F., Goddard, T. D., Huang, C. C., Couch, G. S., Greenblatt, D. M., Meng, E. C., et al. (2004). UCSF Chimera—a visualization system for exploratory research and analysis. J. Comput. Chem. 25, 1605–1612. doi: 10.1002/jcc.20084
Potma, E. O., de Boeij, W. P., Bosgraaf, L., Roelofs, J., van Haastert, P. J., and Wiersma, D. A. (2001). Reduced protein diffusion rate by cytoskeleton in vegetative and polarized dictyostelium cells. Biophys. J. 81, 2010–2019. doi: 10.1016/S0006-3495(01)75851-1
Radoshevich, L., and Cossart, P. (2018). Listeria monocytogenes: towards a complete picture of its physiology and pathogenesis. Nat. Rev. Microbiol. 16, 32–46. doi: 10.1038/nrmicro.2017.126
Renier, S., Micheau, P., Talon, R., Hébraud, M., and Desvaux, M. (2012). Subcellular localization of extracytoplasmic proteins in monoderm bacteria: rational secretomics-based strategy for genomic and proteomic analyses. PloS one 7:e42982. doi: 10.1371/journal.pone.0042982
Rivas, G., and Minton, A. P. (2016). Macromolecular crowding in vitro, in vivo, and in between. Trends Biochem. Sci. 41, 970–981. doi: 10.1016/j.tibs.2016.08.013
Rojas, E., Theriot, J. A., and Huang, K. C. (2014). Response of Escherichia coli growth rate to osmotic shock. Proc. Natl. Acad. Sci. U.S.A. 111, 7807–7812. doi: 10.1073/pnas.1402591111
Rothe, M., Gruber, T., Gröger, S., Balbach, J., Saalwächter, K., and Roos, M. (2016). Transient binding accounts for apparent violation of the generalized Stokes–Einstein relation in crowded protein solutions. Phys. Chem. Chem. Phys. 18, 18006–18014. doi: 10.1039/C6CP01056C
Schavemaker, P. E., Boersma, A. J., and Poolman, B. (2018). How important is protein diffusion in prokaryotes? Front. Mol. Biosci. 5:93. doi: 10.3389/fmolb.2018.00093
Schavemaker, P. E., Śmigiel, W. M., and Poolman, B. (2017). Ribosome surface properties may impose limits on the nature of the cytoplasmic proteome. eLife 6:e30084. doi: 10.7554/eLife.30084
Selvin, P. R. (2000). The renaissance of fluorescence resonance energy transfer. Nat. Struct. Mol. Biol. 7, 730–734. doi: 10.1038/78948
Sikkema, H. R., van den Noort, M., Rheinberger, J., de Boer, M., Krepel, S. T., Schuurman-Wolters, G. K., et al. (2020). Gating by ionic strength and safety check by cyclic-di-AMP in the ABC transporter OpuA. Sci. Adv. 6:eabd7697. doi: 10.1126/sciadv.abd7697
Sprague, B. L., Pego, R. L., Stavreva, D. A., and McNally, J. G. (2004). Analysis of binding reactions by fluorescence recovery after photobleaching. Biophys. J. 86, 3473–3495. doi: 10.1529/biophysj.103.026765
Stülke, J., and Krüger, L. (2020). Cyclic di-AMP signaling in bacteria. Annu. Rev. Microbiol. 74, 159–179. doi: 10.1146/annurev-micro-020518-115943
Sue, D., Fink, D., Wiedmann, M., and Boor, K. J. (2004). σB-dependent gene induction and expression in Listeria monocytogenes during osmotic and acid stress conditions simulating the intestinal environment. Microbiology 150, 3843–3855. doi: 10.1099/mic.0.27257-0
Swaminathan, R., Hoang, C. P., and Verkman, A. S. (1997). Photobleaching recovery and anisotropy decay of green fluorescent protein GFP-S65T in solution and cells: cytoplasmic viscosity probed by green fluorescent protein translational and rotational diffusion. Biophys. J. 72, 1900–1907. doi: 10.1016/S0006-3495(97)78835-0
Terry, B. R., Matthews, E. K., and Haseloff, J. (1995). Molecular characterization of recombinant green fluorescent protein by fluorescence correlation microscopy. Biochem. Biophys. Res. Commun. 217, 21–27. doi: 10.1006/bbrc.1995.2740
van den Berg, J., Boersma, A. J., and Poolman, B. (2017). Microorganisms maintain crowding homeostasis. Nat. Rev. Microbiol. 15, 309–318. doi: 10.1038/nrmicro.2017.17
van den Bogaart, G., Hermans, N., Krasnikov, V., and Poolman, B. (2007). Protein mobility and diffusive barriers in Escherichia coli: consequences of osmotic stress. Mol. Microbiol. 64, 858–871. doi: 10.1111/j.1365-2958.2007.05705.x
Verheul, A., Glaasker, E., Poolman, B., and Abee, T. (1997). Betaine and L-carnitine transport by Listeria monocytogenes scott A in response to osmotic signals. J. Bacteriol. 179, 6979–6985. doi: 10.1128/jb.179.22.6979-6985.1997
Verkman, A. S. (2002). Solute and macromolecule diffusion in cellular aqueous compartments. Trends Biochem. Sci. 27, 27–33. doi: 10.1016/S0968-0004(01)02003-5
Viswanath, D. S., Ghosh, T. K., Prasad, D. H., Dutt, N. V., and Rani, K. Y. (2007). Viscosity of Liquids: Theory, Estimation, Experiment, and Data. Berlin: Springer Science Business Media.
Walker, S. J., Archer, P., and Banks, J. G. (1990). Growth of Listeria monocytogenes at refrigeration temperatures. J. Appl. Bacteriol. 68, 157–162. doi: 10.1111/j.1365-2672.1990.tb02561.x
Wang, Y., Li, C., and Pielak, G. J. (2010). Effects of proteins on protein diffusion. J. Am. Chem. Soc. 132, 9392–9397. doi: 10.1021/ja102296k
Wawrezinieck, L., Rigneault, H., Marguet, D., and Lenne, P. F. (2005). Fluorescence correlation spectroscopy diffusion laws to probe the submicron cell membrane organization. Biophys. J. 8, 4029–4042. doi: 10.1529/biophysj.105.067959
Wemekamp-Kamphuis, H. H., Sleator, R. D., Wouters, J. A., Hill, C., and Abee, T. (2004). Molecular and physiological analysis of the role of osmolyte transporters BetL, Gbu, and OpuC in growth of Listeria monocytogenes at low temperatures. Appl. Environ. Microbiol. 70, 2912–2918. doi: 10.1128/AEM.70.5.2912-2918.2004
Whatmore, A. M., and Reed, R. H. (1990). Determination of turgor pressure in Bacillus subtilis: a possible role for K+ in turgor regulation. Microbiology 136, 2521–2526. doi: 10.1099/00221287-136-12-2521
Wiedmann, M., Arvik, T. J., Hurley, R. J., and Boor, K. J. (1998). General stress transcription factor ςB and its role in acid tolerance and virulence of Listeria monocytogenes. J. Bacteriol. 180, 3650–3656. doi: 10.1128/JB.180.14.3650-3656.1998
Witte, C. E., Whiteley, A. T., Burke, T. P., Sauer, J. D., Portnoy, D. A., and Woodward, J. J. (2013). Cyclic di-AMP is critical for Listeria monocytogenes growth, cell wall homeostasis, and establishment of infection. MBio 4:e00282-13. doi: 10.1128/mBio.00282-13
Wood, J. M. (1999). Osmosensing by bacteria: signals and membrane-based sensors. Microbiol. Mol. Biol. Rev. 63, 230–262. doi: 10.1128/MMBR.63.1.230-262.1999
Wood, J. M. (2011). Bacterial osmoregulation: a paradigm for the study of cellular homeostasis. Annu. Rev. Microbiol. 65, 215–238. doi: 10.1146/annurev-micro-090110-102815
Xiang, L., Chen, K., Yan, R., Li, W., and Xu, K. (2020). Single-molecule displacement mapping unveils nanoscale heterogeneities in intracellular diffusivity. Nat. Methods 17, 524–530. doi: 10.1038/s41592-020-0793-0
Yao, X., Walter, J., Burke, S., Stewart, S., Jericho, M. H., and Pink, D. (2002). Atomic force microscopy and theoretical considerations of surface properties and turgor pressures of bacteria. Colloids Surf. B Biointerfaces 23, 213–230. doi: 10.1016/S0927-7765(01)00249-1
Zhou, M., Boekhorst, J., Francke, C., and Siezen, R. J. (2008). LocateP: genome-scale subcellular-location predictor for bacterial proteins. BMC Bioinformatics. 9:173. doi: 10.1186/1471-2105-9-173
Zimmerman, S. B., and Trach, S. O. (1991). Estimation of macromolecule concentrations and excluded volume effects for the cytoplasm of Escherichia coli. J. Mol. Biol. 222, 599–620. doi: 10.1016/0022-2836(91)90499-V
Keywords: protein mobility, lateral diffusion, Listeria monocytogenes, osmotic stress, fluorescence recovery after photobleaching, macromolecular crowding, stress response
Citation: Tran BM, Prabha H, Iyer A, O’Byrne C, Abee T and Poolman B (2021) Measurement of Protein Mobility in Listeria monocytogenes Reveals a Unique Tolerance to Osmotic Stress and Temperature Dependence of Diffusion. Front. Microbiol. 12:640149. doi: 10.3389/fmicb.2021.640149
Received: 10 December 2020; Accepted: 21 January 2021;
Published: 17 February 2021.
Edited by:
Jörg Stülke, University of Göttingen, GermanyReviewed by:
Fabian M. Commichau, Brandenburg University of Technology Cottbus-Senftenberg, GermanyMarco Rinaldo Oggioni, University of Leicester, United Kingdom
Copyright © 2021 Tran, Prabha, Iyer, O’Byrne, Abee and Poolman. This is an open-access article distributed under the terms of the Creative Commons Attribution License (CC BY). The use, distribution or reproduction in other forums is permitted, provided the original author(s) and the copyright owner(s) are credited and that the original publication in this journal is cited, in accordance with accepted academic practice. No use, distribution or reproduction is permitted which does not comply with these terms.
*Correspondence: Bert Poolman, Yi5wb29sbWFuQHJ1Zy5ubA==; Buu Minh Tran, Yi5tLnRyYW5AcnVnLm5s