Abstract
Temperature variation can promote physico-chemical and microbial changes in the water transported through distribution systems and influence the dynamics of biofilms attached to pipes, thus contributing to the release of pathogens into the bulk drinking water. An experimental real-scale chlorinated DWDS was used to study the effect of increasing temperature from 16 to 24°C on specific pathogens, bacterial-fungal communities (biofilm and water samples) and determine the risk of material accumulation and mobilisation from the pipes into the bulk water. Biofilm was developed for 30 days at both temperatures in the pipe walls, and after this growth phase, a flushing was performed applying 4 gradual steps by increasing the shear stress. The fungal-bacterial community characterised by Illumina MiSeq sequencing, and specific pathogens were studied using qPCR: Mycobacterium spp., Mycobacterium avium complex, Acanthamoeba spp., Pseudomonas aeruginosa, Legionella pneumophilia, and Stenotrophomonas maltophilia. Sequencing data showed that temperature variation significantly modified the structure of biofilm microbial communities from the early stages of biofilm development. Regarding bacteria, Pseudomonas increased its relative abundance in biofilms developed at 24°C, while fungal communities showed loss of diversity and richness, and the increase in dominance of Fusarium genus. After the mobilisation phase, Pseudomonas continued being the most abundant genus at 24°C, followed by Sphingobium and Sphingomonas. For biofilm fungal communities after the mobilisation phase, Helotiales incertae sedis and Fusarium were the most abundant taxa. Results from qPCR showed a higher relative abundance of Mycobacterium spp. on day 30 and M. avium complex throughout the growth phase within the biofilms at higher temperatures. The temperature impacts were not only microbial, with physical mobilisation showing higher discolouration response and metals release due to the increased temperature. While material accumulation was accelerated by temperature, it was not preferentially to either stronger or weaker biofilm layers, as turbidity results during the flushing steps showed. This research yields new understanding on microbial challenges that chlorinated DWDS will undergo as global temperature rises, this information is needed in order to protect drinking water quality and safety while travelling through distribution systems.
Introduction
Drinking water distribution systems (DWDS) are not sterile environments (Liu et al., 2013) and it is well known that most of the microorganisms inhabiting these systems live attached to internal pipe surfaces forming biofilms (Batté et al., 2003; Douterelo et al., 2014a). The biofilm mode of life confers a series of advantages to its members such as protection against disinfectants, facilitates exchange of genetic material or enhancing metabolic capacities helping the acquisition of nutrients (Flemming, 2002). The mobilisation of microorganisms from biofilms into the bulk water has been associated with several problems in DWDS, including discolouration, taste or odour, increase of metals, release and proliferation of potential pathogens (Szewzyk et al., 2000; Douterelo et al., 2014a; Nescerecka et al., 2014; Husband et al., 2016). Biofilm development in DWDS is affected by several factors, such a pipe material, hydraulic conditions, the amount and type of disinfectant or the concentration of organic and inorganic compounds (Batté et al., 2003; Douterelo et al., 2013; Mi et al., 2015; Ren et al., 2015). Another key factor affecting DWDS is temperature, which is an key parameter of water quality and can modify processes occurring within DWDS (Delpla et al., 2009; Bondank et al., 2018). Temperature is an important determinant of water quality, since it influences physical, chemical and biological processes, such as absorption of chemicals, chlorine decay (Hua et al., 1999) and microbial growth and competition processes (Nescerecka et al., 2014). Currently, worldwide we are experiencing more frequent extreme weather events, with high temperature peaks during short periods of time, especially in regions with desert and continental-like climates such a Mediterranean countries (Mesquita et al., 2013; World Health Organization (WHO), 2017). As a consequence of climate change, these temperature peaks could be of greater intensity, longer, and they could happen more often in other climatic zones (World Health Organization (WHO), 2017).
However, limited knowledge exists on how temperature affects biofilms in chlorinated DWDS when decay of chlorine due to higher temperatures can facilitate further biofilm growth (Hua et al., 1999; Li et al., 2018) and select for certain microorganisms including pathogens. Changes in temperature in DWDS are strongly influenced by weather, soil type, depth of installation of pipes and hydraulic residence times (Agudelo-Vera et al., 2020). Zlatanović et al. (2017), while studying domestic non-chlorinated Dutch copper pipe systems, showed the influence of temperature on bacterial communities under stagnation. Similarly, a recent study also in an unchlorinated system has shown that temperature rise associated to the use of cold recovery technology lead to biomass and bacterial community changes in these systems (Ahmad et al., 2020). However, these studies in non-chlorinated systems focus only on bacteria, they do not represent the dynamics of typical chlorinated DWDS, and they do not contribute either to understand the risks associated to biofilm mobilisation. Furthermore, several studies have demonstrated the incidence of opportunistic pathogens (OPs) such a non-tuberculous mycobacteria (NTM) or Legionella spp. in DWDS, and its ability to proliferate in biofilm in drinking water systems (van der Wielen and van der Kooij, 2013; Ashbolt, 2015). In different freshwater ecosystems such a rivers, lakes, reservoirs or groundwater it has been observed that the growth of some of these pathogens depends on the temperature (Pandey et al., 2014). In unchlorinated DWDS, it has been suggested that higher temperature in the summer could have contributed to the growth of OPs such a Mycobacteria or L. pneumophila (van der Wielen and van der Kooij, 2013). The present research provides new understanding in relation to the impact of temperature on biofilms and the potential mobilisation of microorganisms and in particular pathogens (including amoeba and fungi) in a chlorinated DWDS under representative hydraulic regimes.
Materials and Methods
Experimental DWDS Facility and Experiment Conditions
In order to ensure controlled yet fully representative conditions, the research was carried out using a temperature controlled full scale experimental DWDS facility at the University of Sheffield (United Kingdom), previously described in detail by Douterelo et al. (2014b) (Supplementary Figure 1A). In brief, the facility consists of 3 independent recirculating loops of High-Density Polyethylene (HDPE). Each pipe loop consists of 9.5 m × 21.4 m long coils of 79.3 mm internal diameter HDPE pipe, thus has a total length of 203 m. HDPE was selected as it is a prevalent material used in DWDS world-wide (World Health Organization (WHO), 2006). The system allowed for experimental replication by running three independent loops simultaneously. The water running through the system came from the local drinking water supply (an upland source with a ferric based treatment process and then 36″ diameter cast iron mains before entering the laboratory via a dedicated pipe) thus representing realistic conditions. Water entering the system was heated via two heaters wired in series installed in each tank (Redring P27DC, United Kingdom), warming the water at the temperature needed for the experiments. The facility has removable coupons that can be inserted into the pipes to enable in situ analysis of biofilms (Deines et al., 2010). Each coupon has an outer part for molecular analysis and an insert for microscopy, making possible simultaneous visual and molecular analysis of biofilms without modifying or destroying the biofilm (Supplementary Figure 1B; Deines et al., 2010). Before the experiments started, the whole facility was disinfected with 20 mg/L of RODOLITE H (RODOL Ltd., United Kingdom), a sodium hypochlorite based solution with less than 16% free chlorine, following the protocol described by Douterelo et al. (2014b). After disinfecting the system, sterile coupons were inserted along the pipes.
To study the effect of temperature fluctuation on the DWDS microbiome (biofilm and planktonic communities) and the potential of biofilm mobilisation from the pipe into the bulk water, experiments were performed first at 16 and at 24°C, respectively. Please note that the 3 independent loops were run to obtain replication for each experiment. This temperature selection was within the realms of the climate change predictions and based on previous research showing that the average water temperature in UK DWDS is 16°C in spring-summer months (Husband et al., 2008) and on the WHO recommendation that the temperature of drinking water should not exceed 25°C to limit microbial growth (World Health Organization (WHO), 2017).
Each experiment comprised of a biofilm growth phase of 30 days, followed by a flushing programme used to study the mobilisation dynamics of biofilms from pipe surfaces (Supplementary Table 1 and Supplementary Figure 2). The biofilm growth phase of 30 days was selected based on previous studies in the same facility that showed this time as sufficient to detect and monitor discolouration and biofilm mobilisation events, as well as microbial community changes (Douterelo et al., 2013, 2014b; Fish and Boxall, 2018; Rosales et al., 2020).
During the biofilm growth phase, the facility was operated using a representative low varied flow hydraulic regime (ranging from 0.2 to 0.5 L/s) based on daily patterns observed in real DWDS in the United Kingdom (Husband et al., 2008). Similarly, the residence time of the water in the system was set to 24 h, thus representing conditions in actual distribution systems in the United Kingdom. After the 30 days of biofilm growth phase, the system was flushed, using the same protocol to flush the pipes for both temperature conditions. The flushing protocol consisted in 4 gradual steps by increasing the shear stress (τ) in the pipes to explore if the strength profile of the biofilms were altered by the temperature changes: step 1 = 0.4 N/m2, step 2 = 2.3 N/m2, step 3 = 3.4 N/m2, step 4 = 4.3 N/m2 (Supplementary Table 1 and Supplementary Figure 2). Each step was performed for a duration of 3 water turnovers (i.e., the time that the total volume of the water needs for recirculate in the loop three times), to mix and detect the maximum amount of material mobilised from the pipes into the bulk water (Sharpe et al., 2010).
Microbial Communities Sampling and Water Quality Physico-Chemical Conditions During Biofilm Growth Phase and Mobilisation Experiments
To study temporal dynamics of planktonic and biofilm communities, water samples from each loop and coupons were obtained on day 0 when the experimental conditions were optimal, and the water had reached the study temperature. This took around 4 h for each temperature, from when the water filled the loop until stable temperature values were reached and representative samples of day 0 were taken. Then biofilm and bulk water samples were taken every 10 days until day 30 during the growth phase at both temperatures. This monitoring approach allowed pair-wise comparisons of microbial community succession under the two temperatures over time from early stages of biofilm development. Water and biofilm samples were also obtained after the mobilisation events at both temperatures. In each sampling event, 3 replicates of 2 L of bulk water were taken from sampling taps located in each loop and they were filtered through a 0.22 μm nitrocellulose membrane filters (Millipore-Corp., United States). For the biofilm samples, 9 coupons were taken in each sampling point to obtain 3 biological replicates by pooling biofilms from 3 coupons. Biofilms were removed from coupons following a standardised protocol as described in Fish et al. (2015), creating a biofilm suspension that was filtered through a 0.22 μm nitrocellulose membrane filters (Millipore-Corp., United States). Filters of water and biofilm samples were preserved in the dark and at −20°C prior to subsequent DNA extractions. In total, n = 30 biofilm samples and n = 30 water samples were analysed. No DNA was extracted from the coupon samples taken on day 0, indicating that there was no biological material developed in the coupon.
Turbidity, iron (Fe) and manganese (Mn) concentrations were studied as the main parameters associated with discolouration (Seth et al., 2004) and total organic carbon (TOC) to test the organics in water. Turbidity was measured online every minute during the experiments by an ATi-A15/76 turbidity monitor (ATi, United Kingdom), installed in the experimental facility. At the time of sampling, pH and water temperature were measured in triplicate using a Hanna portable metre HI-991003 (Hanna Instruments, United Kingdom). Free and total chlorine were tested with a Palintest-CS100 chlorosense (Palintest, United Kingdom). In addition, at each sampling event 3 replicates of discrete water samples were taken to analyse TOC, and the concentration of Fe and Mn at The Kroto Research Institute (KRI) (The University of Sheffield, United Kingdom). Samples for TOC were stored in 20 ml glass vials and then analysed using a Shimadzu TOC-VCPH/CPN Analyzer (Shimadzu, Japan) following manufacturer’s instructions. For Fe and Mn concentrations, water samples were collected in 20 mL vials containing 5M of nitric acid and then ions were monitored by means of an Inductively Coupled Plasma Mass Spectrometry (ICP-MS) on a Perkin Elmer Elan DRC-II (PerkinElmer, United States) (Sloetjes and Wittenburg, 2008).
Microscopy Analysis
Visual characterised of biofilms enable qualitative assessment of overall differences between temperatures. Coupon inserts from day 0 (control) and day 30 were analysed in triplicate by Scanning Electron Microscopy (SEM), at The Faculty of Science, Electron Microscopy Facility at the University of Sheffield (United Kingdom). Samples were fixed in 5% formaldehyde solution (Fisher Scientific, United Kingdom) for 24 h and preserved in Phosphate Buffer Solution (PBS) (Gibco®, Thermo Fisher Scientific, United Kingdom), at 4°C. Afterward, samples were fixed secondary following the protocol described by Fischer et al. (2012). Samples were coated with approximately 25 nm of gold in an Edwards Gold Sputter Coater S150B (Edwards, United Kingdom). Micrographs of biofilms were obtained with a TESCAN-Vega3 LMU (Girton, Cambridge, United Kingdom) at an accelerating voltage of 15 kV.
DNA Extraction and Sequencing
DNA from all the filters with concentrates of water and biofilm samples was extracted following the protocol based on hexadecylmethylammonium bromide (CTAB) and proteinase K chemical lysis, followed by DNA purification using phenol/isoamyl alcohol method (Zhou et al., 1996; Neufeld et al., 2007). DNA concentration from each extraction was then quantified fluorometrically using the HS dsDNA Assay kit with a Qubit 4 Fluorometer (Invitrogen, United States). Extracted DNA was sequenced by Mr DNA Laboratory (Shallowater, TX, United States) on the Illumina MiSeq platform following the manufacturer’s guidelines for pair-end sequencing. Bacterial 16S rRNA gene fragments were amplified using the primers 28F (5′-GAGTTTGATCNTGGCTCAG-3′) and 519R (5′-GTNTTACNGCGGCKGCTG-3′) spanning the V1 to V3 hypervariable regions. For fungal analysis, primers ITS1FBt1 (5′-CTTGGTCATTTAGAGGAAGTAA-3′)/ITS2R (5′- GCTGCGTTCTTCATCGATGC-3′) targetting the ITS1-2 regions were selected for amplification. Sequencing data were deposited in the NCBI Sequence Read Archive (SRA) with the accession number PRJNA656259.
Bioinformatics and Community Analysis
An initial quality control of the sequencing raw data was carried out using the FastQC software v0.11.8 (Andrew, 2010). BBDuk software v37.95 was used to remove sequencing errors (Davis et al., 2018) and to filter and trim sequences with an average quality phred score below 20 and/or a minimum length of 100 bp (Cock et al., 2009). Sequencing reads, with a phred score of at least 20 and a length between 100 and 300 bp, were demultiplexed and depleted of barcodes by applying the sabre software (Joshi, 2011) and imported into the Quantitative Insights Into Microbial Ecology 2 program v2019.7 (QIIME2) (Bolyen et al., 2019). Then, pair-end sequences were joined and dereplicated, chimeric sequences were identified and filtered and de novo clustering by 97% similarity was performed to obtain the Operational Taxonomic Units (OTUs) using the vsearch plug-ins in QIIME2. See Supplementary Tables 2, 3 for more information on the sequence count in each step of the bioinformatic analysis. The taxonomic assignment of the final OTUs was carried out using the classify-consensus-vsearch method (Rognes et al., 2016) of the feature-classifier plug-in in QIIME2 (Bokulich et al., 2018). 16S rRNA sequences were compared against the SILVA SSU r132 database (Quast et al., 2013) and ITS2 sequences against UNITE 8.0 (Kõljalg et al., 2013).
Rarefied tables based on of the relative abundance of 97% OTUs for both bacteria and fungi, were used to calculate alpha- and beta-diversity (Morris et al., 2014). Alpha-diversity, which measures the internal diversity of each sample, was calculated as a measurement of Chao 1 index (richness estimator), Simpson index (dominance), and Shannon index (diversity) (Morris et al., 2014) using the rarefied OTU tables at 97% cut-off with the q2-diversity plug-in in QIIME2. For beta-diversity, which estimates the degree of differentiation between samples, the rarefied OTU tables at 97% cut-off was square-root transformed and then the Bray-Curtis method was applied to construct similarity matrices using the vegan package v2.5-6 in R (Oksanen et al., 2019). Bray-Curtis resemblance matrices were visualised by non-metric multidimensional scaling (nMDS) plots with ggplot2 package v3.2.1 in R (Wickham and Chan, 2016).
Quantitative PCR (q-PCR)
q-PCR was performed to monitor changes in the gene copy number of 6 OPs previously reported in DWDS (van der Wielen and van der Kooij, 2013; Qin et al., 2017; Liu et al., 2019). At genus level, the 16S rRNA gene of Mycobacterium spp. was targetted because many of their members of this NTM are responsible for causing a large number of diseases (Liu et al., 2016). The 18S rRNA gene of Acanthamoeba spp. was selected since this genus of free-living amoeba act as an important host of other pathogens in drinking water (Dobrowsky et al., 2016). At species level, the 16S rRNA gene of Mycobacterium avium complex, regA gene of Pseudomonas aeruginosa, mip gene of Legionella pneumophilia, and chiA gene of Stenotrophomonas maltophilia were quantified for having a global importance for human health and because their recognition as major agents of concern in drinking waters are currently increasing (Ashbolt, 2015; Benedict et al., 2017).
The amplification, detection and quantification were performed in a QuantStudioTM 12K Flex Real-Time PCR System (Thermo Fisher Scientific Inc., United Kingdom), following the protocol described by van der Wielen and van der Kooij (2013). Absolute quantifications were based on comparison of the value of sample cycle threshold (CT; i.e., the number of PCR cycles needed for the fluorescence signal of the amplified DNA to cross the fluorescence threshold, which is significantly above the background fluorescence) with the CT value of a calibration curve, based on known copy numbers of the target microorganisms (Kubista et al., 2006; van der Wielen and van der Kooij, 2013; Biosystems, 2015).
Statistical Analysis
To determine the normality of all data sets the Shapiro-Wilks test was applied (Fowler et al., 2013). Statistical differences between parameters (physico-chemical, alpha-diversity values, and gene number of OPs) were tested via the non-parametric test Mann-Whitney U test. For beta-diversity, the analysis of similarities (ANOSIM) test was applied to Bray-Curtis distance matrices based on OTUs relative abundance to detect statistically significant differences in biofilm and water microbial community structures between temperatures. The global-R statistic values obtained from this analysis showed the strength of the impact of temperature on bacterial and fungal community structure. Global-R values ranges from 0 to 1, where 1 indicates that communities are totally different (Anderson and Walsh, 2013; Douterelo et al., 2018). Differences were considered statistically significant when p-value was ≤0.05, and all statistical tests were carried out using R-v3.6.1 (R Core Team, 2014).
Results
Water Physico-Chemical Analysis
As shown in Supplementary Table 4, water temperature was stable over the duration of each experiment, keeping values close to 16 and 24°C for both tests respectively. pH values ranged between 6.6 and 7.6 during the 30 days of the biofilm growth phase, and no statistical differences were detected between temperatures (P-value >0.05). A higher concentration of total chlorine (average at 16°C = 0.93 mg/L, average at 24°C = 0.80 mg/L, n = 3) and free chlorine (average at 16°C = 0.89 mg/L, average at 24°C = 0.68 mg/L, n = 3) was observed at both temperatures on day 0, associated with the process of disinfection (i.e., hyperchlorination) of the system at the beginning of the experiment. Then, during the growth phase and after the mobilisation phase, average chlorine concentrations showed higher values at 16°C (total chlorine average = 0.19 mg/L, n = 12; free chlorine average = 0.13 mg/L, n = 12) than at 24°C (total chlorine average = 0.15 mg/L, n = 12; free chlorine average = 0.09 mg/L, n = 12), but no statistical differences were found (p-value >0.05). TOC, iron and manganese concentrations were similar showing no statistical differences (p-values >0.05) during the growth phase at both temperatures, ranging from 1.13–1.35 mg/L, 42.4–59.3 μg/L and 0.33–0.52 μg/L respectively. Online turbidity measurements during the growth phase, showed similar values at both temperatures, average of 0.043 ± 0.01 NTU at 16°C (n = 43181) and 0.042 ± 0.01 NTU at 24°C (n = 43173) (p-value >0.05).
After the 30 days biofilm-growth phase, shear stress was increased in the system and the physico-chemistry of the bulk water monitored to quantify the response. Fe and Mn concentration increased considerably after the mobilisation phases at both temperatures, showing significantly higher values at 24°C (Fe average = 81.2 μg/L, n = 3, Mn average = 1.2 μg/L, n = 3) than at 16°C (Fe average = 53.7 μg/L, n = 3; Mn average = 0.69 μg/L, n = 3) (p-value Fe = 0.03, p-value Mn = 0.05). The online turbidity data from the final well mixed turnover of the system after each increase in shear stress was averaged and plotted against shear stress to observe the strength profiles of the material mobilised (Figure 1). Statistically no differences were found (p-value >0.05) at the first two small increase in shear stress due to the relatively small amounts of material mobilised. In the last two stages statistically significant higher values in the turbidity response were observed at 24°C (p-value S3 = 0.0009, p-value S4 = 0.0006). The response at both temperatures is linear between imposed shear stress and turbidity, R2 = 0.9955 at 16°C and R2 = 0.9996 at 24°C (Figure 1).
FIGURE 1

Average turbidity response during the last 24 h of the growth phase (representative of the growth phase) and during the last turnover of each stage of the flushes (i.e., when the water with the mobilised material was mixed) at different temperatures. All values represent an average ± standard deviation. ∗p-value ≤0.05 from Mann–Whitney U test.
Scanning Electron Microscope Micrographs
Supplementary Figure 3 shows SEM micrographs of biofilm on the coupons on day 0 (control) and after 30 days of growth phase at 16 and 24°C. Sterilised coupons at the beginning of the experiment showed no cells attached to the surface of the coupon at 16 and 24°C respectively (Supplementary Figure 3A). Differences in the coupons surface coverage can be observed on day 30 at different temperatures (Supplementary Figures 3B,C). At 16°C small patches of biofilm-like structures were developed on the surface of the coupon. However, at 24°C a greater amount of cellular material and biofilm accumulation was observed on the surface of the coupon. More angular inclusions, indicative of inorganics, are visible in the 24°C than 16°C images.
Microbial Community Structure (Bacteria and Fungi) During Growth Phase and Mobilisation
Alpha-Diversity (Diversity Within Samples)
Statistical differences between temperature treatments were examined by pairwise comparisons for each sampling day during the growth phase (i.e., day 0, 10, 20, and 30). Figure 2 shows the diversity indices, Chao 1, Simpson and Shannon at OTUs level at 97% cut-off for bacteria and fungi. Planktonic communities during the growth phase showed no significant differences between the experiments at different temperatures (p-values >0.05). Alpha-diversity of the biofilm bacterial communities did not show significant differences between temperatures during the growth phase (p-values >0.05).
FIGURE 2
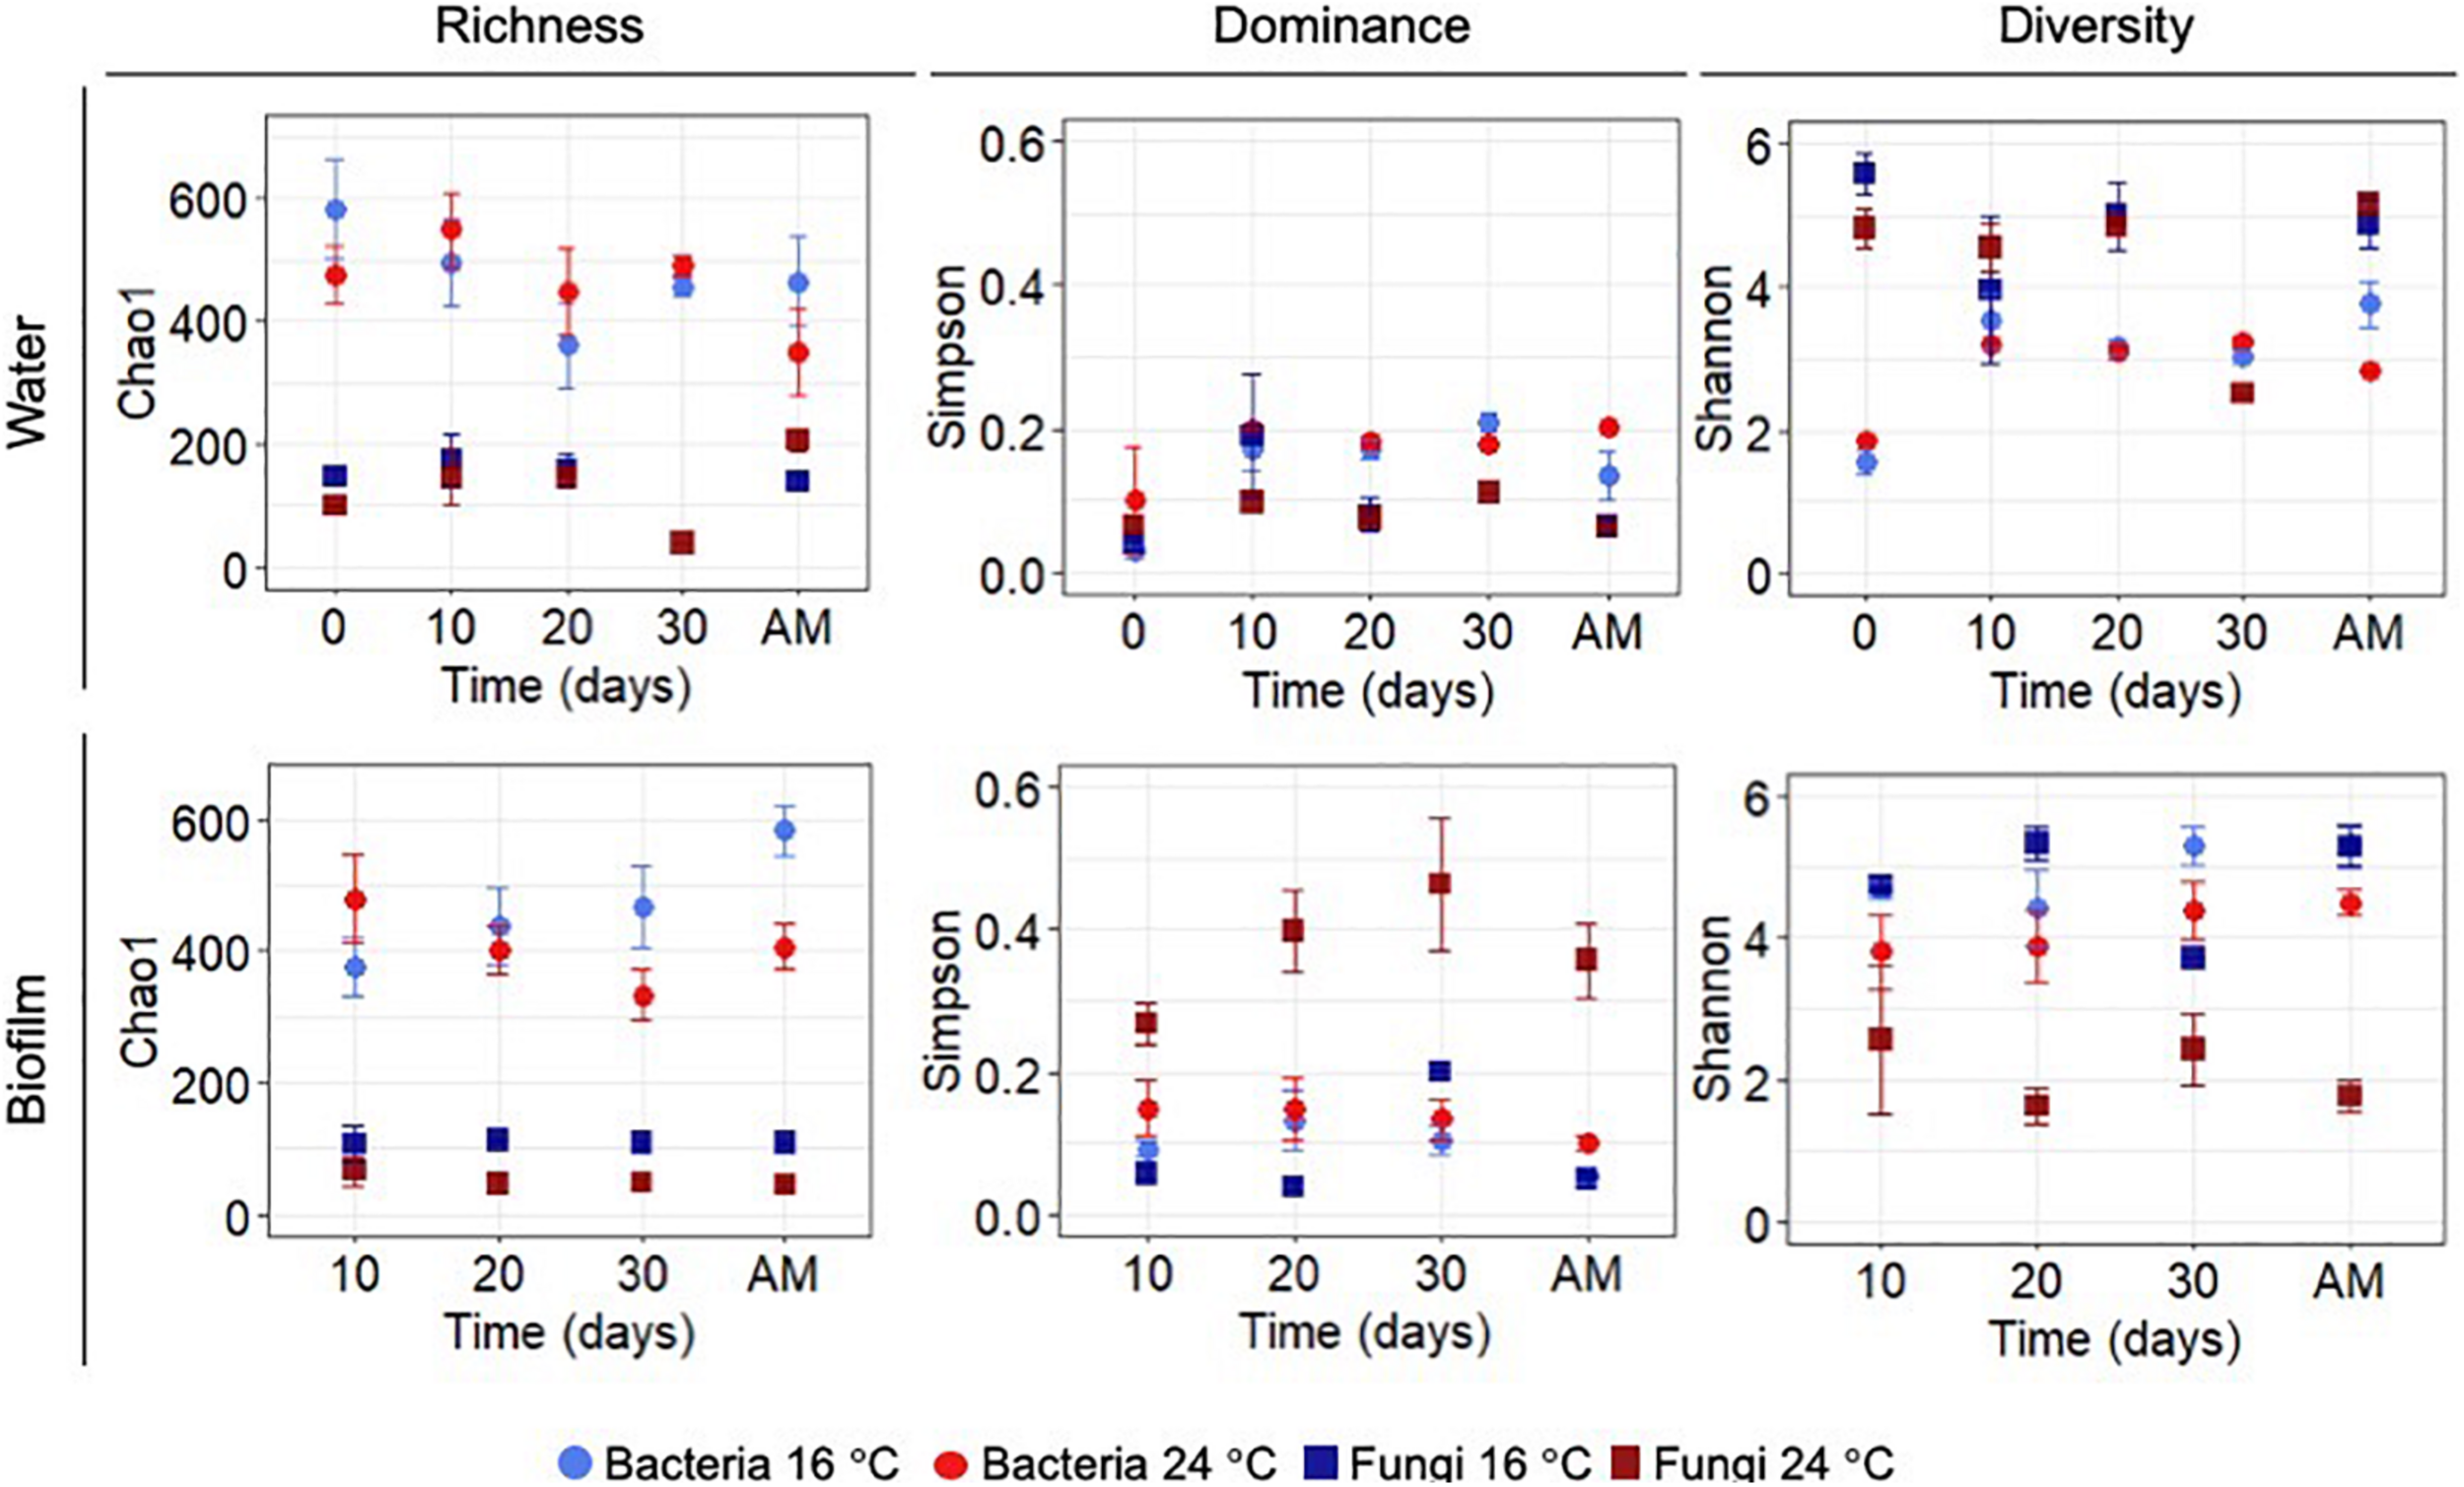
Chao 1 (richness), Simpson (dominance) and Shannon (diversity) indices for OTUs at 97% cut-off for bacteria and fungi in biofilm and water samples calculated for each sampling day during the growth phase and after mobilisation phase (AM). All values represent an average of three water replicates ± standard deviation.
After the mobilisation phase, Chao 1 and Shannon indices showed lower significant values at higher temperature (p-value Chao1 = 0.05, p-value Shannon = 0.05). Conversely, biofilm fungal communities showed significant differences for all the calculated indices over time (p-value Simpson-Day 10 = 0.05, p-value Shannon-Day 10 = 0.05; p-value Chao1-Day 20 = 0.05, p-value Simpson-Day 20 = 0.05, p-value Shannon-Day 20 = 0.05; p-value Chao1-Day 30 = 0.05, p-value Simpson-Day 30 = 0.01, p-value Shannon-Day 30 = 0.01) with the exception of day 10 where no differences were observed for Chao 1 (p-value >0.05). After flushing at 24°C the Shannon index of planktonic bacterial communities decreased (p-value = 0.05), and Chao 1 of fungal planktonic communities increased (p-value = 0.05), mirroring the response in the biofilm. See Supplementary Table 5 for more details on the results of all pairwise comparisons.
Beta-Diversity (Diversity Among/Between Samples)
Figure 3 shows nMDS plots with the resemblance between microbial communities at OTUs level at 97% cut-off at different temperatures. For planktonic communities, nMDS showed a clear separation for bacteria, but not for fungi. ANOSIM analysis for water samples showed that only bacterial structure was significantly modified by the increase of temperature (global-R = 0.5, p-value = 0.001), while fungal communities showed no significant differences between temperatures (global-R = 0.03, p-value = 0.245). For biofilm, nMDS showed an evident clustering at different temperatures for both, bacteria and fungi. ANOSIM confirmed that the temperature increases significantly affected the bacterial (global-R = 0.66, p-value = 0.001) and fungal community structures (global-R = 0.45, p-value = 0.003).
FIGURE 3
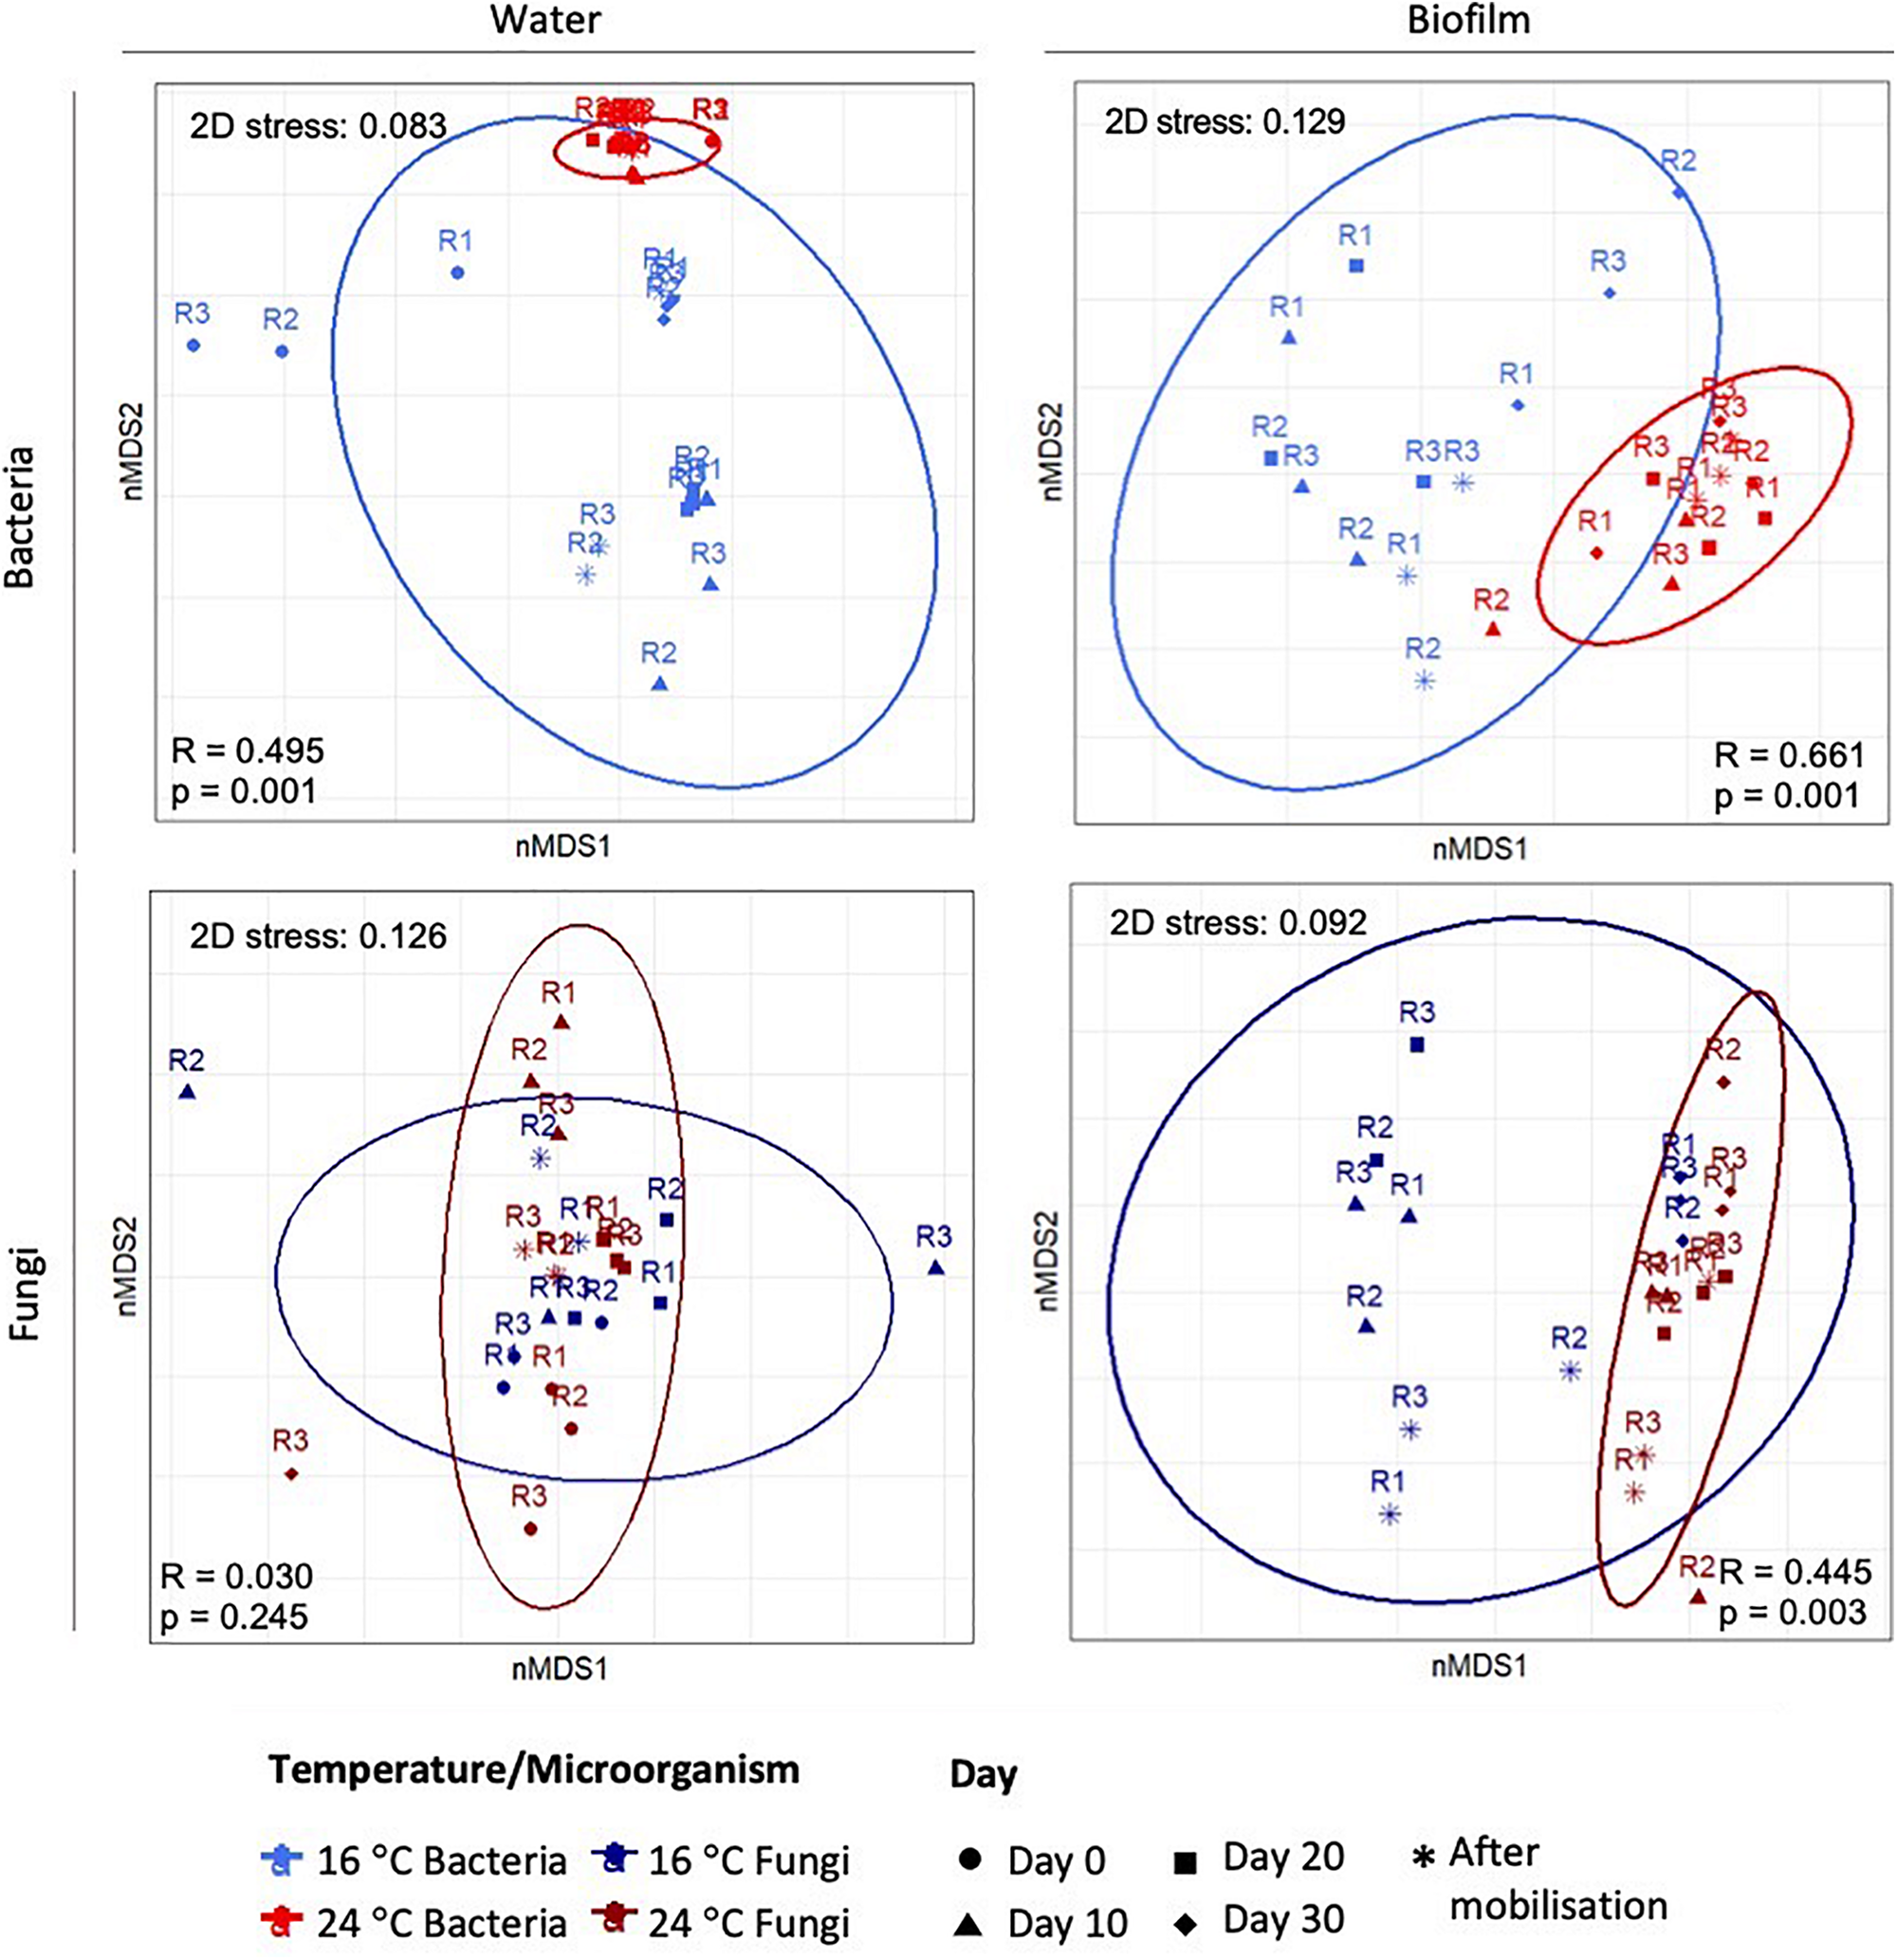
Two-dimensional plot of the non-multidimensional scaling (nMDS) analysis based on Bray–Curtis similarities of the relative abundance of bacteria and fungi in water and biofilm samples. The 3 replicates (R1, R2, and R3) per sampling day are represented.
Microbial Taxonomic Profiles
Focussing on the most abundant taxa (relative abundance >1%), several differences between temperatures were detected in the taxonomical composition in both water and biofilm samples at OTUs level at 97% cut-off (Figures 4, 5).
FIGURE 4
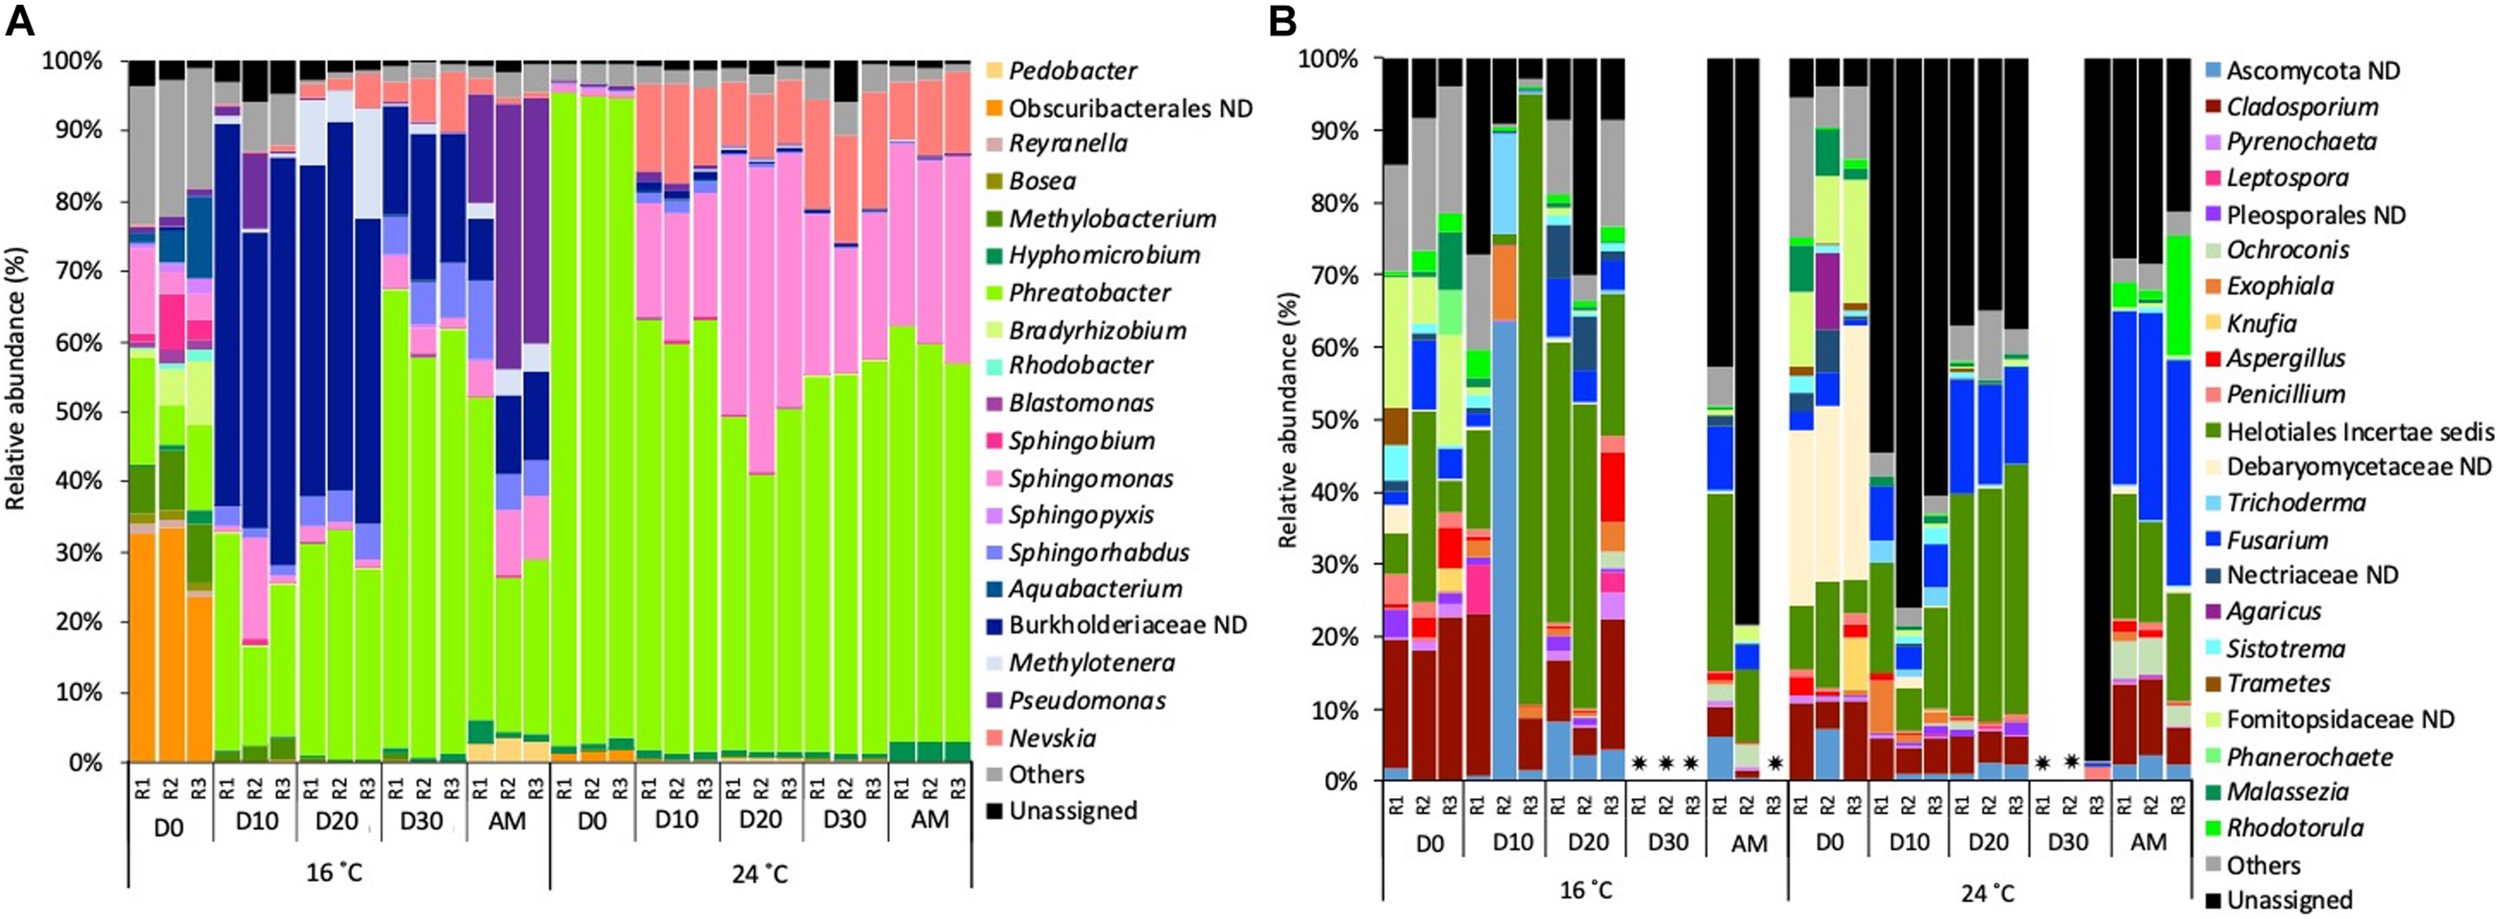
Relative abundance of (A) bacterial genera and (B) fungal genera (>1% of the total sequences) at 16 and 24°C in bulk water samples every 10 days (D) throughout the growth phase and after the mobilisation phase (AM). The 3 replicates (R1, R2, and R3) per sampling point are represented. Remaining genera were combined in category “Others.” Category “Unassigned” correspond to unidentified OTUs and “ND” means not defined at that level.  Samples that did not amplify during the sequencing process.
FIGURE 5
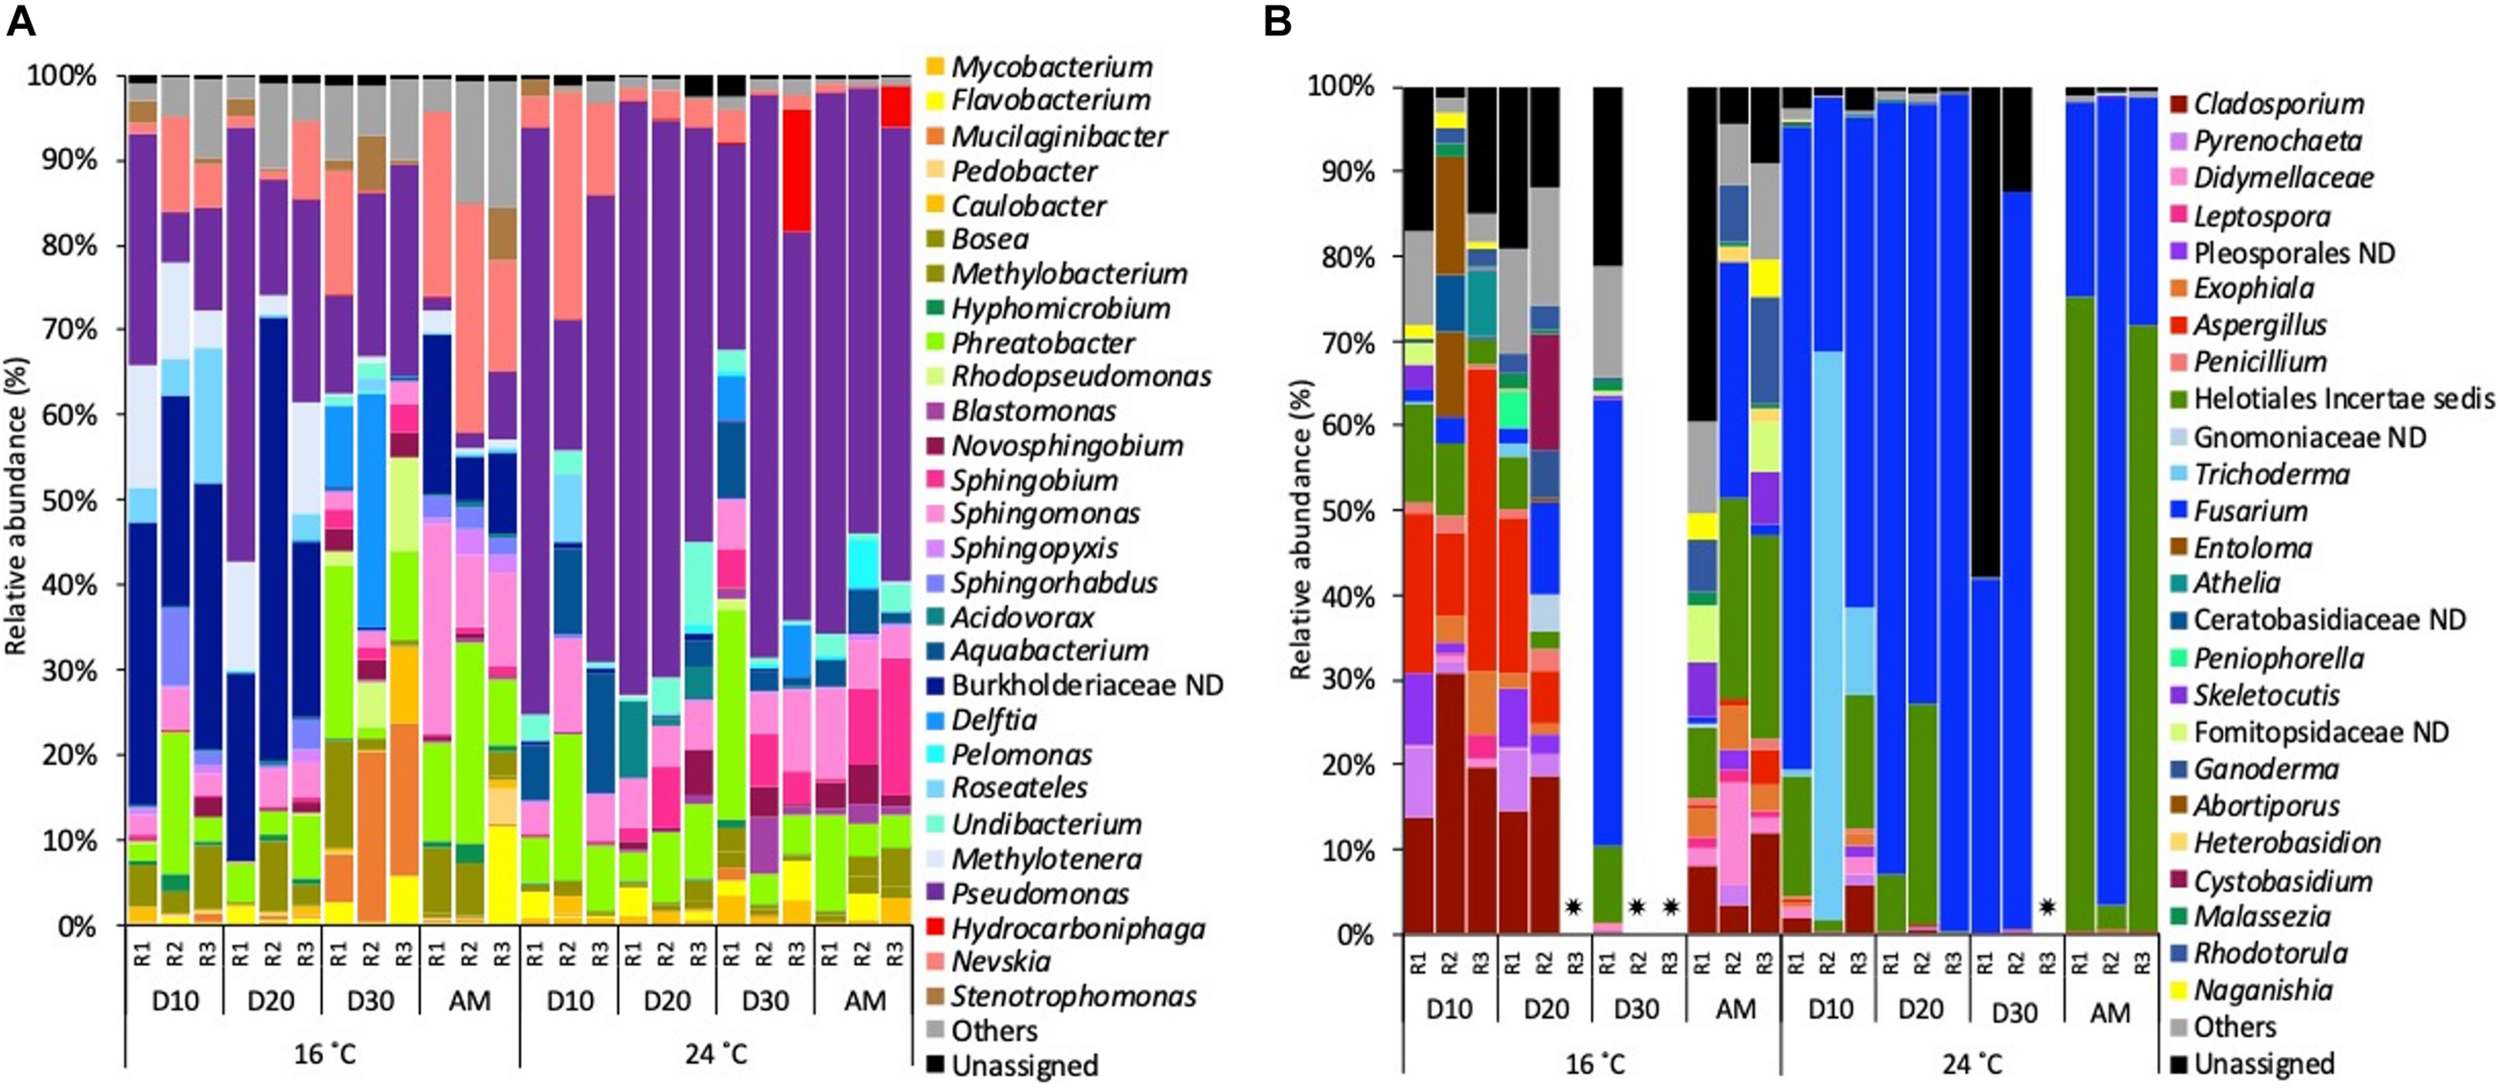
Relative abundance of (A) bacterial genera and (B) fungal genera (>1% of the total sequences) at 16 and 24°C in biofilm samples every 10 days (D) throughout the growth phase and after the mobilisation phase (AM). The 3 replicates (R1, R2, and R3) per sampling point are represented. Remaining genera were combined in category “Others.” Category “Unassigned” correspond to unidentified OTUs and “ND” means not defined at that level. Samples that did not amplify during the sequencing process.
Bacterial planktonic communities, at 16°C on day 0 bacterial communities were dominated by an uncultured Obscuribacterales (30.2%) followed by Phreatobacter (11.2%). On consecutive days, Burkholderiaceae (39.2%) and Phreatobacter (37.8%) were the most abundant taxa. After the mobilisation phase, Phreatobacter (32.4%) dominated the community followed by Pseudomonas (30.0%) and a not defined (ND) Burkholderiaceae (11.1%). At 24°C planktonic communities showed a similar taxonomic profile during the growth phase and after the mobilisation, being Phreatobacter (61.8%) the most abundant genus, followed by Sphingomonas (28.5%) and Nevskia (9.5%) (Figure 4A).
Planktonic fungal communities showed a high percentage of unassigned sequences (ranged from 8.4 to 97.1%) in all the samples, particularly at 24°C. Overall, similar taxonomical composition was observed at 16°C and 24°C during the growth phase. After mobilisation and community was dominated by Helotiales incertae sedis (20.6%), Cladosporium (average 8.5%) and an unidentified Ascomycota (4.9%) (Figure 4B).
Biofilm communities, at 16°C, on days 10 and 20 bacterial community was dominated by a not defined (ND) Burkholderiaceae (average of 30.9%), followed by Pseudomonas (20.8%) and Methylotenera (9.2%). On day 30, Pseudomonas (18.5%) became the most abundant genera, followed by Mucilaginibacter (14.5%) and Delftia (12.4%). After the mobilisation phase, biofilm bacterial community was dominated by Nevskia (20.6%), Sphingomonas (14.7%) and Phreatobacter (14.2%). At 24°C the most representative genera at each sampled point of the growth phase was Pseudomonas (52.0%) followed by Phreatobacter (7.1%) and Sphingomonas (6.2%). After the mobilisation phase, Pseudomonas (56.5%) continued being the most abundant genus, followed by Sphingobium (8.6%) and Sphingomonas (6.6%) (Figure 5A).
For biofilm fungal communities at 16°C on days 10 and 20 Cladosporium (19.0%) and Aspergillus (average of 16.9%) were the most abundant taxa. On day 30, the relative abundance of Fusarium increased to become the most abundant genus (52.7%) followed by Helotiales incertae sedis (9.1%). After the mobilisation phase, Helotiales incertae sedis (18.8%), Fusarium (9.8%) and Rhodotorula (8.54%) dominated the community. At 24°C, Fusarium (68.6%) was the most abundant taxa over the biofilm growth phase, followed by Trichoderma (26.1%) and Helotiales incertae sedis (10.8%). After the mobilisation phase, Helotiales incertae sedis (49.8%) and Fusarium (48.3%) continued being the most abundant taxa (Figure 5B).
Opportunistic Pathogens Occurrence Analysed by q-PCR
The OPs gene copies number at 16 and 24°C are shown in Table 1. The majority of OP selected showed no statistically significant difference between the different temperatures for water or biofilm samples. The results did show statistical differences between temperatures for Mycobacterium spp. on biofilm samples from day 30 (p-value ≤0.05). However, in the rest of the biofilm samples and in water samples this microorganism did not show statistical differences. The gene copy number for M. avium complex showed statistical changes between temperatures; at 16°C the gene copies were below the limit of quantification, but they showed an increase at 24°C in all the samples analysed (biofilm and water). P. aeruginosa, Acanthomoeba spp. and S. maltophilia were detected and quantified in all samples of biofilm and water over time (except Acanthomaeba spp. after the mobilisation phase in both water and biofilm). L. pneumophillia was below quantification limit in every sampling point. Overall, the OPs gene copy number in biofilm samples tended to increase at 24°C (with 14 out of 19 relevant cases, but with only 5 statistically significant), yet not a clear pattern was observed with biofilm age. L. pneumophillia was below quantification limit in every sampling point at 16 and 24°C.
TABLE 1
| Mycobacterium spp. | M. avium complex | P. aeruginosa | |||||
| 16°C | 24°C | 16°C | 24°C | 16°C | 24°C | ||
| Biofilm (copies/cm2) | Day 10 | 4.99E + 02 ± 2.48E + 02 | 9.02E + 02 ± 1.26E + 02 | B.Q.L | 1.94E + 02 ± 2.91E + 01 * | 2.32E + 03 ± 3.33E + 02 | 1.38E + 03 ± 5.85E + 00 |
| Day 20 | 1.60E + 03 ± 8.19E + 02 | 7.77E + 03 ± 5.5E + 03 | B.Q.L | 3.12E + 02 ± 9.21E + 00 * | 4.95E + 02 ± 3.21E + 02 | 7.06E + 02 ± 1.29E + 01 | |
| Day 30 | 1.90E + 03 ± 1.23E + 03 | 1.14E + 04 ± 2.82E + 03 * | B.Q.L | 2.17E + 02 ± 8.22E + 01 * | 7.53E + 02 ± 2.33E + 02 | 1.41E + 03 ± 1.52E + 02 | |
| AM | 1.21E + 03 ± 1.02E + 03 | 4.37E + 03 ± 2.70E + 03 | B.Q.L. | 3.70E + 02 ± 5.24E + 01 * | 1.25E + 03 ± 1.28E + 02 | 1.46E + 03 ± 9.14E + 01 | |
| Water (copies/L) | Day 0 | 7.59E + 03 ± 4.12E + 03 | 2.42E + 03 ± 3.97E + 02 | B.Q.L. | 1.14E + 02 ± 7.00E + 01 * | 1.95E02 ± 1.02E + 02 | 7.18E + 02 ± 2.27E + 02 |
| Day 10 | 2.05E + 04 ± 7.31E + 02 | 1.73E + 04 ± 2.59E + 03 | B.Q.L. | 2.94E + 02 ± 4.77E + 01 * | 3.23E + 02 ± 4.45E + 01 | 1.50E + 03 ± 4.89E + 02 | |
| Day 20 | 1.02E + 04 ± 3.20E + 03 | 9.55E + 03 ± 3.76E + 03 | B.Q.L. | 2.20E + 02 ± 5.47E + 01 * | 3.21E + 02 ± 1.92E + 02 | 2.45E + 03 ± 7.79E + 02 | |
| Day 30 | 1.68E + 04 ± 1.31E + 03 | 1.42E + 04 ± 2.34E + 02 | B.Q.L. | 3.54E + 02 ± 8.23E + 01 * | 3.18E + 03 ± 1.23E + 03 | 2.81E + 03 ± 3.44E + 02 | |
| AM | 2.09E + 04 ± 7.23E + 03 | 3.85E + 04 ± 3.40E + 03 | B.Q.L. | 2.43E + 02 ± 1.02E + 02 * | 4.73E + 03 ± 1.84E + 03 | 3.10E + 03 ± 1.15E + 03 | |
| L. pneumophillia | Acanthomaeba spp. | S. maltophilia | |||||
| 16°C | 24°C | 16°C | 24°C | 16°C | 24°C | ||
| Biofilm (copies/cm2) | Day 10 | B.Q.L | B.Q.L | 1.74E + 04 ± 5.71E + 03 | 1.85E + 04 ± 5.23E + 03 | 2.17E + 03 ± 1.20E + 03 | 1.5E + 03 ± 1.16E + 03 |
| Day 20 | B.Q.L | B.Q.L | 1.21E + 04 ± 3.64E + 03 | 2.14E + 04 ± 8.03E + 03 | 1.81E + 03 ± 3.04E + 02 | 1.95E + 03 ± 1.91E + 02 | |
| Day 30 | B.Q.L | B.Q.L | 7.89E + 03 ± 1.58E + 03 | 2.18E + 04 ± 8.18E + 03 | 3.09E + 03 ± 1.35E + 03 | 1.88E + 03 ± 7.61E + 02 | |
| AM | B.Q.L | B.Q.L | B.Q.L. | B.Q.D. | 2.84E + 03 ± 7.84E + 01 | 9.60E + 02 ± 7.30E + 02 | |
| Water (copies/L) | Day 0 | B.Q.L. | B.Q.L. | 1.86E + 04 ± 2.09E + 03 | 1.18E + 04 ± 6.46E + 03 | 1.38E + 03 ± 1.09E + 03 | 1.91E + 03 ± 1.39E + 03 |
| Day 10 | B.Q.L | B.Q.L | 1.73E + 04 ± 7.85E + 03 | 2.04E + 04 ± 4.77E + 03 | 7.32E + 03 ± 2.24E + 03 | 4.54E + 03 ± 2.14E + 03 | |
| Day 20 | B.Q.L | B.Q.L | 2.06E + 04 ± 2.17E + 03 | 3.30E + 04 ± 1.32E + 04 | 4.44E + 03 ± 2.37E + 03 | 6.96E + 03 ± 2.46E + 03 | |
| Day 30 | B.Q.L | B.Q.L | 1.50E + 04 ± 2.31E + 03 | 1.66E + 04 ± 4.00E + 03 | 4.28E + 03 ± 1.86E + 03 | 3.29E + 03 ± 1.28E + 03 | |
| AM | B.Q.L | B.Q.L | 2.55E + 04 ± 4.10E + 03 | 4.73E + 04 ± 1.43E + 04 | 8.64E + 02 ± 0.00E + 00 | 0.00E + 00 ± 0.00E + 00 | |
Occurrence of Mycobacterium spp., M. avium complex, P. aeruginosa, L. pneumophillia, Acanthamoeba spp. and S. malthophilia in biofilm and water samples at 16 and 24°C.
All values represent an average of three replicates ± standard deviation. “B.Q.L” correspond to number of genes below quantification limit. *p-value ≤0.05 from Mann–Whitney U test.
The water samples showed no statistically significant change with time or between repeats, again confirming the stability of the incoming water and that temperature was the dominant environmental change between the repeat experiments.
Discussion
Effect of Temperature Rise on Water Physico-Chemistry and Discolouration
Results showed that most water physico-chemical characteristics during the growth phase were stable over time (Supplementary Table 4), and most importantly comparable at both temperatures such that temperature was the dominant variable between the experiments.
Free and total chlorine showed slightly lower concentrations during the growth phase at 24°C. Although the differences were not significant between temperatures, this is consistent with the understanding that increasing temperature increases reaction rates. The level of disinfectant residual plays an important role in DWDS by limiting the microbial growth and preventing the proliferation of pathogenic microorganisms (Donnermair and Blatchley, 2003; Fisher et al., 2012; Karadirek et al., 2016). Hence in the scenario of increasing temperature, and with operational systems residence times being greater than the average 24 h of the study system, maybe it will be necessary to augment the doses of disinfectant or look for alternative disinfectants that do not use chlorine-based compounds. Thus, future increases in temperature will pose an economic and technical challenge for water utilities to maintain disinfectant residual concentrations throughout the entire distribution network without compromising the health of consumers.
When the process of water discolouration was evaluated, results showed similar turbidity values and Fe and Mn concentrations during the growth phase at 16 and 24°C, however, there was marked difference in response to biofilm mobilisation (Supplementary Table 4 and Figure 1). Consistency in water turbidity and Fe and Mn concentrations was expected during the growth phase, confirming minimal changes in the source water source during and between the experiments. Discolouration events are related to the biofilm mobilisation from the pipe wall, which is normally produced by a change in the hydraulic conditions (Vreeburg and Boxall, 2007). During the growth phase, the hydraulic conditions of the system were constant following a daily pattern of LVF, explaining the expected absence of changes in turbidity and metal concentrations. After the mobilisation phase, the concentration of these metals and turbidity response increased significantly at both temperatures with significant higher values for these two parameters observed after the flushing event at 24°C. These results indicate that higher temperature led to a greater material accumulation on this chlorinated DWDS, as it was observed by Blokker and Schaap (2015) in unchlorinated DWDS. This finding is in agreement with the SEM micrographs obtained from coupons, which showed a visual greater accumulation of biofilm on the surface of the coupon at 24°C. Previous research, reported a link between microbial growth and temperatures; Hallam et al. (2001) concluded that biofilm potential growth in chlorinated DWDS was enhanced at higher temperatures; and Ahmad et al. (2020) observed higher biofilm concentrations in unchlorinated DWDS with cold recovery technologies concluding that microbial growth kinetics in biofilms were affected by temperature. Thus, the increase in growth and microbial activity in DWDS biofilms due to temperature rise may lead to a greater amount of EPS production, which might facilitate the adsorption and entrainment of material from the bulk water (Douterelo et al., 2019) and the release of OPs into the bulk water.
Importantly, our research also looked at the effects of temperature on the strength profile of the material accumulations. We used a stepped flushing regime such that we could observe the amount of material mobilised by each imposed force in turn. The function of cumulative release of material due to these sequential increases in imposed force was linear (Figure 1). This shows that there was not preferential growth/accumulation of stronger or weaker material as a function of temperature. However, the gradient of the trend was greater for the higher temperature regime, showing greater material accumulation across all the strengths of the cohesive biofilm mediated layers. In brief, under the increased temperature more material was accumulated and subsequently mobilised across all strengths of the biofilm layers, there was no preferential accumulation in stronger or weaker layers.
Our results show that higher temperatures in chlorinated DWDS promote biofilm accumulation on HDPE pipe walls and that when the material attached to the pipe walls is mobilised the probability and severity for water discolouration is greater. We also observed that the strength characteristics of the biofilm layers are unchanged, suggesting existing modelling and intervention strategies (Husband and Boxall, 2011; Husband et al., 2016) remain valid, but that the frequency of these would need to be increased to mitigate the accelerated effects.
Influence of Temperature Upon Microbial Community Structure and Taxonomical Profiles
In addition to the greater potential for biofilm formation at high temperatures, molecular analyses showed that temperature variation significantly modified the structure of biofilm microbial communities from the early stages of biofilm development (Figures 2, 3). This was in agreement with Stanish et al. (2016) that reported that water temperature was determinant for the abundance and composition of bacterial communities in tap water samples, or with Ahmad et al. (2020) and Zhou et al. (2020) that showed that higher temperatures promoted by cold recovery technologies, in unchlorinated and chlorinated DWDS respectively, produced changes in biofilm communities. In the same way, the results from this study confirm that temperature increase is a driving factor changing the bacterial but also fungal microbial community structure within chlorinated DWDS. Furthermore, it has been shown that these differences appear from the early stages of biofilm development, developed at constant temperatures and under representative hydraulic conditions.
These structural changes were evident when the taxonomical composition was analysed over time (Figures 4, 5). Regarding bacteria (Figure 4A), taxa such as Burkholderiaceae ND, Methylotenera or Methylobacterium, decreased in relative abundance at 24°C. The reduction of Burkholderiaceae could be beneficial for water quality, since members of this family have been reported as one of the most common contaminants in distilled and sterile water and as phyto- and animal and human pathogen (Coenye, 2014; Ferranti et al., 2014). In contrast, the lower relative abundance of Methylotenera and Methylobacterium at higher temperature does not suggest positive effects for water quality. Tsagkari and Sloan (2019) demonstrated that Methylobacterium, even at low concentrations, is able to decrease the concentration of trihalomethanes in drinking water (World Health Organization (WHO), 2017; Tsagkari and Sloan, 2019). Methylotenera have been attributed to play an important role in methanol-linked denitrification in lake sediments (Kalyuhznaya et al., 2009), and is able to biodegrade nitrite in water, compound that is often associated with the formation of harmful DBPs in DWDS (Rantanen et al., 2018). Therefore, their lower relative abundance can affect the positive biodegradation capabilities of these microorganisms. Other important genus, Pseudomonas, increased its abundance in biofilms developed at 24°C. Its presence was expected at both temperatures since they often appear in DWDS independently of the pipe material, source water or hydraulic conditions (Martiny et al., 2005; Zhang et al., 2012; Douterelo et al., 2016). However, the increase of Pseudomonas could have negative consequences for water safety, since several opportunistic pathogens belong to this genus (Zhang et al., 2012; Liu et al., 2016). In addition, Pseudomonas spp. are pioneers in the initial stages of biofilm development since they are capable of secreting a high amount of EPS that enhance the growth of biofilms (Johnsen et al., 2000; Simões et al., 2007; Irie et al., 2012; Navarro-Noya et al., 2013). The increase of this genus could lead to an increase in EPS production, which reinforces the hypothesis described above about the greater biofilm formation at higher temperatures. Moreover, EPS can act as protection for the cells (Flemming, 2002), and the potential larger production at higher temperatures would make biofilm communities more resistant against changes in the environmental pipe conditions including disinfectants. This would explain that the microbiome composition during the growth phase and after mobilisation were more similar to each other at 24°C than at 16°C.
Temperature also clearly influenced the fungal community structure in biofilms (Figure 4B). In general, alpha-diversity of biofilm fungal communities were more affected by temperature changes than bacteria during the studied biofilm-growth phase, showing the loss of diversity and richness, and the increase in dominance. This is in agreement with Ortiz-Vera et al. (2018) who found that fungal dominance and diversity in rivers were affected by temperature. To the best of our knowledge this study shows for the first time a similar behaviour for fungal communities in chlorinated DWDS, confirming that these microorganisms are an important part of the biological component of DWDS. The fungal genus that dominated the biofilm community, displacing other microorganisms at higher temperatures was Fusarium. The optimal growth temperature of several species of these filamentous fungi range from 24.7 to 27.5°C (Nazari et al., 2018), which would explain its proliferation at 24°C. Fusarium is able to produce EPS, thus enhancing biofilm formation (Anaissie et al., 2001; Sav et al., 2018), and as suggested for Pseudomonas, its high relative abundance could contribute to the greater biofilm formation observed at 24°C. In addition, several pathogenic species belonging to this genus produce nosocomial infections that mainly affect immunocompromised patients (Anaissie et al., 2001). Therefore, the high relative abundance of these genera into the bulk water enhanced by higher temperature is not desirable, since it could lead to water quality and safety problems.
Temperature variation had a lower effect on bulk water samples (Figure 5). From day 0, the water already had different temperatures, and this explain the different microbial composition on Day 0 for both experimental setups. Then, during the growth phase, temperature effect in planktonic communities was mainly limited to increases in the relative abundance of several genera including Phreatobacter and Sphingomonas at 24°C. These results suggest that water communities, which are more affected and controlled by disinfection processes, are less likely to be modified by other factors such as temperature (Simões et al., 2010). However, biofilms provide microorganisms physical and chemical protection, and other physiological advantages generating a more favourable environment over planktonic cells (Flemming, 2002). Therefore, as biofilms are more resistant to disinfectants, this makes them more susceptible to being affected by other abiotic factors such as temperature. Regarding the genera that increased their abundance, Phreatobacter was recently isolated from ultrapure water of a water purification system (Toth et al., 2014), and it has not been reported by other studies, thus its ecological role in many ecosystems remains unknown. Sphingomonas species are well adapted to oligotrophic environments and they are known for its potential to form biofilms in drinking water systems (Gulati and Ghosh, 2017). However, during the growth phase the system was refreshed with incoming water every 24 h, thus planktonic communities are renewed and not representative of communities growing constantly at 24°C.
Occurrence of OPs
Results showed that P. aeruginosa, S. maltophilia and Acanthamoeba spp. were detected in practically all biofilm and water samples when analysed using q-PCR. Differences in the gene copy number of these OPs were observed at 16 and 24°C, however, statistical analysis showed that they were not significant (Table 1). Similar values for these particular OPs have been reported previously in unchlorinated systems at temperatures ranging from 8.7 to 14.8°C (van der Wielen and van der Kooij, 2013), but these results show them able to survive in chlorinated system at 16 and 24°C. In addition to these OPs, Mycobacterium spp. was present in all samples analysed in this study, higher gene copy numbers in all biofilm samples at 24°C compared to 16°C were quantified although only statistically significantly at day 30. The presence of this OP has been linked to important nosocomial respiratory infections (Liu et al., 2016), therefore its higher occurrence with the temperature rise is a concern. There was no quantification of M. avium complex at 16°C in biofilm or water samples, but this pathogen was detected in all samples at 24°C. This is in agreement with the findings of Daley (2017) who reported that temperature impacted the relative abundance of M. avium complex in tap water samples from a pilot-scale DWDS at temperatures between 39 and 51°C. However, our results extend this showing that M. avium also depends on temperature in biofilms within chlorinated DWDS. In addition, it has been shown that less drastic changes in temperature can increase the abundance of M. avium that can cause pulmonary or even disseminated infections in immunocompromised patients (Daley, 2017). Moreover, since the occurrence of Mycobacterium spp. could not be explained only with the detection of M. avium complex, these results suggest that other species of mycobacteria are present in the samples analysed in our study. Further research is needed to identify these species and have a full picture about the OPs presence and activity and their potential release from biofilms into the bulk water.
Conclusion
- •
Higher temperatures increased biofilm accumulation on HDPE pipes in a chlorinated DWDS, leading to a higher discolouration (quantified as turbidity, iron and manganese) due to simulated flushing. The mobilisation of this material was a linear function with imposed force, showing that while material accumulation was accelerated by temperature, it was not preferentially to either stronger or weaker biofilm layers.
- •
Temperature triggered changes in the microbiome of the DWDS. Temperature affected the structure of bacterial and fungal communities in water, but changes were more notable in biofilms. In biofilms, the relative abundance of Pseudomonas and Fusarium was favoured by temperature increase. These two genera have an enhanced capability to promote biofilm development and compromising further water quality.
- •
The study of OPs showed that temperature rise increased the detection of Mycobacterium spp. in biofilms and favour the presence of M. avium complex in water and biofilm samples.
This study provides new insights on the consequences of higher temperatures on the distribution of drinking water and its impact on water quality. This research is essential to mitigate risks and adapt this fundamental transport infrastructure to prevent the effects of unavoidable climate change.
Statements
Data availability statement
The datasets presented in this study can be found in online repositories. The names of the repository/repositories and accession number(s) can be found below: https://www.ncbi.nlm.nih.gov/, PRJNA656259.
Author contributions
CC, JB, and ID involved in the design of the experiment. CC and ID were in charge of the adaptation of the manuscript for a journal publication and carried out the experiment. CC performed the DNA extraction from samples, analysed the results and did the SEM micrographs, and wrote the manuscript. CC, VS-C, and SM involved in the bioinformatic analysis. CC, JB, VS-C, SM, and ID contributed to the interpretation of results. JB and ID participated in the corrections of the manuscript. All authors contributed to the article and approved the submitted version.
Funding
The research reported here was supported by the UK Engineering and Physical Sciences Research Council (EPSRC), EPSRC-LWEC Challenge Fellowship EP/N02950X/1. The laboratory work was performed at the NERC Biomolecular Analysis Facility- Sheffield and supported by the Natural Environment Research Council, United Kingdom.
Acknowledgments
The authors would also like to recognise and thank to Paul van der Wielen and MSc. Kimberly Learbuch for their support and the materials provided for the development of the q-PCR.
Conflict of interest
The authors declare that the research was conducted in the absence of any commercial or financial relationships that could be construed as a potential conflict of interest.
Supplementary material
The Supplementary Material for this article can be found online at: https://www.frontiersin.org/articles/10.3389/fmicb.2021.658927/full#supplementary-material
Supplementary Figure 1(A) Full scale experimental DWDS facility; (B) Coupons inserted and fixed into the pipes with holders and clips; (C) details and dimensions of the coupons: insert for microscopy and outer for DNA analysis.
Supplementary Figure 2Flushing gradual steps (S) applied in this research for a duration of 3 turnovers.
Supplementary Figure 3SEM micrographs of biofilm developed in coupons: (A) Control (sterile coupon) (MAG = 5.00 kx); (B) Day 30 at 16°C (MAG = 5.00 kx); (C) Day 30 at 24°C (MAG = 5.00 kx). MAG, magnification.
Supplementary Table 1Test loop facility phases flow rate conversions.
Supplementary Table 2Sequence count during each step of bioinformatic analysis of the bacterial 16S rRNA gene in all biofilm and water samples at 16 and 24°C. (-) Samples that did not amplify or were excluded during the analysis for not having enough readings.
Supplementary Table 3Sequence count during each step of bioinformatic analysis of the fungal ITS1-2 region in all biofilm and water samples at 16 and 24°C. (-) Samples that did not amplify or were excluded during the analysis for not having enough readings.
Supplementary Table 4Water physico-chemical parameters measured on sampling days during the growth phase and after mobilisation phase (AM). All values represent an average of three water replicates analysis ± standard deviation.
Supplementary Table 5Results from the Mann-Whitney U test to determine statistical differences in bacterial and fungal alpha diversity indices between temperatures. Differences were considered statistically significant when p-value was ≤0.05.
References
1
Agudelo-VeraC.AvvedimentoS.BoxallJ.CreacoE.de KaterH.Di NardoA.et al (2020). Drinking water temperature around the globe: understanding, policies, challenges and opportunities.Water12:1049.
2
AhmadJ. I.LiuG.van der WielenP. W. J. J.MedemaG.van der HoekJ. P. (2020). Effects of cold recovery technology on the microbial drinking water quality in unchlorinated distribution systems.Environ. Res.183:109175.
3
AnaissieE. J.KucharR. T.RexJ. H.FrancesconiA.KasaiM.MüllerF.-M. C.et al (2001). Fusariosis associated with pathogenic Fusarium species colonization of a hospital water system: a new paradigm for the epidemiology of opportunistic mold infections.Clin. Infect. Dis.331871–1878. 10.1086/324501
4
AndersonM. J.WalshD. C. I. (2013). PERMANOVA, ANOSIM, and the mantel test in the face of heterogeneous dispersions: what null hypothesis are you testing?Ecol. Monogr.83557–574. 10.1890/12-2010.1
5
AndrewS. (2010). FastQC: a Quality Control Tool for High Throughput Sequence Data. Available online at: http://www.bioinformatics.babraham.ac.uk/projects/fastqc(accessed September 12, 2020).
6
AshboltN. J. (2015). Microbial contamination of drinking water and human health from community water systems.Curr. Environ. Health Rep.295–106. 10.1007/s40572-014-0037-5
7
BattéM.AppenzellerB. M. R.GrandjeanD.FassS.GauthierV.JorandF.et al (2003). Biofilms in drinking water distribution systems.Rev. Environ. Sci. Biotechnol.2147–168. 10.1023/B:RESB.0000040456.71537.29
8
BenedictK. M.ResesH.VigarM.RothD. M.RobertsV. A.MattioliM.et al (2017). Surveillance for waterborne disease outbreaks associated with drinking water - United States, 2013-2014.Morbid. Mortal. Weekly Rep.661216–1221. 10.15585/mmwr.mm6644a3
9
BiosystemsA. (2015). Real-time PCR Handbook.Carlsbad, CA: Life Thecnologies.
10
BlokkerE. J. M.SchaapP. G. (2015). Temperature Influences Discolouration risk.Proc. Eng.119280–289. 10.1016/J.PROENG.2015.08.887
11
BokulichN. A.KaehlerB. D.RideoutJ. R.DillonM.BolyenE.KnightR.et al (2018). Optimizing taxonomic classification of marker-gene amplicon sequences with QIIME 2’s q2-feature-classifier plugin.Microbiome6:90. 10.1186/s40168-018-0470-z
12
BolyenE.RideoutJ. R.DillonM. R.BokulichN. A.AbnetC. C.Al-GhalithG. A.et al (2019). Reproducible, interactive, scalable and extensible microbiome data science using QIIME 2.Nat. Biotechnol.37852–857. 10.1038/s41587-019-0209-9
13
BondankE. N.ChesterM. V.RuddellB. L. (2018). Water distribution system failure risks with increasing temperatures.Environ. Sci. Technol.529605–9614. 10.1021/acs.est.7b01591
14
CockP. J. A.FieldsC. J.GotoN.HeuerM. L.RiceP. M. (2009). The sanger FASTQ file format for sequences with quality scores, and the Solexa/Illumina FASTQ variants.Nucleic Acids Res.381767–1771. 10.1093/nar/gkp1137
15
CoenyeT. (2014). “The family Burkholderiaceae,” in The Prokaryotes: Alphaproteobacteria and Betaproteobacteria, edsRosenbergE.DeLongE. F.LoryS.StackebrandtE.ThompsonF. (Berlin: Springer), 759–776. 10.1007/978-3-642-30197-1_239
16
DaleyC. L. (2017). “Mycobacterium avium complex disease,” in Tuberculosis and Nontuberculous Mycobacterial Infections, ed.SchlossbergD. (Hoboken, NJ: Wiley Online Library), 663–701.
17
DavisN. M.ProctorD. M.HolmesS. P.RelmanD. A.CallahanB. J. (2018). Simple statistical identification and removal of contaminant sequences in marker-gene and metagenomics data.Microbiome6:226. 10.1186/s40168-018-0605-2
18
DeinesP.SekarR.HusbandP. S.BoxallJ. B.OsbornA. M.BiggsC. A. (2010). A new coupon design for simultaneous analysis of in situ microbial biofilm formation and community structure in drinking water distribution systems.Appl. Microbiol. Biotechnol.87749–756. 10.1007/s00253-010-2510-x
19
DelplaI.JungA. V.BauresE.ClementM.ThomasO. (2009). Impacts of climate change on surface water quality in relation to drinking water production.Environ. Intern.351225–1233. 10.1016/j.envint.2009.07.001
20
DobrowskyP. H.KhanS.CloeteT. E.KhanW. (2016). Molecular detection of Acanthamoeba spp., Naegleria fowleri and Vermamoeba (Hartmannella) vermiformis as vectors for Legionella spp. in untreated and solar pasteurized harvested rainwater.Parasit. Vect.9:539. 10.1186/s13071-016-1829-2
21
DonnermairM. M.BlatchleyE. R. (2003). Disinfection efficacy of organic chloramines.Water Res.371557–1570. 10.1016/S0043-1354(02)00522-5
22
DoutereloI.FishK. E.BoxallJ. B. (2018). Succession of bacterial and fungal communities within biofilms of a chlorinated drinking water distribution system.Water Res.14174–85. 10.1016/j.watres.2018.04.058
23
DoutereloI.HusbandS.BoxallJ. B. (2014a). The bacteriological composition of biomass recovered by flushing an operational drinking water distribution system.Water Res.54100–114. 10.1016/j.watres.2014.01.049
24
DoutereloI.SharpeR.BoxallJ. (2014b). Bacterial community dynamics during the early stages of biofilm formation in a chlorinated experimental drinking water distribution system: implications for drinking water discolouration.J. Appl. Microbiol.117286–301. 10.1111/jam.12516
25
DoutereloI.JacksonM.SolomonC.BoxallJ. (2016). Microbial analysis of in situ biofilm formation in drinking water distribution systems: implications for monitoring and control of drinking water quality.Appl. Microbiol. Biotechnol.1003301–3311. 10.1007/s00253-015-7155-3
26
DoutereloI.SharpeR. L.BoxallJ. B. (2013). Influence of hydraulic regimes on bacterial community structure and composition in an experimental drinking water distribution system.Water Res.47503–516. 10.1016/j.watres.2012.09.053
27
DoutereloI.SharpeR. L.HusbandS.FishK. E.BoxallJ. B. (2019). Understanding microbial ecology to improve management of drinking water distribution systems.Wiley Interdiscipl. Rev. Water6:e01325. 10.1002/wat2.1325
28
FerrantiG.MarchesiI.FavaleM.BorellaP.BargelliniA. (2014). Aetiology, source and prevention of waterborne healthcare-associated infections: a review.J. Med. Microbiol.631247–1259. 10.1099/jmm.0.075713-0
29
FischerE. R.HansenB. T.NairV.HoytF. H.DorwardD. W. (2012). Scanning electron microscopy.Curr. Protoc. Microbiol.2:Unit2B.2-2B.2. 10.1002/9780471729259.mc02b02s25
30
FishK. E.BoxallJ. B. (2018). Biofilm microbiome (re)growth dynamics in drinking water distribution systems are impacted by chlorine concentration.Front. Microbiol.9:2519. 10.3389/fmicb.2018.02519
31
FishK. E.CollinsR.GreenN. H.SharpeR. L.DoutereloI.OsbornA. M.et al (2015). Characterisation of the physical composition and microbial community structure of biofilms within a model full-scale drinking water distribution system.PLoS One10:e0115824. 10.1371/journal.pone.0115824
32
FisherI.KastlG.SathasivanA. (2012). A suitable model of combined effects of temperature and initial condition on chlorine bulk decay in water distribution systems.Water Res.463293–3303. 10.1016/j.watres.2012.03.017
33
FlemmingH.-C. (2002). Biofouling in water systems – cases, causes and countermeasures.Appl. Microbiol. Biotechnol.59629–640. 10.1007/s00253-002-1066-9
34
FowlerJ.CohenL.JarvisP. (2013). Practical Statistics for Field Biology.New York, NY: John Wiley & Sons.
35
GulatiP.GhoshM. (2017). Biofilm forming ability of Sphingomonas paucimobilis isolated from community drinking water systems on plumbing materials used in water distribution.J. Water Health15942–954. 10.2166/wh.2017.294
36
HallamN.WestJ.ForsterC.SimmsJ. (2001). The potential for biofilm growth in water distribution systems.Water Res.354063–4071. 10.1016/S0043-1354(01)00248-2
37
HuaF.WestJ.BarkerR.ForsterC. (1999). Modelling of chlorine decay in municipal water supplies.Water Res.332735–2746. 10.1016/S0043-1354(98)00519-3
38
HusbandP. S.BoxallJ. B. (2011). Asset deterioration and discolouration in water distribution systems.Water Res.45113–124. 10.1016/J.WATRES.2010.08.021
39
HusbandP. S.BoxallJ. B.SaulA. J. (2008). Laboratory studies investigating the processes leading to discolouration in water distribution networks.Water Res.424309–4318. 10.1016/J.WATRES.2008.07.026
40
HusbandS.FishK. E.DoutereloI.BoxallJ. (2016). Linking discolouration modelling and biofilm behaviour within drinking water distribution systems.Water Sci. Technol. Water Supply16942–950. 10.2166/ws.2016.045
41
IrieY.BorleeB. R.O’ConnorJ. R.HillP. J.HarwoodC. S.WozniakD. J.et al (2012). Self-produced exopolysaccharide is a signal that stimulates biofilm formation in Pseudomonas aeruginosa.Proc. Natl. Acad. Sci. U.S.A.10920632–20636. 10.1073/pnas.1217993109
42
JohnsenA. R.HausnerM.SchnellA.WuertzS. (2000). Evaluation of fluorescently labeled lectins for noninvasive localization of extracellular polymeric substances in Sphingomonas biofilms.Appl. Environ. Microbiol.663487–3491. 10.1128/aem.66.8.3487-3491.2000
43
JoshiN. (2011). Sabre: a Barcode Demultiplexing and Trimming Tool for FastQ Files.San Francisco, CA: GitHub.
44
KalyuhznayaM. G.Martens-HabbenaW.WangT.HackettM.StolyarS. M.StahlD. A.et al (2009). Methylophilaceae link methanol oxidation to denitrification in freshwater lake sediment as suggested by stable isotope probing and pure culture analysis.Environ. Microbiol. Rep.1385–392. 10.1111/j.1758-2229.2009.00046.x
45
KaradirekI. E.KaraS.MuhammetogluA.MuhammetogluH.SoyupakS. (2016). Management of chlorine dosing rates in urban water distribution networks using online continuous monitoring and modeling.Urban Water J.13345–359. 10.1080/1573062X.2014.992916
46
KõljalgU.NilssonR. H.AbarenkovK.TedersooL.TaylorA. F. S.BahramM.et al (2013). Towards a unified paradigm for sequence-based identification of fungi.Mol. Ecol.225271–5277. 10.1111/mec.12481
47
KubistaM.AndradeJ. M.BengtssonM.ForootanA.JonákJ.LindK.et al (2006). The real-time polymerase chain reaction.Mol. Aspects Med.2795–125.
48
LiW.ZhangJ.WangF.QianL.ZhouY.QiW.et al (2018). Effect of disinfectant residual on the interaction between bacterial growth and assimilable organic carbon in a drinking water distribution system.Chemosphere202586–597. 10.1016/j.chemosphere.2018.03.056
49
LiuG.VerberkJ. Q. J. C.Van DijkJ. C. (2013). Bacteriology of drinking water distribution systems: an integral and multidimensional review.Appl. Microbiol. Biotechnol.979265–9276. 10.1007/s00253-013-5217-y
50
LiuL.XingX.HuC.WangH.LyuL. (2019). Effect of sequential UV/free chlorine disinfection on opportunistic pathogens and microbial community structure in simulated drinking water distribution systems.Chemosphere219971–980. 10.1016/j.chemosphere.2018.12.067
51
LiuS.GunawanC.BarraudN.RiceS. A.HarryE. J.AmalR. (2016). Understanding, monitoring, and controlling biofilm growth in drinking water distribution systems.Environ. Sci. Technol.508954–8976. 10.1021/acs.est.6b00835
52
MartinyA. C.AlbrechtsenH.-J.ArvinE.MolinS. (2005). Identification of bacteria in Biofilm and bulk water samples from a nonchlorinated model drinking water distribution system: detection of a large nitrite-oxidizing population associated with Nitrospira spp.Appl. Environ. Microbiol.718611–8617. 10.1128/AEM.71.12.8611-8617.2005
53
MesquitaE.JoãoM. R.MenaiaJ.KardinaalE.EikebrokkB.SmeetsP. (2013). Adapted Operation of Drinking Water Systems to Cope with Climate Change. Available online at: http://repositorio.lnec.pt:8080/jspui/handle/123456789/1006401(accessed August 28, 2020).
54
MiZ.DaiY.XieS.ChenC.ZhangX. (2015). Impact of disinfection on drinking water biofilm bacterial community.J. Environ. Sci.37200–205. 10.1016/J.JES.2015.04.008
55
MorrisE. K.CarusoT.BuscotF.FischerM.HancockC.MaierT. S.et al (2014). Choosing and using diversity indices: insights for ecological applications from the german biodiversity exploratories.Ecol. Evol.43514–3524. 10.1002/ece3.1155
56
Navarro-NoyaY. E.Suárez-ArriagaM. C.Rojas-ValdesA.Montoya-CiriacoN. M.Gómez-AcataS.Fernández-LuqueñoF.et al (2013). Pyrosequencing analysis of the bacterial community in drinking water wells.Microb. Ecol.6619–29. 10.1007/s00248-013-0222-3
57
NazariL.PattoriE.ManstrettaV.TerziV.MorciaC.SommaS.et al (2018). Effect of temperature on growth, wheat head infection, and nivalenol production by Fusarium poae.Food Microbiol.7683–90. 10.1016/J.FM.2018.04.015
58
NescereckaA.RubulisJ.VitalM.JuhnaT.HammesF. (2014). Biological instability in a chlorinated drinking water distribution network.PLoS One9:e096354. 10.1371/journal.pone.0096354
59
NeufeldJ. D.VohraJ.DumontM. G.LuedersT.ManefieldM.FriedrichM. W.et al (2007). DNA stable-isotope probing.Nat. Protoc.2860–866.
60
OksanenJ.BlanchetF. G.FriendlyM.KindtR.LegendreP.McGlinnD.et al (2019). vegan: Community Ecology Package. R Package Version 2.5-6.
61
Ortiz-VeraM. P.OlchanheskiL. R.da SilvaE. G.de LimaF. R.MartinezL. R.delP. R.et al (2018). Influence of water quality on diversity and composition of fungal communities in a tropical river.Sci. Rep.81–9. 10.1038/s41598-018-33162-y
62
PandeyP. K.KassP. H.SoupirM. L.BiswasS.SinghV. P. (2014). Contamination of water resources by pathogenic bacteria.AMB Express41–16. 10.1186/s13568-014-0051-x
63
QinK.StruewingI.DomingoJ. S.LytleD.LuJ. (2017). Opportunistic pathogens and microbial communities and their associations with sediment physical parameters in drinking water storage tank sediments.Pathogens6:54. 10.3390/pathogens6040054
64
QuastC.PruesseE.YilmazP.GerkenJ.SchweerT.YarzaP.et al (2013). The SILVA ribosomal RNA gene database project: improved data processing and web-based tools.Nucleic Acids Res.41D590–D596. 10.1093/nar/gks1219
65
R Core Team (2014). R: a Language and Environment for Statistical Computing. Version 3.1. 2 [Computer Program].Vienna: R Foundation for Statistical Computing.
66
RantanenP.-L.MellinI.Keinänen-ToivolaM. M.AhonenM.VahalaR. (2018). The seasonality of nitrite concentrations in a chloraminated drinking water distribution system.Intern. J. Environ. Res. Public Health15:1756. 10.3390/ijerph15081756
67
RenH.WangW.LiuY.LiuS.LouL.ChengD.et al (2015). Pyrosequencing analysis of bacterial communities in biofilms from different pipe materials in a city drinking water distribution system of East China.Appl. Microbiol. Biotechnol.9910713–10724. 10.1007/s00253-015-6885-6
68
RognesT.FlouriT.NicholsB.QuinceC.MahéF. (2016). VSEARCH: a versatile open source tool for metagenomics.PeerJ4:e2584. 10.7717/peerj.2584
69
RosalesE.Del OlmoG.Calero PreciadoC.DoutereloI. (2020). Phosphate dosing in drinking water distribution systems promotes changes in biofilm structure and functional genetic diversity.Front. Microbiol.11:599091. 10.3389/fmicb.2020.599091
70
SavH.RafatiH.ÖzY.Dalyan-CiloB.EnerB.MohammadiF.et al (2018). Biofilm formation and resistance to fungicides in clinically relevant members of the fungal genus Fusarium.J. Fungi4:16. 10.3390/jof4010016
71
SethA.BachmannR.BoxallJ.SaulA.EdyveanR. (2004). Characterisation of materials causing discolouration in potable water systems.Water Sci. Technol.4927–32. 10.2166/wst.2004.0080
72
SharpeR. L.SmithC. J.BoxallJ. B.BiggsC. A. (2010). “Pilot scale laboratory investigations into the impact of steady state conditioning flow on potable water discolouration,” in Proceedings of the 12th Annual Conference Water Distribution Systems Analysis, New York, NY.
73
SimõesL. C.SimõesM.VieiraM. J. (2007). Biofilm interactions between distinct bacterial genera isolated from drinking water.Appl. Environ. Microbiol.736192–6200. 10.1128/AEM.00837-07
74
SimõesL. C.SimõesM.VieiraM. J. (2010). Influence of the diversity of bacterial isolates from drinking water on resistance of biofilms to disinfection.Appl. Environ. Microbiol.766673–6679. 10.1128/AEM.00872-10
75
SloetjesH.WittenburgP. (2008). Annotation by Category - ELAN and ISO DCR, 816–820.
76
StanishL. F.HullN. M.RobertsonC. E.HarrisJ. K.StevensM. J.SpearJ. R.et al (2016). Factors Influencing bacterial diversity and community composition in municipal drinking waters in the Ohio River Basin, USA.PLoS One11:e0157966. 10.1371/journal.pone.0157966
77
SzewzykU.SzewzykR.ManzW.SchleiferK.-H. (2000). Microbiological safety of drinking water.Annu. Rev. Microbiol.5481–127. 10.1146/annurev.micro.54.1.81
78
TothE. M.VengringA.HomonnayZ. G.KekiZ.SproerC.BorsodiA. K.et al (2014). Phreatobacter oligotrophus gen. nov., sp. nov., an alphaproteobacterium isolated from ultrapure water of the water purification system of a power plant.Intern. J. Syst. Evol. Microbiol.64(Pt 3), 839–845. 10.1099/ijs.0.053843-0
79
TsagkariE.SloanW. T. (2019). Impact of Methylobacterium in the drinking water microbiome on removal of trihalomethanes.Inter. Biodeteriorat. Biodegrad.14110–16. 10.1016/j.ibiod.2018.07.015
80
van der WielenP. W. J. J.van der KooijD. (2013). Nontuberculous mycobacteria, fungi, and opportunistic pathogens in unchlorinated drinking water in The Netherlands.Appl. Environ. Microbiol.79825–834. 10.1128/AEM.02748-12
81
VreeburgI. J. H. G.BoxallD. J. B. (2007). Discolouration in potable water distribution systems: a review.Water Res.41519–529. 10.1016/j.watres.2006.09.028
82
WickhamH.ChanW. (2016). Rstudio (2016). Ggplot. R Package Version 2.21. Available online at: https://github.com/tidyverse/ggplot2(accessed October 28, 2020).
83
World Health Organization (WHO) (2006). Health Aspects of Plumbing.Geneva: World Health Organization.
84
World Health Organization (WHO) (2017). WHO Drinking Water Guideline.Geneva: World Health Organization.
85
ZhangM.LiuW.NieX.LiC.GuJ.ZhangC. (2012). Molecular analysis of bacterial communities in biofilms of a drinking water clearwell.Microb. Environ.27443–448. 10.1264/jsme2.ME12035
86
ZhouJ.BrunsM. A.TiedjeJ. M. (1996). DNA recovery from soils of diverse composition.Appl. Environ. Microbiol.62316–322.
87
ZhouX.AhmadJ. I.van der HoekJ. P.ZhangK. (2020). Thermal energy recovery from chlorinated drinking water distribution systems: effect on chlorine and microbial water and biofilm characteristics.Environ. Res.187:109655.
88
ZlatanovićL.van der HoekJ. P.VreeburgJ. H. G. (2017). An experimental study on the influence of water stagnation and temperature change on water quality in a full-scale domestic drinking water system.Water Res.123761–772. 10.1016/j.watres.2017.07.019
Summary
Keywords
biofilms, discolouration, bacteria-fungi, opportunistic pathogens, temperature
Citation
Calero Preciado C, Boxall J, Soria-Carrasco V, Martínez S and Douterelo I (2021) Implications of Climate Change: How Does Increased Water Temperature Influence Biofilm and Water Quality of Chlorinated Drinking Water Distribution Systems?. Front. Microbiol. 12:658927. doi: 10.3389/fmicb.2021.658927
Received
06 March 2021
Accepted
04 May 2021
Published
08 June 2021
Volume
12 - 2021
Edited by
Pascal E. Saikaly, King Abdullah University of Science and Technology, Saudi Arabia
Reviewed by
Nadia Farhat, King Abdullah University of Science and Technology, Saudi Arabia; Vicente Gomez-Alvarez, United States Environmental Protection Agency (EPA), United States
Updates
Copyright
© 2021 Calero Preciado, Boxall, Soria-Carrasco, Martínez and Douterelo.
This is an open-access article distributed under the terms of the Creative Commons Attribution License (CC BY). The use, distribution or reproduction in other forums is permitted, provided the original author(s) and the copyright owner(s) are credited and that the original publication in this journal is cited, in accordance with accepted academic practice. No use, distribution or reproduction is permitted which does not comply with these terms.
*Correspondence: Carolina Calero Preciado, c.calerop@gmail.com
This article was submitted to Microbiotechnology, a section of the journal Frontiers in Microbiology
Disclaimer
All claims expressed in this article are solely those of the authors and do not necessarily represent those of their affiliated organizations, or those of the publisher, the editors and the reviewers. Any product that may be evaluated in this article or claim that may be made by its manufacturer is not guaranteed or endorsed by the publisher.