 Marcin Nowicki1*†
 Denita Hadziabdic1†
 Robert N. Trigiano1†
 Sarah L. Boggess1
 Loukas Kanetis2Phillip A. Wadl3
 Peter S. Ojiambo4Marc A. Cubeta4
 Otmar Spring5
 Marco Thines6Fabian Runge7Brian E. Scheffler8
- 1Department of Entomology and Plant Pathology, University of Tennessee, Knoxville, Knoxville, TN, United States
- 2Department of Agricultural Sciences, Biotechnology & Food Science, Cyprus University of Technology, Limassol, Cyprus
- 3USDA-ARS, Vegetable Research, Charleston, SC, United States
- 4Department of Entomology and Plant Pathology, Center for Integrated Fungal Research, North Carolina State University, Raleigh, NC, United States
- 5Institute of Botany 210, University of Hohenheim, Stuttgart, Germany
- 6Department of Biological Sciences, Biodiversity and Climate Research Centre (BiK-F), Senckenberg Gesellschaft fuer Naturforschung and Evolution and Diversity, Institute of Ecology, Goethe University, Frankfurt am Main, Germany
- 7IDENTXX GmbH, Stuttgart, Germany
- 8U.S. Department of Agriculture, Agricultural Research Service, Stoneville, MS, United States
Downy mildews caused by obligate biotrophic oomycetes result in severe crop losses worldwide. Among these pathogens, Pseudoperonospora cubensis and P. humuli, two closely related oomycetes, adversely affect cucurbits and hop, respectively. Discordant hypotheses concerning their taxonomic relationships have been proposed based on host–pathogen interactions and specificity evidence and gene sequences of a few individuals, but population genetics evidence supporting these scenarios is missing. Furthermore, nuclear and mitochondrial regions of both pathogens have been analyzed using microsatellites and phylogenetically informative molecular markers, but extensive comparative population genetics research has not been done. Here, we genotyped 138 current and historical herbarium specimens of those two taxa using microsatellites (SSRs). Our goals were to assess genetic diversity and spatial distribution, to infer the evolutionary history of P. cubensis and P. humuli, and to visualize genome-scale organizational relationship between both pathogens. High genetic diversity, modest gene flow, and presence of population structure, particularly in P. cubensis, were observed. When tested for cross-amplification, 20 out of 27 P. cubensis-derived gSSRs cross-amplified DNA of P. humuli individuals, but few amplified DNA of downy mildew pathogens from related genera. Collectively, our analyses provided a definite argument for the hypothesis that both pathogens are distinct species, and suggested further speciation in the P. cubensis complex.
Introduction
Downy mildews caused by a group of obligate oomycete pathogens are responsible for severe crop losses in numerous hosts worldwide (Spring et al., 2018). Among the pathogens causing various downy mildews, Pseudopernospora cubensis (Berk. & M.A. Curt.) Rostov. and P. humuli (Miyabe & Takah.) G.W. Wilson that affect cucurbits and hop (Humulus lupulus L.), respectively, are particularly important owing to their considerable economic (Gent and Ocamb, 2009; Savory et al., 2011), financial, and environmental impacts related to crop protection (Reuveni et al., 1980; Gent et al., 2008). These impacts were exacerbated after the 2004 re-emergence of cucumber-invasive lineage of P. cubensis and its rapid spread in North America (Colucci, 2008; Holmes et al., 2015; Ojiambo et al., 2015; Spring et al., 2018).
Taxonomic descriptions of P. cubensis and P. humuli have been revised several times based on the emerging phytopathological, epidemiological, and molecular evidence (Choi et al., 2005; Savory et al., 2011). The 2005 controversy called for a reduction of both taxa to a single species based on morphological measurements and lack of polymorphisms in their ITS sequences (Choi et al., 2005). This claim has since been disregarded by the inclusion of additional nuclear and mitochondrial sequences (Mitchell et al., 2011; Runge and Thines, 2012), detection of cryptic species in P. cubensis (Runge et al., 2011), transcriptomic comparisons (Summers et al., 2015b), and robust phytopathological studies (Mitchell et al., 2011; Runge and Thines, 2012). An additional important argument against conspecificity is the difference in the sexual reproduction of both pathogens: heterothallism in P. cubensis (Cohen and Rubin, 2012) and homothallism in P. humuli (Gent et al., 2017). Several studies have discussed the critical need for a comparative molecular population-genetics approach to investigate and help settle this issue (Sarris et al., 2009; Mitchell et al., 2011; Runge and Thines, 2012; Kitner et al., 2015; Summers et al., 2015b).
To date, only three studies (Chee et al., 2006; Gent et al., 2019; Kitner et al., 2021) have analyzed the P. humuli diversity using a population genetics approach. Chee et al. (2006) suggested differences in the population structures and reproduction modes due to climate in Oregon and Washington, using the RAPD markers for genotyping on a local scale. Gent et al. (2019) used genotyping-by-sequencing of the 2010 and 2011 pathogen populations from those same U.S. states to discover limited genetic diversity in P. humuli, in line with repeated inbreeding in this homothallic oomycete. Kitner et al. (2021) tested cross-amplification of short sequence repeats (SSRs) developed for P. cubensis (Wallace and Quesada-Ocampo, 2017) on the P. humuli collected from Central Europe around the Alps. They also developed five SSRs that were more polymorphic than the other tested, suggesting higher genetic uniformity of P. humuli in Europe than in North America and prompting their hypothesis of the pathogen being introduced to Europe (Kitner et al., 2021). Comparatively, several molecular approaches were used for population biology of P. cubensis (Quesada-Ocampo et al., 2012; Polat et al., 2014; Kitner et al., 2015; Naegele et al., 2016; Thomas et al., 2017a; Wallace and Quesada-Ocampo, 2017). Intersimple sequence repeat (ISSR) and sequence-related amplified polymorphism (SRAP) markers used for the analyses of P. cubensis from Israel, Turkey, and Czech Republic indicated high diversity both among and within the regions, with the samples from Israel forming a distinct clade (Polat et al., 2014). This study suggested possible sexual reproduction of the pathogen in Israel, constituting the source of inoculum for the greater region (Polat et al., 2014). The global population of P. cubensis from five host species was analyzed by comparing the sequences of five nuclear and two mitochondrial regions (Quesada-Ocampo et al., 2012). As a result, the population structures by location and by host were evident, informing of pathogen variability and suggesting the development of customized control measures (Quesada-Ocampo et al., 2012). Sequencing of 12 molecular regions from the P. cubensis collected across the Czech Republic indicated temporal changes in pathogen, coinciding with its global resurgence (Kitner et al., 2015). Diversity of the 2011 P. cubensis collection from Michigan and Ontario was analyzed using nine SSRs and showed high population structure in space and variation in time, as well as differences by the host species (Naegele et al., 2016). Recently, transcriptomes of P. cubensis and Hyaloperonospora arabidopsidis (Gäum.) Göker, Riethm., Voglmayr, Weiß & Oberw. were screened for SSRs that were later confirmed in collections of P. cubensis and P. humuli. Eleven of such markers were polymorphic and showed that genetic diversity was higher in P. humuli than in P. cubensis (Wallace and Quesada-Ocampo, 2017). Finally, Wallace et al. (2020) genotyped the collection of 385 isolates of P. cubensis from six commercial and four wild cucurbits from North Carolina, using 10 SSRs. That study supported the existence of genetically distinct host-adapted clades in that pathogen, at the cucurbit species level (Quesada-Ocampo et al., 2012; Wallace et al., 2020).
Among the molecular tools commonly used by the modern population genetics, SSRs are still widely used, as they occur frequently in the genomic (gDNA; gSSRs), genic (RNA; eSSRs), and cytoplasmic parts of the genome (mitochondrial DNA and chloroplast DNA if present). They are multiallelic in character and exhibit relatively high mutation rates that allow the assessment of species diversity and inferences of their evolutionary past (Rubinsztein et al., 1995; Gobbin et al., 2003; Bhargava and Fuentes, 2010). This can help inform the related control measures for pathogens, pests, or other undesirable invasive species (Cornuet et al., 2014; Goss et al., 2014; Wu et al., 2016; Kim et al., 2019). Of note, our group previously reported gSSRs for P. cubensis (Kanetis et al., 2009). The gSSRs reported therein and other gSSRs developed at that time were used extensively in the present work.
In this study, we utilized previously developed gSSRs based on the gDNA of P. cubensis (Kanetis et al., 2009) to genotype a collection of gDNA from historical (herbarium specimens) and post-re-emergence samples of both P. cubensis and P. humuli pathogens. We hypothesized that both taxa did not belong to a single species and diverged recently. Our study goal was to test that hypothesis based on the following specific research objectives: (i) to identify distinctive features that separate the two taxa using population genetics tools—basic diversity analyses, (ii) to analyze the population structure in both taxa using Bayesian and multivariate tools, (iii) to infer the evolutionary history of both pathogens using the approximate Bayesian clustering and approximate computation, and (iv) to visualize the genome-scale organizational relationship between both pathogens utilizing comparative genomics analyses of the available draft genomes.
Materials and Methods
Pathogen Samples
A total of 138 samples of P. cubensis (n = 77) and P. humuli (n = 61) were included in this study (Table 1 and Supplementary Table 1). Samples of P. cubensis were obtained from at least eight various cucurbit hosts (two specimens were of unknown hosts), whereas the P. humuli samples were all obtained from hop (Supplementary Table 1). Samples of P. cubensis were subdivided into the following groups based on their geographic origin and time of collection: historical North American (“PcUSAh”; dated 1887 to 1935; n = 18), historical Old World (“PcEh”; Europe and South-East Asia; 1890 to 1955; n = 9), current North American (“PcUSAc”; North Carolina; 2008; n = 24), and current European (“PcEc”; 1998 to 2014; n = 28). Samples of P. humuli of the current European (“PhEc”; 2008 to 2010; n = 56) and historical origin (“PhEh; n = 3; Czech Republic 1940; Poland 1957; Argentina 1980) were also included. This constituted the “six-subpopulations” dataset used in the subsequent analyses. Historical samples were obtained by limited destructive sampling of downy mildew-symptomatic specimens from the following herbaria: New York Botanical Garden (NY), the Herbarium of the Plant Diseases Division of New Zealand (PDD), the Farlow Herbarium of the Harvard University (FH), the Mycological Herbarium of the Korea University (KUS-F), and the Herbarium of the University of Hohenheim (HOH) with respective permissions granted by our requests; “fresh” material was collected by Dr. Fabian Runge. gDNA of herbarium and “fresh” material was extracted using the Analytikjena Plant Kit as previously described (Telle and Thines, 2008).
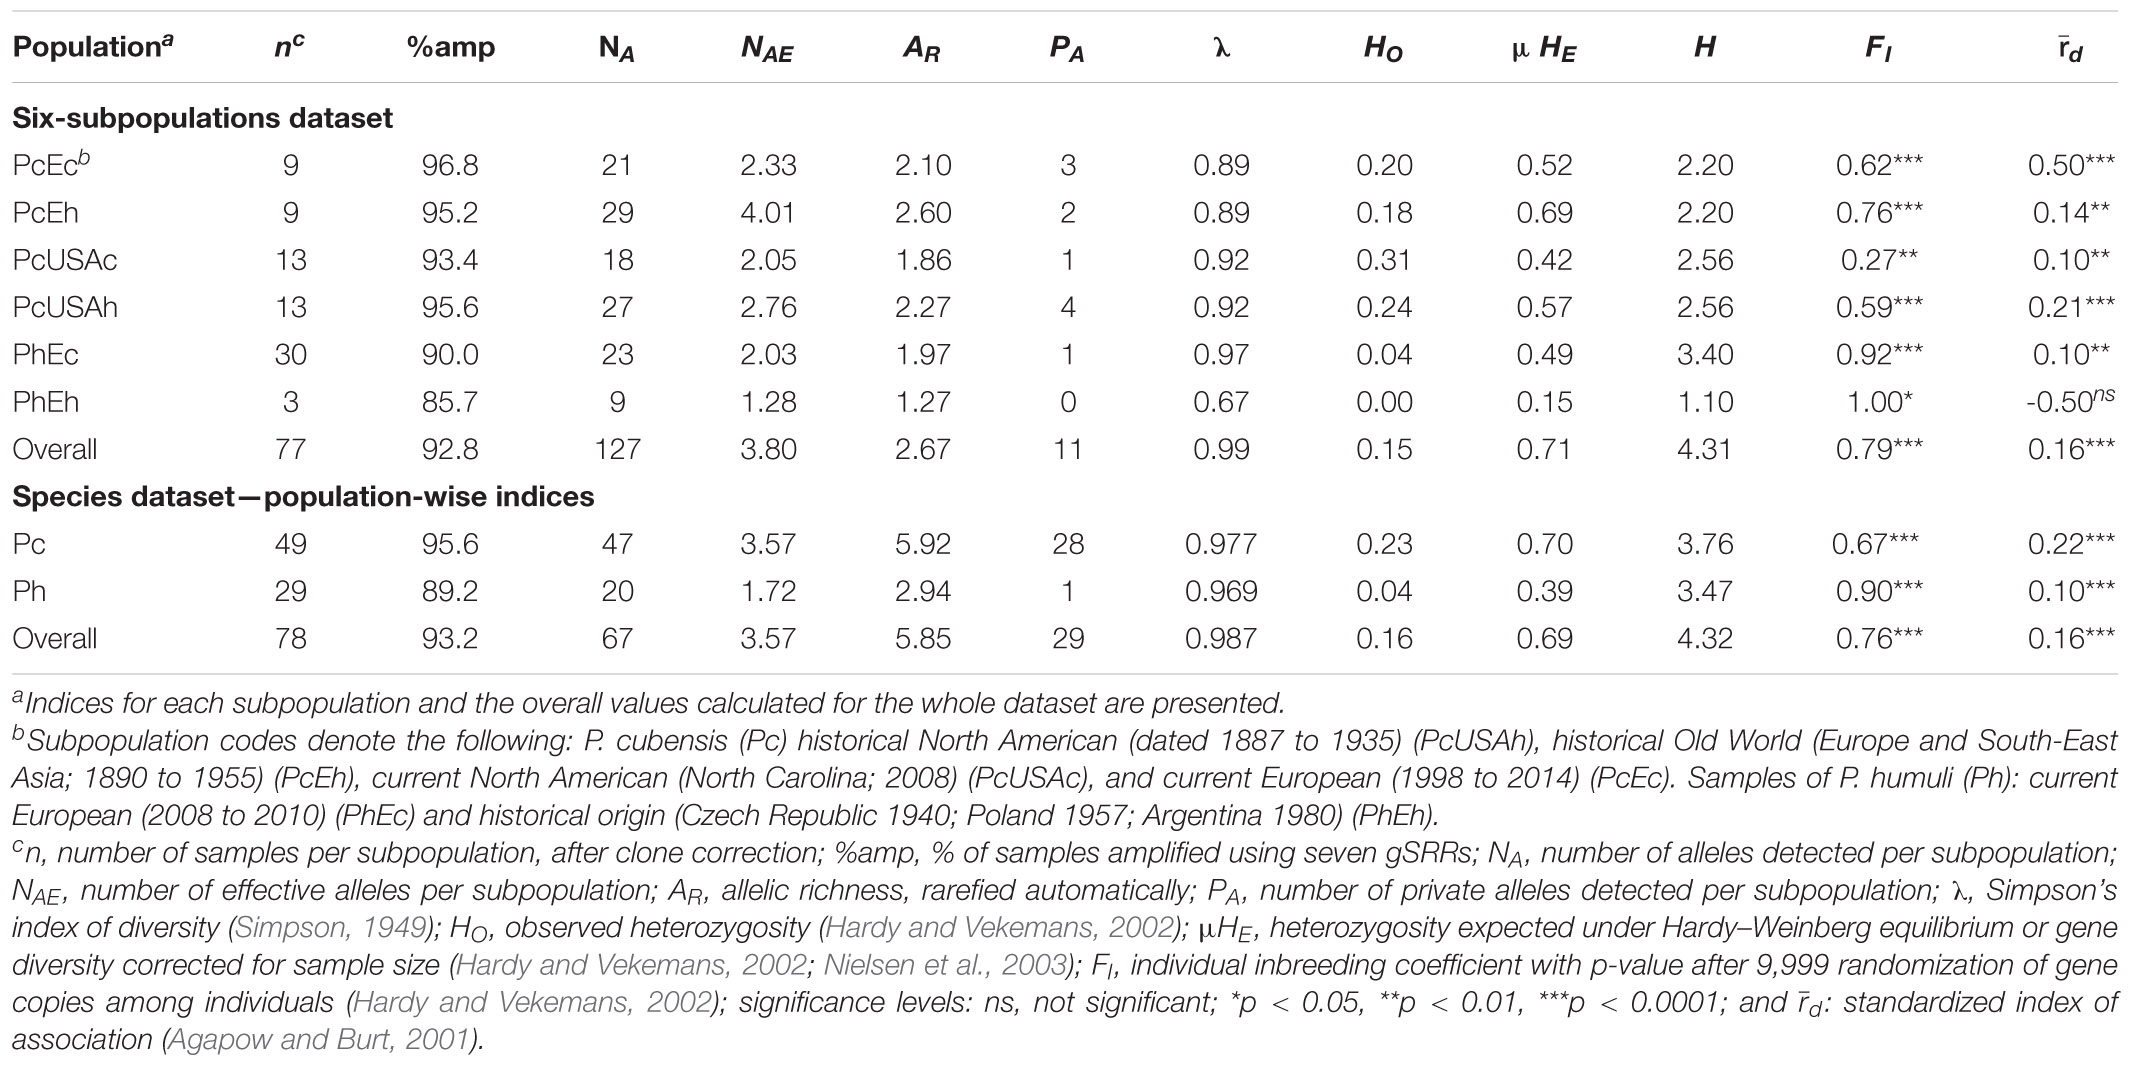
Table 1. Population genetics indices for the Pseudoperonospora cubensis and P. humuli collection genotyped using the genomic simple sequence repeats (gSSRs).
Development of gSSR Markers, Cross-Amplification of gSSRs, and Genotyping Conditions
SSR markers for P. cubensis were generated using enriched genomic libraries (Wang et al., 2007; Kanetis et al., 2009; Trigiano et al., 2012) on DNA sample NC01. Genomic locations of the gSSRs were established in the available P. cubensis and P. humuli draft genomes (Savory et al., 2012; Rahman et al., 2019) using NCBI BLAST Genomes service (Altschul et al., 1990). All redundant hits found with comparable reliability (coverage%, identity%, E-value), were recorded (Supplementary Table 2). In this study, 27 gSSRs were used to test cross-amplification across gDNA samples from samples of P. cubensis (n = 17), P. humuli (n = 6), P. humuli ex Humulus japonicus (n = 1), P. celtidis (n = 3), P. urticae (n = 3), P. cannabina (n = 2), Bremia lactucae (n = 2), and Benua kellermannii (n = 1) (Supplementary Table 2).
For population studies, the DNA samples of P. cubensis and P. humuli were genotyped with the following seven gSSRs—PC004, PC008, PC017, PC018, PC020, PC021, and PC027 (Table 2 and Supplementary Table 1)—using previously established modified protocols (Kanetis et al., 2009). Our modifications included touchdown cycling program (Korbie and Mattick, 2008) to avoid spurious amplification products: 94°C for 3 min; 15 cycles of 94°C for 40 s, 40 s initially at 63°C and subsequently decreasing 0.5°C per cycle, and 72°C for 30 s. The next 20 cycles consisted of 94°C for 40 s, 55°C for 40 s, and 72°C for 30 s, ending with 72°C for 4 min. The PCR mixture contained the following in the total volume of 10 μl: 2 ng of gDNA, 2 mM MgCl2, 2.5 mM dNTPs, 1 μM each primer, 1 μl DMSO, 1 × PCR buffer, and 1 U AmpliTaq Gold (Thermo Fisher Scientific, Inc., Waltham, MA, United States). Amplification products were visualized using the QIAxcel Advanced system (Qiagen, Valencia, CA, United States) according to the described conditions (Wang et al., 2009; Trigiano et al., 2012) and sized using the 15/600-bp alignment marker and 25- to 500-bp size marker (Qiagen). Loci that did not amplify after three consecutive reactions were considered missing data.
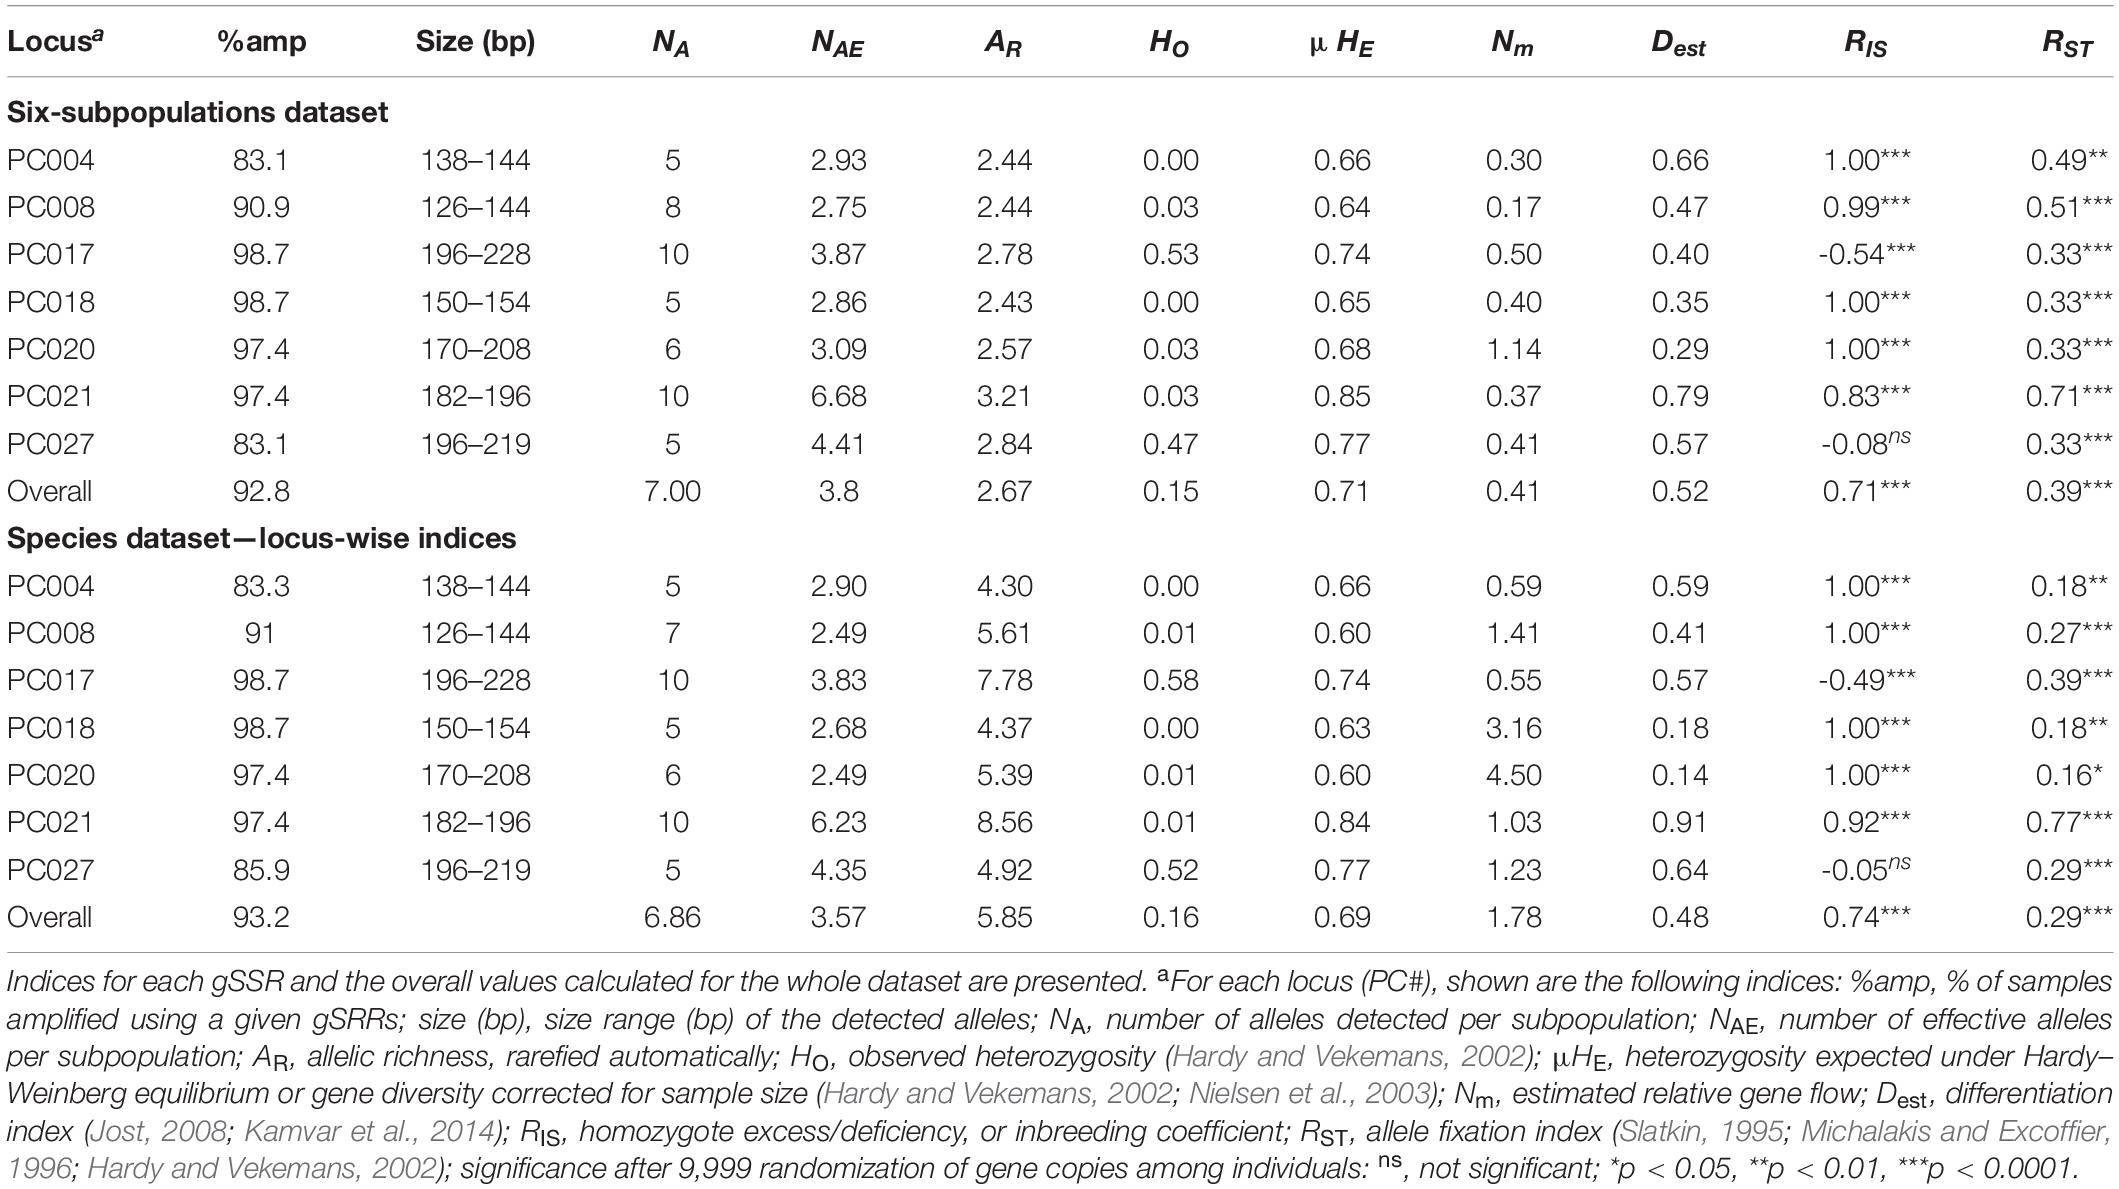
Table 2. Locus-wise indices for the Pseudoperonospora cubensis and P. humuli collection genotyped using the genomic simple sequence repeat markers (gSSRs).
Hierarchical Indices and Genetic Diversity Indices
Raw allele lengths were binned into statistically distinct allelic classes using MS Excel macro FLEXIBIN (Amos et al., 2007). It utilized an algorithm to group the alleles into statistically uniform categories using the repeat length information. The binned dataset was then transformed to repeat number using the PGDSpider version 2.1.1.5 (Lischer and Excoffier, 2012), and that dataset was used for all subsequent analyses. The binned “six-subpopulations” dataset was then clone-corrected using poppr version 2.8.3 (Kamvar et al., 2014) in R version 3.6.1 (R Core Team, 2017), and the identical multilocus genotypes (MLGs) at the subpopulation level were removed to avoid biasing the analyses toward clonality. All subsequent analyses were completed using the clone-corrected data. The following standard indices were calculated: number of alleles and number of effective alleles observed at each locus or subpopulation (NA and NAE; SPAGeDi version 1.5d; Hardy and Vekemans, 2002), allelic richness for populations or across tested loci (AR; rarefied as estimated automatically by SPAGeDi), private alleles (PA; calculated using GenAlEx version 6.5.1; Peakall and Smouse, 2012), observed heterozygosity (HO; by SPAGeDi), heterozygosity expected under Hardy–Weinberg equilibrium by SPAGeDi (μHE; gene diversity corrected for sample size; Nielsen et al., 2003) both in population- and locus-wise manner, λ (Simpson’s index of diversity; Simpson, 1949) calculated using poppr, H (Shannon–Wiener index of MLG diversity; Shannon, 1948) calculated using poppr, and d [standardized index of association (Agapow and Burt, 2001) calculated using poppr]. Fixation indices statistics were calculated using SPAGeDi: FI (individual inbreeding coefficient with p-value after 9,999 randomization of gene copies among individuals by SPAGeDi), inbreeding coefficients (FIS, RIS) and allele fixation indices by SPAGeDi (FST, RST, with significance after 9,999 randomization of gene copies among individuals (Slatkin, 1995; Michalakis and Excoffier, 1996), differentiation index (Dest; poppr; Jost, 2008), and estimated gene flow (Nm; GenAlEx). Genotype accumulation curve, departures from Hardy–Weinberg equilibrium, pairwise linkage disequilibrium, and population-wise Prevosti distance matrix (Prevosti, 1974) and its reticulation were calculated using packages poppr, hierfstat version 0.04-22 (Goudet, 2005), and ape version 5.3 (Paradis and Schliep, 2019) with default settings. Comparative data subdivision to separate the P. cubensis (Pc) and P. humuli (Ph) samples (“species” dataset) was also submitted to such analyses and the results are presented in Tables 1, 2.
The hierarchical partitioning of genetic variation of P. cubensis and P. humuli populations was analyzed using analysis of molecular variance (AMOVA) as implemented in poppr; p-values were obtained after 999 permutations. AMOVA partitions the total variance into hierarchical components (among groups, among individuals within groups, and within individuals). Three independent analyses were performed using (i) the “six-subpopulations” dataset, (ii) the “species” dataset, and (iii) the “host” dataset with subdivision by the affected host plants.
Population Structure
Isolation-by-distance (IBD) was calculated using Mantel (r) and partial Mantel tests (r′; standardized by year of sampling), as implemented in R packages MASS version 7.3-51.4 (Ripley et al., 2013), ade4 (Dray and Dufour, 2007), and vegan version 2.5-6 (Oksanen et al., 2013). The algorithm calculated the correlation of pairwise matrices of genetic and geographic distances among genotyped samples for either species. The same software calculated and plotted the correlograms of Mantel’s r across distance classes. Significance of the regression slope between genetic and logarithm of the geographical distances was assessed by 999 permutations.
Bayesian clustering method was applied to infer the number of the genetic clusters among P. cubensis and P. humuli samples using STRUCTURE version 2.3.3 (Pritchard et al., 2000; Hubisz et al., 2009). The analyses used 30 independent Monte Carlo Markov chains (MCMC) for each k value between one and six, with a burn-in period of 250,000 steps and 750,000 steps of the actual run, using an admixture model with correlated allele frequencies (assuming no prior information of subpopulation origin). Then, the Evanno method as implemented in the PopHelper version 1.0.10 was used to estimate the number of clusters using the ad hoc statistic Δk (Evanno et al., 2005; Earl and vonHoldt, 2011; Francis, 2017). Post-hoc analysis using ObStruct version 1.0 (Gayevskiy et al., 2014) was used to analyze the overall fit of the predefined groups with the ancestry profiles inferred using STRUCTURE and to assess the contributions of each preattributed subpopulation and each inferred cluster. The program uses the R2 statistics that ranges from 0 (recent divergence or abundance of migration/admixture among subpopulations) to 1 (complete divergence and/or population structure). Three independent analyses used the “six-subpopulations,” “species,” and “host” datasets.
Model-free multivariate clustering analysis of the MLGs was carried out using the discriminant analysis of the principal components (DAPC; Jombart et al., 2010). The model was cross-checked and optimized using 1,000 permutations of the dataset across principal components used from 2 to 48. Pairwise population distance matrix (Prevosti, 1974) was reticulated and rooted using the OUTGROUP (Supplementary Table 1) with the neighbor-joining algorithm implemented in poppr using the “six-subpopulations” and “host” datasets.
Demographic Analyses and Evolutionary History
To investigate for an occurrence of a recent population bottleneck, Bottleneck version 1.2.02 (Cornuet and Luikart, 1996) was utilized. The settings included two mutation modes that apply to SSRs [stepwise-mutation model (SMM) and two-phase mutational model (TPM) with 95% SMM]. Variance of the geometric distribution for TPM was set at 12. Both models used 10,000 iterations for all three basic tests: sign test, standardized differences test, and Wilcoxon sign rank test, to infer the mode shift indicative of recent demographic changes in the tested groups. Populations without a signature of a recent bottleneck followed the standard L-shaped distribution of allele frequencies as expected under mutation-drift equilibrium (Piry et al., 1999) based on the overall outcome of all three basic tests; detailed results of each test provide more insights for the observed bottleneck/population expansion. For this investigation, two independent analyses were performed (i) using the “three-subpopulations” dataset (North American P. cubensis, European P. cubensis, and European P. humuli) and (ii) the “species” dataset. The three-group split was used to increase the counts of individuals per subpopulation as required by Bottleneck and because the P. cubensis historical specimens showed alleles not detected in the respective current populations.
Evolutionary history of the species was investigated using the approximate Bayesian computation using the DIYABC version 2.1 (Cornuet et al., 2014). The focus of these analyses was on inferring the evolutionary relationships among both Pseudoperonospora species in relation to other downy mildew pathogens genotyped using the same seven gSSRs (Supplementary Tables 1, 2). The initial run established the limits of the input indices (population sizes, mutation rates) and used the entire dataset as one population, with the parameters stretched one order of magnitude beyond those defaulted by the program. The subsequent full DIYABC analyses were only run using the precalculated 95% confidence interval (95% CI) values for those indices using the “species” dataset (outgroup, Pc, Ph) and the “three-subpopulations” dataset (outgroup, Pc from Europe, Pc from United States, Ph). Detailed description of these analyses is presented in Supplementary File 1.
Sequencing of Microsatellite Loci and Sequence Analyses
Multiple sequence comparison was performed to determine possible differences between both Pseudoperonospora species. Six gSSRs were amplified for P. cubensis (n = 17) and P. humuli samples (n = 5) using primer pairs for PC001, PC005, PC006, PC0012, PC018, and PC021 (Supplementary Table 2) according to the aforementioned protocol. PCR products were visualized on QIAxcel Advanced system as described above and ligated into pBluescript KS (−), transformed into Escherichia coli TOP10, and selected on LB medium supplemented with ampicillin and X-gal. The extracted plasmid DNA samples were submitted for Sanger sequencing using M13F and T3 primers (USDA-ARS, Stoneville, MS, United States) to generate consensus sequences for each locus and each sample, respectively. Owing to limited amounts of DNA in the pathogen collection, only a limited number of individuals were used for this analysis.
The consensus sequences for the six gSSR loci from the analyzed specimens were generated using Sequencher version 5.0.0 (Gene Codes Corporation, 2010), inspected, and manually corrected at the lower-quality termini (Supplementary Tables 2, 7). Sequence matrix for each locus was aligned separately using MAFFT version 7.0 (Katoh and Standley, 2013; Katoh et al., 2017) using default mode and settings and visualized using BioEdit version 7.0.5.3 (Hall, 1999). The sequence matrix was then manually concatenated in Microsoft Excel 2016. Identical sequences were removed before the downstream analysis, to avoid clonality bias. The concatenated sequence matrix was then analyzed using the maximum likelihood (ML) algorithm with thorough bootstrap, as implemented in raxmlGUI version 1.5 (Silvestro and Michalak, 2012; Stamatakis, 2014), with 100 repetitions and a bootstrap of 10,000. The RAxML used the ML algorithm with the molecular substitution matrix of GTR and the rapid hill-climbing mode. The results were visualized using FigTree version 1.4.3 (Rambaut, 2017).
To further assess the differences among both pathogens, the DIYABC analysis was implemented using the sequence matrix generated on six gSSRs amplified across 22 DNA samples from both species, as the aligned results presented consistent differences between the pathogens. Detailed description of this analytical algorithm is in Supplementary File 1.
Comparative Genomics Analysis
To evaluate genome-scale differences between both pathogens, the publicly available draft genome assemblies of both Pseudoperonospora species were used (GenBank# for genome of P. cubensis: AHJF00000000.1; of P. humuli: NQFO00000000.1; Savory et al., 2012; Rahman et al., 2019). We used D-GENIES with Minimap version 2.0 (Cabanettes and Klopp, 2018) for the syntenic comparison of both Pseudoperonospora draft genomes. Additionally, physical variants between both draft genomic assemblies were also investigated with NUCMER (genomic DNA) and PROMER (six-frame translation) as implemented in MUMmer version 3.23 (Kurtz et al., 2004) and visualized using Assemblytics (Nattestad and Schatz, 2016), with the default settings except for “unique sequence length required” set at 1,000 for both genomic and translated genomic runs.
Results
SSR Cross-Amplification
Molecular similarity between P. cubensis and P. humuli was analyzed using the 27 gSSRs developed for the former species. From 27 selected gSSRs, 23 successfully amplified the P. cubensis samples, 20 gSSRs amplified the randomly selected representative samples of P. humuli, modest amplification to other Pseudoperonospora species was noted, and only four gSSRs (PC004, PC005, PC012, PC027) cross-amplified to related genera (Supplementary Tables 1, 2). Two of the latter SSRs shared similarity with critical metabolically active genes: PC005 with cytochrome c oxidase and PC012 with NADH dehydrogenase (Supplementary Table 2; BLAST refseq_rna, results not shown). Size ranges of the alleles detected using capillary electrophoresis were similar for both species of focus and well within the size range expected by the cloned fragments. Several gSSR sequences were not found in the inspected genomic assemblies despite cloning from the P. cubensis gDNA and successful amplification using DNA samples from both species (Supplementary Tables 1, 2).
Population Genetics Analyses
Genetic Diversity, F-Statistics, and AMOVA
From the original collection of 138 DNA samples that were amplified using seven gSSRs (77 of P. cubensis, 61 of P. humuli), clone correction resulted in the removal of 62 clonal MLGs (Table 1) leaving 42 unique MLGs of P. cubensis and 34 of P. humuli for analyses. The seven gSSRs amplified an average of 93% (ranging from 83 to 99%) of the tested samples (Tables 1, 2 and Supplementary Table 1). About 21 alleles were detected per subpopulation (ranging from 9 to 27; Table 1). Private alleles were observed in all subpopulations except historical P. humuli from Europe. The overall allelic richness was 2.67 (1.27 to 2.60; Table 1). Both current subpopulations of P. cubensis from Europe and North America showed strong evidence for linkage disequilibrium, driving the overall linkage disequilibrium toward clonality (d different from 0, p < 0.001; Table 1). The fixation indices suggested existence of population structure (overall HO < HE; Tables 1, 2), with ample allele fixation (overall RST of 0.39) and very high genetic differentiation (Dest of 0.52). Inbreeding was also evident for subpopulations of both pathogens, with the overall FI of 0.79 (Table 1). This, together with limited overall gene flow (Nm of 0.41 or 1.05; Table 2), suggests the clonal character of both pathogens. When data were partitioned based on two tested species, P. cubensis and P. humuli, our results showed similar patterns (Tables 1, 2).
The genotype accumulation curve indicated that the gSSRs performed well in accruing the diversity information from our collection, but roughly half of the MLGs were discarded due to clonality, and caused the lack of plateau in the curve. The remaining MLG pool was saturated with six gSSRs, irrespective of the dataset subdivision (Supplementary Figure 1). Deviations from Hardy–Weinberg equilibrium (HWE) were comparatively more frequent in the “species” dataset, but in the “six-subpopulations” dataset, PC027 and the smallest group PhEh showed the fewest HWE deviations (Supplementary Figure 2). This pattern was also reflected in the linkage disequilibrium d values for both datasets (Table 1). Finally, the pairwise d investigation among the seven used gSSRs indicated their low genetic linkage, implying the markers were dispersed across the P. cubensis genome (Supplementary Figure 3 and Supplementary Table 2). Permutation of the RST and comparison with the FST values (not shown) revealed that mutation was the major force in the observed differentiation, regardless of whether the analyses were run on the “six-subpopulations” or “species” dataset (p < 0.05 and p < 0.01, respectively; data not shown).
AMOVA indicated only minor differences in the variance partitioning depending on the dataset subdivision (Supplementary Table 3): change in partitioning the variance was evident among the subpopulations and among individuals. All three datasets congruently attributed the majority of variation to the individuals-within-subpopulations level, whereas the “six-subpopulations” dataset indicated a much stronger signal for separation among the subpopulations. This strongly implied the existence of population structure within the genotyped collection of P. cubensis and P. humuli, irrespective of the hierarchical organization of the datasets.
SSR Population Structure
Results of the isolation-by-distance tests (Mantel and partial Mantel) showed clear differences between P. cubensis and P. humuli groups. For the Mantel test, a significant correlation (p < 0.001) between geographical and genetic distances was evidenced, with about 13% of variance explained by geographical spread. When standardized by sampling year (partial Mantel test), this score was improved to about 14% of total variance (p < 0.001), indicating the minor temporal variability of P. cubensis over 127 years (1887 to 2014; Supplementary Table 1 and Supplementary Figure 4A). Furthermore, Mantel’s r scores were significant across the geographical classes, evidencing strong spatial impact on the population structure, with notable amplitude of Mantel score range and patches of (dis)similarity (Supplementary Figure 4B; vertical axis). In contrast, the results for P. humuli provided no such evidence, neither in raw data format, nor when standardized by the year of sampling (Supplementary Figures 4C,D), possibly reflecting the comparatively narrower geographic and temporal distribution in the collection.
Results of the Bayesian clustering analysis differed only slightly, depending on the dataset subdivision applied (i.e., “six-subpopulations,” “species,” or “host” datasets). This analysis provided congruent evidence for existence of four genetically distinct clusters within our collection (Figure 1). Samples of P. humuli were distinct from the P. cubensis group and formed a homogeneous separate cluster regardless of the input dataset. Comparatively, P. cubensis was comprised of two or three inferred clusters, depending on the dataset used. More specifically, the North American samples showed clear clustering distinction between the current and historical samples. Comparatively, the historical European samples were strongly admixed, implying an intensive gene flow between the continents (Figure 1B). The STRUCTURE results were then analyzed using ObStruct for additional insights of the accrued ancestry profiles (Supplementary Table 4). The highest R2 statistic value across the 30 used MCMC was calculated for the “six-subpopulations” dataset (0.91; p < 0.0001; Figure 1B), indicating strong divergence among the predefined subpopulations and population structure within the dataset. The lowest R2 was for the “species” dataset (0.43; p < 0.0001; Figure 1A), indicating their recent divergence. Only minor changes in the R2 values were observed for the “six-subpopulations” dataset when the preattributed populations or the inferred clusters were removed sequentially, which suggests that this dataset subdivision showed the best agreement with the inferred genetic clusters. In contrast, when analyzing the “host” dataset, removal of the Cucumis sativus subpopulation increased the R2 index value substantially, and removal of H. lupulus subpopulation decreased it the most. This indicated that those two groups carried the most variation and the strongest signal for population structure, respectively (Supplementary Table 4 and Figure 1C).
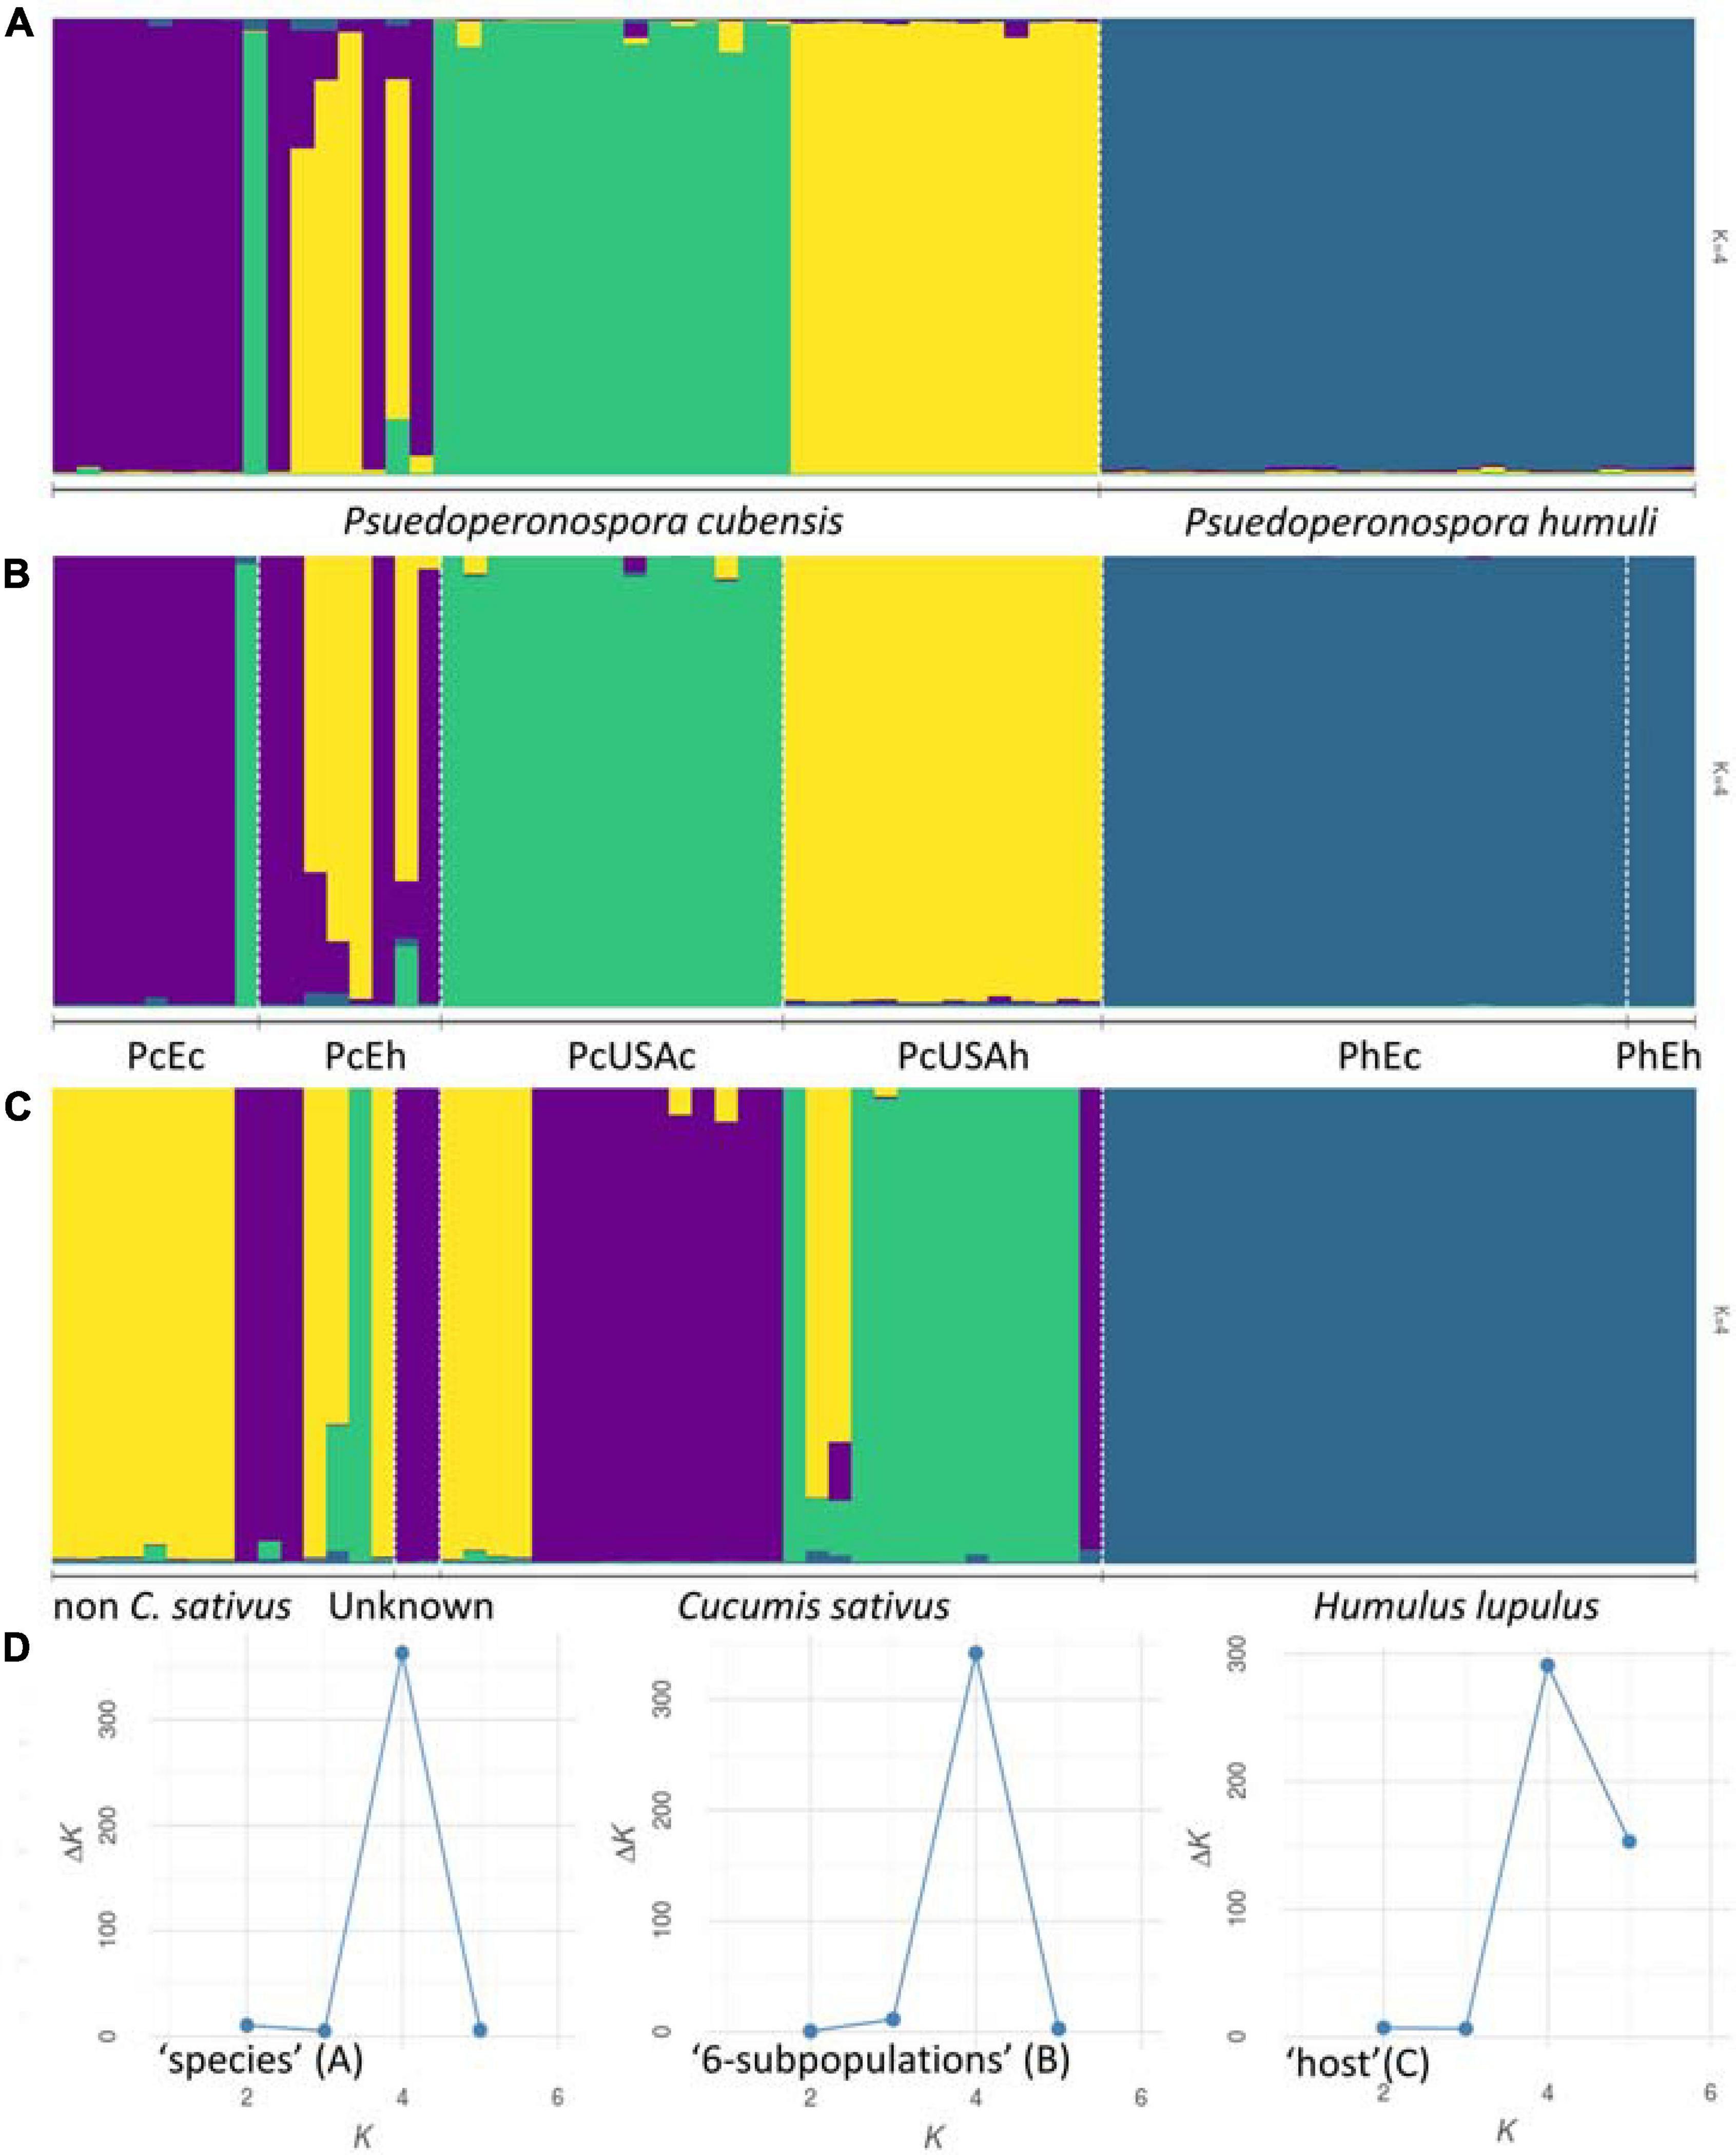
Figure 1. Population structure inferred using STRUCTURE. Genotyped dataset was split either by the preattributed species (A), six groups that reflected the sample geographic origin and age [(B) Pseudoperonospora cubensis: historical North American (“PcUSAh”), historical Old World (“PcEh”; Europe and South-East Asia), current North American (“PcUSAc”), current European (“PcEc”); P. humuli: current European (“PhEc”) and historical origin (“PhEh”)], or the affected host plants (C). The results were visualized using the most supported number of inferred genetic clusters (D) as per the Evanno method (Evanno et al., 2005).
Multivariate DAPC (Figure 2) provided additional support to the STRUCTURE results and resulted in similar patterns. In the “six-subpopulations” dataset, the taxa separation was evident. The current and historical samples of P. humuli grouped together in this analysis, indicating no major genetic changes in this homothallic pathogen. A comparatively more complex structure was evidenced for the P. cubensis samples (Figure 2). Here, the European samples and the historical North American samples were placed close to one another, but the current North American samples were distinctly separated from the bulk of P. cubensis samples. This result was also confirmed by the dendrogram of subpopulation pairwise genetic distance matrix (Figure 2) and further suggested that the current European samples of both taxa may be direct descendants of the respective historical samples by the feature of small genetic distances. The same analysis placed the historical North American P. cubensis samples generally close to the bulk of the remaining ones but underlined the separation of the current North American P. cubensis subpopulation.
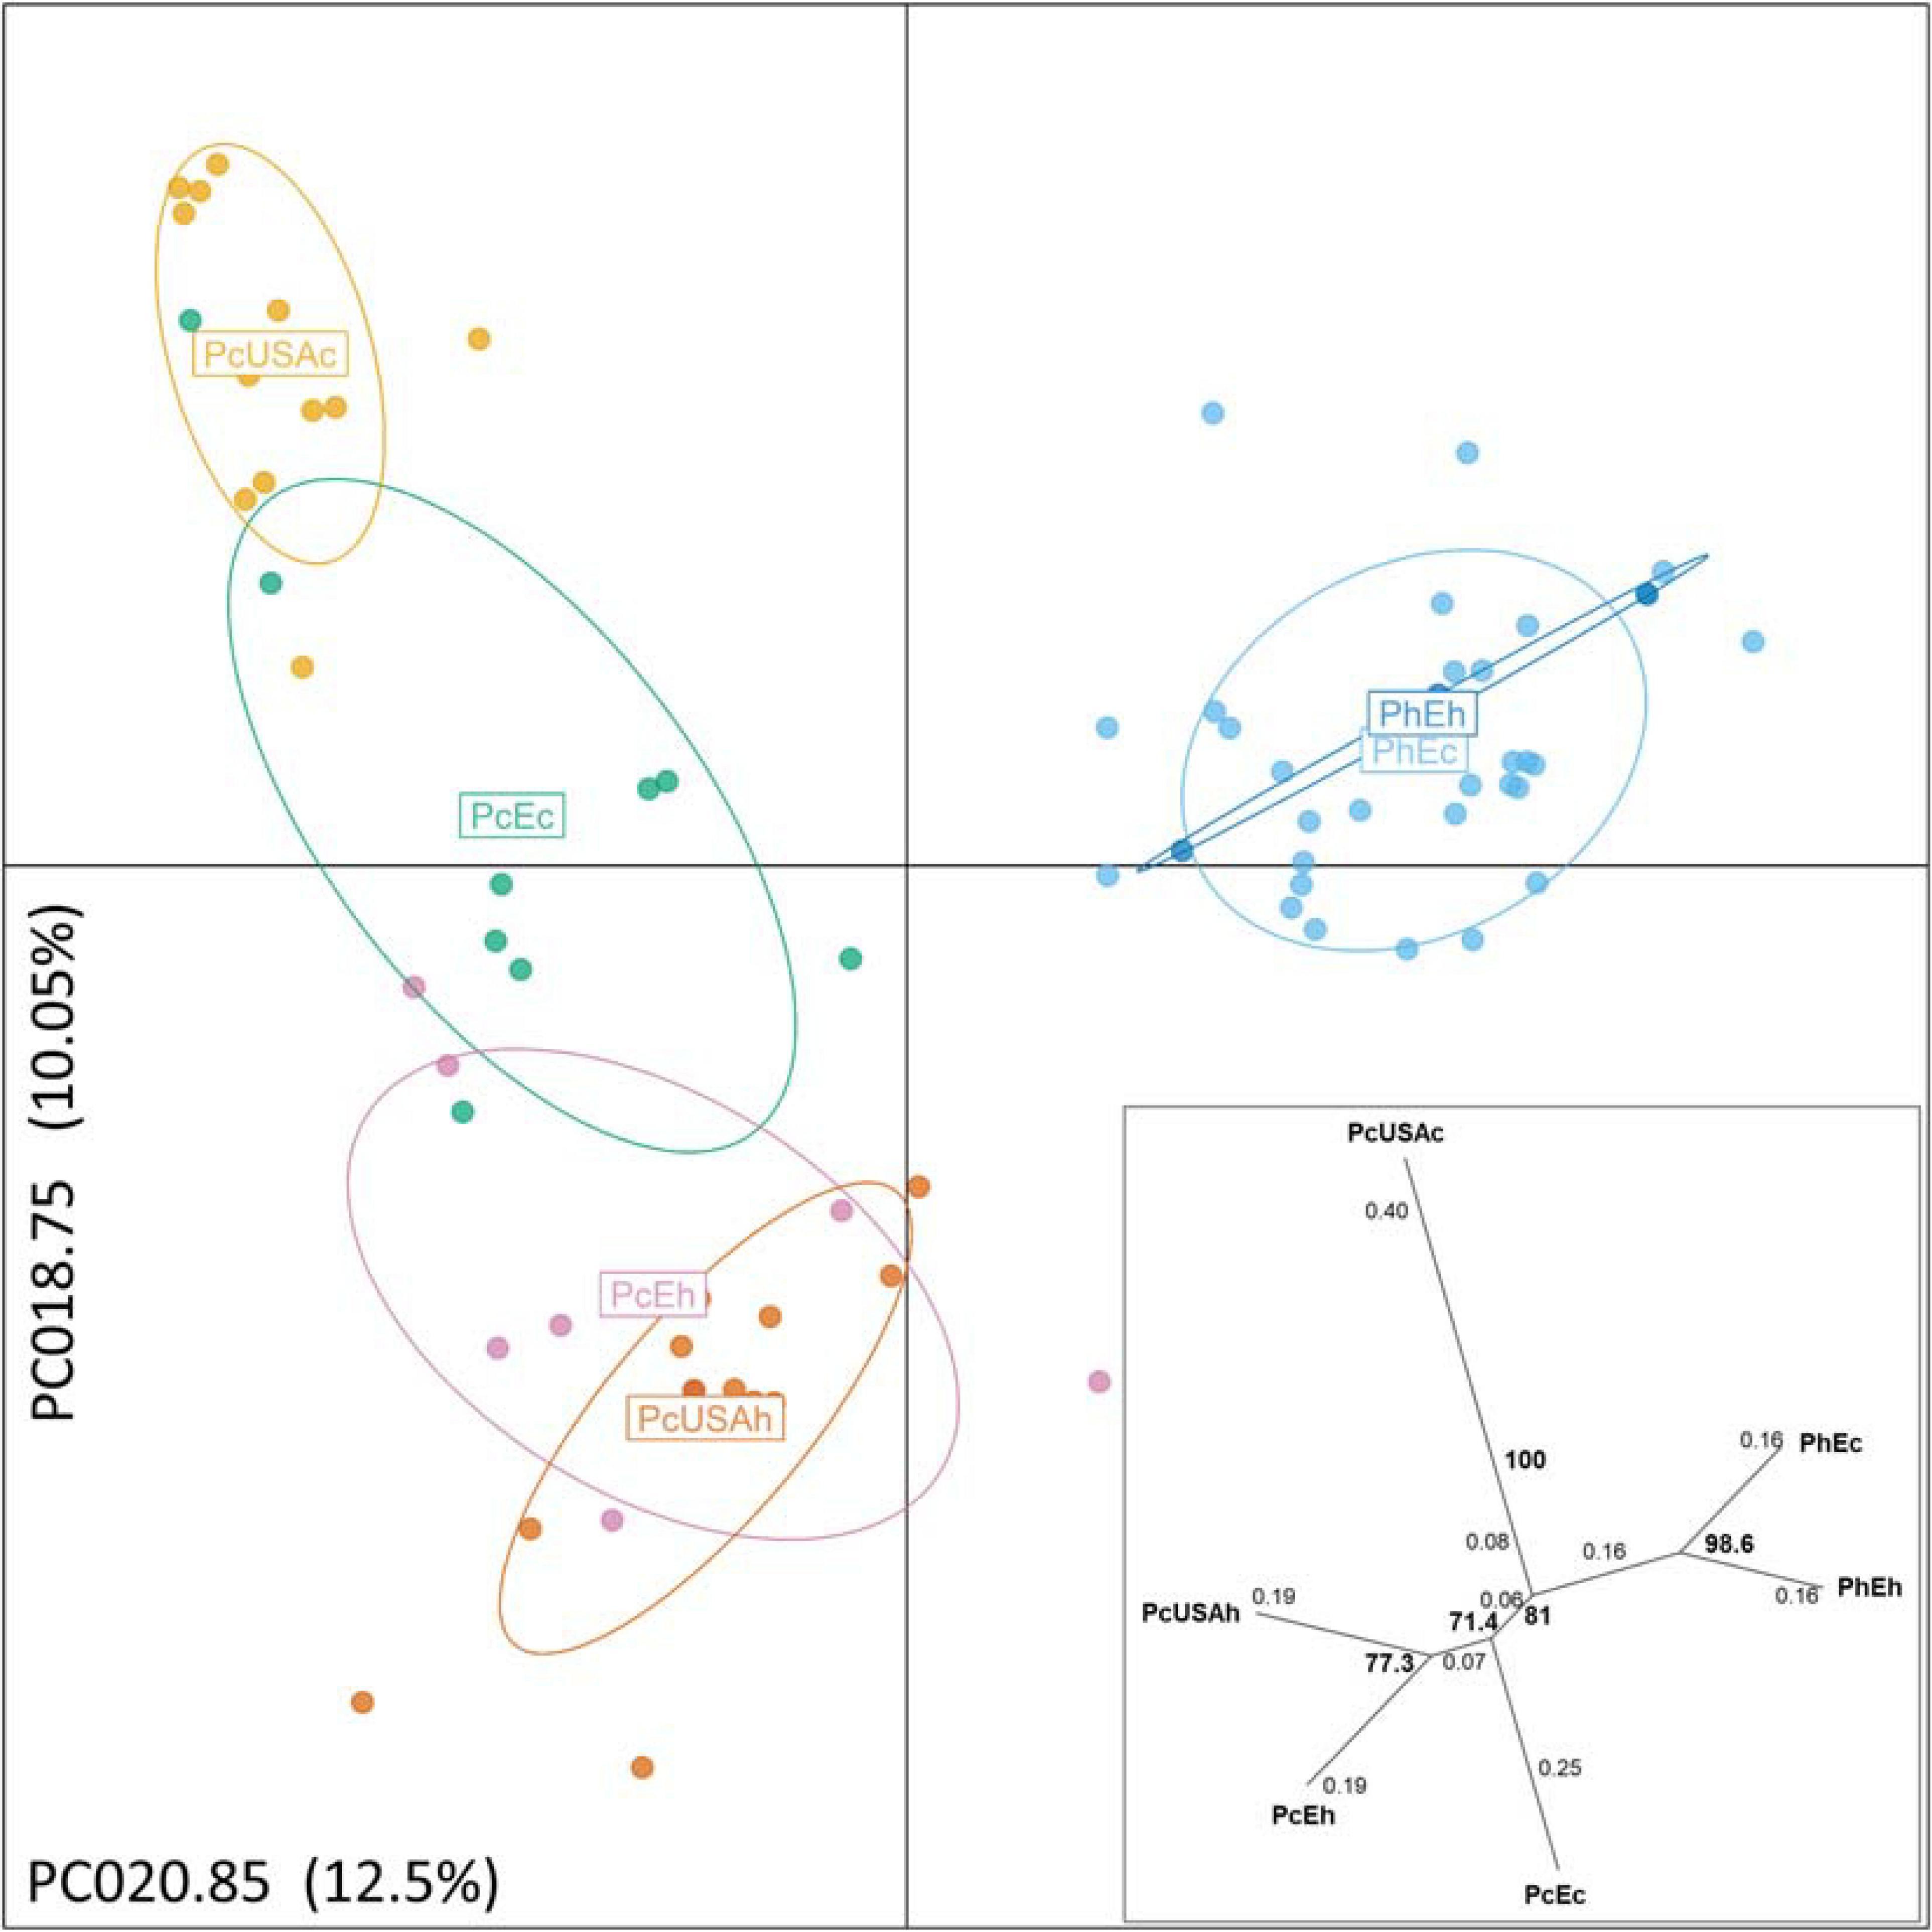
Figure 2. Discriminant analysis of principal components of the genotyped Pseudoperonospora cubensis and P. humuli separates the taxa and visualizes the substructure within. The pathogen groups are coded the same way as in Figure 1. The analysis was optimized by 1,000 permutations of the dataset across principal components analyzed from 2 to 48 toward the principal components used for the projection (PCA = 20). Two alleles contributing the most and used for the projection are identified along the respective axes, with % of total variance explained also indicated. Insert: pairwise population genetic distances (Prevosti, 1974) are reticulated with distances between each split indicated on the branches, and bootstrap support for the splits > 70% is indicated in bold, based on 1,000 permutations of the dataset.
The recorded information about the affected host plant species was also evaluated. Here, the relationship among nine groups of host plants was investigated (Figure 3), deriving from 70 clone-corrected MLGs. This analysis placed the C. sativus-based P. cubensis clade as the earliest and indicated divergence of the taxa and great genetic distance from the remaining samples of non-C. sativus P. cubensis. This bulk of non-C. sativus samples showed comparatively much smaller genetic distances from one another, suggesting recent or ongoing divergence within P. cubensis. Of note, the samples with unknown hosts were in the “C. sativus” group. These results agree with the Bayesian inference using STRUCTURE on the same dataset (Figure 1C).
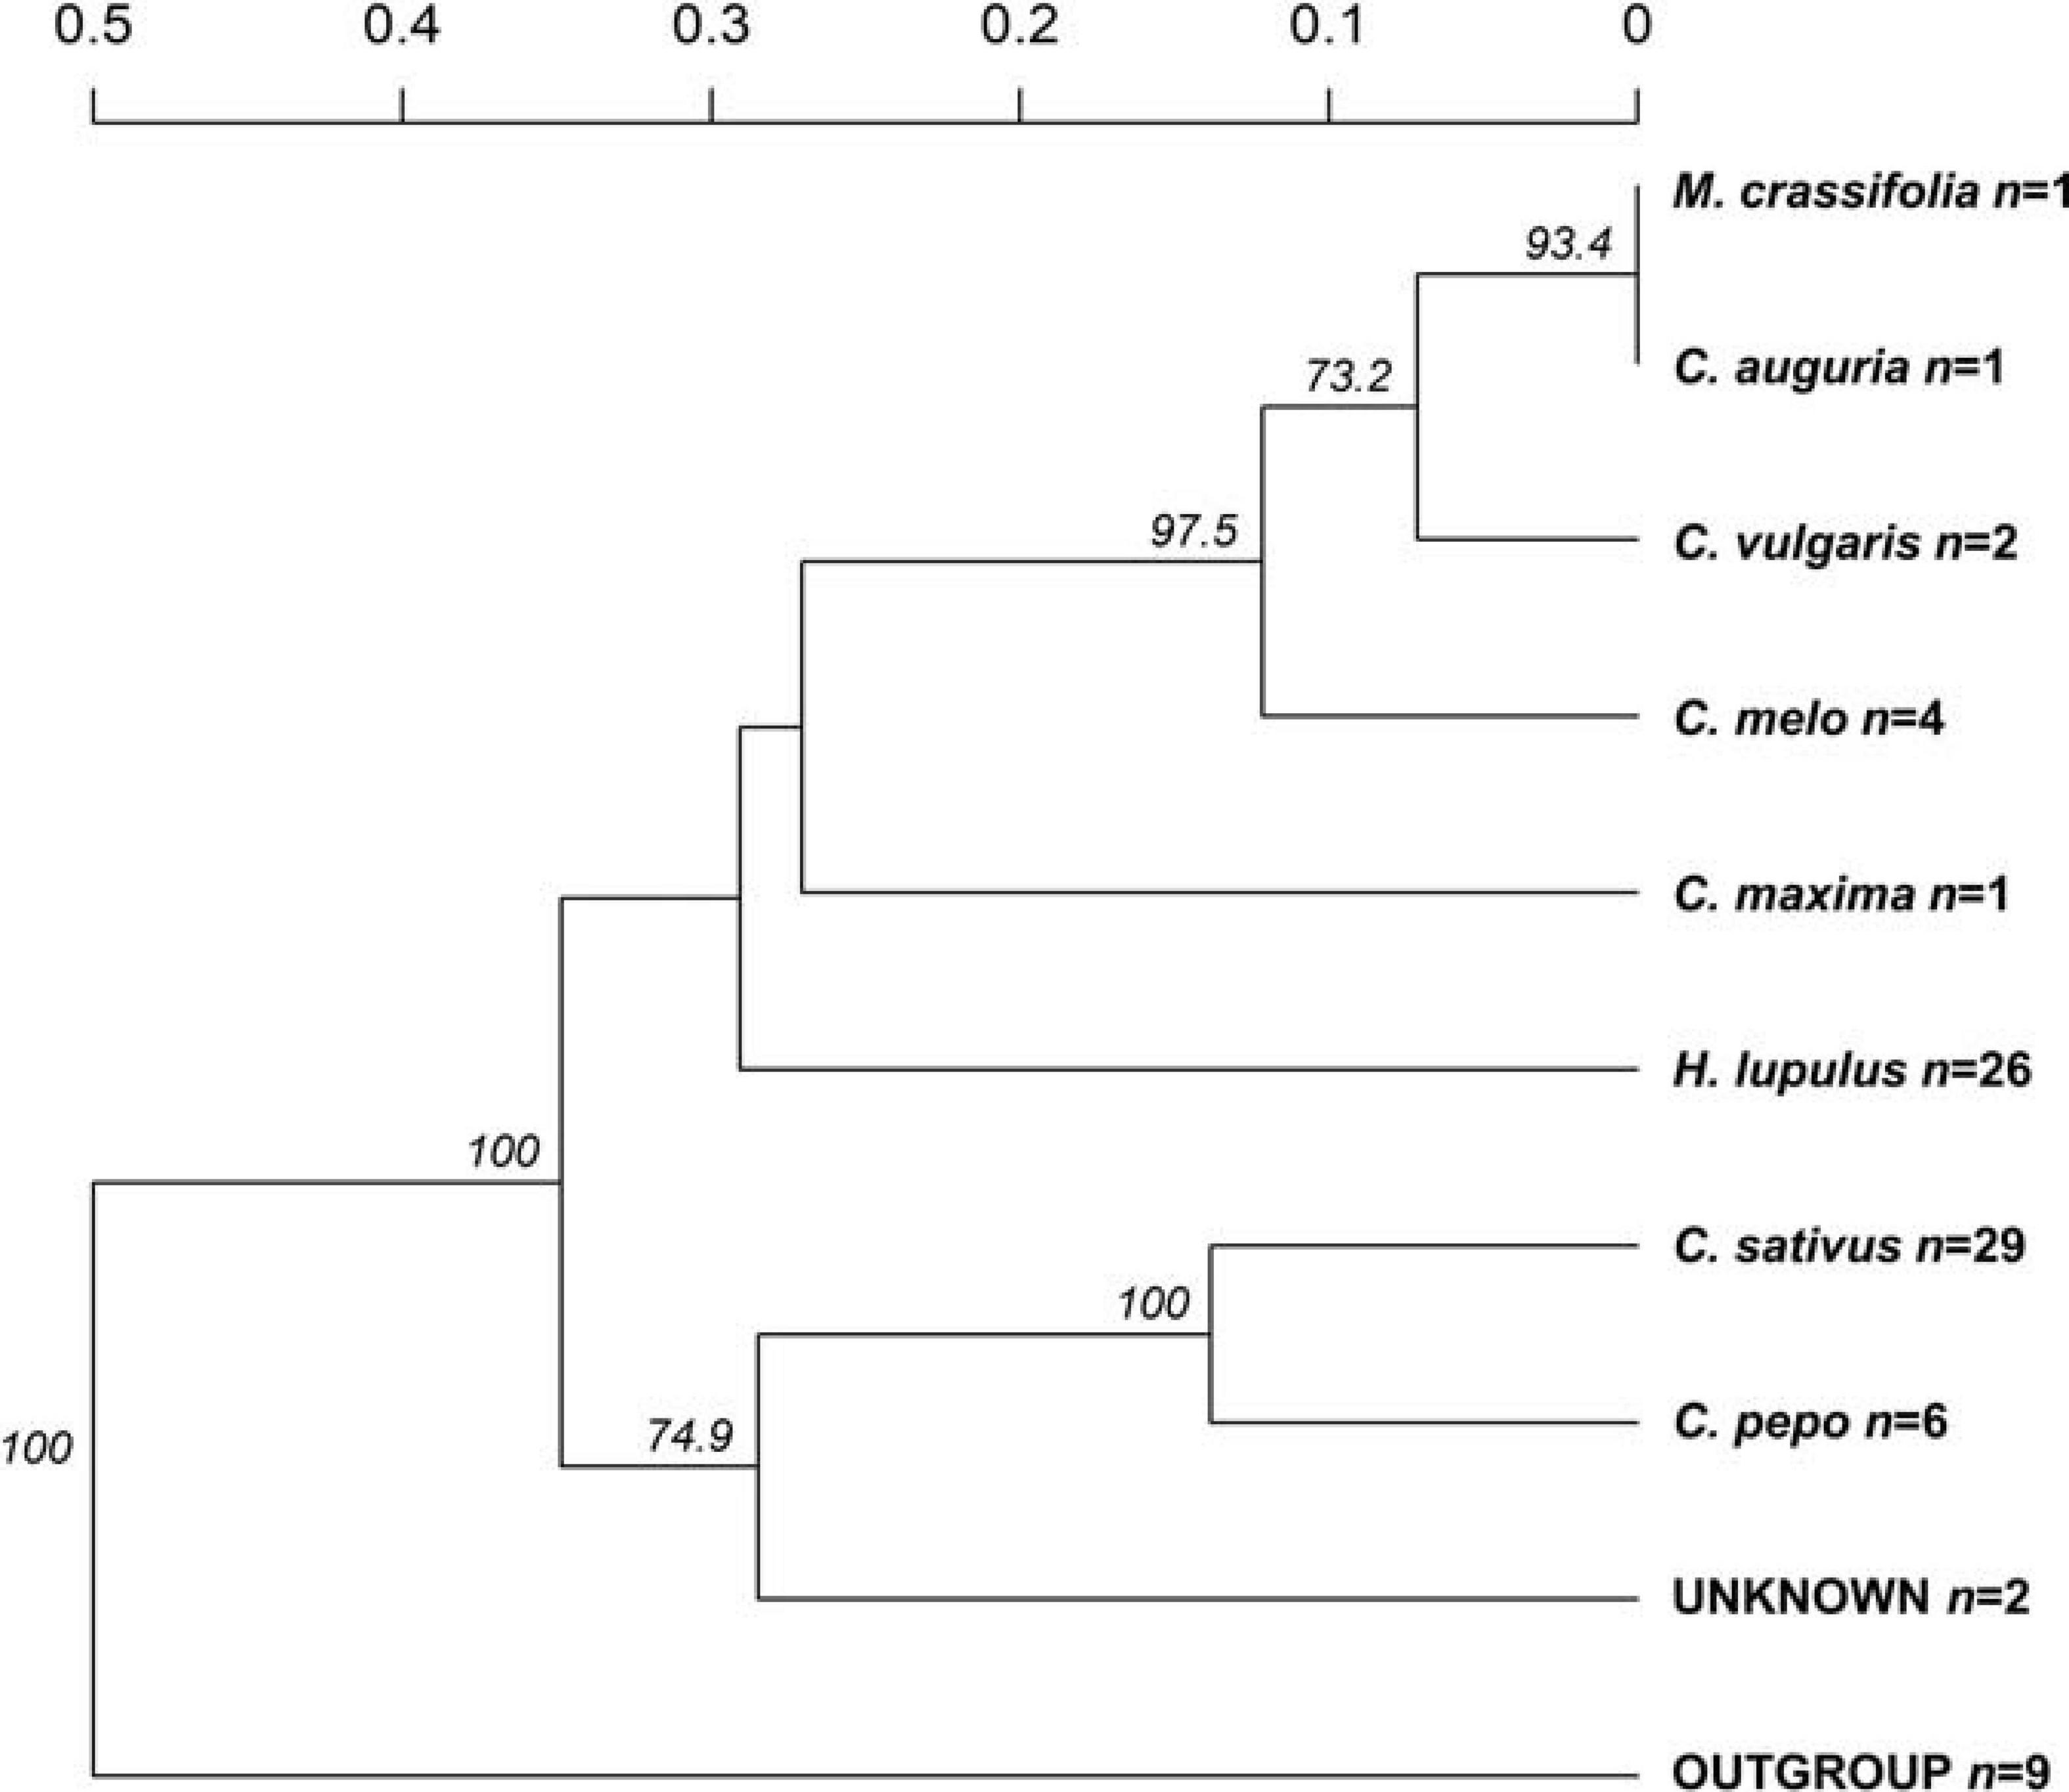
Figure 3. Genetic distances indicate Pseudoperonospora cubensis, but not P. humuli, host specialization. Counts for specimens analyzed from each affected host plant species are indicated next to each species nameplate (n). Bootstrap values >70% are indicated; those were calculated based on 1,000 permutations of the genotyped dataset.
Collectively, several lines of evidence pointed to a comparatively more pronounced population structure of P. cubensis than that of P. humuli. Genetically distinct groups were inferred by several analytical tools and positioned the current North American P. cubensis samples as distant to the remaining samples, with all the P. humuli samples placed in one genetic cluster irrespective of the analyses.
Demographic Analyses
Demographic investigations of a recent bottleneck were based on the “three-groups” dataset and the “species” dataset. Comparatively more signals for heterozygosity deficiencies or excesses were present in the “three-groups” dataset and within it—using the TPM. However, both models indicated a possible bottleneck signal for P. cubensis from Europe with heterozygosity deficiency (Supplementary Table 5). In the “species” dataset, the Wilcoxon test indicated significant heterozygosity excess for P. cubensis. The overall conclusion based on both mutation models across three statistical tests suggested no bottlenecks in the evolutionary recent past of either taxon (Supplementary Table 5).
Investigations of the evolutionary history using DIYABC employed both the gSSR genotyping datasets and the sequence matrices (see below; Figure 4 and Supplementary Tables 1, 7). Results from the “species” dataset were deemed as baseline for the remaining DIYABC analyses. In the gSSR “species” dataset, overwhelming support was found for scenario 2, in which P. humuli diverged from the ancestral downy mildews group about 7,240 generations into the coalescent and gave rise to P. cubensis about 4,610 generations ago. The multiple species outgroup had the largest effective population size, with P. humuli about one-fourth of this, and P. cubensis about 5% of this. The mutation rate in this dataset was about 1.2 × 10⁻⁴ per locus per generation (Figure 4A). Subdivision of the P. cubensis into samples from Europe and North America suggested that an unsampled “ghost” population gave rise to those samples (Figure 4B). Furthermore, the inferences largely agreed with those calculated for the “species” dataset (Figure 4A). Matrix of sequences from six gSSRs across 22 individuals of both species analyzed using DIYABC indicated that both taxa split about 8,950 generations ago with the effective population size of P cubensis about one-fourth of that inferred for P. humuli. The mutation rate was calculated at about 1.08 × 10⁻⁷ per nucleotide per generation (Figure 4C and Supplementary Table 6).
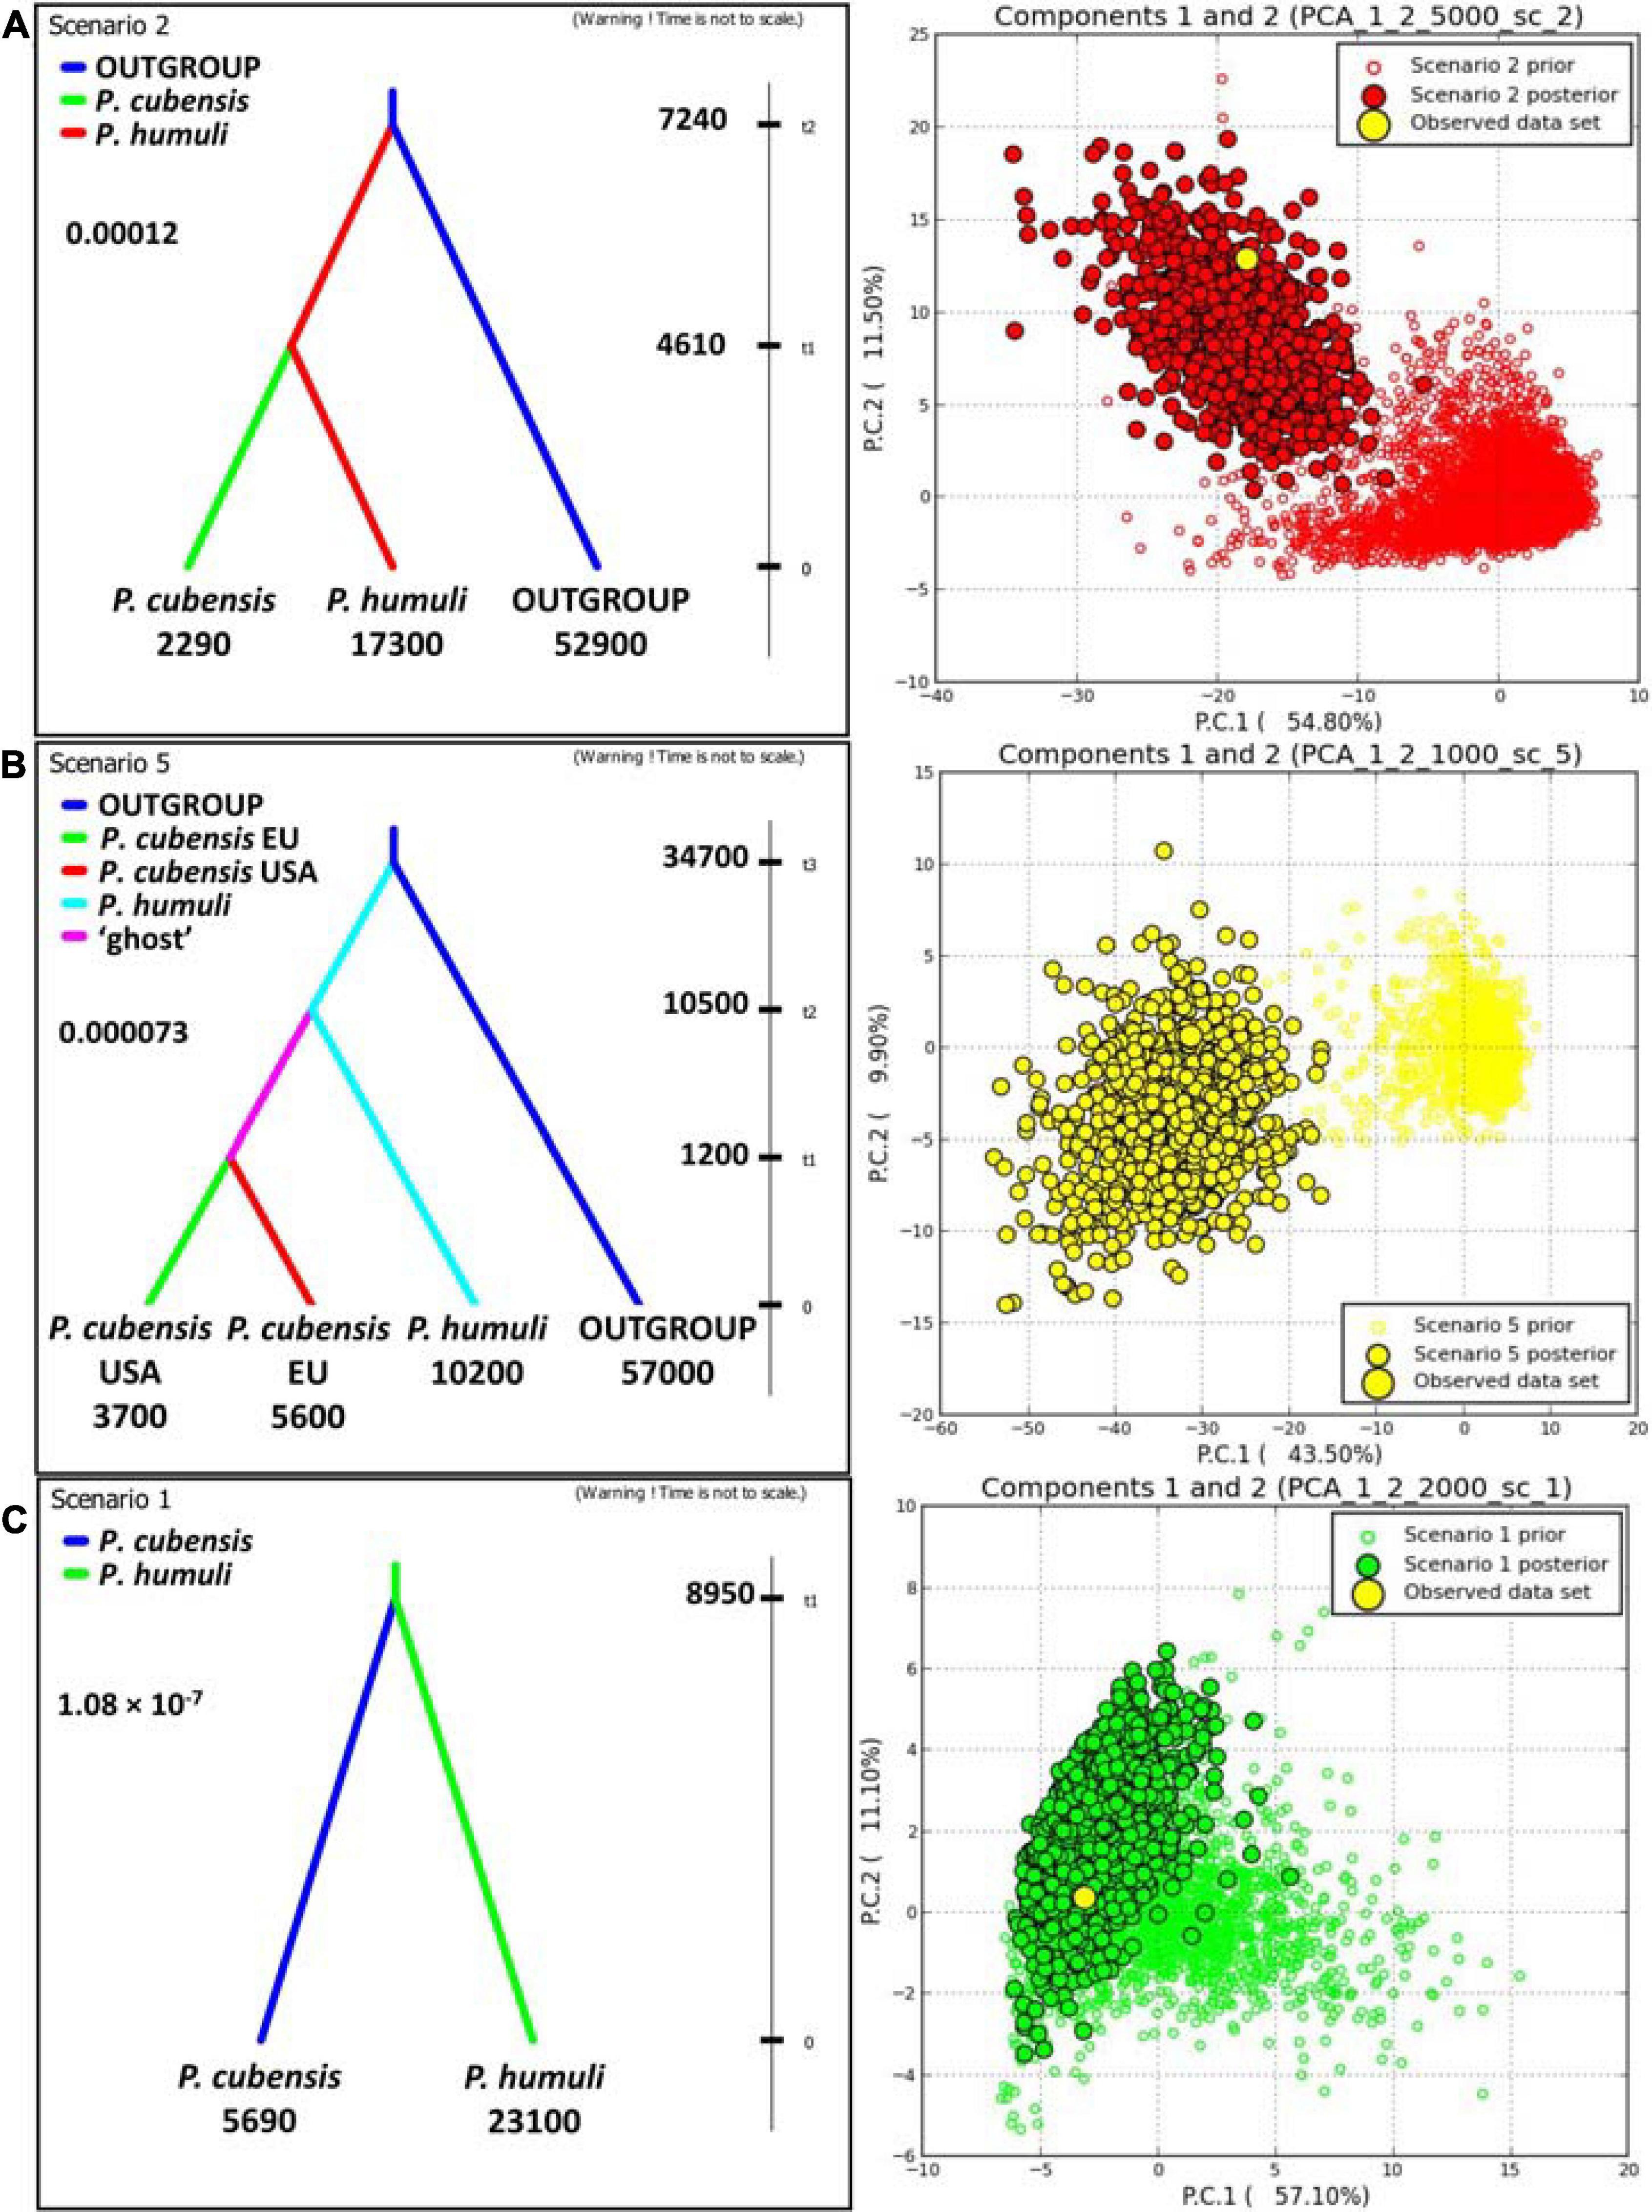
Figure 4. DIYABC analyses of the evolutionary relationship between Pseudoperonospora cubensis and P. humuli. Left column: best scenarios for each dataset; right column: respective model checking (PCA of priors, posteriors, and the observed dataset). (A) “Species” dataset with multispecific outgroup; (B) “three-subpopulations” dataset with multispecific outgroup; (C) sequence matrix across six genomic simple sequence repeats. For either analysis, 1,000,000 pseudo-observed datasets (PODs) were generated using ranges of prior indices. The subsequent analyses utilized 1% (n = 10,000) of the PODs closest to the observed dataset as per within- and among-subpopulation indices. The comparative analyses of both scenarios provided the support for each regarded evolutionary scenario (D, direct; L, logistic; 95% CI given). tn, time to split into the coalescent (generations); numbers below groups: effective population sizes; insert number: mutation rate.
Sequence Comparisons
Analyses of the sequenced amplicons of six gSSRs from both species lent support to their distinction (Figure 5 and Supplementary Figure 5). Sequencing of the gSSR loci was limited by the availability of the pathogen gDNA, but both Pseudoperonospora taxa were represented by multiple samples (n = 22; Supplementary Table 7). Overall, the aligned gSSR sequences allowed reliable distinction between the species, with the majority of the polymorphism (insertions/deletions) located to the repeat motif regions, with occasional nucleotide substitutions in the flanking regions lending additional support for the taxon distinction (Figure 5). The obtained sequence matrix concatenated across six gSSRs was then analyzed using RAxML algorithm. The alignment of 1,049 bp had 40 patterns, with proportion of gaps and completely undetermined characters of 1.59% (this included gaps or very rare ambiguous base calls). Phylogenetic ML tree (Supplementary Figure 5) indicated only one strongly supported split, which was between P. cubensis and P. humuli samples (bootstrap of 95%).
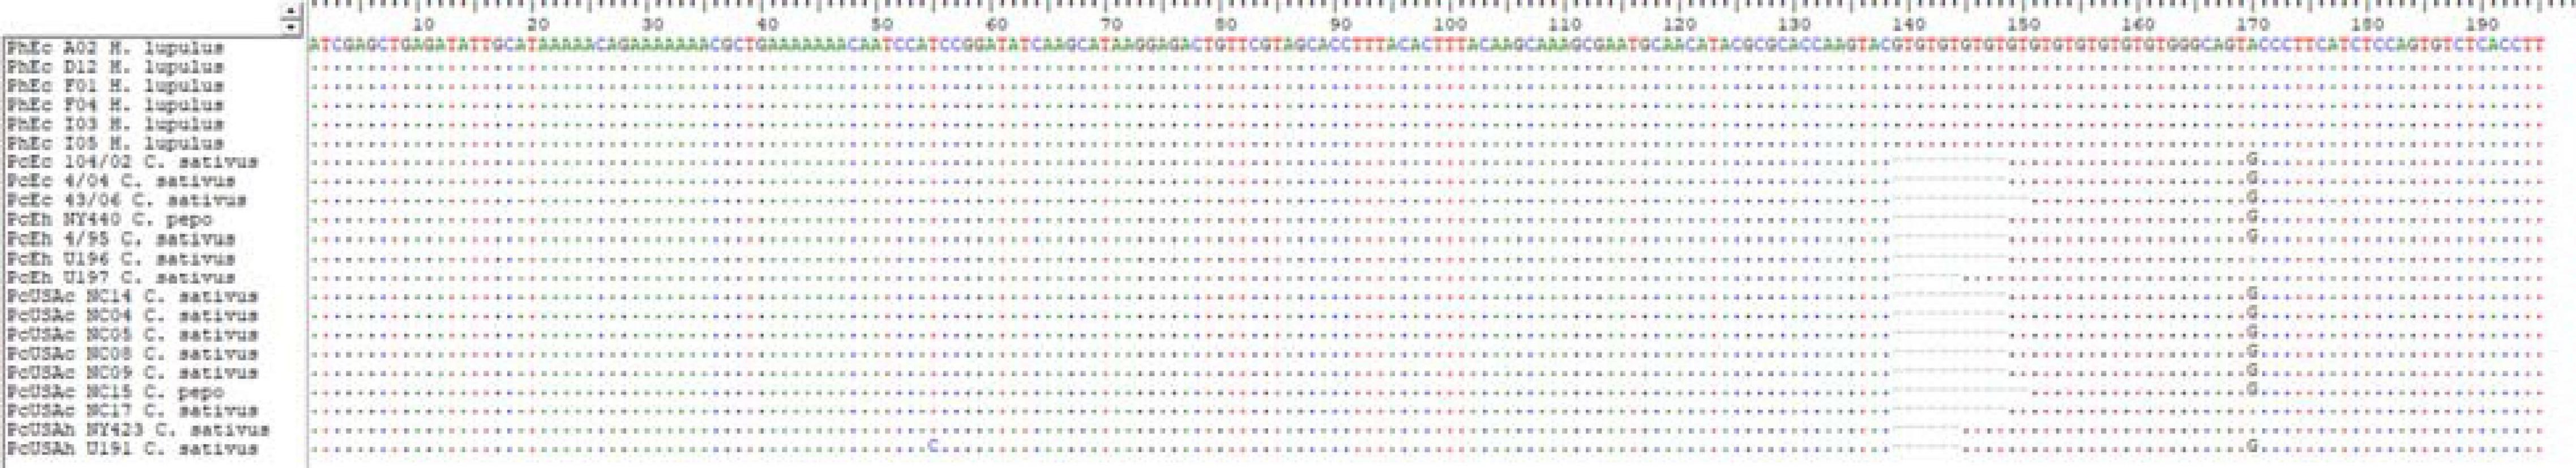
Figure 5. Alignment of the sequencing results for genomic simple sequence repeat (gSSR) PC021 [GT]6 allows clear distinction between Pseudoperonospora cubensis and P. humuli, as visualized in BioEdit (Hall, 1999). Sequence labels include preattributed subpopulation code (see Figure 1), isolate code, and the host plant identifier (Supplementary Table 1). Occasional nucleotide substitutions in the SSR flanking regions were found across all six sequenced gSSRs (Supplementary Table 7).
Comparative Genomics
The reference of 35,538 contigs of the P. cubensis draft genomic assembly from 2012 (Savory et al., 2012) was queried with 5,534 contigs of the P. humuli (Rahman et al., 2019) and showed generally high syntenic agreement with one another (Supplementary Figure 6A). Calculating the synteny between those assemblies using NUCMER revealed 11,042 contigs of P. cubensis were syntenic to 5,376 contigs of P. humuli. Thus, at the DNA level, 50.5% of the P. cubensis draft genome sequence was in synteny to 99.1% of the P. humuli draft genome. The syntenic blocks showed on average high DNA identity of 94.5 ± 4.53% (range from 50.9 to 100.0%). After six-frame translation and comparisons using PROMER, 11,301 of P. cubensis contigs were in synteny with 5,418 contigs of P. humuli. The translated syntenic blocks showed in average high amino acid identity of 88.2% (ranging from 11.6 to 92.3%) and similarity of 91.4% (ranging from 9.5 to 95.3%).
Parallel analysis using the D-GENIES pipeline indicated that more than 38% of the P. cubensis sequence showed nucleotide identity (>75%) when queried with the P. humuli contigs, whereas no match was detected in 61% of the P. cubensis sequence. Both genomic assemblies showed high synteny with little noise, particularly in the longer contigs of the P. cubensis reference (Supplementary Figure 6A, bottom-left). A large insertion in the P. humuli genome that was absent from the P. cubensis assembly was also detected in this analysis. Assemblytics-driven analyses further supported the similarities between genomes of both taxa. At the DNA level, 97% contigs of P. humuli mapped to 31% of the P. cubensis contigs, whereas after six-frame translation comparison of both assemblies, almost 98% of the P. humuli contigs were matched to almost 32% of the P. cubensis contigs. This analysis also revealed an intense tandem sequence expansion in the P. humuli genome, at both studied levels (Supplementary Figure 6B).
Discussion
Here, we hypothesized that P. cubensis and P. humuli, two closely related downy mildew pathogens, are unique species. Using historical and current DNA samples of both pathogens, our results provided definitive evidence that current taxonomic separation of P. cubensis and P. humuli into separate species is valid. Our tools of choice were the P. cubensis gSSRs, developed shortly before the publication of the draft genome of P. cubensis (Kanetis et al., 2009; Savory et al., 2012).
The definition of species in the class Peronosporomycetes is complex due to the inherent underlying characteristics observed in the obligate biotrophic pathogens (Restrepo et al., 2014). Those include pseudosexual mating (noncomplete genomic shuffling), parallel asexual and sexual reproduction, and lack of segregating individuals from the hybrid, among others (Göker et al., 2007; Stukenbrock, 2013; Thines and Choi, 2016; Spring et al., 2018). Using a larger sample size than a previous work by our group (Kanetis et al., 2009), as well as available genomic resources, we were able to develop additional gSSRs that can be of great use for studies of closely related species of Pseudoperonospora. We were able to analyze the cross-amplification of distant/neighbor genera; however, our data pointed to limited conservation of the gSSRs within the Pseudoperonospora genus. Unfortunately, we did not have access to DNA samples to exhaustively test the cross-amplification due to the obligate biotrophic nature of downy mildew pathogens, but many of the currently recognized Pseudoperonospora species were represented in our panel. Out of the 23 confirmed gSSRs, only four cross-amplified to the related genera. Furthermore, analytical sequencing of specimens amplified with our gSSRs confirms their successful cross-transfer between both Pseudoperonospora taxa of focus. Here, only occasional nucleotide substitutions (but not insertions or deletions) were present in the flanking regions, whereas the bulk of the polymorphisms was detected in the repeat region of each gSSR tested this way. This feature of our gSSRs encourages their use toward pathogen detection, especially when coupling the PCR with the high-resolution melting analysis (Nowicki et al., 2015; Summers et al., 2015a; Lee et al., 2016; Rahman et al., 2019; Stackhouse, 2019). Finally, several gSSRs that successfully amplified in the initial tests of 22 specimens from both taxa across the 23 gSSRs were not found in the current draft genomes, which argues for the continued efforts toward improved genomic resources of the downy mildew pathogens.
Compared with the gSSRs used here, the recent boost in the next-generation sequencing of transcriptomes enabled accretion of the eSSRs in abundance. These eSSRs are comparatively more conserved than gSSRs, owing to the selective pressure against mutation in the coding regions of the genome, and generally capture the extant genetic diversity at a lower scale than gSSRs, as demonstrated for P. cubensis and closely related downy mildew pathogens (Wallace and Quesada-Ocampo, 2017). Similarly, the broadly used ISSR and RAPD markers are now considered outdated and inferior to SSRs because of the limitations inherent to either marker type, including dominant character, ambiguity in calling the null alleles, or unknown sequences targeted, even if allowed some insights into P. cubensis and P. humuli population biology (Chee et al., 2006; Polat et al., 2014).
In agreement with reports that used other methodological approaches (Göker et al., 2009; Mitchell et al., 2011; Runge et al., 2011; Runge and Thines, 2012; Summers et al., 2015b), our study strongly supported the separation of the two analyzed Pseudoperonospora taxa into two distinct species, based on several independent lines of evidence. These included their separation using the Bayesian inference (both STRUCTURE and DIYABC) and multivariate analysis (DAPC) of the gSSR data and ML and DIYABC analyses of the sequence data. Regarding the spatiotemporal differences in both taxa, P. humuli proved comparatively genetically stable, with one major cluster. This can be linked to the commonly observed sexual reproduction in this species and its homothallic character (Gent et al., 2017) and can explain the problems with chemical control strategies (Gent et al., 2008). In contrast, strong spatiotemporal differentiation was observed in P. cubensis, with the historical samples distinct from the current samples. The age for the collected historical samples used in this study ranged between 1887 and 2014 (P. cubensis) and between 1925 and 2010 (P. humuli). This roughly corresponds to the historical specimens of both taxa in the U.S. Fungus Database, with the oldest P. cubensis dated 1857 (Cuba) and P. humuli 1906 (Japan). Inspection of that collection and ours points that by early 20th century, P. cubensis was spread wherever the cucurbits were grown, and implies Europe or East Asia as the possible origin of P. humuli based on the frequency and age of the specimens. One further observation is, that by 1900, P. cubensis was virulent to crops from 10 genera of Cucurbitaceae (Supplementary Table 1, U.S. Fungus Database), which further underscores the validity of divergence we noted here. Detailed molecular analyses of those invaluable historical materials should follow to uncover the geographical origin of P. cubensis, best accompanied by robust population genetics/genomics of the current samples from the regions where cucurbits originate. The data corroborate the importance of mutation in generating the species diversity, and our estimates for mutation rates both at gSSR and sequence bases are well within the range for the oomycetes: Plasmopara viticola with 2.85 × 10⁻⁴ (Fontaine et al., 2013) or 1 × 10⁻⁴ (Gobbin et al., 2003), Phythophthora parasitica with 4.7 × 10⁻⁴ (Dunn et al., 2014), or Peronospora tabacina with 3.24 × 10⁻⁴ (Nowicki et al., 2021). One possible limitation is the exclusion of almost half of the starting collection owing to its clonal character and can be readdressed in more robust future research by using more specimens and/or more markers, which provided the desired study resolution and support for conclusions in related pathogens (Cooke and Lees, 2004; Croucher et al., 2013).
Differentiation observed in P. cubensis can be at least partially explained by the analyses using the host plant information. P. cubensis s.l. is broadly accepted as pathogenic to a wide range of Cucurbitaceae spp. hosts, and this observation led to the development of a host standard system for the virulence phenotype assessment (Sarris et al., 2009; Polat et al., 2014; Kitner et al., 2015; Spring et al., 2018). Indeed, ours and other studies (Thomas et al., 2017b; Wallace et al., 2020) support separating the taxon into distinct species, pending future developments. Furthermore, several studies leveraged this observation for important insights into the pathogen biology and epidemiology (Cohen and Rubin, 2012; Polat et al., 2014; Naegele et al., 2016; Wallace et al., 2020). For our collection, we observed the separation of the C. sativus specimens of P. cubensis from the other sampled host species, in addition to the distinct clade formed by the H. lupulus specimens of P. humuli. By using the historical specimens of both pathogens, we gained some evidence for an ongoing speciation within P. cubensis. Recent evidence from -omics research has added several important genomic and metabolic insights to the accumulated molecular and host–pathogen interactions and specificity evidence of oomycetes speciation (Burkhardt and Day, 2013; McGowan and Fitzpatrick, 2020; Rodenburg et al., 2020). These include alternative splicing in the effector genes (Savory et al., 2012; Summers et al., 2015b), recombination and partial reshuffling of the genetic material (Cohen and Rubin, 2012; Thomas et al., 2017b), and functionally, host jumps and geographic separation from the preferred host species, which necessitated the evolution of parasitic behavior by genetic adjustments (Dussert et al., 2019; Rahman et al., 2019; Thines, 2019; Rodenburg et al., 2020; Wallace et al., 2020). Our results for P. cubensis diverging from the ancestral P. humuli agree with the previous hypotheses in this regard based on phylogenetic analyses of several sequenced regions from both species (Mitchell et al., 2011).
Our comparative genomics analyses support the differences present in the draft genomes and add to our analyses of speciation within Pseudoperonospora. The syntenic comparison is overall strong, supporting the close relatedness between the two analyzed taxa. It needs to be stressed that the presently available draft assemblies cover only about 73% (P. cubensis) or about 54% (P. humuli) of their genome sizes estimated by the Feulgen method (Voglmayr and Greilhuber, 1998). This method proved reliable in assessing the genome sizes when compared with other oomycete genomes assembled and regarded as complete, such as Albugo candida, B. lactucae, or P. viticola (McGowan and Fitzpatrick, 2020; Rodenburg et al., 2020). We did observe a small amount of “noise” (misaligned contigs), which, as noted above, underlines the need for improved genomic resources of downy mildew pathogens. To further strengthen this point, two of our gSSRs each placed in a single contig in the P. cubensis assembly were present as two disjointed contigs in the P. humuli assembly (PC06; PC024). Similarly, PC017 allowed the identification of a 6-bp indel present in the P. humuli assembly. Finally, the major gap in the P. cubensis genome visible in the syntenic comparison indicates that a substantial part of the genomic information is still missing. This is in stark contrast to a recent robust analysis which suggested that four genes separated P. humuli from P. cubensis (Rahman et al., 2019). Notably, the draft genome of P. humuli reported there lent great advances to pathogen detection. Indeed, a transcriptome-based study concluded that the respective differences reach much deeper and may involve changes in expression and pathogenicity signatures across hundreds of genes (Summers et al., 2015b). Third-generation sequencing and hybrid assembly tools should help decipher the problematic gene-sparse and repeat-rich genome regions (Haas et al., 2009; McGowan and Fitzpatrick, 2020), which are the common obstacle in the effective assembly of short reads. The genotyping-by-sequencing research seems a particularly attractive analytical approach for both species, taking advantage of the comparatively small genome sizes for such a massive tool (Thomas et al., 2017a; Gent et al., 2019).
In summary, our population genetics study on the taxonomic identity of closely related downy mildew pathogens P. cubensis and P. humuli using the gSSRs provided the definite proof for the separation of both taxa. The data accrued allowed novel insights into the evolutionary history of the complex, reliably separating the P. cubensis samples from cucumber from those of other cucurbits, as well as P. humuli from hop. Our approach also allowed capturing the ongoing speciation in P. cubensis based on the host specificity. Leveraging the discriminating features of SSR genotyping and host information allows replacement of the current resource-intensive bioassay used for pathotyping of P. cubensis isolates. Characterizing P. cubensis in the regions where the cucurbits originate could help prove our inference of species origin. We also observed the need for improved genomic resources for those important pathogens, which can further inform the species biology and direct the development of related control measures.
Data Availability Statement
The datasets presented in this study can be found in the article/Supplementary Material.
Author Contributions
MN: data generation, data analysis, primary writing, and editing. DH: data generation, data analysis, writing, and revisions. RT: project idea, financial support, project oversight, resources, data generation, writing, and revisions. SB: data generation, data management, project management, writing, and revisions. LK and PW: data generation, writing, and revisions. PO, MC, OS, MT, FR, and BS: data generation, resources, writing, and revisions. All authors contributed to the article and approved the submitted version.
Funding
This research was funded fully by the United States Department of Agriculture—Agricultural Research Service grant (NACA 58−6062−6) to RT.
Conflict of Interest
The authors declare that the research was conducted in the absence of any commercial or financial relationships that could be construed as a potential conflict of interest.
Acknowledgments
The authors thank the following herbaria for samples for destructive testing used in this study: New York Botanical Garden (NY), the Herbarium of the Plant Diseases Division of New Zealand (PDD), the Farlow Herbarium of the Harvard University (FH), the Mycological Herbarium of the Korea University (KUS-F), and the Herbarium of the University of Hohenheim (HOH). Permissions and licenses required for the limited destructive sampling for both taxa of focus were granted by the respective maintaining institutions, upon our requests. Young-Joon Choi (Korea University, Seoul, South Korea) is gratefully recognized for gDNA samples for the cross-amplification study. The use of any trade names is for identification purposes only and does not imply their endorsement by the authors or the study funding entities. USDA is an equal opportunity provider and employer.
Supplementary Material
The Supplementary Material for this article can be found online at: https://www.frontiersin.org/articles/10.3389/fmicb.2021.686759/full#supplementary-material
Supplementary Figure 1 | Genotype accumulation curves for Pseudoperonospora cubensis and P. humuli “6-subpopulations” datasets.
Supplementary Figure 2 | Hardy-Weinberg equilibrium (HWE) violations for “species” (A) and “6-subpopulations” datasets of Pseudoperonospora cubensis and P. humuli (B). Color scale indicates high (blue) and low (pink) support for HWE violations across loci (rows) and groups analyzed (columns).
Supplementary Figure 3 | Pairwise linkage disequilibrium among the genomic simple sequence repeats analyzed, standardized by the population size in Pseudoperonospora cubensis and P. humuli populations.
Supplementary Figure 4 | Isolation-by-Distance analysis (Mantel and partial Mantel tests) for Pseudoperonospora cubensis (A,B) and P. humuli (C,B). Correlation between matrices of genetic distances (vertical axis, Dgen) and geographical distances (horizontal axis, Dgeo) (A,C) were calculated using raw data (r) or standardized by year of sample (r’). Significance of the result was calculated by 999 permutations of the dataset. Correlograms for either species [(C,D) respectively) indicate the Mantel’s r for each given geographical distance class, with significant results (P < 0.05) marked with filled symbols.
Supplementary Figure 5 | Maximum Likelihood tree of the concatenated and MAFFT-aligned sequences of six genomic simple sequence repeats amplified using gDNA samples of Pseudoperonospora cubensis (n = 14) and P. humuli (n = 3). Not shown: clonal sequences (n = 5; 3 for P. cubensis and 2 for P. humuli) removed prior to running the RAxML with deep bootstrap. Bootstrap support values for each split are indicated using the color legend. Edge labels include sample identifier (Supplementary Tables 1, 7) and pre-attributed group identifier that reflected the sample geographic origin and age (see Figure 1).
Supplementary Figure 6 | Comparison of the genomic assemblies of Pseudoperonospora cubensis (reference) and P. humuli (query). (A) Visualization of the syntenic comparison of the draft genomes of both taxa, using D-genies and minimap2 algorithm. Organisms and genomes are identified along the respective axes. The cumulative sizes of the compared sequences are also indicated, respectively. The reference P. cubensis contigs were arranged in the decreasing size order along the horizontal axis. (B) Structural variants in the P. cubensis (reference; left direction from the middle) and P. humuli (query; right direction from the middle) draft genomes visualized with Assemblytics based on the delta files from the global alignments using MUMMER at DNA level (NUCMER; top panel) and at protein level after 6-frame translation (PROMER; bottom panel). Variant types are color-coded according to the legend in the insert.
Supplementary Table 1 | Complete binned genotyping dataset used for this study. The table identifies the sample by its original code, population code (“6-subpopulation” manner), detected alleles per each tested locus, state/country of origin, year of collection, and affected host plant species. Additional formatting was put for the samples used in the initial testing of the 27 genomic simple sequence repeats (gSSRs) (bold), and those used for sequencing across selected 6 gSSRs (highlight).
Supplementary Table 2 | Genomic simple sequence repeat details, including the internal code (PC#), the repeated motif, forward and reverse primers, expected size length, genomic locations to P. cubensis and P. humuli draft genomes (if detected; contig and bases within identified), PCR product size range in the initial study (Supplementary Table 1), and results of cross-amplification to related Oomycetes species (PCR product sizes only if amplified).
Supplementary Table 3 | Results of the analysis of molecular variance (AMOVA) test for variance partitioning (“6-subpopulations”, “species”, and “host” datasets).
Supplementary Table 4 | Summary of ObStruct analyses of the STRUCTURE outcome. For each performed analysis (“6-subpopulations”, “species”, “host” datasets), the resultant files for 30 MCMCs were pooled, to indicate how the fit statistics R2 changed, when sequentially removing the pre-attributed populations or the inferred clusters.
Supplementary Table 5 | Results of the Bottleneck analyses (“3-groups” and “species” datasets). Bottleneck used the stepwise mutation model (S.M.M.) and the twho-phase mutational model (T.P.M.), to test for shift in the inferred population counts. Significance of heterozygosity excess/deficiency for each group and mutation model was also assessed. Conclusion about shifts in the population size (“mode shift” descriptor) takes into consideration all three basic tests (sign, standardized differences, and Wilcoxon sign-rank tests).
Supplementary Table 6 | Results of the DIYABC analyses (“3-groups” and “species” datasets). For the best-supported scenario for each analysis, the estimates for effective population sizes, mutation rates (μ) and times of split (tx) are indicated as medians and respective 95% CI ranges.
Supplementary Table 7 | Details of the analytical sequencing of 22 gDNA samples of both taxa across 6 selected genomic simple sequence repeats (gSSRs). Affected host plants, consensus sequences, and the respective GenBank submission numbers are indicated.
References
Agapow, P. M., and Burt, A. (2001). Indices of multilocus linkage disequilibrium. Mol. Ecol. Notes 1, 101–102. doi: 10.1046/j.1471-8278.2000.00014.x
Altschul, S. F., Gish, W., Miller, W., Myers, E. W., and Lipman, D. J. (1990). Basic local alignment search tool. J. Mol. Biol. 215, 403–410.
Amos, W., Hoffman, J., Frodsham, A., Zhang, L., Best, S., and Hill, A. (2007). Automated binning of microsatellite alleles: problems and solutions. Mol. Ecol. Notes 7, 10–14. doi: 10.1111/j.1471-8286.2006.01560.x
Bhargava, A., and Fuentes, F. (2010). Mutational dynamics of microsatellites. Mol. Biotechnol. 44, 250–266. doi: 10.1007/s12033-009-9230-4
Burkhardt, A., and Day, B. (2013). A genomics perspective on cucurbit-oomycete interactions. Plant Biotechnol. 30, 265–271. doi: 10.5511/plantbiotechnology.13.0315a
Cabanettes, F., and Klopp, C. (2018). D-GENIES: dot plot large genomes in an interactive, efficient and simple way. PeerJ 6:e4958. doi: 10.7717/peerj.4958
Chee, H. Y., Nelson, M. E., Grove, G. G., Eastwell, K. C., Kenny, S. T., and Klein, R. E. (2006). Population biology of Pseudoperonospora humuli in OREGON and Washington. Plant Dis. 90, 1283–1286. doi: 10.1094/pd-90-1283
Choi, Y.-J., Hong, S.-B., and Shin, H.-D. (2005). A re-consideration of Pseudoperonospora cubensis and P. humuli based on molecular and morphological data. Mycol. Res. 109, 841–848. doi: 10.1017/s0953756205002534
Cohen, Y., and Rubin, A. E. (2012). Mating type and sexual reproduction of Pseudoperonospora cubensis, the downy mildew agent of cucurbits. Eur. J. Plant Pathol. 132, 577–592. doi: 10.1007/s10658-011-9902-3
Colucci, S. J. (2008). “Host range, fungicide resistance and management of Pseudoperonospora cubensis, causal agent of cucurbit downy mildew,” in Plant Pathology, eds G. Holmes, D. Shew, and T. Wehner (Raleigh, NC: North Carolina State Universit).
Cooke, D., and Lees, A. (2004). Markers, old and new, for examining Phytophthora infestans diversity. Plant Pathol. 53, 692–704. doi: 10.1111/j.1365-3059.2004.01104.x
Cornuet, J. M., and Luikart, G. (1996). Description and power analysis of two tests for detecting recent population bottlenecks from allele frequency data. Genetics 144, 2001–2014. doi: 10.1093/genetics/144.4.2001
Cornuet, J.-M., Pudlo, P., Veyssier, J., Dehne-Garcia, A., Gautier, M., Leblois, R., et al. (2014). DIYABC v2. 0: a software to make approximate Bayesian computation inferences about population history using single nucleotide polymorphism. DNA Sequence and microsatellite data. Bioinformatics 30, 1187–1189. doi: 10.1093/bioinformatics/btt763
Croucher, P. J., Mascheretti, S., and Garbelotto, M. (2013). Combining field epidemiological information and genetic data to comprehensively reconstruct the invasion history and the microevolution of the sudden oak death agent Phytophthora ramorum (Stramenopila: Oomycetes) in California. Biol. Invasions 15, 2281–2297. doi: 10.1007/s10530-013-0453-8
Dray, S., and Dufour, A.-B. (2007). The ade4 package: implementing the duality diagram for ecologists. J. Stat. Softw. 22, 1–20. doi: 10.18637/jss.v022.i04
Dunn, A. R., Bruening, S. R., Grünwald, N. J., and Smart, C. D. (2014). Evolution of an experimental population of Phytophthora capsici in the field. Phytopathology 104, 1107–1117. doi: 10.1094/phyto-12-13-0346-r
Dussert, Y., Mazet, I. D., Couture, C., Gouzy, J., Piron, M. C., Kuchly, C., et al. (2019). A high-quality grapevine downy mildew genome assembly reveals rapidly evolving and lineage-specific putative host adaptation genes. Geno. Biol. Evolu. 11, 954–969. doi: 10.1093/gbe/evz048
Earl, D. A., and vonHoldt, B. M. (2011). STRUCTURE HARVESTER: a website and program for visualizing STRUCTURE output and implementing the Evanno method. Conserv. Genet. Resour. 4, 359–361. doi: 10.1007/s12686-011-9548-7
Evanno, G., Regnaut, S., and Goudet, J. (2005). Detecting the number of clusters of individuals using the software STRUCTURE: a simulation study. Mol. Ecol. 14, 2611–2620. doi: 10.1111/j.1365-294x.2005.02553.x
Fontaine, M. C., Austerlitz, F., Giraud, T., Labbé, F., Papura, D., Richard-Cervera, S., et al. (2013). Genetic signature of a range expansion and leap-frog event after the recent invasion of Europe by the grapevine downy mildew pathogen Plasmopara viticola. Mol. Ecol. 22, 2771–2786.
Francis, R. M. (2017). pophelper: an R package and web app to analyse and visualize population structure. Mol. Ecol. Resour. 17, 27–32. doi: 10.1111/1755-0998.12509
Gayevskiy, V., Klaere, S., Knight, S., and Goddard, M. R. (2014). ObStruct: a method to objectively analyse factors driving population structure using Bayesian ancestry profiles. PLoS One 9:e85196. doi: 10.1371/journal.pone.0085196
Gent, D., Cohen, Y., and Runge, F. (2017). Homothallism in Pseudoperonospora humuli. Plant Pathol. 66, 1508–1516. doi: 10.1111/ppa.12689
Gent, D. H., Adair, N., Knaus, B. J., and Grunwald, N. J. (2019). Genotyping-by-Sequencing reveals fine-scale differentiation in populations of Pseudoperonospora humuli. Phytopathology 109, 1801–1810. doi: 10.1094/phyto-12-18-0485-r
Gent, D. H., Nelson, M. E., and Grove, G. G. (2008). Persistence of phenylamide insensitivity in Pseudoperonospora humuli. Plant Dis. 92, 463–468. doi: 10.1094/pdis-92-3-0463
Gent, D. H., and Ocamb, C. M. (2009). Predicting infection risk of hop by Pseudoperonspora humuli. Phytopathology 99, 1190–1198. doi: 10.1094/phyto-99-10-1190
Gobbin, D., Pertot, I., and Gessler, C. (2003). Identification of microsatellite markers for Plasmopara viticola and establishment of high throughput method for SSR analysis. Eur. J. Plant Pathol. 109, 153–164.
Göker, M., García-Blázquez, G., Voglmayr, H., Telleria, M. T., and Martín, M. P. (2009). Molecular taxonomy of phytopathogenic fungi: a case study in Peronospora. PLoS One 4:e6319. doi: 10.1371/journal.pone.0006319
Göker, M., Voglmayr, H., Riethmüller, A., and Oberwinkler, F. (2007). How do obligate parasites evolve? A multi-gene phylogenetic analysis of downy mildews. Fungal Genet. Biol. 44, 105–122. doi: 10.1016/j.fgb.2006.07.005
Goss, E. M., Tabima, J. F., Cooke, D. E., Restrepo, S., Fry, W. E., Forbes, G. A., et al. (2014). The Irish potato famine pathogen Phytophthora infestans originated in central Mexico rather than the Andes. Proc. Natl. Acad. Sci.U.S.A. 111, 8791–8796. doi: 10.1073/pnas.1401884111
Goudet, J. (2005). Hierfstat, a package for R to compute and test hierarchical F-statistics. Mol. Ecol. Resour. 5, 184–186. doi: 10.1111/j.1471-8286.2004.00828.x
Haas, B. J., Kamoun, S., Zody, M. C., Jiang, R. H., Handsaker, R. E., Cano, L. M., et al. (2009). Genome sequence and analysis of the Irish potato famine pathogen Phytophthora infestans. Nature 461, 393–398.
Hall, T. A. (1999). BioEdit: a user-friendly biological sequence alignment editor and analysis program for Windows 95/98/NT. Nucl. Acids Symposium Series 41, 95–98.
Hardy, O. J., and Vekemans, X. (2002). SPAGeDi: a versatile computer program to analyse spatial genetic structure at the individual or population levels. Mol. Ecol. Notes 2, 618–620. doi: 10.1046/j.1471-8286.2002.00305.x
Holmes, G. J., Ojiambo, P. S., Hausbeck, M. K., Quesada-Ocampo, L., and Keinath, A. P. (2015). Resurgence of cucurbit downy mildew in the United States: a watershed event for research and extension. Plant Dis. 99, 428–441. doi: 10.1094/pdis-09-14-0990-fe
Hubisz, M. J., Falush, D., Stephens, M., and Pritchard, J. K. (2009). Inferring weak population structure with the assistance of sample group information. Mol. Ecol. Resour. 9, 1322–1332. doi: 10.1111/j.1755-0998.2009.02591.x
Jombart, T., Devillard, S., and Balloux, F. (2010). Discriminant analysis of principal components: a new method for the analysis of genetically structured populations. BMC Genet. 11:94. doi: 10.1186/1471-2156-11-94
Jost, L. (2008). GST and its relatives do not measure differentiation. Mol. Ecol. 17, 4015–4026. doi: 10.1111/j.1365-294x.2008.03887.x
Kamvar, Z. N., Tabima, J. F., and Grünwald, N. J. (2014). Poppr: an R package for genetic analysis of populations with clonal, partially clonal, and/or sexual reproduction. PeerJ 2:e281. doi: 10.7717/peerj.281
Kanetis, L., Wang, X., Wadl, P., Neufeld, K., Holmes, G., Ojiambo, P., et al. (2009). Microsatellite loci from the cucurbit downy mildew pathogen Pseudoperonospora cubensis. Mol. Ecol. Resour. 9, 1460–1466.
Katoh, K., Rozewicki, J., and Yamada, K. D. (2017). MAFFT online service: multiple sequence alignment, interactive sequence choice and visualization. Brief. Bioinform. 20, 1160–1166. doi: 10.1093/bib/bbx108
Katoh, K., and Standley, D. M. (2013). MAFFT multiple sequence alignment software version 7: improvements in performance and usability. Mol. Biol. Evolu. 30, 772–780. doi: 10.1093/molbev/mst010
Kim, J., Ni, G., Kim, T., Chun, J. Y., Kern, E. M., and Park, J. K. (2019). Phylogeography of the highly invasive sugar beet nematode, Heterodera schachtii (Schmidt, 1871), based on microsatellites. Evolu. Appl. 12, 324–336. doi: 10.1111/eva.12719
Kitner, M., Lebeda, A., Sharma, R., Runge, F., Dvoøák, P., Tahir, A., et al. (2015). Coincidence of virulence shifts and population genetic changes of Pseudoperonospora cubensis in the Czech Republic. Plant Pathol. 64, 1461–1470. doi: 10.1111/ppa.12370
Kitner, M., Runge, F., Lebeda, A., Vaculná, L., Sedláková, B., and Thines, M. (2021). Pseudoperonospora humuli might be an introduced species in Central Europe with low genetic diversity but high distribution potential. Eur. J. Plant Pathol. 159, 903–915. doi: 10.1007/s10658-021-02214-x
Korbie, D. J., and Mattick, J. S. (2008). Touchdown PCR for increased specificity and sensitivity in PCR amplification. Nat. Protocols 3, 1452–1456. doi: 10.1038/nprot.2008.133
Kurtz, S., Phillippy, A., Delcher, A. L., Smoot, M., Shumway, M., Antonescu, C., et al. (2004). Versatile and open software for comparing large genomes. Geno. Biol. 5:R12.
Lee, J. H., Park, M. H., and Lee, S. (2016). Identification of Pseudoperonospora cubensis using real-time PCR and high resolution melting (HRM) analysis. J. Gene. Plant Pathol. 82, 110–115. doi: 10.1007/s10327-016-0646-y
Lischer, H. E., and Excoffier, L. (2012). PGDSpider: an automated data conversion tool for connecting population genetics and genomics programs. Bioinformatics 28, 298–299. doi: 10.1093/bioinformatics/btr642
McGowan, J., and Fitzpatrick, D. A. (2020). Recent advances in oomycete genomics. Adv. Genet. 105, 175–228. doi: 10.1016/bs.adgen.2020.03.001
Michalakis, Y., and Excoffier, L. (1996). A generic estimation of population subdivision using distances between alleles with special reference for microsatellite loci. Genetics 142, 1061–1064. doi: 10.1093/genetics/142.3.1061
Mitchell, M. N., Ocamb, C. M., Grunwald, N. J., Mancino, L. E., and Gent, D. H. (2011). Genetic and pathogenic relatedness of Pseudoperonospora cubensis and P. humuli. Phytopathology 101, 805–818. doi: 10.1094/phyto-10-10-0270
Naegele, R., Quesada-Ocampo, L., Kurjan, J., Saude, C., and Hausbeck, M. (2016). Regional and temporal population structure of Pseudoperonospora cubensis in Michigan and Ontario. Phytopathology 106, 372–379. doi: 10.1094/phyto-02-15-0043-r
Nattestad, M., and Schatz, M. C. (2016). Assemblytics: a web analytics tool for the detection of variants from an assembly. Bioinformatics 32, 3021–3023. doi: 10.1093/bioinformatics/btw369
Nielsen, R., Tarpy, D. R., and Reeve, H. K. (2003). Estimating effective paternity number in social insects and the effective number of alleles in a population. Mol. Ecol. 12, 3157–3164. doi: 10.1046/j.1365-294x.2003.01994.x
Nowicki, M., Hadziabdic, D., Trigiano, R. N., Runge, F., Thines, M., Boggess, S. L., et al. (2021). Microsatellite markers from Peronospora tabacina, the cause of blue mold of tobacco, reveal species origin, population structure, and high gene flow. Phytopathology [Epub ahead of print].
Nowicki, M., Nowakowska, M., Wrzesińska, M., and Kozik, E. U. (2015). “Development of LAMP-HRM for sensitive and specific detection of Phytophthora infestans,” in Brasov, Romania: DLO Foundation, ed. H. T. A. M. Schepers 237–238.
Ojiambo, P. S., Gent, D. H., Quesada-Ocampo, L. M., Hausbeck, M. K., and Holmes, G. J. (2015). Epidemiology and population biology of Pseudoperonospora cubensis: a model system for management of downy mildews. Ann. Rev. Phytopathol. 53, 223–246. doi: 10.1146/annurev-phyto-080614-120048
Oksanen, J., Blanchet, F. G., Kindt, R., Legendre, P., Minchin, P. R., O’hara, R., et al. (2013). Package ‘vegan’. Commun. Ecol. Package 2, 1–295.
Paradis, E., and Schliep, K. (2019). ape 5.0: an environment for modern phylogenetics and evolutionary analyses in R. Bioinformatics 35, 526–528. doi: 10.1093/bioinformatics/bty633
Peakall, R., and Smouse, P. E. (2012). GenAlEx 6.5: genetic analysis in excel. population genetic software for teaching and researchan update. Bioinformatics 28, 2537–2539. doi: 10.1093/bioinformatics/bts460
Piry, S., Luikart, G., and Cornuet, J. (1999). BOTTLENECK: a computer program for detecting recent reductions in the effective population size using allele frequency data. J. Heredity 90, 502–503. doi: 10.1093/jhered/90.4.502
Polat, Ý, Baysal, Ö, Mercati, F., Kitner, M., Cohen, Y., Lebeda, A., et al. (2014). Characterization of Pseudoperonospora cubensis isolates from Europe and Asia using ISSR and SRAP molecular markers. Eur. J. Plant Pathol. 139, 641–653. doi: 10.1007/s10658-014-0420-y
Pritchard, J. K., Stephens, M., and Donnelly, P. (2000). Inference of population structure using multilocus genotype data. Genetics 155, 945–959. doi: 10.1093/genetics/155.2.945
Quesada-Ocampo, L., Granke, L., Olsen, J., Gutting, H., Runge, F., Thines, M., et al. (2012). The genetic structure of Pseudoperonospora cubensis populations. Plant Dis. 96, 1459–1470. doi: 10.1094/pdis-11-11-0943-re
R Core Team, R. (2017). R: A Language and Environment for Statistical Computing. Vienna: R Foundation for Statistical Computing.
Rahman, A., Gongora-Castillo, E., Bowman, M. J., Childs, K. L., Gent, D. H., Martin, F. N., et al. (2019). Genome sequencing and transcriptome analysis of the hop downy mildew pathogen Pseudoperonospora humuli reveal species-specific genes for molecular detection. Phytopathology 109, 1354–1366. doi: 10.1094/phyto-11-18-0431-r
Restrepo, S., Tabima, J. F., Mideros, M. F., Grünwald, N. J., and Matute, D. R. (2014). Speciation in fungal and oomycete plant pathogens. Ann. Rev. Phytopathol. 52, 289–316. doi: 10.1146/annurev-phyto-102313-050056
Reuveni, M., Eyal, H., and Cohen, Y. (1980). Development of resistance to metalaxyl in Pseudoperonospora cubensis. Plant Dis. 64, 1108–1109. doi: 10.1094/pd-64-1108
Ripley, B., Venables, B., Bates, D. M., Hornik, K., Gebhardt, A., Firth, D., et al. (2013). Package ‘mass’. Cran R 538, 113–120.
Rodenburg, S. Y., De Ridder, D., Govers, F., and Seidl, M. F. (2020). Oomycete metabolism is highly dynamic and reflects lifestyle adaptations. BioRxiv:2020.2002.2012.941195
Rubinsztein, D. C., Amos, W., Leggo, J., Goodburn, S., Jain, S., Li, S.-H., et al. (1995). Microsatellite evolutionevidence for directionality and variation in rate between species. Nat. Genet. 10:337. doi: 10.1038/ng0795-337
Runge, F., Choi, Y.-J., and Thines, M. (2011). Phylogenetic investigations in the genus Pseudoperonospora reveal overlooked species and cryptic diversity in the P. cubensis species cluster. Eur. J. Plant Pathol. 129, 135–146. doi: 10.1007/s10658-010-9714-x
Runge, F., and Thines, M. (2012). Reevaluation of host specificity of the closely related species Pseudoperonospora humuli and P. cubensis. Plant Dis. 96, 55–61. doi: 10.1094/pdis-01-11-0035
Sarris, P., Abdelhalim, M., Kitner, M., Skandalis, N., Panopoulos, N., Doulis, A., et al. (2009). Molecular polymorphisms between populations of Pseudoperonospora cubensis from Greece and the Czech Republic and the phytopathological and phylogenetic implications. Plant Pathol. 58, 933–943. doi: 10.1111/j.1365-3059.2009.02093.x
Savory, E. A., Granke, L. L., Quesada-Ocampo, L. M., Varbanova, M., Hausbeck, M. K., and Day, B. (2011). The cucurbit downy mildew pathogen Pseudoperonospora cubensis. Mol. Plant Pathol. 12, 217–226. doi: 10.1111/j.1364-3703.2010.00670.x
Savory, E. A., Zou, C., Adhikari, B. N., Hamilton, J. P., Buell, C. R., Shiu, S.-H., et al. (2012). Alternative splicing of a multi-drug transporter from Pseudoperonospora cubensis generates an RXLR effector protein that elicits a rapid cell death. PLoS One 7:e34701. doi: 10.1371/journal.pone.0034701
Silvestro, D., and Michalak, I. (2012). raxmlGUI: a graphical front-end for RAxML. Organisms Div. Evolu. 12, 335–337. doi: 10.1007/s13127-011-0056-0
Slatkin, M. (1995). A measure of population subdivision based on microsatellite allele frequencies. Genetics 139, 457–462. doi: 10.1093/genetics/139.1.457
Spring, O., Gomez-Zeledon, J., Hadziabdic, D., Trigiano, R. N., Thines, M., and Lebeda, A. (2018). Biological characteristics and assessment of virulence diversity in pathosystems of economically important biotrophic oomycetes. Crit. Rev. Plant Sci. 37, 439–495. doi: 10.1080/07352689.2018.1530848
Stackhouse, T. L. (2019). Thousand Cankers Disease Diagnosis With Conventional Electrophoresis and TaqMan Probes. Knoxville TEN: University of Tennessee.
Stamatakis, A. (2014). RAxML version 8: a tool for phylogenetic analysis and post-analysis of large phylogenies. Bioinformatics 30, 1312–1313. doi: 10.1093/bioinformatics/btu033
Stukenbrock, E. H. (2013). Evolution, selection and isolation: a genomic view of speciation in fungal plant pathogens. New Phytol. 199, 895–907. doi: 10.1111/nph.12374
Summers, C. F., Adair, N. L., Gent, D. H., McGrath, M. T., and Smart, C. D. (2015a). Pseudoperonospora cubensis and P. humuli detection using species-specific probes and high definition melt curve analysis. Canad. J. Plant Pathol. 37, 315–330. doi: 10.1080/07060661.2015.1053989
Summers, C. F., Gulliford, C. M., Carlson, C. H., Lillis, J. A., Carlson, M. O., Cadle-Davidson, L., et al. (2015b). Identification of genetic variation between obligate plant pathogens Pseudoperonospora cubensis and P. humuli using RNA sequencing and genotyping-by-sequencing. PLoS One 10:e0143665. doi: 10.1371/journal.pone.0143665
Telle, S., and Thines, M. (2008). Amplification of cox2 (∽ 620 bp) from 2 mg of up to 129 years old herbarium specimens, comparing 19 extraction methods and 15 polymerases. PLoS One 3:e3584. doi: 10.1371/journal.pone.0003584
Thines, M. (2019). An evolutionary framework for host shifts–jumping ships for survival. New Phytol. 224, 605–617. doi: 10.1111/nph.16092
Thines, M., and Choi, Y. J. (2016). Evolution, diversity, and taxonomy of the Peronosporaceae, with focus on the genus Peronospora. Phytopathology 106, 6–18. doi: 10.1094/phyto-05-15-0127-rvw
Thomas, A., Carbone, I., Choe, K., Quesada-Ocampo, L. M., and Ojiambo, P. S. (2017a). Resurgence of cucurbit downy mildew in the United States: Insights from comparative genomic analysis of Pseudoperonospora cubensis. Ecol. Evolu. 7, 6231–6246. doi: 10.1002/ece3.3194
Thomas, A., Carbone, I., Cohen, Y., and Ojiambo, P. S. (2017b). Occurrence and distribution of mating types of Pseudoperonospora cubensis in the United States. Phytopathology 107, 313–321. doi: 10.1094/phyto-06-16-0236-r
Trigiano, R. N., Wadl, P. A., Dean, D., Hadziabdic, D., Scheffler, B. E., Runge, F., et al. (2012). Ten polymorphic microsatellite loci identified from a small insert genomic library for Peronospora tabacina. Mycologia 104, 633–640. doi: 10.3852/11-288
Voglmayr, H., and Greilhuber, J. (1998). Genome size determination in Peronosporales (Oomycota) by Feulgen image analysis. Fungal Genet. Biol. 25, 181–195. doi: 10.1006/fgbi.1998.1097
Wallace, E. C., D’Arcangelo, K. N., and Quesada-Ocampo, L. M. (2020). Population analyses reveal two host-adapted clades of Pseudoperonospora cubensis, the causal agent of cucurbit downy mildew, on commercial and wild cucurbits. Phytopathology 110, 1578–1587.
Wallace, E. C., and Quesada-Ocampo, L. M. (2017). Analysis of microsatellites from the transcriptome of downy mildew pathogens and their application for characterization of Pseudoperonospora populations. PeerJ 5:e3266. doi: 10.7717/peerj.3266
Wang, X., Rinehart, T. A., Wadl, P. A., Spiers, J. M., Hadziabdic, D., Windham, M. T., et al. (2009). A new electrophoresis technique to separate microsatellite alleles. Afr. J. Biotechnol. 8, 2432–2436.
Wang, X., Trigiano, R., Windham, M., DeVries, R., Scheffler, B., Rinehart, T., et al. (2007). A simple PCR procedure for discovering microsatellites from small insert libraries. Mol. Ecol. Notes 7, 558–561. doi: 10.1111/j.1471-8286.2006.01655.x
Keywords: oomycete, obligate pathogens, downy mildew, speciation, evolution, genotyping, host specificity
Citation: Nowicki M, Hadziabdic D, Trigiano RN, Boggess SL, Kanetis L, Wadl PA, Ojiambo PS, Cubeta MA, Spring O, Thines M, Runge F and Scheffler BE (2021) “Jumping Jack”: Genomic Microsatellites Underscore the Distinctiveness of Closely Related Pseudoperonospora cubensis and Pseudoperonospora humuli and Provide New Insights Into Their Evolutionary Past. Front. Microbiol. 12:686759. doi: 10.3389/fmicb.2021.686759
Received: 06 April 2021; Accepted: 09 June 2021;
Published: 14 July 2021.
Edited by:
Omer Frenkel, Agricultural Research Organization (ARO), IsraelReviewed by:
Rachel Naegele, San Joaquin Valley Agricultural Sciences Center (USDA ARS), United StatesCatalina Salgado-Salazar, United States Department of Agriculture (USDA), United States
Copyright © 2021 Nowicki, Hadziabdic, Trigiano, Boggess, Kanetis, Wadl, Ojiambo, Cubeta, Spring, Thines, Runge and Scheffler. This is an open-access article distributed under the terms of the Creative Commons Attribution License (CC BY). The use, distribution or reproduction in other forums is permitted, provided the original author(s) and the copyright owner(s) are credited and that the original publication in this journal is cited, in accordance with accepted academic practice. No use, distribution or reproduction is permitted which does not comply with these terms.
*Correspondence: Marcin Nowicki, bW5vd2lja2lAdXRrLmVkdQ==
†These authors have contributed equally to this work