 Hai Xu1,2,3
 Xi Bao2Weiming Hong1Anping Wang1Kaimin Wang4Hongyan Dong1
 Jibo Hou2
 Roshini Govinden3Bihua Deng2,5*
 Hafizah Y. Chenia3*
- 1Jiangsu Key Laboratory for High-Tech Research and Development of Veterinary Biopharmaceuticals, Jiangsu Agri-Animal Husbandry Vocational College, Taizhou, China
- 2Institute of Veterinary Immunology & Engineering, Jiangsu Academy of Agricultural Science, Nanjing, China
- 3School of Life Sciences, College of Agriculture, Engineering and Science, University of KwaZulu-Natal, Durban, South Africa
- 4Animal, Plant and Food Test Center of Nanjing Customs, Nanjing, China
- 5Jiangsu Co-Innovation Center for Prevention and Control of Important Animal Infectious Diseases and Zoonoses, Yangzhou, China
Bacteriophage T7 gene 17.5 coding for the only known holin is one of the components of its lysis system, but the holin activity in T7 is more complex than a single gene, and evidence points to the existence of additional T7 genes with holin activity. In this study, a T7 phage with a gene 17.5 deletion (T7-△holin) was rescued and its biological characteristics and effect on cell lysis were determined. Furthermore, the genomic evolution of mutant phage T7-△holin during serial passage was assessed by whole-genome sequencing analysis. It was observed that deletion of gene 17.5 from phage T7 delays lysis time and enlarges the phage burst size; however, this biological characteristic recovered to normal lysis levels during serial passage. Scanning electron microscopy showed that the two opposite ends of E. coli BL21 cells swell post-T7-△holin infection rather than drilling holes on cell membrane when compared with T7 wild-type infection. No visible progeny phage particle accumulation was observed inside the E. coli BL21 cells by transmission electron microscopy. Following serial passage of T7-△holin from the 1st to 20th generations, the mRNA levels of gene 3.5 and gene 19.5 were upregulated and several mutation sites were discovered, especially two missense mutations in gene 19.5, which indicate a potential contribution to the evolution of the T7-△holin. Although the burst size of T7-△holin increased, high titer cultivation of T7-△holin was not achieved by optimizing the culture process. Accordingly, these results suggest that gene 19.5 is a potential lysis-related component that needs to be studied further and that the T7-△holin strain with its gene 17.5 deletion is not adequate to establish the high-titer phage cultivation process.
Introduction
Virulent T7 phage is one of seven phages first identified in Escherichia coli in 1945 (Demerec and Fano, 1945). The genome of T7 phages is ∼40 kb and is packed into the polyhedral head formed by the capsid proteins. The capsid is composed predominantly of the products of gene 10, which encodes two kinds of protein, i.e., gp10A (344 aa) and gp10B (397 aa). Due to a reading frame shift at the end of gene 10, gp10A and gp10B are expressed at the ratio of 9:1 under normal culture conditions (Sipley et al., 1991). However, the proportion of gp10A and gp10B may vary according to conditions and does not affect the integrity of phage particles (Condron et al., 1991; Deng et al., 2018). Based on the common principle of phage display, exogenous peptides are fused with a phage capsid protein, which allows them to be displayed on the surface of the phage particle. Thus, T7 phages have been employed in a phage surface display system (Rosenberg et al., 1996) and commercialized by Novagen.
Since George Smith first established the phage display system in 1985, numerous bacteriophage species have been engineered for phage display, including M13, f1, T4, and phage λ (Zambrano-Mila et al., 2020). Phage display technology is beneficial to several biological fields due to its powerful mechanism for production of high copy numbers of peptides or proteins, the analysis of protein interactions (Pande et al., 2010), the isolation of functional compounds, and the study of antigen–antibody binding (Hamzeh-Mivehroud et al., 2013). Various new applications in the biotechnology industry include phages playing a key role as delivery vehicles for proteins and DNA vaccines, as gene therapy delivery vehicles, and as detection tools for pathogenic organisms (Clark and March, 2006). These applications may require large quantities of phage particles, but the infection and reproduction rates are low, which is often the case in an engineered phage (Krysiak-Baltyn et al., 2018). Consequently, there is an increased demand for high-titer or large-scale phage culture technology.
Cost-effective and scalable methods for phage production are thus required. Previous studies have established computational models to assist the optimization of phage production processes, especially in the context of large-scale phage production (Krysiak-Baltyn et al., 2018). Moreover, the timing of lysis is an important phage trait that directly determines the burst size. A short lysis duration of phage-infected cells results in the drawback of releasing few progeny particles, while a prolonged lysis time allows the phage to utilize the host bacteria more efficiently, producing more progeny particles. The two-component genetic model of lysis is essential to most large double-stranded phages, although the specific control mechanisms vary (Wang et al., 2000; Xu et al., 2004, 2005). This two-component model involves a phage-encoded endolysin and holin. Furthermore, it has also been demonstrated that spanin, a third component, plays a key role in the final step of host lysis (Rajaure et al., 2015). The holin is a small membrane protein that accumulates in the inner membrane and suddenly forms holes and has been proposed as a clock to control the timing of lysis (Young, 1992). The only known holin in T7 phage is encoded by gene 17.5; however, gene 17.5 is non-essential for T7 phage, which suggests the possibility of additional holin genes being present (Heineman and Bull, 2007). This then suggests the potential of regulating holin to indirectly control the lysis time in order to achieve the goal of high-titer cultivation.
In this study, a gene 17.5 (holin) deletion T7 phage was constructed and serially passaged for 20 generations to evaluate the evolution of biological characteristics during this process. We verified that the holin gene is non-essential for T7 life cycle but delayed the lysis time, corroborating a previous study (Heineman et al., 2009). Our current study results demonstrate for the first time the evolution of a T7-△holin phage during the serial passage process. It was observed that the biological characteristics of the T7-△holin phage gradually tended toward the wild-type (wt) T7 phage during the continuous passage process. Moreover, whole-genome sequencing (WGS) analysis identified several mutations distributed in the T7-△holin phage genome, which could not be correlated with the phage biological characteristics. An upregulation of mRNA levels was observed in the T7-△holin phage, especially genes that directly or potentially participate in the lysis process.
Materials and Methods
Bacteria and Phage Preparation
T7 select 415-1b phage was purchased from Merck KGaA (Darmstadt, Germany). T7 select 415-1b phage (referred to as T7-wt) has the same skeleton sequence (Figure 1A) with the original T7 phage (GenBank accession number V01146; Dunn and Studier, 1983) except for two main deletions at sites 579-2717 and 11163-11515 (Nucleotide numbers are those of original T7 phage) and a multiple cloning site construction at the end of p10A gene. E. coli BL21 was used as the host organism for T7 phage infection and cultivation. Phage lysate was prepared by adding phage stock with a multiplicity of infection (MOI) = 1:1,000 into the E. coli BL21 host culture with an OD600 nm of ∼1.0 and shaking until the culture was clarified. Phage titer was measured using a previously described double agar overlay plaque assay (Kropinski et al., 2009). Briefly, 100 μl of a dilution of the phage sample was added to 200 μl of a bacterial suspension and incubated at room temperature for 3 min. The mixture was added to 4 ml top agar, gently homogenized, and poured into a 100-mm Petri dish previously prepared with 10 ml of bottom agar. Plates were gently swirled and dried for 5 min and incubated at 37°C for 4 h. E. coli BL21-DE3 carrying pET-32a containing the gene 17.5 insert (BL-holin host) was used as the compensatory host for holin deletion phage.
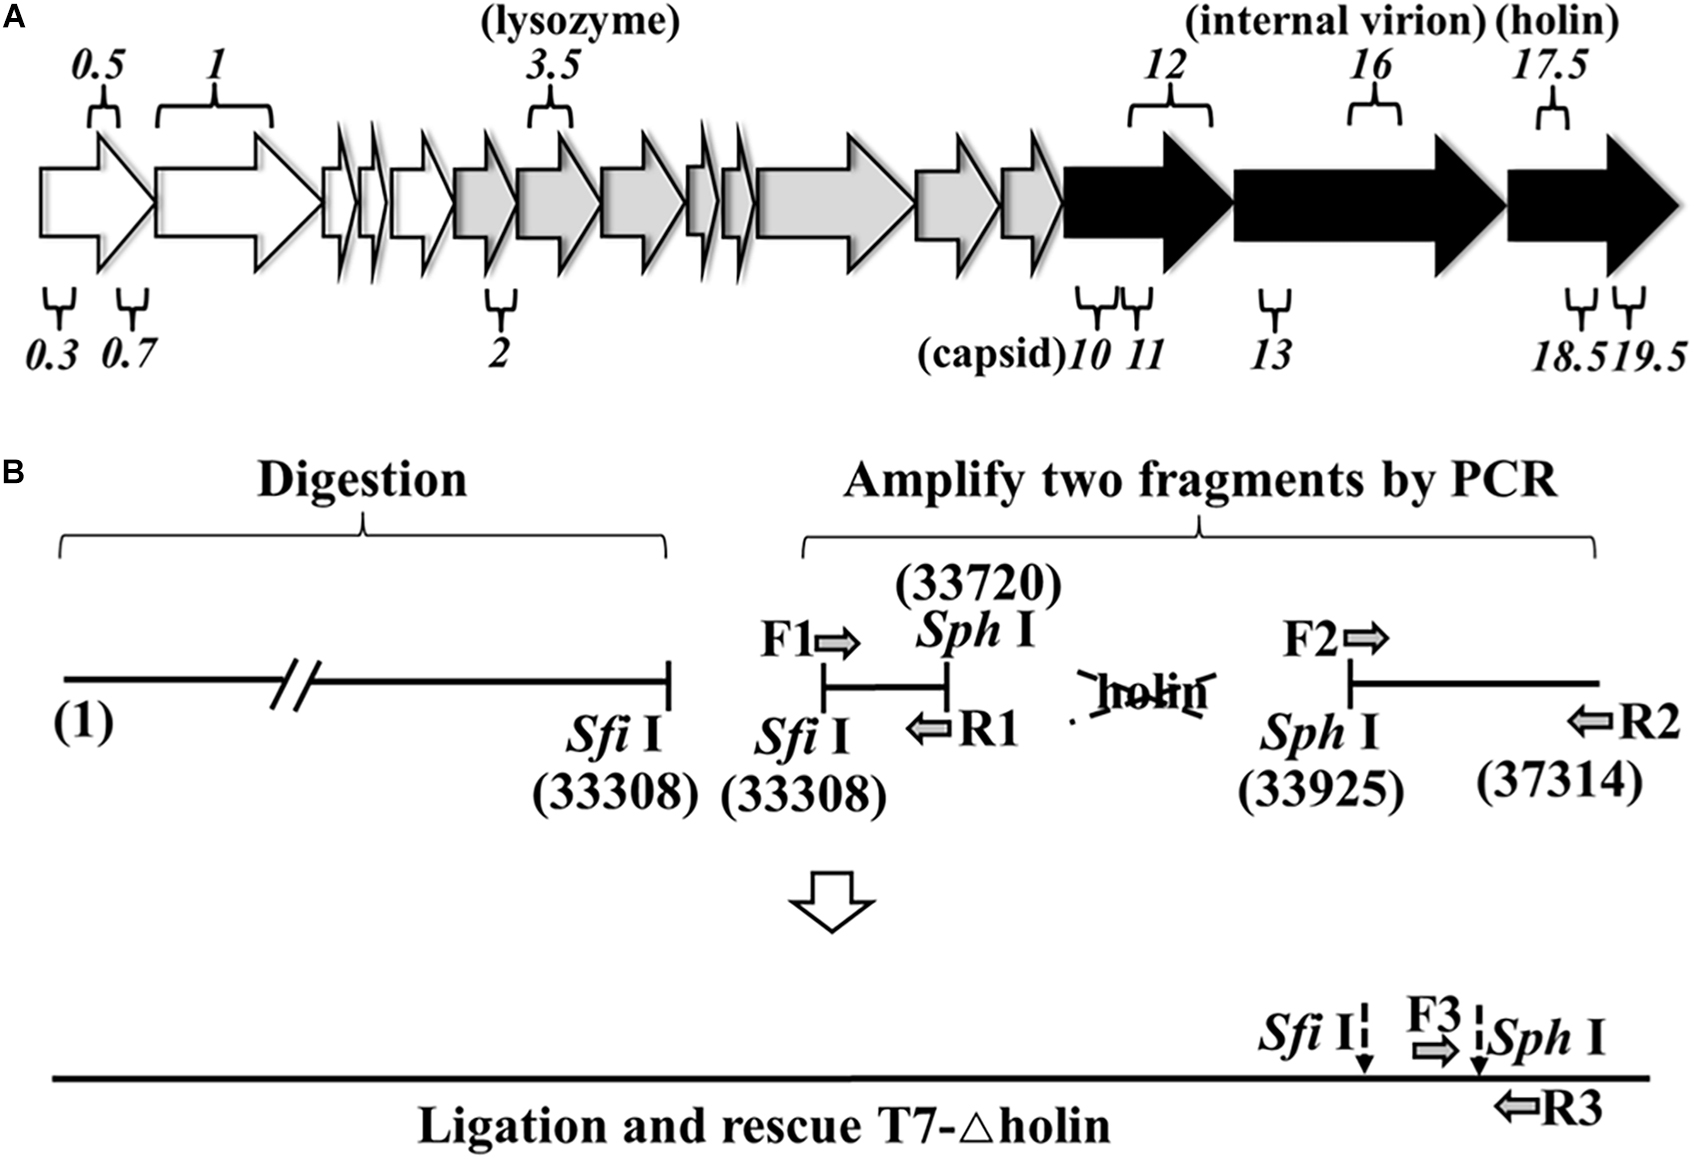
Figure 1. Rescue of T7-△holin mutant phage. (A) Major transcripts from bacteriophage T7 genome. Empty arrows on the left represent early genes, gray arrows in the middle represent intermediate genes, and black arrows on the right represent late genes. Among the 56 known or potential genes, only a selected subset of genes mentioned in the text is shown. The numbers over and under the arrows indicate gene designation. (B) Strategy used to rescue a holin gene deletion mutant phage. The number in bracket stands for the gene position. The dotted arrows indicate the restriction enzyme sites.
Construction of Holin Deletion Phage
For the construction of T7-△holin phage, a gene 17.5 deletion T7 phage was constructed and rescued (Figure 1B) using a previously published strategy (Chan et al., 2005). Briefly, T7-wt phage linear genome was extracted (Pickard, 2009; Jakočiūnė and Moodley, 2018) and digested using SfiI, and the upstream fragments from the single-cut site were gel extracted. The holin deletion fragment was prepared using a PCR-based protocol. A holin upstream part (from SfiI site to T7-wt genomic position 33720) and a holin downstream part (from T7-wt genomic position 33925 to the right terminal position 37314) were PCR amplified using F1/R1, F2/R2 primers, respectively. Moreover, a SphI restriction enzyme site was introduced by primer. The holin deletion genome was ligated using two single restriction sites, SfiI and SphI. The ligation mixture was then combined with T7 phage packaging extract to rescue infective phage particles. Primers F3/R3 were designed by choosing the 300 bp upstream and downstream of the SphI site, and a plaque PCR method was used to identify the correct mutant phage clone. PCR amplimers equivalent to 600 bp were regarded as the correct mutant phage clone and named T7-△holin. All PCR primers that were used in this study are listed in Supplementary Table 1.
Electron Microscopy
For SEM and TEM detection, E. coli BL21 cells were grown to a density of 109 CFU/ml and infected with T7-△holin and T7-wt phage stocks at a MOI of 10. Uninfected cells were used as a control. Samples were taken at 20 min post-infection and fixed with 3% (vol/vol) glutaraldehyde. After 30 min of fixation at room temperature, cells were collected, washed twice with 10 mM potassium phosphate buffer (pH 7.2), and prepared for electron microscopy as described previously (Bamford and Mindich, 1980). Samples were sent to the Testing & Analysis Center at Yangzhou University for SEM and TEM analyses.
Serial Passage of T7-△holin for Experimental Evolution
Serial passage was conducted by adding T7-△holin phage to 20 ml of log-phase E. coli BL21 host cells (OD600 nm of 0.5–1.0) at a low MOI (0.01). The culture was shaken at 37°C until complete lysis of the host cells was obtained. A drop from the previous passage was then added to another 20 ml of a new log-phase E. coli BL21 host culture, and the process was repeated 20 times. If the phage lysate was kept overnight before the next passage, 50 μl of chloroform was added and the mixture was stored at 4°C.
Measurement of Burst Size
Phage burst sizes were measured as previously described (Heineman et al., 2009) with some modification. Briefly, E. coli BL21 cells were agitated until the OD600 nm reached 0.3–0.5 and then infected with phages at a MOI of 0.01. When using a BL-holin host, 1 mM isopropyl β-D-1-thiogalactopyranoside (IPTG) was added when the OD600 nm reached 0.2 and agitation was continued for 30 min. After allowing phages to be adsorbed to host cells for 2 min, cells were centrifuged to discard all the supernatant and immediately diluted 10,000-fold into pre-warmed Luria-Bertani (LB) media, followed by further incubation for 30–35 min. Samples were extracted every 5 min, and a 103 dilution was used for titer measurements made early in the assay while subsequent assays used a 106 dilution in order to more effectively prevent further adsorption. Comparisons between titers with and without chloroform at 5 and 10 min after infection were used to determine the number of unabsorbed phages and thus the number of infected cells. Burst sizes were calculated as the number of phages released per infected cell, and the data from three independent experiments were assessed with a sigmoidal curve model using the least-squares fitting method (SPSS, version 2.0).
Kinetic Assay of Lysis
The kinetics of lysis was assayed as previously described with some modification (Nguyen and Kang, 2014). The E. coli BL21 host was cultured with agitation until an OD600 nm of 0.3 was reached and then infected with phages at a high MOI of 3–4. Adsorption was allowed to proceed for 2 min, and the culture was centrifuged to discard all free phages. The pellet was resuspended in fresh LB medium and allowed to grow at 37°C in a shaking incubator. At every 5 min after infection, 200 μl of the culture was removed and placed into wells of a 96-well plate kept on ice. Cell density was measured at OD600 nm after all samples were taken. A lysis curve and average lysis time were estimated by fitting the data from at least two independent experiments.
Phage Adsorption Assay
The adsorption rates of phage to the E. coli BL21 host was measured as previously described (Nguyen and Kang, 2014). Fresh host cells were prepared with agitation until the logarithmic growth phase was reached and diluted in pre-warmed LB medium to a final concentration of 1 × 10⁷ CFU/ml. E. coli BL21 host cells (5 ml) were pre-warmed at 37°C for 10 min and mixed with phage solution to a final concentration of 1 × 10⁵ PFU/ml in SM buffer. After 5 min of infection at 37°C, 200 μl of mixture was sampled and centrifuged immediately to separate free phages and adsorbed phages. Meanwhile, another 200 μl of mixture was sampled and kept uncentrifuged. The phage titer of both centrifuged (Nf) and uncentrifuged (Nt) phages was determined by the plaque assay using the E. coli BL21 host. The adsorption rate, α, was calculated using the equation α = –0.2 [ln (Nf/Nt)] (Nguyen and Kang, 2014).
Quantification of Phage mRNA Levels
The mRNA levels of phage genes (gene 3.5, 10a, 16, 17, 18.5, and 19.5) in infected host cells were measured quantitatively by reverse transcription followed by real-time quantitative PCR (RT-qPCR) method (Nguyen and Kang, 2014). Total RNA was extracted using RNeasy Protect Bacteria Mini Kit (Qiagen, Hilden, Germany) from phage-infected E. coli BL21 host (15 min post-infection) and reverse transcribed using 15-mer random primers (Takara Bio Inc., Shiga, Japan). Quantitative PCR for target mRNAs was performed using a CFX Connet system (Bio-Rad, CA, United States). E. coli BL21 host 16S rRNA was used as a reference control. The primer details are presented in Supplementary Table 1. All data were analyzed statistically using the two-tailed Student’s t-test (Clokie, 2009).
Whole-Genome Sequencing
Genomic DNA for WGS analysis was extracted from the 1st, 10th, and 20th generations of T7-△holin phage obtained following the serial passage process using the phenol chloroform technique with minor modifications (Pickard, 2009; Jakočiūnė and Moodley, 2018). This involved the whole phage population, which was collected from the respective serial passage generation. Sequencing samples were prepared with the Nextera XT DNA library preparation kit (Illumina, San Diego, CA, United States). The normalized library was sequenced on a MiSeq platform (Illumina, San Diego, CA, United States) with a 300-cycle MiSeq Reagent Micro Kit V2 (Illumina, San Diego, CA, United States). Raw sequencing data were subjected to data cleaning by removing adapters, trimming low-quality ends, depleting sequences with lengths of less than 36 nt, and sequencing quality analysis with FastQC. The taxonomy of cleaned reads was classified using Kraken v0.10.5-beta. Reads of the T7 phage were extracted from the Kraken classification results and de novo assembled with SPAdes (v 3.5.0).
High-Titer Phage Production
The high-titer phage production process was conducted by the optimization of MOI and host cell density. E. coli BL21 was cultured in 200-ml LB medium by agitation at 250 rpm and 37°C, and 10-ml aliquots were taken when the OD600 nm reached 0.5, 1.0, 1.5, respectively. T7-△holin stocks of different generations were prepared and used to infect E. coli BL21 at different MOIs (0.01, 0.001, 0.0001). T7-wt phage was used as a control. The mixed phage–host culture was further agitated at 250 rpm and 37°C until all the host cells were completely lysed. Culture supernatant was collected by centrifugation, and phage titers were determined by the double-layer agar method (Kropinski et al., 2009). The test was repeated three times for each sample, and the mean value was recorded as the final phage titer. The total amount of capsid protein in the lysate was detected by the Dot-ELISA method (Xu et al., 2017), since there was T7 tag attached to the N-terminal of the capsid protein. Briefly, lysate samples that were collected from the cultivation process were serially diluted 10-fold, fixed on nitrocellulose membrane, and probed with horseradish peroxidase (HRP)-labeled anti-T7 tagged monoclonal antibody (1:10,000 dilution) (Merck). Visualization was carried out using an HRP and a diaminobenzidine tetrahydrochloride (DAB) chromogenic development kit (Beyotime, China).
Results
Generating a T7 Phage Mutant by Deleting the Holin Gene
A T7-△holin phage was created by deleting gene 17.5 to evaluate the roles of holin in the T7 phage lytic cycle. As holin is a later expressed gene and is located downstream in the linear genome (Figure 1A), a 204-bp DNA fragment was deleted from the T7-wt genome. T7-wt genome was digested by SfiI, and the upstream fragments from the restriction site were gel extracted (Supplementary Figure 1). Two gene fragments were prepared by PCR, and a SphI site was introduced using the primer (Supplementary Figure 2). Three gene fragments were ligated through the SfiI and SphI site and after being rescued named the T7-△holin phage (Figure 1B). Deletion of the holin gene was confirmed by plaque PCR detection and DNA sequencing analysis. Accordingly, gene 17.5 deletion T7 phage was rescued using E. coli BL21-ED3 carrying a pET-32a containing gene 17.5 insert (BL-holin host) and confirmed.
Electron Microscopy of Host Cells Infected With Phage
In order to elucidate the injury of the host cell membrane after phage infection, both SEM and TEM analyses were conducted. As anticipated, uninfected E. coli BL21 control cells maintained their intact shape (Figures 2A,D), while obvious cell injury was observed in phage-infected cells. Slight differences were observed in membrane lesions following T7-wt and T7-△holin infections. After T7-wt infection, the lysis event was initiated from the pole of the cells as exhibited by indentation of the bacterial cell (Figure 2B). Visible pores appeared on the cell surface, which were partially collapsed by releasing cytoplasmic contents and escape of newly packaged offspring phage particles (Figure 2E). In contrast, after 20 min of T7-△holin infection, bacterial cells exhibited swelling at the poles but still maintained their intact structure (Figure 2C). Subtle interval enlargement was observed between the inner and outer membrane, and suspected phage particles were observed in the cytoplasm (Figure 2F). These results are consistent with a previous finding that T7-wt phage holins form lesions in the host cell inner membrane (Dewey et al., 2010). The shape change of T7-△holin-infected cells indicates that an unknown compensation mechanism exists that is different from T7-wt infection.
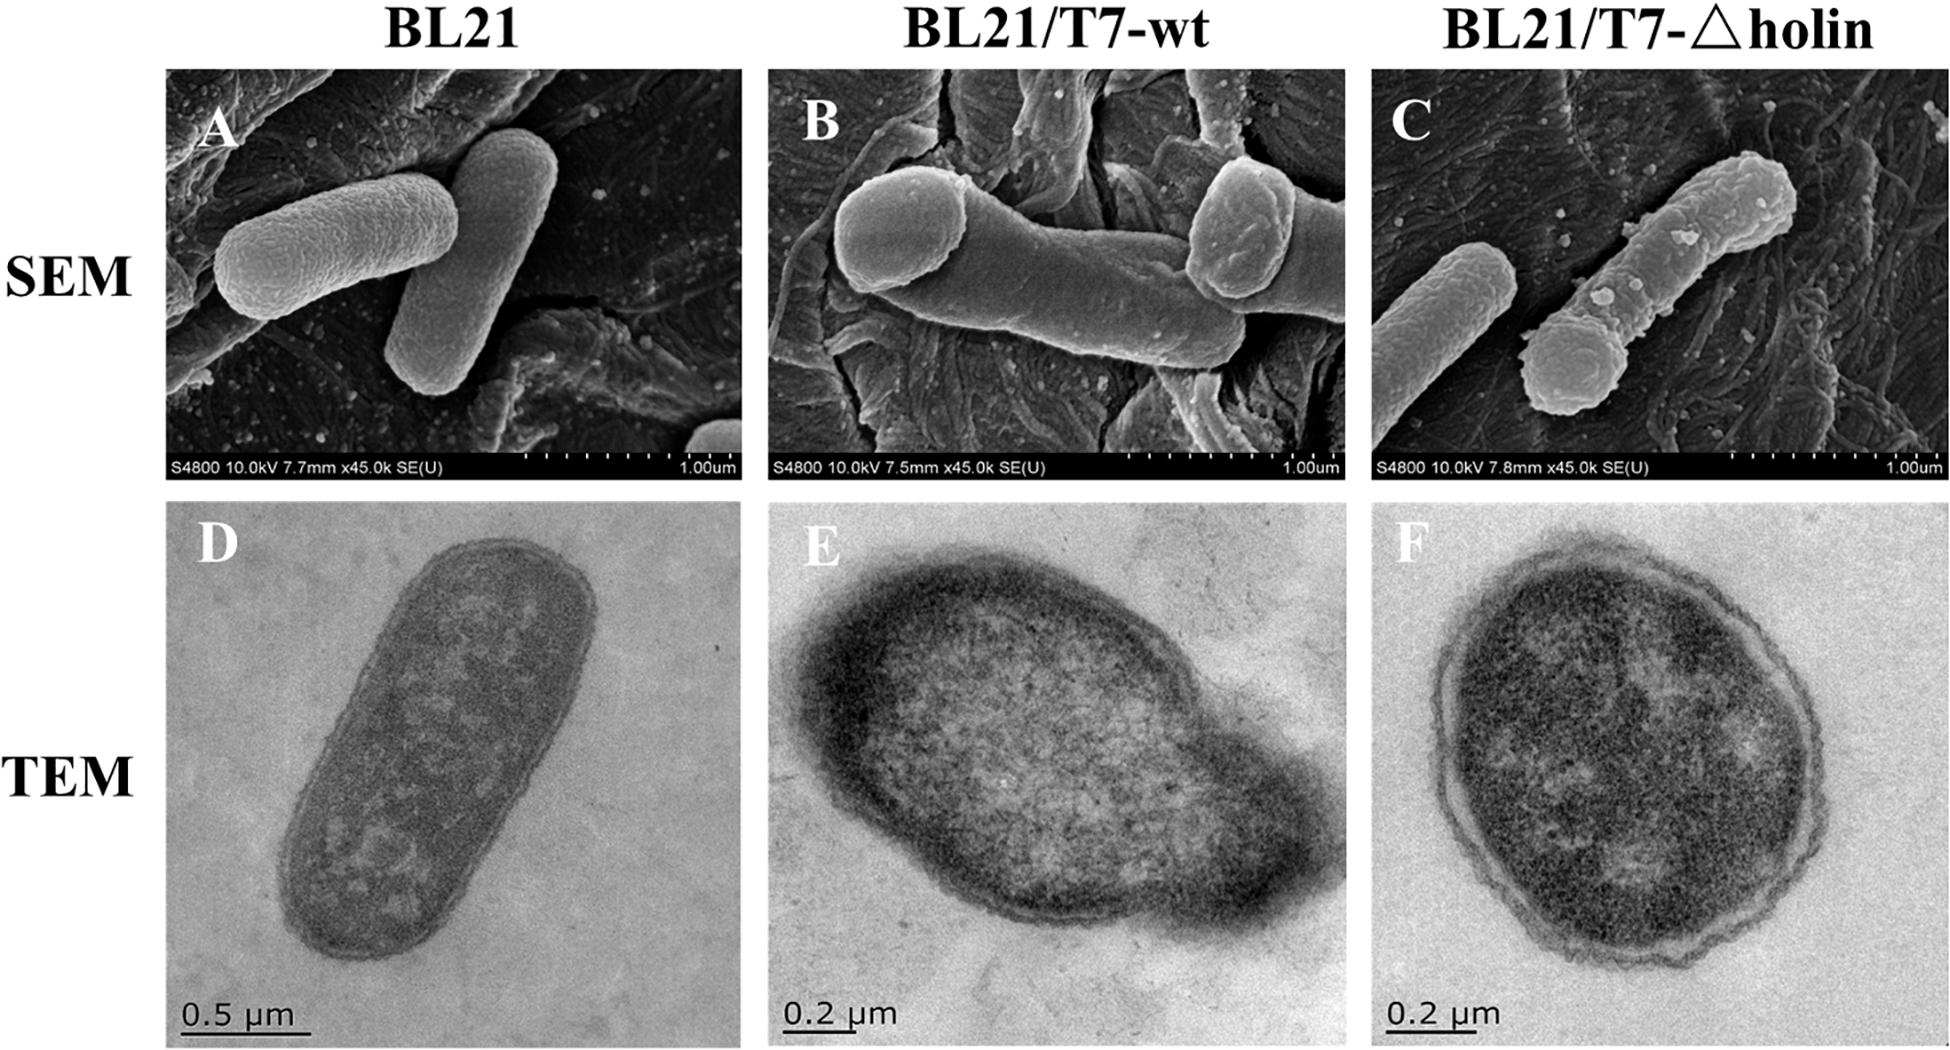
Figure 2. Electron microscopy observation of Escherichia coli BL21 cells infected with T7 phage. (A) SEM of Escherichia coli BL21 cell control. (B) SEM of E. coli BL21 cell infected with T7-wt. (C) SEM of E. coli BL21 cell infected with T7-holin. (D) TEM of E. coli BL21 cell control. (E) TEM of E. coli BL21 cell infected with T7-wt. (F) TEM of E. coli BL21 cell infected with T7-holin.
Phenotypic Characterization of T7-△holin Phage
The 1st, 10th, and 20th generation stocks were prepared, and their phenotypic effects in both E. coli BL21 and BL-holin hosts were assessed (Table 1). With respect to the life cycle of a lytic phage, the burst size, lysis timing, and adsorption rate are important indices of phenotype (Nguyen and Kang, 2014). When measured under the conditions where the E. coli BL21 host was in an early log phase, the burst sizes of T7-wt and T7-△holin phages were 182 ± 5.3 and 221 ± 5.7 (p = 0.002) particles per host, respectively (Figure 3A and Table 1). The T7-△holin phage achieved a burst size 121% that of the burst size of the T7-wt phage (p = 0.002); however, only 175 progeny phage particles were produced when the host bacterium was switched to the E. coli BL-holin strain. Lysis was delayed by approximately 15 min for the T7-△holin phage compared to the T7-wt phage when the E. coli BL21 host was infected (Figure 3B and Table 1). Lysis was also accelerated when T7-△holin phage infected the E. coli BL-holin host. The optimal lysis time correlated positively with adsorption rate, and it has been observed previously that phage strains with higher adsorption rates show more rapid lysis (Shao and Wang, 2008). No significant difference in the adsorption rates of T7-wt and T7-△holin (Figure 3C and Table 1) was observed (p = 0.773). Thus, deletion of holin gene from T7 phage genome led to a delay in lysis time and enlargement of burst size; however, it had no effect upon the phage adsorption to the host bacteria (Table 1).
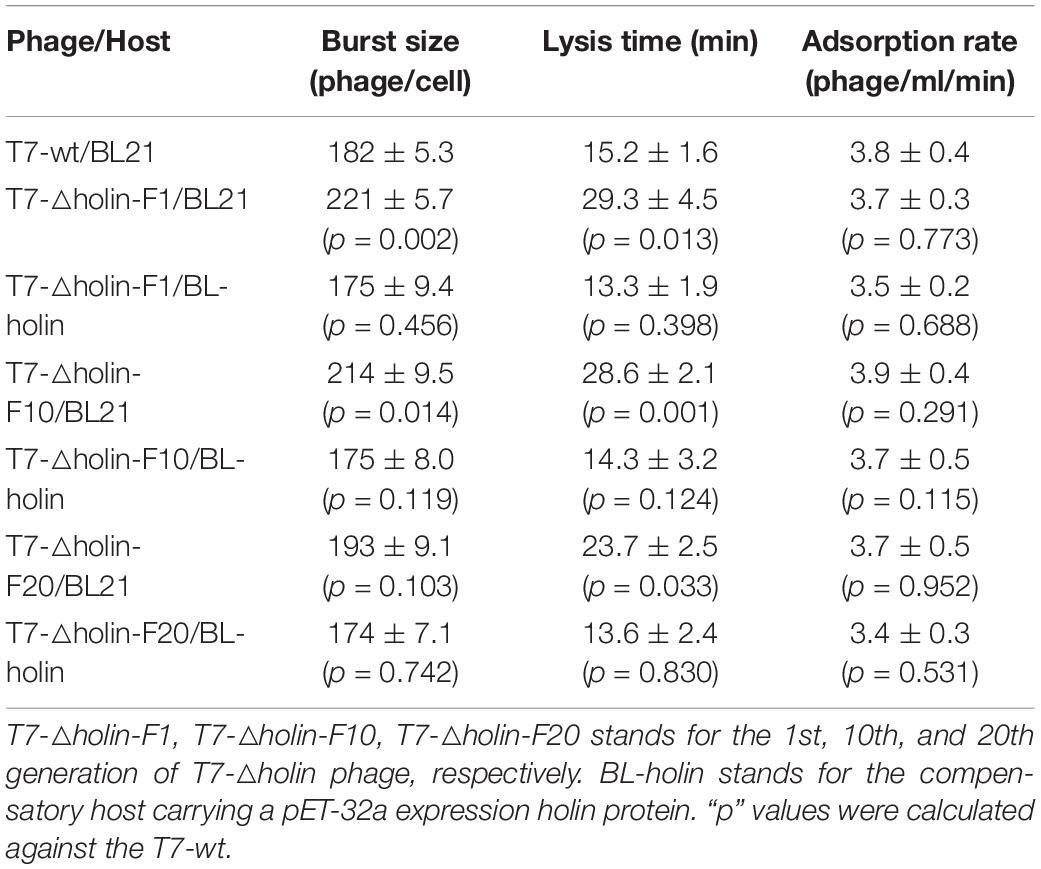
Table 1. Phenotypic characterization of T7-△holin phage infection of Escherichia coli BL21 cells.
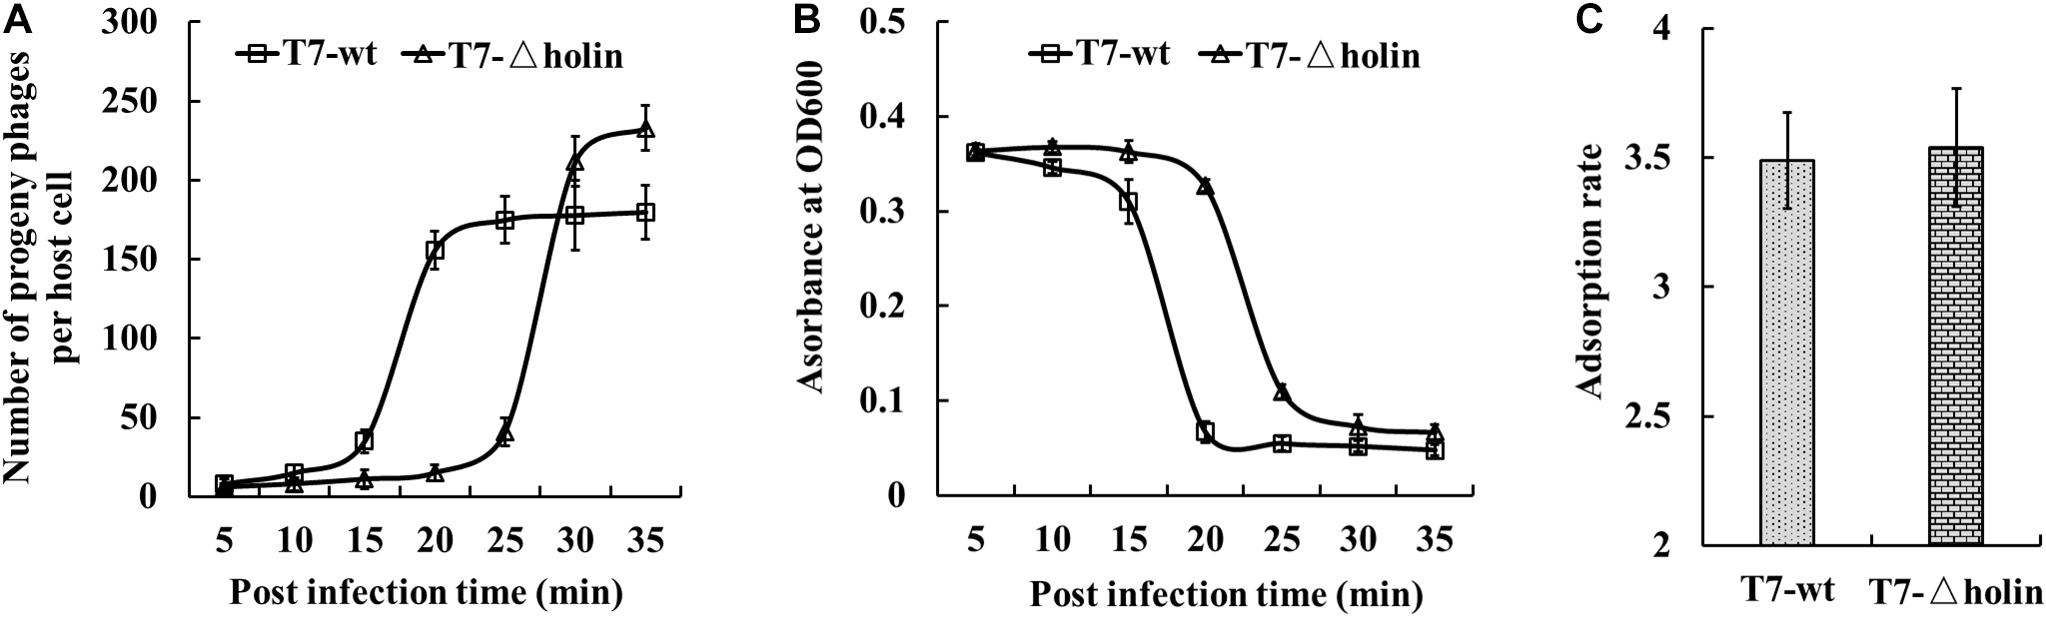
Figure 3. Phenotypic characterization of T7-△holin deletion phage. (A) One-step growth curve for burst size measurement of the T7-wt (squares) and T7-△holin (triangles) phages. (B) Lysis curves for estimation of onset of lysis for T7-wt and T7-△holin phage infections. (C) Adsorption rates measured for the T7-wt and T7-△holin phages. Vertical error bars represent standard deviations.
Serial Passage and Plaque Enlargement Assay
To examine the emergence of adaptive changes induced by passage of T7-△holin phage, the mutant strain was serially passaged 20 times in the E. coli BL21 host. It was hypothesized that after serial passages in the E. coli BL21 host, T7-△holin would gradually adapt to growth without the holin gene, thereby leading to phenotypic and/or genotype changes. As expected, there was burst size shrinkage of T7-△holin after serial passage from 10th generation (214 particles per cell) to the 20th generation (193 particles per cell) in E. coli BL21 host, and lysis accelerated from 28.6 min to 23.7 min (Table 1). However, both the burst size and lysis time of T7-△holin (F1, F10, and F20 generation) were not significantly different in the E. coli BL-holin host (Table 1).
A phage plaque is a clearing in a bacterial lawn, and plaques form via an outward diffusion of phage progeny that preys on surrounding bacteria (Tabib-Salazar et al., 2018). So, the size of phage plaque can serve as an index as to how efficiently a phage developed and produced progeny within an infected bacterial host. As shown in Figure 4A, the plaque size on a lawn of T7-△holin-F1 was barely distinguishable for the first 4 h, in contrast to T7-wt, T7-△holin-F10, and T7-△holin-F20, which had visible plaques on the host lawn. With an increase in incubation time (8, 12, and 16 h), the plaque of T7-wt and T7-△holin-F20 continued to enlarge, while the plaques of T7-△holin-F1 and T7-△holin-F10 increased more slowly (Figure 4B). This difference in plaque size correlated with burst size and lysis time data shown in Table 1. These data indicate that the T7-△holin mutant gradually adapted to the holin deletion and phenotypically recovered with increasing serial passage.
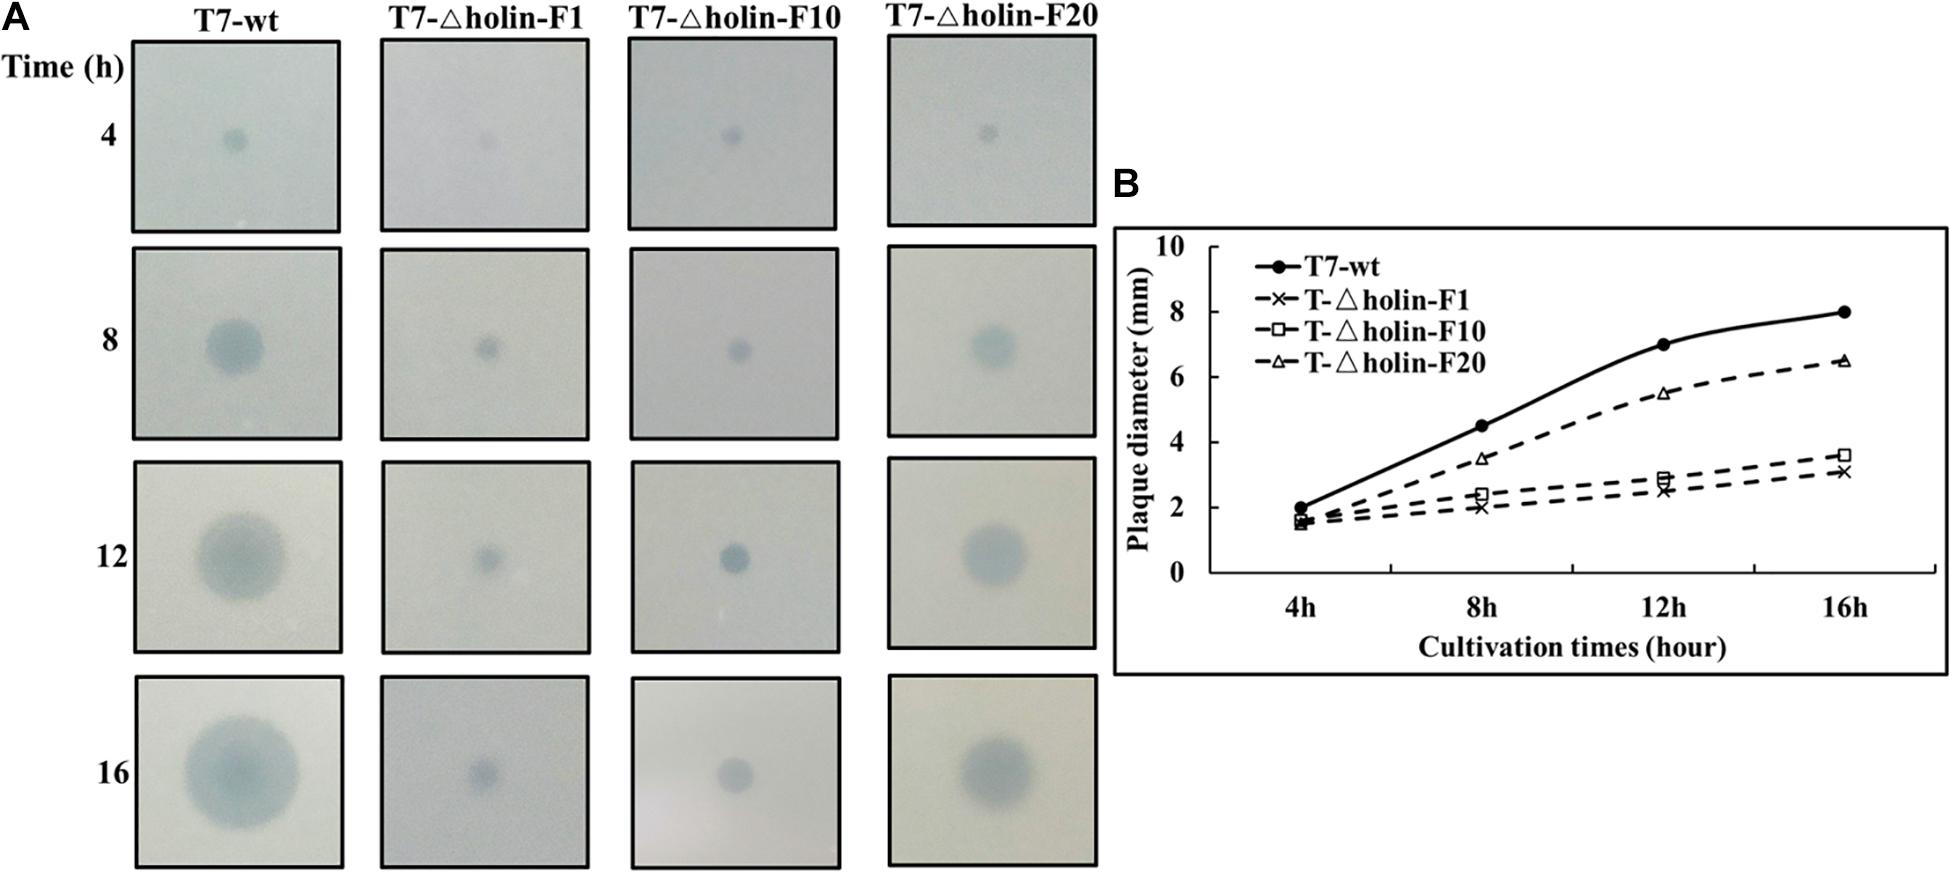
Figure 4. Plaque enlargement assay of T7-wt and T7-△holin. (A) Images of T7-wt and different generations of T7-△holin phage plaques formed on a lawn of Escherichia coli BL21 host cells over a 16-h incubation period. (B) The plaque diameter of T7-wt and T7-△holin phages formed on a lawn of E. coli BL21 host cells over a 16-h incubation period.
mRNA Levels of T7 Capsid, Tail Fiber, and Lysis-Related Proteins
The capsid and tail fibers are two of the major proteins that make up the T7 phage particle. Gene 10a encodes the primary capsid protein that is the outer protective shell of the phage, and gene 17 encodes the tail fiber that is the key protein interacting with the E. coli surface lipopolysaccharide (Lin et al., 2012). Gene 3.5 (lysozyme) and gene 17.5 (holin) comprise the two-component lysis system module of T7 phage, and it has been suggested that genes 16, 18.5, and 19.5 are lysis-related genes, with gene 19.5 being compensatory for loss of holin function (Heineman et al., 2009).
The mRNA levels of these genes (genes 3.5, 10a, 16, 17, 18.5, and 19.5) were quantitatively measured after 10 min of infection using RT-qPCR (Figure 5). The mRNA levels of the major proteins genes 10a and 17 were not significantly different between the T7-wt and three generations of T7-△holin (p > 0.05), as well as those of the two potential lysis-related genes 16 and 18.5. However, mRNA levels corresponding to genes 3.5 and 19.5 were significantly elevated in the T7-△holin infection. Gene 3.5 mRNA levels increased 1. 8-, 2. 0-, and 6.4-fold for T7-△holin-F1, T7-△holin-F10, and T7-△holin-F20, respectively. Gene 19.5 mRNA levels increased 1. 7-, 2. 7-, and 4.5-fold for T7-△holin-F1, T7-△holin-F10, and T7-△holin-F20, respectively. These data suggested that the upregulated expression of genes 3.5 and 19.5 may compensate for the lack of the holin protein and resulted in a more rapid onset of lysis compared to the T7-△holin-F1 mutant.
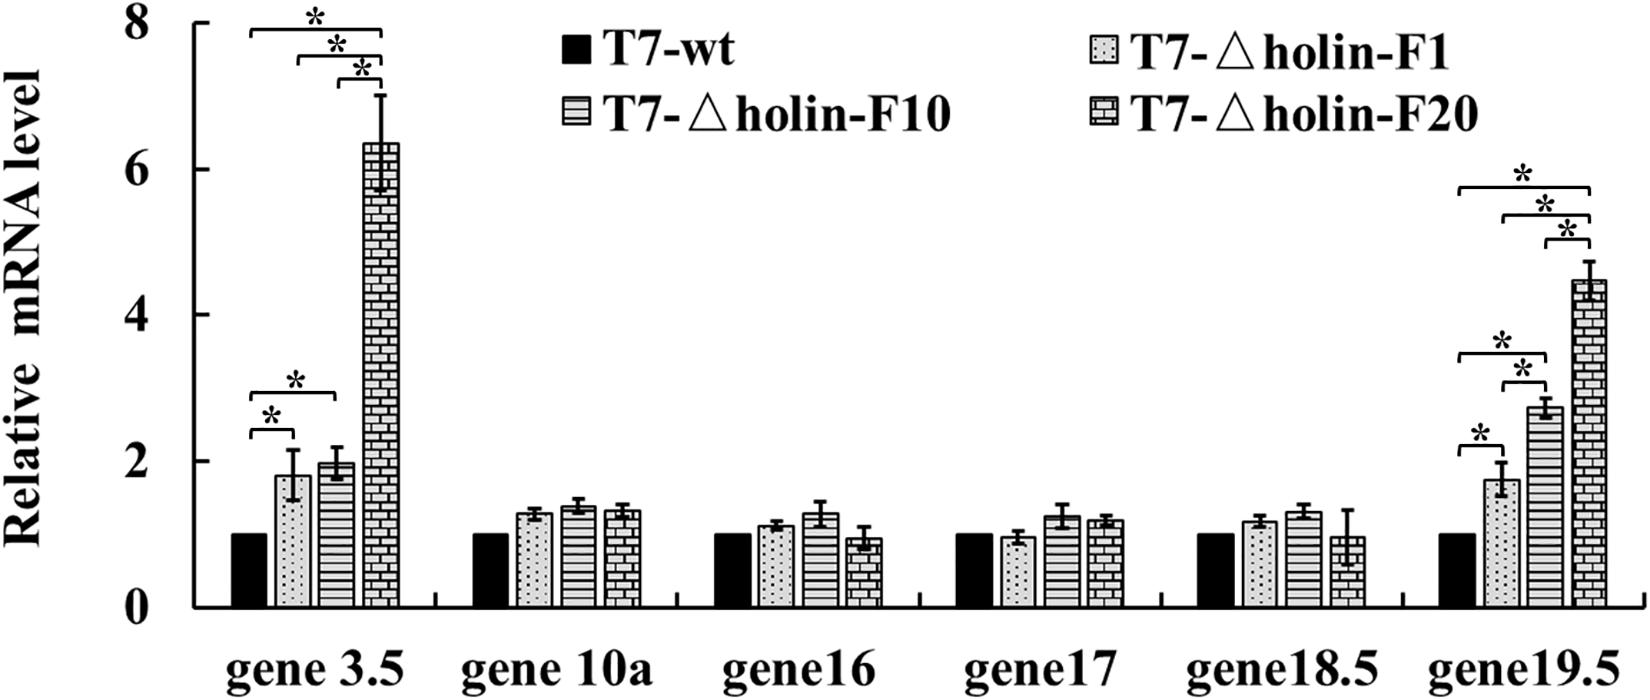
Figure 5. The mRNA levels of T7-wt and T7-△holin during infection. The mRNA levels of several T7 genes in the T7-wt and the 1st, 10th, and 20th generations of the T7-△holin phage infections measured using quantitative real-time PCR. Escherichia coli BL21 cell 16S rRNA was set as a reference control. All data were statistically analyzed using the two-tailed Student’s t-test. Bars with a * indicate significant difference (p < 0.05).
Genetic Evolution During Serial Passage
A WGS approach was undertaken to map potential compensatory mutations (Table 2) and identify genes responsible for the adaptation of T7-△holin during the serial passage process. WGS data of three different generations of T7-△holin (1st, 10th, and 20th) were generated and compared to those of the T7-wt parent strain. Point mutations were distributed throughout the entire genome, and the mutation frequency increased with the serial passage generations. Nonsense mutants predominated and were observed in non-essential genes 1.6, 1.7, 2.8, and 5.3, as well as essential genes 5, 15, 16, and 19. Examination of the two lysis-related genes 16 and 19.5 (Table 2) indicated missense mutations from the 1st generation (F1) followed by accumulation of another mutation in the 20th generation (F20). Surprisingly, no mutations arose in the main lysis gene 3.5 (lysozyme) during this passage process. Heineman et al. (2009) have previously described the lytic activity of gene 16 and identified gene 19.5 as a possible gene with lytic function. Since the current sequencing data (Table 2) indicated that no mutations occurred in the lysis gene 3.5, it may be speculated that the missense mutations in genes 16 and 19.5 could be contributing to the adaptation of T7-△holin phage during the E. coli BL21 host infection process.
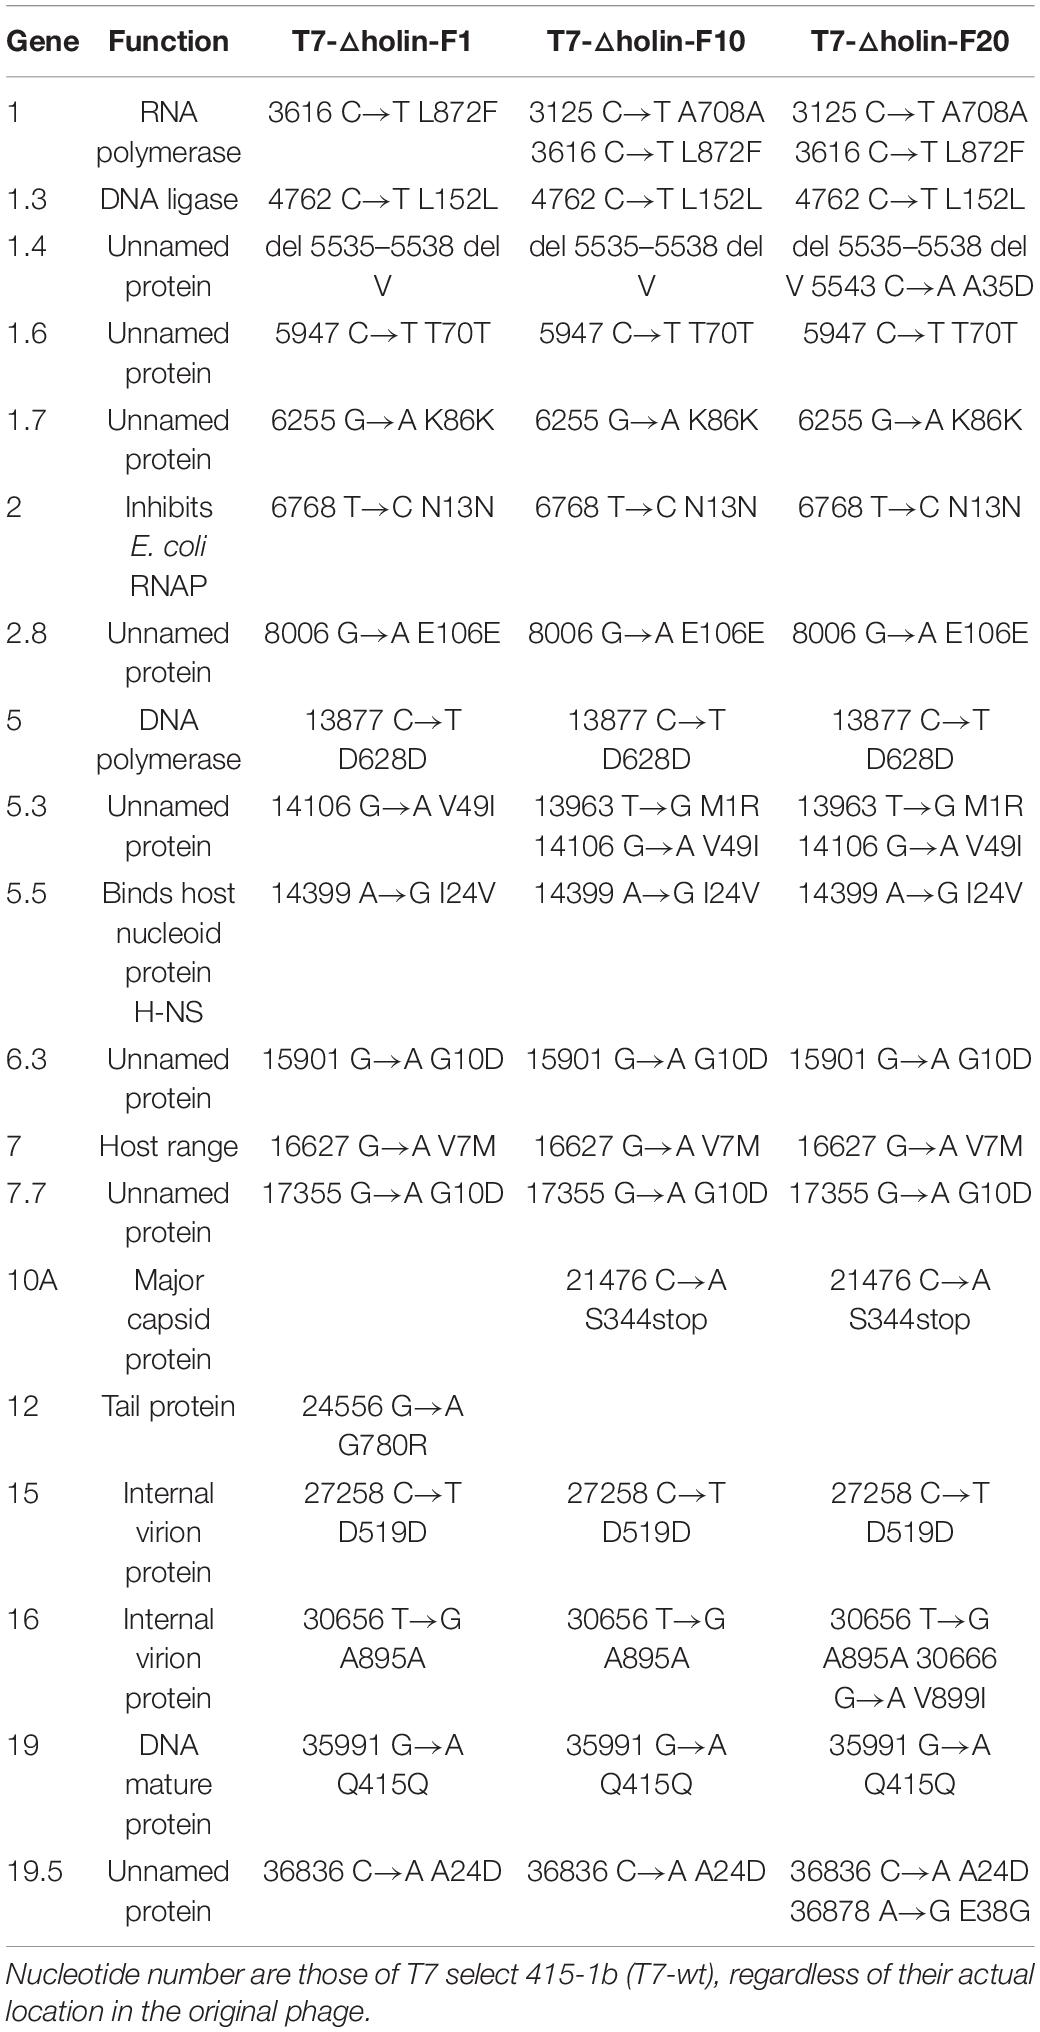
Table 2. Mutations arising from T7-△holin during serial passage of infected Escherichia coli BL21 cells.
The Optimal Culture Process of T7-△holin
In order to obtain an increased production of progeny phages, the most appropriate values of initial concentration of host bacteria and phages were optimized. Four phage stocks (T7-wt and T7-△holin-F1, F10, F20) were prepared and adjusted to the same titers, and E. coli BL21 was infected with varying MOI (=0.01, 0.001, and 0.0001) at a bacterial concentration of OD600 nm of 0.5, 1.0, and 1.5, respectively. Phage titers were evaluated at the end of cultivation and are shown in Table 3.
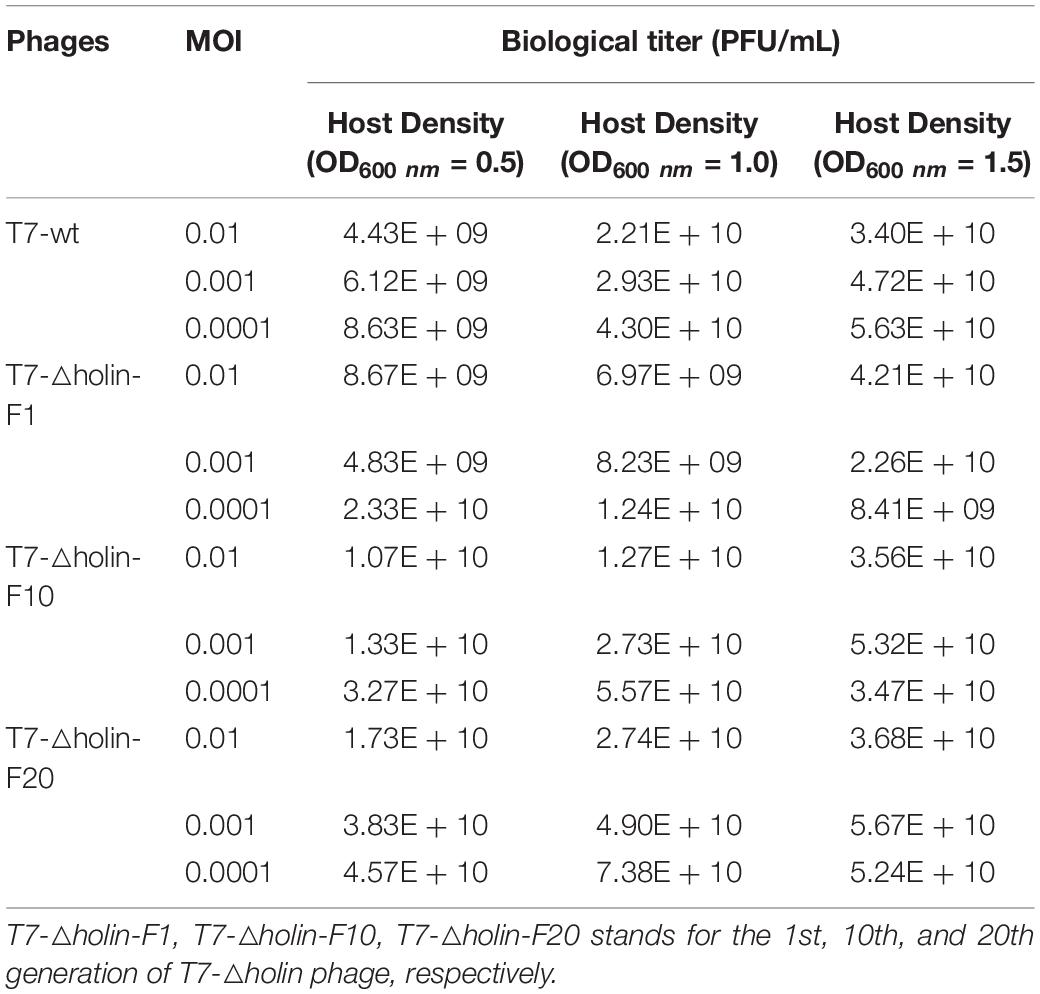
Table 3. Optimization of cultivation process of T7-△holin-infected Escherichia coli BL21 cells.
The progeny phage titer had a positive relation with the initial host bacteria density when it was infected with a high MOI (0.01) and a middle MOI (0.001). However, when a low MOI (0.0001) was used to infect host bacteria, an initial high density of bacteria (OD600 nm = 1.5) produced a lower titer of progeny phages compared to a middle density of bacteria (OD600 nm = 1.0). Host bacteria grown to OD600 nm of 1.5 and infected with T7-wt at an MOI value of 0.0001 produced the highest progeny titers (5.63 × 10¹⁰ PFU/ml). By contrast, host bacteria grown to OD600 nm of 1.0 and infected with T7-△holin-F20 at an MOI value of 0.001 produced the highest progeny titers (7.38 × 10¹⁰ PFU/ml). Thus, through the culture condition optimization, T7-△holin could only produce 1.3 times the number of progeny phage particles compared to T7-wt. Furthermore, when the capsid protein of phage was detected by Dot-ELISA, no significant difference of capsid content was observed (Figures 6A–D) which confirmed that the goal of high titer culture of T7-△holin could not be achieved by process optimization.
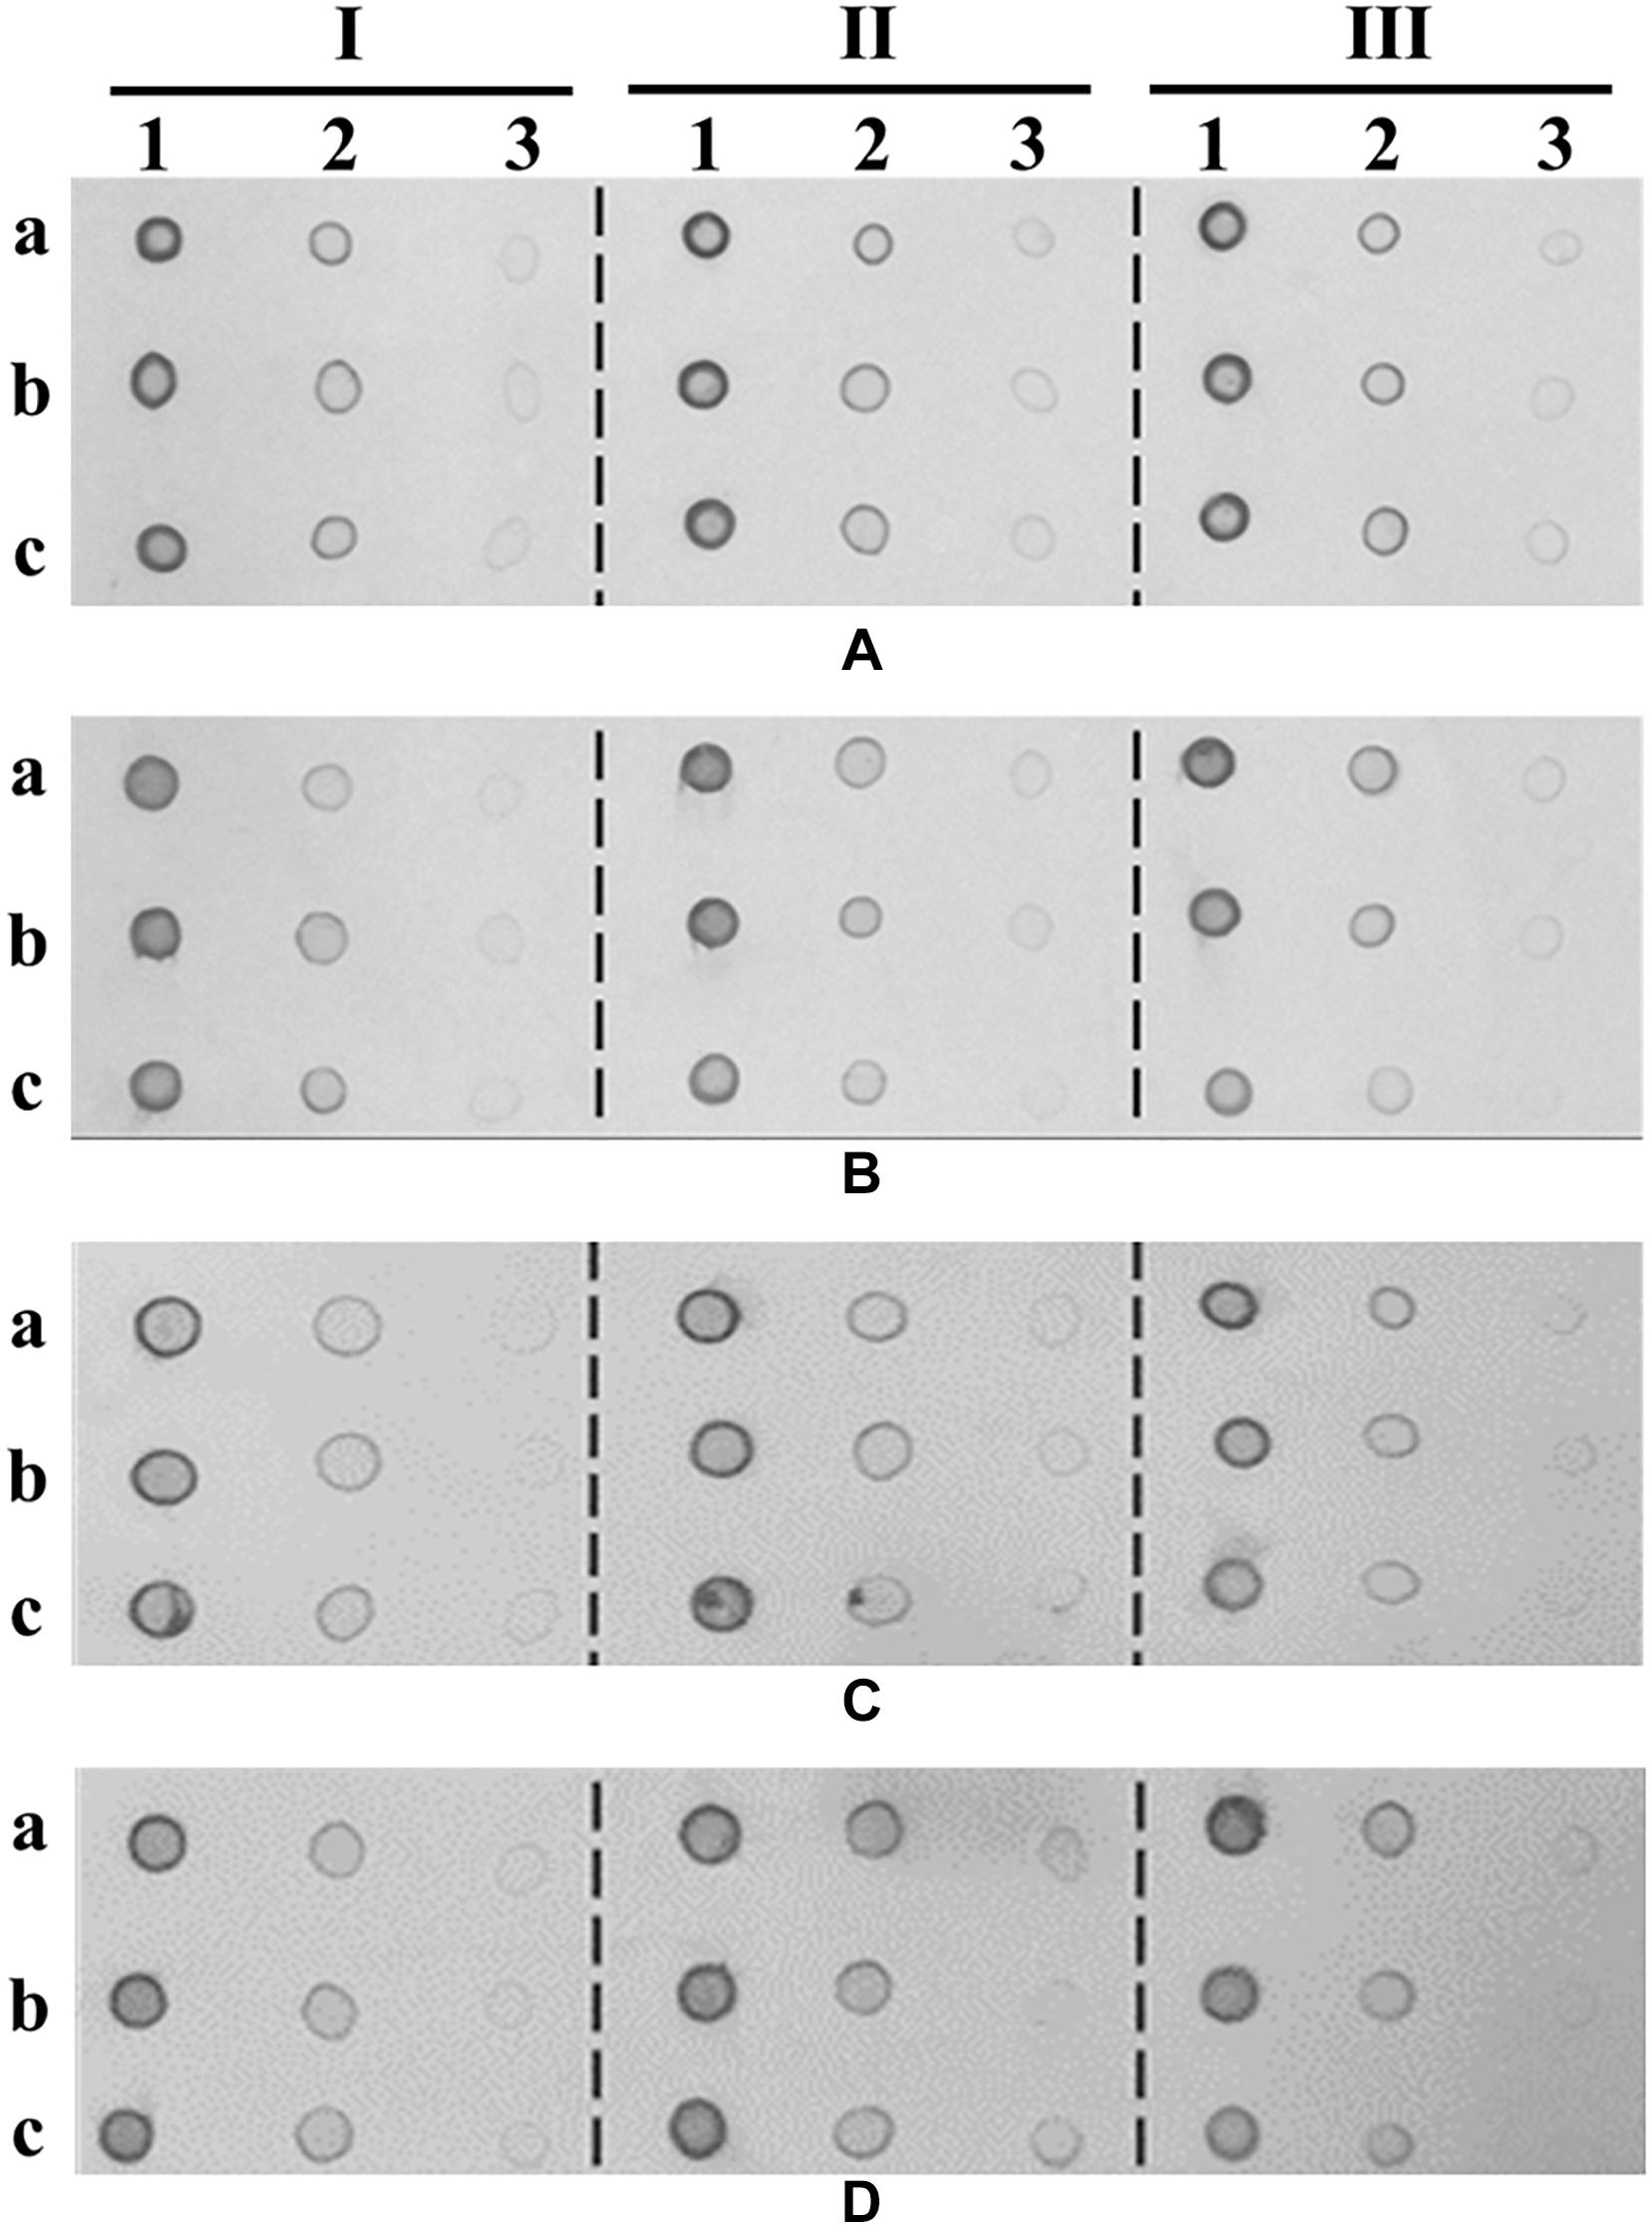
Figure 6. Dot-ELISA assay with T7-Tag® monoclonal antibody. Phage particles recycled after optimization of cultivation process were detected by Dot-ELISA with T7-Tag® monoclonal antibody. (A) T7-wt cultivation. (B) T7-△holin-F1 cultivation. (C) T7-△holin-F10 cultivation. (D) T7-△holin-F20 cultivation. Columns I, II, and III represent the initial host cell density of OD600 nm = 0.5, 1.0, and 1.5, respectively. Columns 1, 2, and 3 represent the 10-, 100-, and 1,000-fold dilution of each phage sample, respectively. Rows a, b, and c represent the multiplicity of infection values of 0.01, 0.001, and 0.0001, respectively.
Discussion
T7 phage genes are named as a number and are usually non-essential if the gene includes a decimal (Heineman et al., 2009). Gene 17.5 is the holin of T7 phage, and it creates sudden membrane lesions in a concentration-dependent manner in the phage lysis pathway (Vukov et al., 2000; Wang et al., 2003; Ryan and Rutenberg, 2007). This saltatory manner of holin activity plays a key role in ensuring that production of phage progeny continues unabatedly until the initiation of the lysis program. A previous study identified that lysis was delayed in liquid cultures of a gene 17.5 nonsense mutant of T3 phage (Miyazaki et al., 1978). Moreover, another study has indicated that T7 phage may contain additional holin, since the lack of gene 17.5 did not prevent the evolution to more rapid lysis (Heineman and Bull, 2007). Although the construction of T7-△holin mutant has been reported previously (Heineman et al., 2009), this study is the first to address the molecular evolution of T7-△holin phage during the serial passage process. The direct effects of holin deletion from the T7 phage genome are a delay in the onset of lysis accompanied by an increased burst size (Figure 3 and Table 1). Burst size appeared to be associated with cellular levels of holin protein for the E. coli BL-holin host infected with the T7-△holin phage. The induced holin protein accelerated lysis and recovered the burst size back to normal lysis levels (Table 1). These data are consistent with previous reports (Singh and Dennehy, 2014) that the holin protein is a regulator of onset of lysis and lysis delay can enlarge the progeny phages.
In canonical lysis, holin protein accumulates harmlessly in the cytoplasmic membrane until triggering at a specific time to form micron-scale holes and then allowing the soluble endolysin to escape and to degrade the peptidoglycan (Young, 2014). However, it has been reported that when holin is blocked, efficient lysis can still evolve but does not display a recovery that closely approaches the characteristic of normal lysis (Heineman et al., 2009). The host bacterial membrane lesion and internal phage particle accumulation post T7-wt and T7-△holin infection are contrasted by SEM and TEM observation (Figure 2). As expected, the lysis process of T7-wt was consistent with previous reports (Young, 2014; Cahill and Young, 2019), presenting with membrane gap, inner and outer membrane fusion, and release of cytoplasmic contents (Figures 2B,E). By comparison, host bacteria infected with T7-△holin demonstrated a swelling at the pole (Figure 2C) and enlargement of the interval between cell wall and membrane can be observed (Figure 2F). Unfortunately, the mechanism of this phenomenon cannot be explained currently; however, there might be an as-yet unknown means of endolysin transmembrane transportation and subsequent degradation of peptidoglycan. Degradation of peptidoglycan leads to the relaxation of periplasm structure and imbalance of internal osmotic pressure of the cell, eventually resulting in enlargement of the interval (Krupovic et al., 2008; Dewey et al., 2010). In addition, T7-△holin infection should increase the progeny phage particle accumulation in the cytosol due to lysis delay, but phage particles were not clearly visible (Figure 2F) as the phage particles may be concealed by the black background due to incomplete decolorization of the sample slice.
The rate of plaque size enlargement can serve as an index for how efficiently a phage develops and produces progeny within an infected host bacterium (Tabib-Salazar et al., 2018). T7 phage plaques have been reported to enlarge continually in mature E. coli lawns (Yin, 1993), which suggested that the T7 phage has evolved specific mechanisms to infect and develop in the stationary phase of host cell growth. Thus, the plaque size formed by the T7-wt and different generations of T7-△holin was compared, as it indirectly reflected the process of evolution of the T7-△holin mutant. As shown in Figure 4, much bigger plaques were formed by T7-△holin-F20 than T7-△holin-F1, which indicates a more rapid infection of host bacteria and more rapid lysis. Onset of lysis and burst size are two parameters that are normally regulated in a trade-off manner to maximize phage fitness (Abedon et al., 2003). It was observed that the plaque size (Figure 4) and the burst size (Table 1) corresponded to each other, and these observations further suggest that small bursts are compensated for by rapid lysis, while delayed lysis usually produces more progeny (Abedon et al., 2003; Wang, 2006; Heineman and Bull, 2007). Burst size, which represents the number of progeny particles a phage produces after one cycle of infection, is not the same as the final production of phage particles in liquid culture. As indicated in Tables 1, 3, T7-△holin-F1 has an enlarged burst size and a delayed lysis onset. Incomplete lysis of host cells is observed in conditions of low MOI and high initial host density, leading to relatively small numbers of progeny. A high-titer culture of T7-△holin cannot be realized merely by optimizing the MOI and initial host density, instead comprehensive parameter optimization and innovative culture process are needed. Furthermore, the mRNA level of gene 10 was stably maintained both in T7-wt and the 1st, 10th, and 20th generations of T7-△holin (Figure 5), which indicates a relatively constant expression of capsid protein and subsequent release of progeny phage particles. By contrast, there was a significant difference in burst size between T7-wt and T7-△holin (Table 1), indicating that the enlarged burst size may be due to increased time for packaging of infective phage particles rather than upregulated expression of capsid protein.
The revised “three-step” model for lysis involves three functional types of protein: holin, endolysin, and spanin (Rajaure et al., 2015). These proteins act sequentially on the inner membrane, peptidoglycan, and outer membrane components of the cell envelope to effect lysis. For T7 phage, the overlapping genes 18.5 and 18.7 apparently encode spanins, which span the periplasm and are involved in disrupting the outer cell membrane under high salt concentration, and they are homologous to the overlapping genes Rz and Rz1 of lambda phage (Summer et al., 2007). In addition, three other T7 genes, i.e., genes 19.2, 19.3, and 19.5 encode hypothetical proteins with potential lysis function and are conserved among close relatives of T7 phage (Nguyen and Kang, 2014). If these hypothetical genes are expressed as proteins, they could act as candidates for the unknown lysis-associated factors, especially when the holin gene is deleted, as a new lysis pathway is needed to compensate for inefficient function. Therefore, the mRNA levels of candidate genes of T7-△holin post-infection were measured (Figure 5). The mRNA transcription level of gene 3.5 was significantly upregulated during serial passage, especially at the 20th generation. Gene 3.5 is expressed along with replication genes rather than late genes, it also binds T7 RNA polymerase and inhibits transcription, and it stimulates replication and package of T7 DNA. Thus, it may be speculated that the upregulation of gene 3.5 transcription (Figure 5) may contribute to the lysis onset acceleration and burst size shrinkage of T7-△holin-F20 (Table 1). However, WGS data show that gene 3.5 maintained its genetic stability and no mutations were observed after serial passage (Table 2), which indicates that there was no direct connection between the upregulation and nucleotide sequence change. In contrast, the mRNA level of gene 19.5 increased gradually from the 1st to the 20th generation (Figure 5), with mutation accumulation during the serial passage process (Table 2). Two missense mutations were discovered in gene 19.5; coincidentally, the mutation in gene 19.5 (36878A→G E38G) was consistent with the report by Heineman et al. (2009) when the evolvability of lysis was studied in T7 phage. Since gene 19.5 has been identified as a gene with a possible lytic function, the identification of the E38G mutation confirms that it is a crucial residue for the compensatory lytic activity of gene 19.5.
In summary, deletion of the T7 phage holin gene resulted in lysis delay, which allowed the phage more time to assemble a greater number of progeny particles. However, the delay in lysis onset and burst size enlargement of T7-△holin gradually recovered to the normal lysis levels following serial passage of the T7-△holin mutant. Gene 19.5 may be a lysis-associated gene, since mRNA levels were upregulated and two missense mutations had accumulated by the 20th generation. This might result in compensation of inefficient lysis function due to holin deletion. This study shows a new level of adaptation related to the regulation of transcription of genes 16 and 19.5 involved in lysis (E38G mutation in gene 19.5). It will be worthwhile to further characterize the gene function of gene 19.5 and conduct more detailed microscopic analysis of the T7-wt phage vs. T7-△holin mutants.
Data Availability Statement
The data presented in the study are deposited in the GenBank repository, accession numbers MZ318361, MZ318362, and MZ318363.
Author Contributions
HX participated in most of the experiments and drafted the manuscript. XB carried out the rescue of T7-△holin phage and biological characteristic analysis. WH optimized the culture process of T7-△holin phage. KW performed the detection of mRNA level. AW performed the whole-genome sequencing analysis. HD carried out the serial passage of T7-△holin phage. RG, JH, BD, and HC participated in the conception, drafting, and/or editing of the manuscript.
Funding
This work was supported by the Intramural Research Program of Jiangsu Agri-Animal Husbandry Vocational College (NSF201902) and General Research and Development Funding of Jiangsu Academy of Agricultural Sciences [CX (20) 2009].
Conflict of Interest
The authors declare that the research was conducted in the absence of any commercial or financial relationships that could be construed as a potential conflict of interest.
Publisher’s Note
All claims expressed in this article are solely those of the authors and do not necessarily represent those of their affiliated organizations, or those of the publisher, the editors and the reviewers. Any product that may be evaluated in this article, or claim that may be made by its manufacturer, is not guaranteed or endorsed by the publisher.
Acknowledgments
We acknowledge Valery A. Petrenko for constructive opinions for the phage research. We would like to thank Liming Yuan for her assistance with electron microscopy.
Supplementary Material
The Supplementary Material for this article can be found online at: https://www.frontiersin.org/articles/10.3389/fmicb.2021.705310/full#supplementary-material
References
Abedon, S. T., Hyman, P., and Thomas, C. (2003). Experimental examination of bacteriophage latent-period evolution as a response to bacterial availability. Appl. Environ. Microbiol. 69, 7499–7506. doi: 10.1128/aem.69.12.7499-7506.2003
Bamford, D. H., and Mindich, L. (1980). Electron microscopy of cells infected with nonsense mutants of bacteriophage phi 6. Virology 107, 222–228. doi: 10.1016/0042-6822(80)90287-1
Cahill, J., and Young, R. (2019). Phage lysis: multiple genes for multiple barriers. Adv. Virus Res. 103, 33–70. doi: 10.1016/bs.aivir.2018.09.003
Chan, L. Y., Kosuri, S., and Endy, D. (2005). Refactoring bacteriophage T7. Mol. Syst. Biol. 1:2005.0018.
Clark, J. R., and March, J. B. (2006). Bacteriophages and biotechnology: vaccines, gene therapy and antibacterials. Trends Biotechnol. 24, 212–218. doi: 10.1016/j.tibtech.2006.03.003
Clokie, M. R. (2009). Quantification of host and phage mRNA expression during infection using real-time PCR. Methods Mol. Biol. 502, 177–191. doi: 10.1007/978-1-60327-565-1_11
Condron, B. G., Atkins, J. F., and Gesteland, R. F. (1991). Frameshifting in gene 10 of bacteriophage T7. J. Bacteriol. 173, 6998–7003. doi: 10.1128/jb.173.21.6998-7003.1991
Demerec, M., and Fano, U. (1945). Bacteriophage-resistant mutants in Escherichia coli. Genetics 30, 119–136. doi: 10.1093/genetics/30.2.119
Deng, X., Wang, L., You, X., Dai, P., and Zeng, Y. (2018). Advances in the T7 phage display system. Mol. Med. Rep. 17, 714–720.
Dewey, J. S., Savva, C. G., White, R. L., Vitha, S., Holzenburg, A., and Young, R. (2010). Micron-scale holes terminate the phage infection cycle. Proc. Natl. Acad. Sci. U S A. 107, 2219–2223. doi: 10.1073/pnas.0914030107
Dunn, J. J., and Studier, F. W. (1983). Complete nucleotide sequence of bacteriophage T7 DNA and the locations of T7 genetic elements. J. Mol. Biol. 66, 477–535. doi: 10.1016/s0022-2836(83)80282-4
Hamzeh-Mivehroud, M., Alizadeh, A. A., Morris, M. B., Church, W. B., and Dastmalchi, S. (2013). Phage display as a technology delivering on the promise of peptide drug discovery. Drug Discov. Today 18, 1144–1157. doi: 10.1016/j.drudis.2013.09.001
Heineman, R. H., and Bull, J. J. (2007). Testing optimality with experimental evolution: lysis time in a bacteriophage. Evolution 61, 1695–1709. doi: 10.1111/j.1558-5646.2007.00132.x
Heineman, R. H., Bull, J. J., and Molineux, I. J. (2009). Layers of evolvability in a bacteriophage life history trait. Mol. Biol. Evol. 26, 1289–1298. doi: 10.1093/molbev/msp037
Jakočiūnė, D., and Moodley, A. (2018). A rapid bacteriophage DNA extraction method. Methods Protoc. 1:27. doi: 10.3390/mps1030027
Kropinski, A. M., Mazzocco, A., Waddell, T. E., Lingohr, E., and Johnson, R. P. (2009). Enumeration of bacteriophages by double agar overlay plaque assay. Methods Mol. Biol. 501, 69–76. doi: 10.1007/978-1-60327-164-6_7
Krupovic, M., Cvirkaite-Krupovic, V., and Bamford, D. H. (2008). Identification and functional analysis of the Rz/Rz1-like accessory lysis genes in the membrane-containing bacteriophage PRD1. Mol. Microbiol. 68, 492–503. doi: 10.1111/j.1365-2958.2008.06165.x
Krysiak-Baltyn, K., Martin, G. J. O., and Gras, S. L. (2018). Computational modelling of large scale phage production using a two-stage batch process. Pharmaceuticals 11:31. doi: 10.3390/ph11020031
Lin, T. Y., Lo, Y. H., Tseng, P. W., Chang, S. F., Lin, Y. T., and Chen, T. S. (2012). A T3 and T7 recombinant phage acquires efficient adsorption and a broader host range. PLoS One 7:e30954. doi: 10.1371/journal.pone.0030954
Miyazaki, J. I., Ryo, Y., Fujisawa, H., and Minagawa, T. (1978). Mutation in bacteriophage T3 affecting host cell lysis. Virology 89, 327–329. doi: 10.1016/0042-6822(78)90067-3
Nguyen, H. M., and Kang, C. (2014). Lysis delay and burst shrinkage of coliphage T7 by deletion of terminator Tphi reversed by deletion of early genes. J. Virol. 88, 2107–2115. doi: 10.1128/jvi.03274-13
Pande, J., Szewczyk, M. M., and Grover, A. K. (2010). Phage display: concept, innovations, applications and future. Biotechnol. Adv. 28, 849–858. doi: 10.1016/j.biotechadv.2010.07.004
Pickard, D. J. (2009). Preparation of bacteriophage lysates and pure DNA. Methods Mol. Biol. 502, 3–9. doi: 10.1007/978-1-60327-565-1_1
Rajaure, M., Berry, J., Kongari, R., Cahill, J., and Young, R. (2015). Membrane fusion during phage lysis. Proc. Natl. Acad. Sci. U S A. 112, 5497–5502. doi: 10.1073/pnas.1420588112
Rosenberg, A., Griffin, K., William Studier, F., McCormick, M., Berg, J., Novy, R., et al. (1996). T7Select® phage display system: a powerful new protein display system based on bacteriophage T7. InNovations 6, 1–6.
Ryan, G. L., and Rutenberg, A. D. (2007). Clocking out: modeling phage-induced lysis of Escherichia coli. J. Bacteriol. 189, 4749–4755. doi: 10.1128/jb.00392-07
Shao, Y., and Wang, I. N. (2008). Bacteriophage adsorption rate and optimal lysis time. Genetics 180, 471–482. doi: 10.1534/genetics.108.090100
Singh, A., and Dennehy, J. J. (2014). Stochastic holin expression can account for lysis time variation in the bacteriophage lambda. J. R. Soc. Interface 11:20140140. doi: 10.1098/rsif.2014.0140
Sipley, J., Stassi, D., Dunn, J., and Goldman, E. (1991). Analysis of bacteriophage T7 gene 10A and frameshifted 10B proteins. Gene Exp. 1, 127–136.
Summer, E. J., Berry, J., Tran, T. A., Niu, L., Struck, D. K., and Young, R. (2007). Rz/Rz1 lysis gene equivalents in phages of Gram-negative hosts. J. Mol. Biol. 373, 1098–1112. doi: 10.1016/j.jmb.2007.08.045
Tabib-Salazar, A., Liu, B., Barker, D., Burchell, L., Qimron, U., Matthews, S. J., et al. (2018). T7 phage factor required for managing RpoS in Escherichia coli. Proc. Natl. Acad. Sci. U S A. 115, E5353–E5362.
Vukov, N., Scherer, S., Hibbert, E., and Loessner, M. J. (2000). Functional analysis of heterologous holin proteins in a lambdaDeltaS genetic background. FEMS Microbiol. Lett. 184, 179–186. doi: 10.1016/s0378-1097(00)00041-0
Wang, I. N. (2006). Lysis timing and bacteriophage fitness. Genetics 172, 17–26. doi: 10.1534/genetics.105.045922
Wang, I. N., Deaton, J., and Young, R. (2003). Sizing the holin lesion with an endolysin-beta-galactosidase fusion. J. Bacteriol. 185, 779–787. doi: 10.1128/jb.185.3.779-787.2003
Wang, I. N., Smith, D. L., and Young, R. (2000). Holins: the protein clocks of bacteriophage infections. Annu. Rev. Microbiol. 54, 799–825. doi: 10.1146/annurev.micro.54.1.799
Xu, H., Bao, X., Lu, Y., Liu, Y., Deng, B., Wang, Y., et al. (2017). Immunogenicity of T7 bacteriophage nanoparticles displaying G-H loop of foot-and-mouth disease virus (FMDV). Vet. Microbiol. 205, 46–52. doi: 10.1016/j.vetmic.2017.04.023
Xu, M., Arulandu, A., Struck, D. K., Swanson, S., Sacchettini, J. C., and Young, R. (2005). Disulfide isomerization after membrane release of its SAR domain activates P1 lysozyme. Science 307, 113–117. doi: 10.1126/science.1105143
Xu, M., Struck, D. K., Deaton, J., Wang, I. N., and Young, R. (2004). A signal-arrest-release sequence mediates export and control of the phage P1 endolysin. Proc. Natl. Acad. Sci. U S A. 101, 6415–6420. doi: 10.1073/pnas.0400957101
Yin, J. (1993). Evolution of bacteriophage T7 in a growing plaque. J. Bacteriol. 175, 1272–1277. doi: 10.1128/jb.175.5.1272-1277.1993
Young, R. (1992). Bacteriophage lysis: mechanism and regulation. Microbiol Rev. 56, 430–481. doi: 10.1128/mr.56.3.430-481.1992
Young, R. (2014). Phage lysis: three steps, three choices, one outcome. J. Microbiol. 52, 243–258. doi: 10.1007/s12275-014-4087-z
Keywords: T7 phage, holin, lysis, compensatory host, evolution
Citation: Xu H, Bao X, Hong W, Wang A, Wang K, Dong H, Hou J, Govinden R, Deng B and Chenia HY (2021) Biological Characterization and Evolution of Bacteriophage T7-△holin During the Serial Passage Process. Front. Microbiol. 12:705310. doi: 10.3389/fmicb.2021.705310
Received: 05 May 2021; Accepted: 28 June 2021;
Published: 02 August 2021.
Edited by:
Robert Czajkowski, University of Gdańsk, PolandReviewed by:
Pilar García, Consejo Superior de Investigaciones Científicas (CSIC), SpainNuria Quiles Puchalt, University of Glasgow, United Kingdom
Ramesh Nachimuthu, VIT University, India
Copyright © 2021 Xu, Bao, Hong, Wang, Wang, Dong, Hou, Govinden, Deng and Chenia. This is an open-access article distributed under the terms of the Creative Commons Attribution License (CC BY). The use, distribution or reproduction in other forums is permitted, provided the original author(s) and the copyright owner(s) are credited and that the original publication in this journal is cited, in accordance with accepted academic practice. No use, distribution or reproduction is permitted which does not comply with these terms.
*Correspondence: Bihua Deng, ZGVuZ2JpaHVhMTk4MUAxNjMuY29t; Hafizah Y. Chenia, Q2hlbmlhaEB1a3puLmFjLnph