 Irene H. Zhang1,2
 Susan Mullen1†
 Davide Ciccarese1
 Diana Dumit1
 Donald E. Martocello III1,3
 Masanori Toyofuku4
 Nobuhiko Nomura4
 Steven Smriga1
 Andrew R. Babbin1*
- 1Department of Earth, Atmospheric and Planetary Sciences, Massachusetts Institute of Technology, Cambridge, MA, United States
- 2Program in Microbiology, Massachusetts Institute of Technology, Cambridge, MA, United States
- 3Department of Marine Chemistry and Geochemistry, Woods Hole Oceanographic Institution, Woods Hole, MA, United States
- 4Faculty of Life and Environmental Sciences, Microbiology Research Center for Sustainability, University of Tsukuba, Tsukuba, Japan
Denitrifying microbes sequentially reduce nitrate (NO3–) to nitrite (NO2–), NO, N2O, and N2 through enzymes encoded by nar, nir, nor, and nos. Some denitrifiers maintain the whole four-gene pathway, but others possess partial pathways. Partial denitrifiers may evolve through metabolic specialization whereas complete denitrifiers may adapt toward greater metabolic flexibility in nitrogen oxide (NOx–) utilization. Both exist within natural environments, but we lack an understanding of selective pressures driving the evolution toward each lifestyle. Here we investigate differences in growth rate, growth yield, denitrification dynamics, and the extent of intermediate metabolite accumulation under varying nutrient conditions between the model complete denitrifier Pseudomonas aeruginosa and a community of engineered specialists with deletions in the denitrification genes nar or nir. Our results in a mixed carbon medium indicate a growth rate vs. yield tradeoff between complete and partial denitrifiers, which varies with total nutrient availability and ratios of organic carbon to NOx–. We found that the cultures of both complete and partial denitrifiers accumulated nitrite and that the metabolic lifestyle coupled with nutrient conditions are responsible for the extent of nitrite accumulation.
Introduction
Microbial assemblages in natural environments perform diverse biogeochemical transformations that drive global nutrient cycling and serve key ecological functions (Flemming and Wuertz, 2019). Among these, denitrification is a generally microbially mediated process that balances the nitrogen budget in terrestrial and marine ecosystems (Arrigo, 2005). Denitrifying microbes use nitrogen oxides (NOx–) as terminal electron acceptors under oxygen-limiting conditions, sequentially reducing in turn nitrate (NO3–) to nitrite (NO2–), nitric oxide (NO), nitrous oxide (N2O), and finally N2 through reductase enzymes encoded by the genes nar or nap, nir, nor, and nos, respectively (Zumft, 1997). As each step of denitrification yields free energy for the cell by coupling the reduction of nitrogen species to the oxidation of carbon, microbes theoretically harness the most energy for growth by performing the entire pathway. However, molecular surveys have revealed that many denitrifiers possess only partial denitrifying potential, whereas others contain the full suite of four genes (Zumft, 1997; Graf et al., 2014; Marchant et al., 2018). In addition, the polyphyletic distribution of denitrifying capabilities across diverse taxonomic groups and unique evolutionary history of each denitrification gene indicate the independent loss, gain, or horizontal transfer of these genes between microbes (Jones et al., 2008). Selective pressure to minimize the metabolic costs of enzyme biosynthesis, along with genome streamlining, may lead to the loss of individual denitrification genes (Mira et al., 2001; Giovannoni, 2005). Horizontal transfer may lead to the acquisition of genes that confer the ability to reduce available forms of inorganic nitrogen (Jones et al., 2008; Alvarez et al., 2011).
The modularity of denitrification genes, whether as a cause or function of the fragmentation of the denitrification pathway, points to possible metabolic specialization within these communities (Lycus et al., 2018). The phenomenon of metabolic specialization in microbial communities has been well-established (Johnson et al., 2012; Wong et al., 2015; D’Souza et al., 2018; Thommes et al., 2019; Meijer et al., 2020). Specialization may manifest as members of coexisting populations diversify to fill available niches defined by nutrient availability, spatial structure, temporal variability, or other factors. Laboratory experiments with model denitrifying organisms have determined that different genes involved in the denitrification process activate under distinct environmental cues and display unique dynamics (Lycus et al., 2018). Within denitrifying ecosystems, the availability of multiple inorganic nitrogen species may lead to the diversification of microbes into populations of NO3– consumers (NO2– producers) and NO2– consumers. Specialization can also evolve if community members construct new niches through the release of metabolic byproducts which then become substrates for the growth of other members (Kinnersley et al., 2009; Lilja and Johnson, 2019). Additionally, partial denitrifiers may have evolved unique functions beyond canonical denitrification, such as detoxification by nir and nor of toxic chemical intermediates and cellular regulation and signaling using NO (Sasaki et al., 2016; Vázquez-Torres and Bäumler, 2016). As the reduction of NO3– results in the production of the intermediate metabolites NO2–, NO, and N2O, which are released into the environment, NO3–-reducing microbes may create new metabolic niches for specialist populations that perform downstream denitrification steps. Over time, a community of complementary specialists relying on substrate cross-feeding of intermediate metabolites may arise.
The accumulation of intermediate metabolites may drive specialization by forming new ecological niches. Denitrification enzymes form dynamic, membrane-bound complexes via protein-protein interactions, which maximizes electron transfer efficiency (Borrero-de Acuña et al., 2017). Despite this tight relationship between denitrification proteins, intermediate metabolites, particularly NO2–, accumulate in both culture-based denitrification systems (Matsubara and Zumft, 1982; Granger and Ward, 2003; Bergaust et al., 2010) and in natural environments where denitrification occurs such as marine oxygen deficient zones (ODZs) (Brandhorst, 1959; Ulloa et al., 2012). This accumulation of metabolic intermediates may indicate a spatial separation of denitrification steps through partitioning different metabolic steps into separate cells or a temporal separation in the transcription of individual genes or the activity of individual enzymes.
A multitude of factors have been shown to influence the accumulation of intermediate denitrification metabolites. Previous studies indicate that lower organic carbon to NOx– (C: NOx–) ratios result in significant NO2– accumulation in an aquatic system (Chen et al., 2017). Other possible explanations invoke competition between denitrification enzymes for co-factors, membrane space, biosynthetic building blocks, or other intracellular resources (Almeida et al., 1995; Lilja and Johnson, 2016). The involvement of transporters may contribute to the accumulation of metabolites prior to movement across a membrane. Moreover, the metabolic costs of enzyme biosynthesis create a tradeoff between maintaining and activating the full denitrification pathway and specializing in only one or several steps (Pfeiffer and Bonhoeffer, 2004; Costa et al., 2006; Wortel et al., 2018). Minimizing biosynthesis costs in multi-enzyme pathways can lead to intermediate metabolite accumulation, giving rise to multiple specialist populations even upon a single resource (Treves et al., 1998; Pfeiffer and Bonhoeffer, 2004). Therefore, this tradeoff is a key element for the evolution and coexistence of species.
Complete denitrification may occur either through full reduction of NO3– to N2 within one or several independent complete denitrifiers or as a community process between complementary partial denitrifiers. Here, we use laboratory cultures of model complete and partial denitrifiers to examine the tradeoffs involved in these two lifestyles and the effects of each lifestyle upon denitrification and growth dynamics. To eliminate the confounding factor of strain or species differences in comparing metabolic lifestyles, we use the wild-type complete denitrifier Pseudomonas aeruginosa and knockout strains with either a deletion in the gene for nitrite reductase (Δnir) or a deletion in the gene for membrane-bound nitrate reductase (Δnar), the respiratory nitrate reductase in canonical denitrification. P. aeruginosa occurs widely in marine, aquatic, and soil ecosystems and is attractive as a model organism due to its genetic tractability (Schreiber et al., 2007). We define the wild-type P. aeruginosa as a generalist in the context of denitrification, as it possesses the capability to utilize diverse oxidized nitrogen species as electron acceptors for energy. Conversely, we define the isogenic mutants as specialists since they possess only a defined subset of metabolic capabilities.
We compare the growth and denitrification dynamics of these two model specialists in co-culture against their parent wild-type P. aeruginosa under varying nutrient conditions. As environmental denitrifiers utilize heterogeneous organic carbon and inorganic nitrogen sources, we test four nutrient regimes characterized by differing ratios of mixed organic carbon to NOx–, specifically NO3– and NO2–. We further use a varied organic medium with many compound classes more akin to natural systems than a medium with a single carbon source. Both total nutrient availability and carbon to nitrogen oxide ratios (C: NOx–) have been demonstrated to impact denitrification processes and the metabolic division of labor within communities (Blaszczyk, 1993; Ge et al., 2012; Chen et al., 2017), so we expect these regimes to exert different selective pressures on our model specialist vs. generalist communities, influencing their growth, denitrification dynamics, and accumulation of the intermediate NO2–.
Materials and Methods
Strains and Culture Methods
For the Pseudomonas aeruginosa Δnir mutant, the region from nirS to nirN was deleted, while for Δnar the narG gene was deleted (Toyofuku and Sawada, 2014). Isogenic mutants were constructed as follows: PCR primers listed in Supplementary Table 1 were used to amplify DNA fragments upstream and downstream of either narG or nirS-N with overlap extension PCR. The amplified fragments were cloned into a multicloning site in pG19II. The pG19-Δnar or pG19-Δnir plasmids were conjugated from E. coli S17-1 into wild-type P. aeruginosa PAO1 and deletion mutants were generated with allelic exchange. Deletions were confirmed with PCR and phenotypic analysis.
Pseudomonas aeruginosa wild-type PAO1 and mutant strains were inoculated into 25 mL of either 100% Luria-Bertani (LB) Broth (for regimes with 100% LB) or 10% LB Broth diluted with phosphate-buffered saline (PBS; for regimes with 10% LB). LB Broth was chosen due to its varied and complex carbon sources, which may more closely resemble conditions in natural systems preferred by heterotrophic bacteria in which various carbon sources derive from complex cellular metabolites. Through the use of LB, we hoped to avoid growth dynamics that depend on and are specific to the choice of an individual carbon compound. LB Broth also contains an abundance of reduced, organic nitrogen species for assimilatory anabolism, enabling supplemental NO3– or NO2– to be used primarily for dissimilatory energetic pathways. We additionally performed a control experiment in M9 minimal media supplemented with approximately 10 or 1 mM NO3– and 50 or 5 mM citrate (a C6 compound) as the sole carbon source to confirm our results are specific to mixed carbon media. M9 minimal media contains 9.35 mM NH4 for nitrogen assimilation, allowing supplemental NOx– to be used primarily for dissimilatory reduction. Additionally, M9 minimal media was supplemented with 4.1 nM biotin, 3.8 nM thiamin, 31 μM FeCl3, 6.2 μM ZnCl2, 0.76 μM CuCl2, 0.42 μM CoCl2, 1.62 μM H3BO3, and 0.081 μM MnCl2. Cultures were incubated overnight until reaching stationary phase at 37°C with shaking within 125 mL foil-covered Erlenmeyer flasks under oxic conditions. This was used as the starting culture for inoculating into anoxic media.
Media Preparation and Sampling
Anoxic media was prepared in 150 mL serum bottles. In total, 50 mL of sterile 100% LB or 10% LB in PBS were amended with various concentrations of sterile NO3– or NO2– in serum bottles and purged of oxygen. Four nutrient regimes were tested: high carbon and NOx– (∼10 mM NOx–, 100% LB), low carbon (∼10 mM NOx–, 10% LB), low NOx– (∼1 mM NOx–, 100% LB), and low carbon and NOx– (∼1 mM NOx–, 10% LB). LB concentrations lower than 10% LB did not result in measurable culture growth after 24 h of incubation under the low carbon and NOx– regime, therefore 10% LB was chosen to represent the low carbon regime. Within each regime, four initial stoichiometric NO3–/NO2– ratios were tested: 10:0, 9:1, 5:5, and 1:9. Two replicate bottles were prepared for stoichiometric ratios 9:1, 5:5, and 1:9 under each nutrient regime, totaling eight bottles for each along with one abiotic control. For the 10:0 stoichiometric ratio, four replicates were performed, with two sets of bottles sampled on different dates for each nutrient condition. These two sets of bottles were denoted as run 1 and run 2, with the goal to assess reproducibility in growth and denitrification dynamics. Bottles were capped with a butyl rubber stopper and crimped with an aluminum ring to create an airtight seal. Each bottle was purged prior to culture inoculation with N2 gas for 2 h at 100 mL min–1, resulting in ∼80 volume turnovers. Prepared anoxic bottles were incubated overnight at 37°C without shaking to confirm the sterility of the media prior to inoculation.
Inoculation and sampling were performed with 10 mL syringes which were purged each time prior to insertion into bottles. Purging was performed with N2 gas three times as follows: needles were inserted into a capped, sealed empty serum bottle connected to N2 gas flowing at 1,000 mL min–1. After syringes were filled fully with N2 gas, they were removed from the bottle and N2 gas was discharged. Holding each syringe stopper down to prevent oxygen from entering the syringe, needles were reinserted into the N2 serum bottle and allowed to refill with N2 gas. This process ensured that any residual oxygen within each syringe and needle was removed and no oxygen contaminated anaerobic cultures. With the last purge, prior to insertion of the needle into media, 2 mL of N2 gas was retained within the syringe and injected into the serum bottle to maintain pressure inside the incubation bottles after sampling.
The optical density (OD) of each overnight aerobic bacterial culture was measured at 600 nm on a Nanodrop OneC spectrophotometer using a 1 cm tte. For Δnir and Δnar cultures, overnight cultures were combined in a 1:1 cellular ratio within 50 mL Falcon tubes. Either this 1:1 culture mixture or the wild-type culture was added to each bottle to achieve a starting inoculum OD of 0.05. Serum bottles were then placed within a 37°C incubator with shaking. A diagram summarizing the experimental setup, sampling scheme, and analysis methods is included as Figure 1.
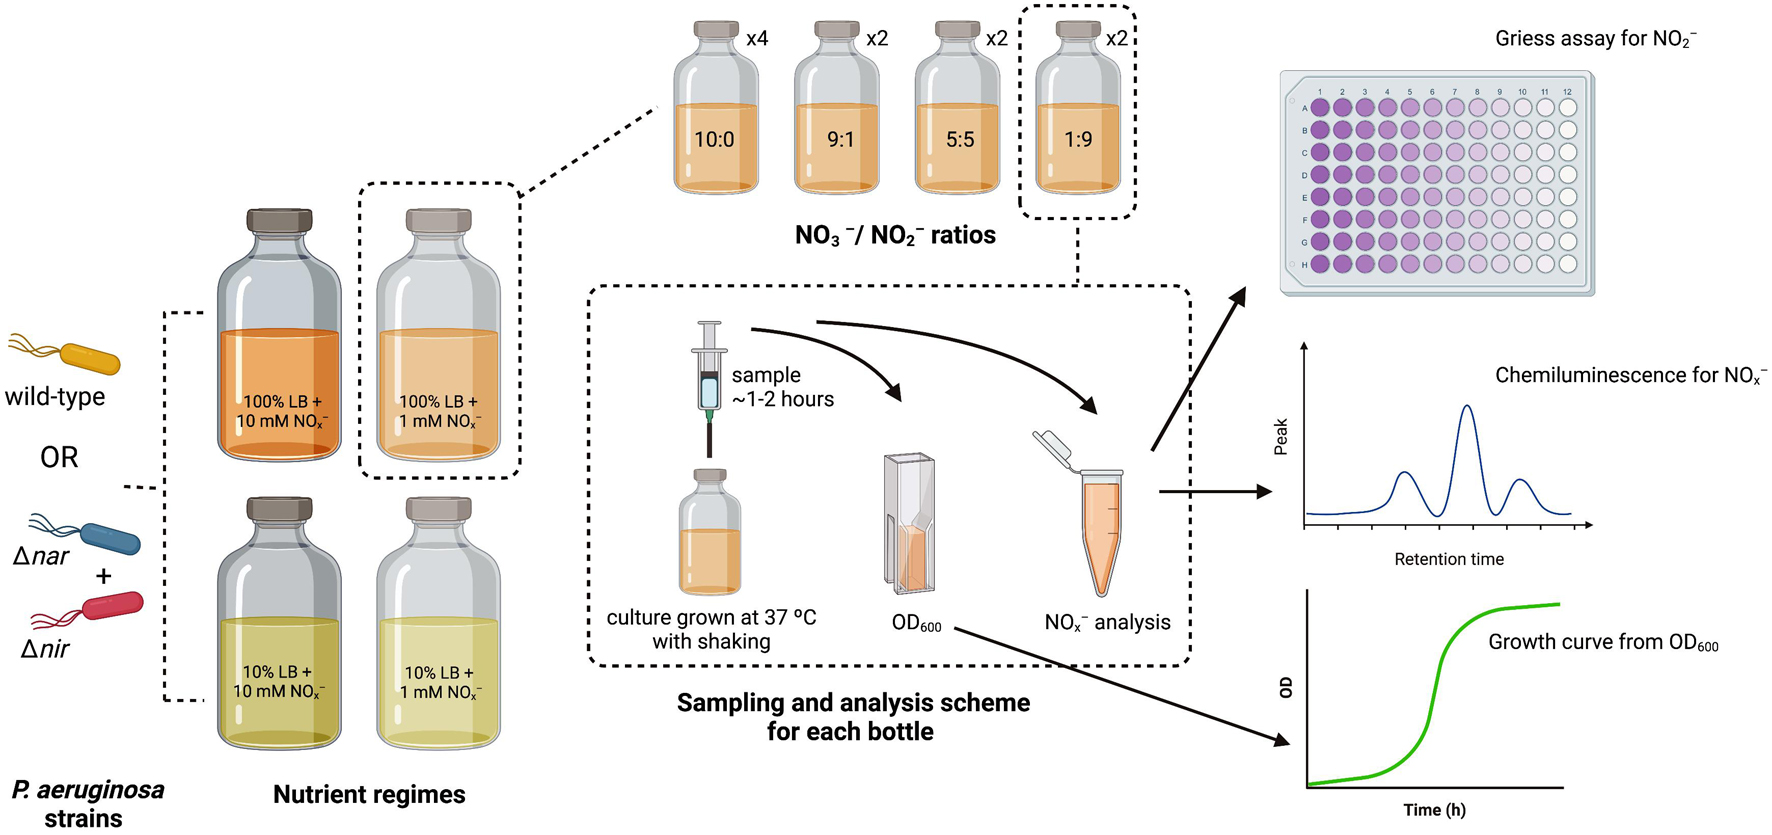
Figure 1. Diagram of experimental setup, sampling scheme, and analysis methods. P. aeruginosa strains for inoculation are depicted in orange (wild-type), cyan (Δnar), and red (Δnir). Nutrient regimes are shown in large serum bottles, and stoichiometric ratios for each nutrient regime are shown in smaller serum bottles. Number of replicates for each stoichiometric ratio within each nutrient regime is indicated next to smaller serum bottles. The sampling scheme for each replicate is depicted within the dashed rectangle, along with the analyses performed on each sample.
Sampling was performed every hour using needles purged as described above. For each sample, 2 mL of media was removed from each bottle. In total, 1 mL of media was preserved in a 1.5 mL microcentrifuge tube for analysis of NOx– and NO2–, while the other 1 mL was measured directly for OD. The tube was centrifuged to pellet cells and the supernatant was transferred to a second tube and frozen at −20°C until analysis for inorganic nitrogen. Bottles were removed from the 37°C incubator only during sampling to minimize time at room temperature, and the total duration of sampling for all bottles at each timepoint was approximately 5 min.
Sampling was terminated when no NO2– remained within any cultures. A diagnostic test was performed upon each sample by adding 10 μL of Griess reagent to cuvettes used for OD measurement. If NO2– remained, media within cuvettes developed a pink hue, while if NO2– was fully consumed, media remained clear. NO2– concentrations within preserved tubes were also determined using this method, the Griess colorimetric assay (Strickland and Parsons, 1972). Absorbance was measured on a plate reader at 543 nm using a reference absorption baseline at 750 nm. Total NOx–, or NO3– + NO2–, was determined by chemical reduction to NO with hot acidified vanadium (III) and measured via chemiluminescence with a NOx analyzer (Garside, 1982; Braman and Hendrix, 1989). The detection limit for the chemiluminescent NOx– method was <0.10 μM. Initial and final pH was taken from a replicate under the same nutrient regimes and culture conditions, with initial pH measured prior to culture inoculation and final pH measured after culture had reached stationary phase.
Data Analysis
Logistic growth curves were fit to each OD time course and evaluated for goodness of fit. From this analysis, maximum growth rates, saturation points, and lag times were calculated for each replicate in each condition (Zwietering et al., 1990). Growth yields were approximated using fold-change differences between the initial inoculum of each culture and final OD at saturation.
From NOx– data, we calculated NO3– concentrations as NO3– = NOx––NO2– for each timepoint. Measurements for NOx–, NO3–, and NO2– were smoothed with a 2nd-degree polynomial Savitsky–Golay filter, which is widely used to filter time series data (Savitzky and Golay, 1964). As NOx– measurements, colorimetric NO2– concentrations, and calculated NO3– include a degree of noisiness, this filter minimizes the influence of noise upon calculated DNRN and denitrification rates. Rates of change for NOx–, NO3–, and NO2– with time were determined by differentiating with time each curve for each regime, condition, and replicate. DNRN rates were calculated by DNRN = –dNO3–/dt and denitrification rates were calculated as denitrification = –dNOx–/dt. Maximum DNRN and denitrification rates were found for each trial. For temporal dynamics for DNRN and denitrification, we delineate three broad categories in our data: synchronous, asynchronous, and contemporaneous. We define the activation of DNRN and denitrification as “synchronous” when the peaks for DNRN and denitrification rates are concurrent, i.e., the second derivatives of concentration with respect to time share the same sign and the maximum rates for DNRN and denitrification occur simultaneously. “Asynchronous” activation is defined as when DNRN rates and denitrification rates do not have maxima at approximately the same time, and rates do not follow the same temporal pattern of change (i.e., the second derivatives of concentration with respect to time have opposite signs). Behaviors in which the curves for DNRN and denitrification rates follow similar upward or downward trends over similar time periods, but do not peak at the same time point are termed “contemporaneous.”
The nitrite accumulation index was defined as NAI = (NO2–max–NO2–initial)/NO3–initial. Analyses were performed in MATLAB release R2018a. We used paired 1-sided and 2-sided t-tests as appropriate to evaluate the statistical significance of differences in growth rate, growth yield, nitrite accumulation indices, DNRN rates, and denitrification rates for each nutrient regime for generalists vis-à-vis specialists. The paired t-test was used to compare across all stoichiometric ratios of NO3–/NO2– for generalists vs. specialists under each nutrient regime.
Results
To confirm that the Pseudomonas aeruginosa PAO1 Δnar mutant could respire NO2– but not NO3–, the Δnir mutant could respire NO3– but not NO2–, and the wild-type (WT) strain could respire both, we grew all strains axenically under anoxic conditions for 27 h in LB media supplemented with 10 mM of NO3– or NO2–. As anticipated, the Δnar mutant could only grow under 10 mM NO2– but not under NO3– (Supplementary Figure 1A). The Δnir mutant could not grow under NO2–, but could grow under NO3–. WT grew under both conditions, indicating that 10 mM NO2– did not inhibit its growth, and grew better given NO3– as it could harness the additional energy of the first denitrification step. In addition, the Δnar mutant reached the same optical density (OD) as the wild-type under 10 mM NO2–, indicating that 10 mM NO2– did not inhibit its growth either. These results show that the Δnar mutant did indeed lose the function of the nar gene responsible for nitrate reductase but maintained the remainder of the denitrification pathway. Likewise, the Δnir mutant lost the function of the nir gene responsible for nitrite reductase but retained the function of nar and likely nor and nos. As all mutants reached an OD of ∼0.5 or higher within 27 h, and lag times for co-cultures (Supplementary Figure 2) approach those of axenic wild-type in several nutrient conditions, we do not expect growth or regulatory defects from these gene deletions to substantially impact our results.
To test whether the Δnar and Δnir mutants performed substrate cross-feeding in co-culture, we compared the growth of axenic Δnar and Δnir cultures against a co-culture of Δnar and Δnir (Δ + Δ) under anoxic conditions in LB supplemented with 1, 10, or 100 mM NO3–. We found the Δ + Δ co-culture grew under all initial NO3– conditions, while the axenic Δnar did not grow (Supplementary Figure 1B). The final co-culture OD surpassed the final OD of the axenic Δnir strain under all conditions, indicating that growth was not simply due to the Δnir strain within the co-culture but that the two strains performed metabolite cross-feeding. The Δ + Δ co-culture surpassed the growth of the axenic Δnir strain under 1 mM NO3–, so it is unlikely that this result was due to the toxicity of accumulated NO2– within the media. In addition, the axenic Δnir reached a higher OD under 10 mM NO3– and 100 mM NO3– than under 1 mM NO3–, indicating its ability to tolerate higher NO2– concentrations.
The dynamics of NOx– consumption, NO2– accumulation, and growth over the time course of sampling for each nutrient regime for two replicates for the 10:0 NO3–/NO2– ratio is displayed in Figure 2. Under a high carbon and NOx– regime (10 mM NOx– and 100% LB), the OD of all cultures reached greater than 0.5, but when available carbon was reduced by a factor of 10, growth decreased to an OD of 0.2–0.4 (Figure 2), indicating that growth was reduced by the lower amount of carbon. When carbon availability was kept high with 100% LB but available nitrogen was decreased to 1 mM NOx–, growth decreased to an OD of 0.15–0.25 (Figure 2), demonstrating growth limitation by NOx–. When both carbon and nitrogen availability were low in the low carbon and NOx– regime (1 mM NOx– and 10% LB), the final OD was further depressed compared to both low carbon and low NOx– regimes, to an OD of approximately 0.1 (Figure 2), indicating growth was depressed by starvation for carbon and NOx–. The control experiments in M9 minimal media showed no decrease in OD between 50 mM citrate (300 mM carbon) and 5 mM citrate (30 mM carbon) for the same NO3– concentrations (Supplementary Figure 3). This may be due to specifics of carbon metabolic processing or the total bioavailability of labile carbon derived from cellular material compared to citrate (Rojo, 2010; Dolan et al., 2020).
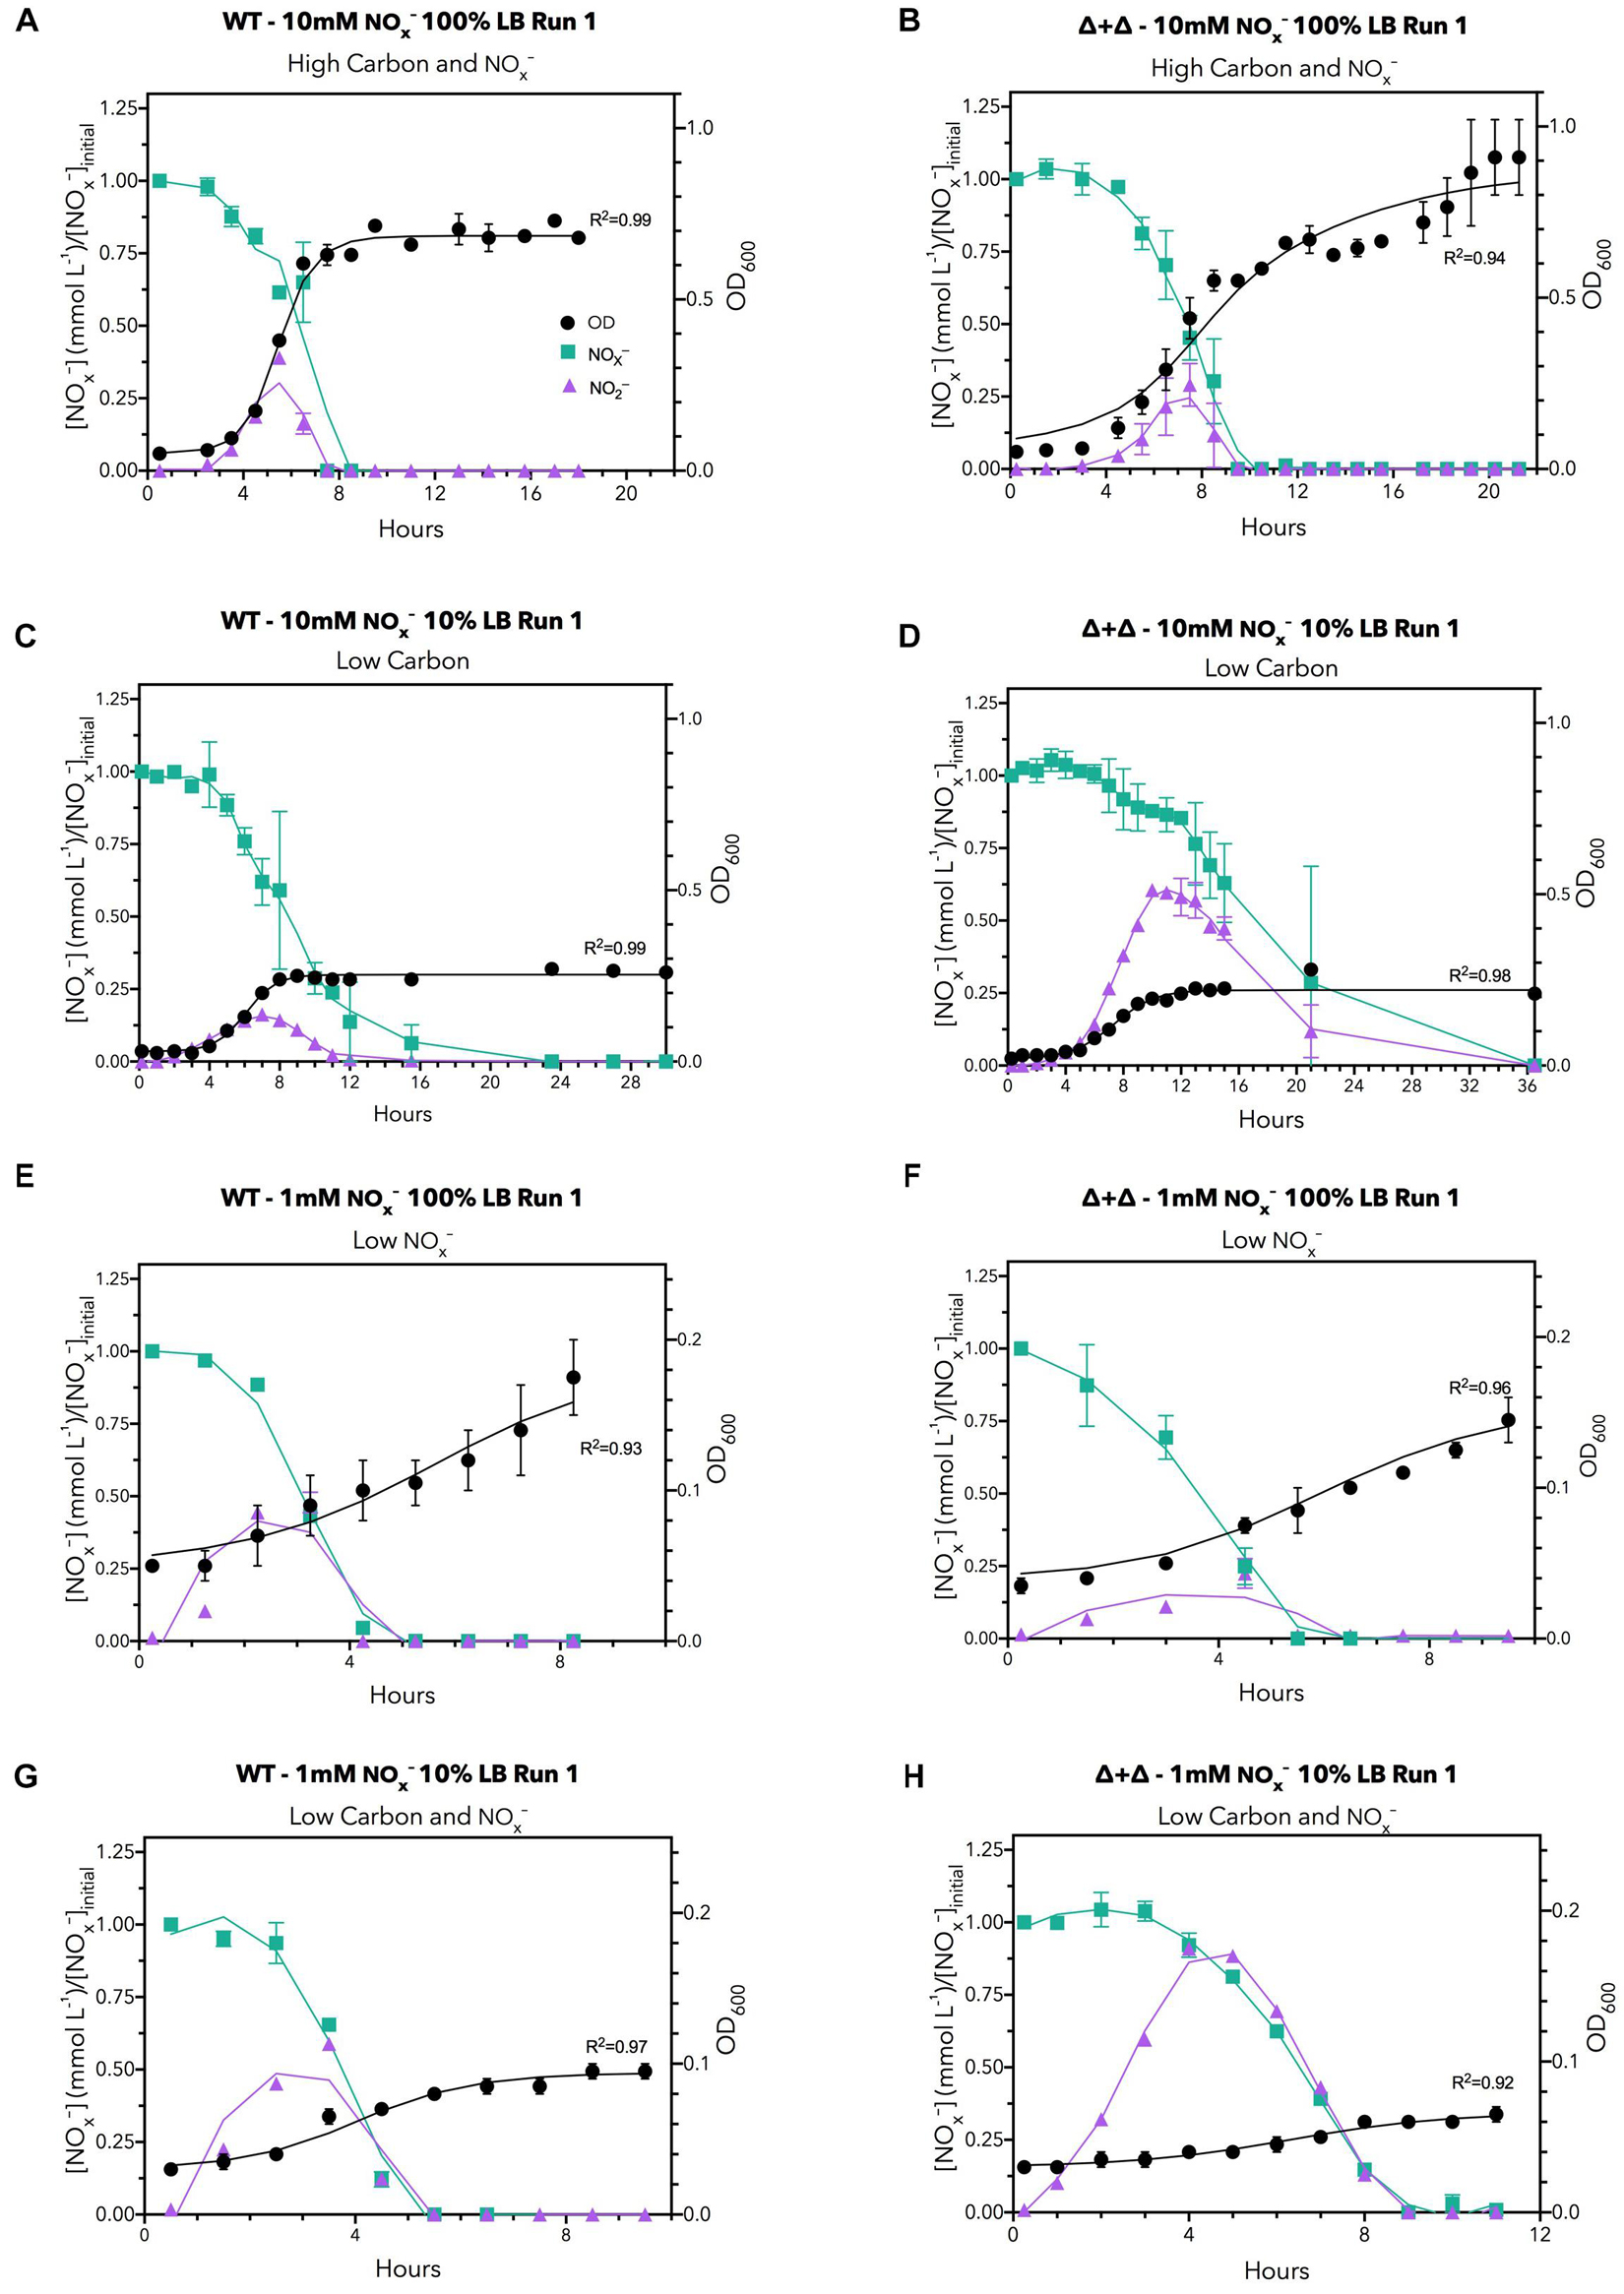
Figure 2. Time series data under all LB nutrient regimes for 10:0 NO3–/NO2– ratios for the first run. The regimes are: (A,B) high carbon and NOx– (C,D) low carbon, (E,F) low NOx– and (G,H) low carbon, and NOx–. NOx– (green), NO2– (purple), and bacterial growth (black) are shown. Left hand panels correspond to the wild-type culture whereas right hand panels depict the mutant co-culture. NOx– data are normalized to the initial NOx– concentration during plotting to reduce variability introduced by chemiluminescent measurements and variations in initial NOx– loading. Data points are the means of two biological replicates per condition, with error bars indicating ranges. Curves for NOx– and NO2– were smoothed with a Savitsky-Golay filter, while OD600 curves were fit to a logistic growth model. Selected plots are presented for brevity; analogous plots for other replicates and initial NO3–/NO2– ratios can be found in Supplementary Figures 6–9.
For each culture, we calculated the maximum growth rate and the approximate growth yield, represented in Figure 3. We approximate growth yields by taking the fold-change between the cell density of the starting culture and the maximum cell density based on OD. Under high carbon and NOx– and low carbon regimes, in which nitrogen was high, Δ + Δ co-cultures achieved a higher growth yield (high carbon and NOx–: n = 8, paired 1-sided t-test, p = 0.0002; low carbon: n = 8, paired 1-sided t-test, p = 0.002), while WT exhibited a higher maximum growth rate (high carbon and NOx–: n = 8, paired 1-sided t-test, p = 0.001; low carbon: n = 8, paired 1-sided t-test, p = 6.5 × 10⁻⁷) (Figure 3). However, when NOx– was low at 1 mM, the relationship between growth rate and growth yield for the Δ + Δ co-cultures compared to WT changed. Under low NOx– regimes, the differences between growth rate and growth yield for each culture were non-significant (p > 0.01 as determined by a 1-sided t-test). Under low carbon and NOx– regimes, WT had higher maximum growth rates (n = 8, paired 1-sided t-test, p = 0.009) but growth yields were not significantly different (n = 8, paired 1-sided t-test, p = 0.08). For these statistical tests, we used 10:0, 9:1, and 5:5 NO3–/NO2– stoichiometric ratios and excluded the 1:9 stoichiometric ratio as the low NO3– availability could not support substantial growth of the obligate NO2– producer within the co-culture. Growth effects for the 1:9 ratio more likely result from the lower initial inoculum sizes of cells capable of utilizing NO2– in the Δ + Δ co-cultures compared to the WT, and little potential for cross-feeding exists between the two mutants, particularly in the 1 mM NOx– regimes. Previous studies indicate the precise context in terms of the type of carbon compound is key (Rojo, 2010; Dolan et al., 2020), and our control experiments with a single carbon source also suggest a possible growth yield vs. growth rate tradeoff between WT and Δ + Δ under all nutrient regimes, warranting follow-up study to investigate species specific responses to carbon affinity (Supplementary Figure 4A).
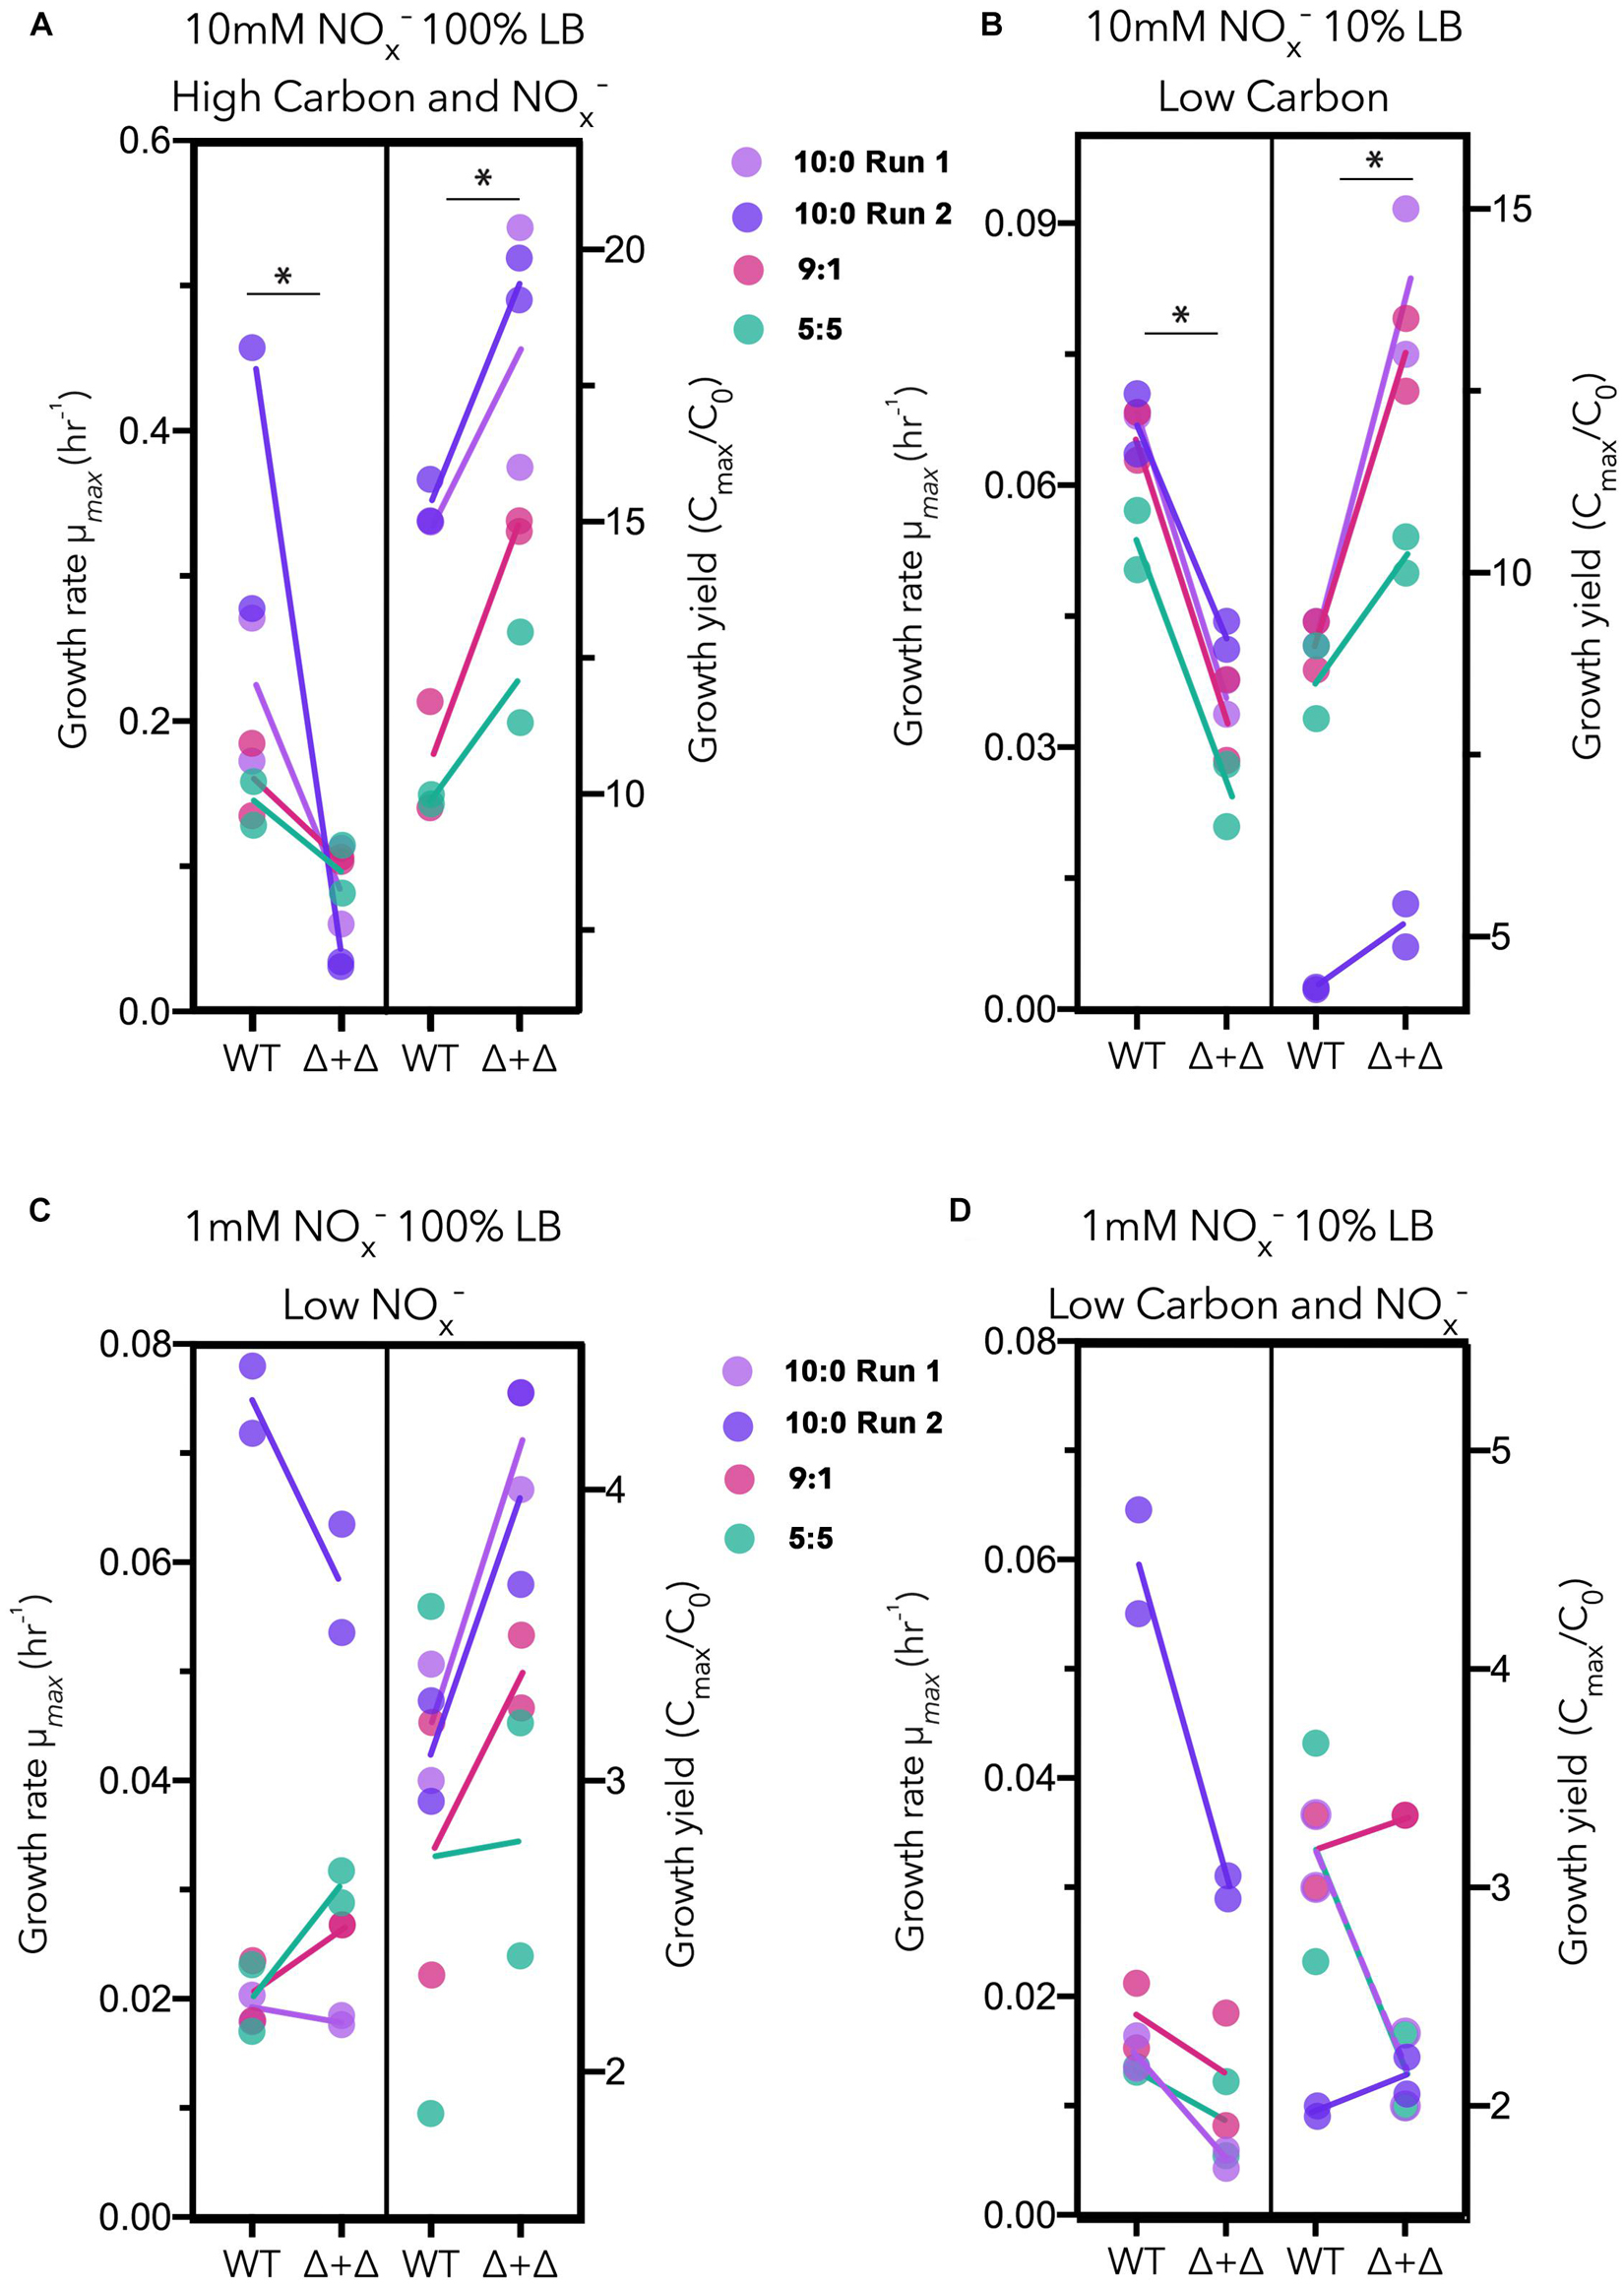
Figure 3. Growth rate vs. growth yield for generalists and specialists in LB. Results for three stoichiometric NO3–/NO2– ratios (10:0 run 1, lavender; 10:0 run 2, dark purple; 9:1, red; 5:5, green) are plotted together for each nutrient regime as follows: (A) high carbon and NOx–, (B) low carbon, (C) low NOx–, and (D) low carbon and NOx–. Maximum growth rates (μmax) vs. growth yields (Cmax/C0) are plotted separately for wild-type (WT) and Δnar + Δnir co-culture (Δ + Δ). For both WT and Δ + Δ, n = 4 for the 10:0 NO3–/NO2– ratio and n = 2 for the 9:1 and 5:5 ratio for each nutrient regime, and n = 8 for each nutrient regime including all depicted ratios, omitting 1:9.
From total nitrogen oxyanion (NOx–) concentrations measured for each time point, we found a loss of NOx– from both the WT and Δ + Δ co-cultures (Figure 2). For the Δ + Δ co-cultures, this demonstrates that the obligate NO2– producer (Δnir) reduced NO3– to NO2–, and the obligate NO2– consumer (Δnar) further reduced NO2–. Distinct temporal dynamics of nitrogen oxyanion (NOx–) consumption distinguish Δ + Δ co-cultures and axenic WT. In addition to measuring total NOx– over time, we also measured NO2– over time and, from the curves of NOx– and NO2–, calculated NO3– over time. Assuming that both mutants could respire NO and N2O, we focused our analysis on the reduction of NO3– to NO2– and the loss of NO2–, which we respectively differentiate as DNRN and denitrification. Although DNRN canonically represents the initial reaction of the denitrification pathway, fixed nitrogen is not lost as the resulting NO2– remains bioavailable. However, the reduction of NO2– to gaseous forms of nitrogen results in the loss of bioavailable nitrogen from the system, and this step is considered the defining reaction of denitrification. We found the rates of DNRN and denitrification in all conditions, as shown in Figure 4. DNRN rates did not vary between WT or co-culture in any condition (n = 40, paired 2-sided t-test, p = 0.3) (Figure 4A). Notably, DNRN rates were 10-fold higher in the 10 mM NOx– regimes compared to the 1 mM NOx– regimes. At higher initial NO3– conditions (10:0, 9:1), DNRN rates were highest, whereas DNRN rates were lowest under the 1:9 NO3–/NO2–, condition. This reveals that the major determinant of DNRN rate is the amount of NO3– available and that both WT and the Δ + Δ co-culture reduce NO3– with equal speed. In contrast, denitrification rates were statistically indistinguishable between cultures growing in 100% LB (n = 20, paired 2-sided t-test, p = 0.2) but denitrification rates were lower for Δ + Δ co-cultures compared to wild-type in 10% LB (n = 20, paired 1-sided t-test, p = 0.006) (Figure 4B). This difference was observed for all stoichiometric NO3–/NO2– ratios in LB.
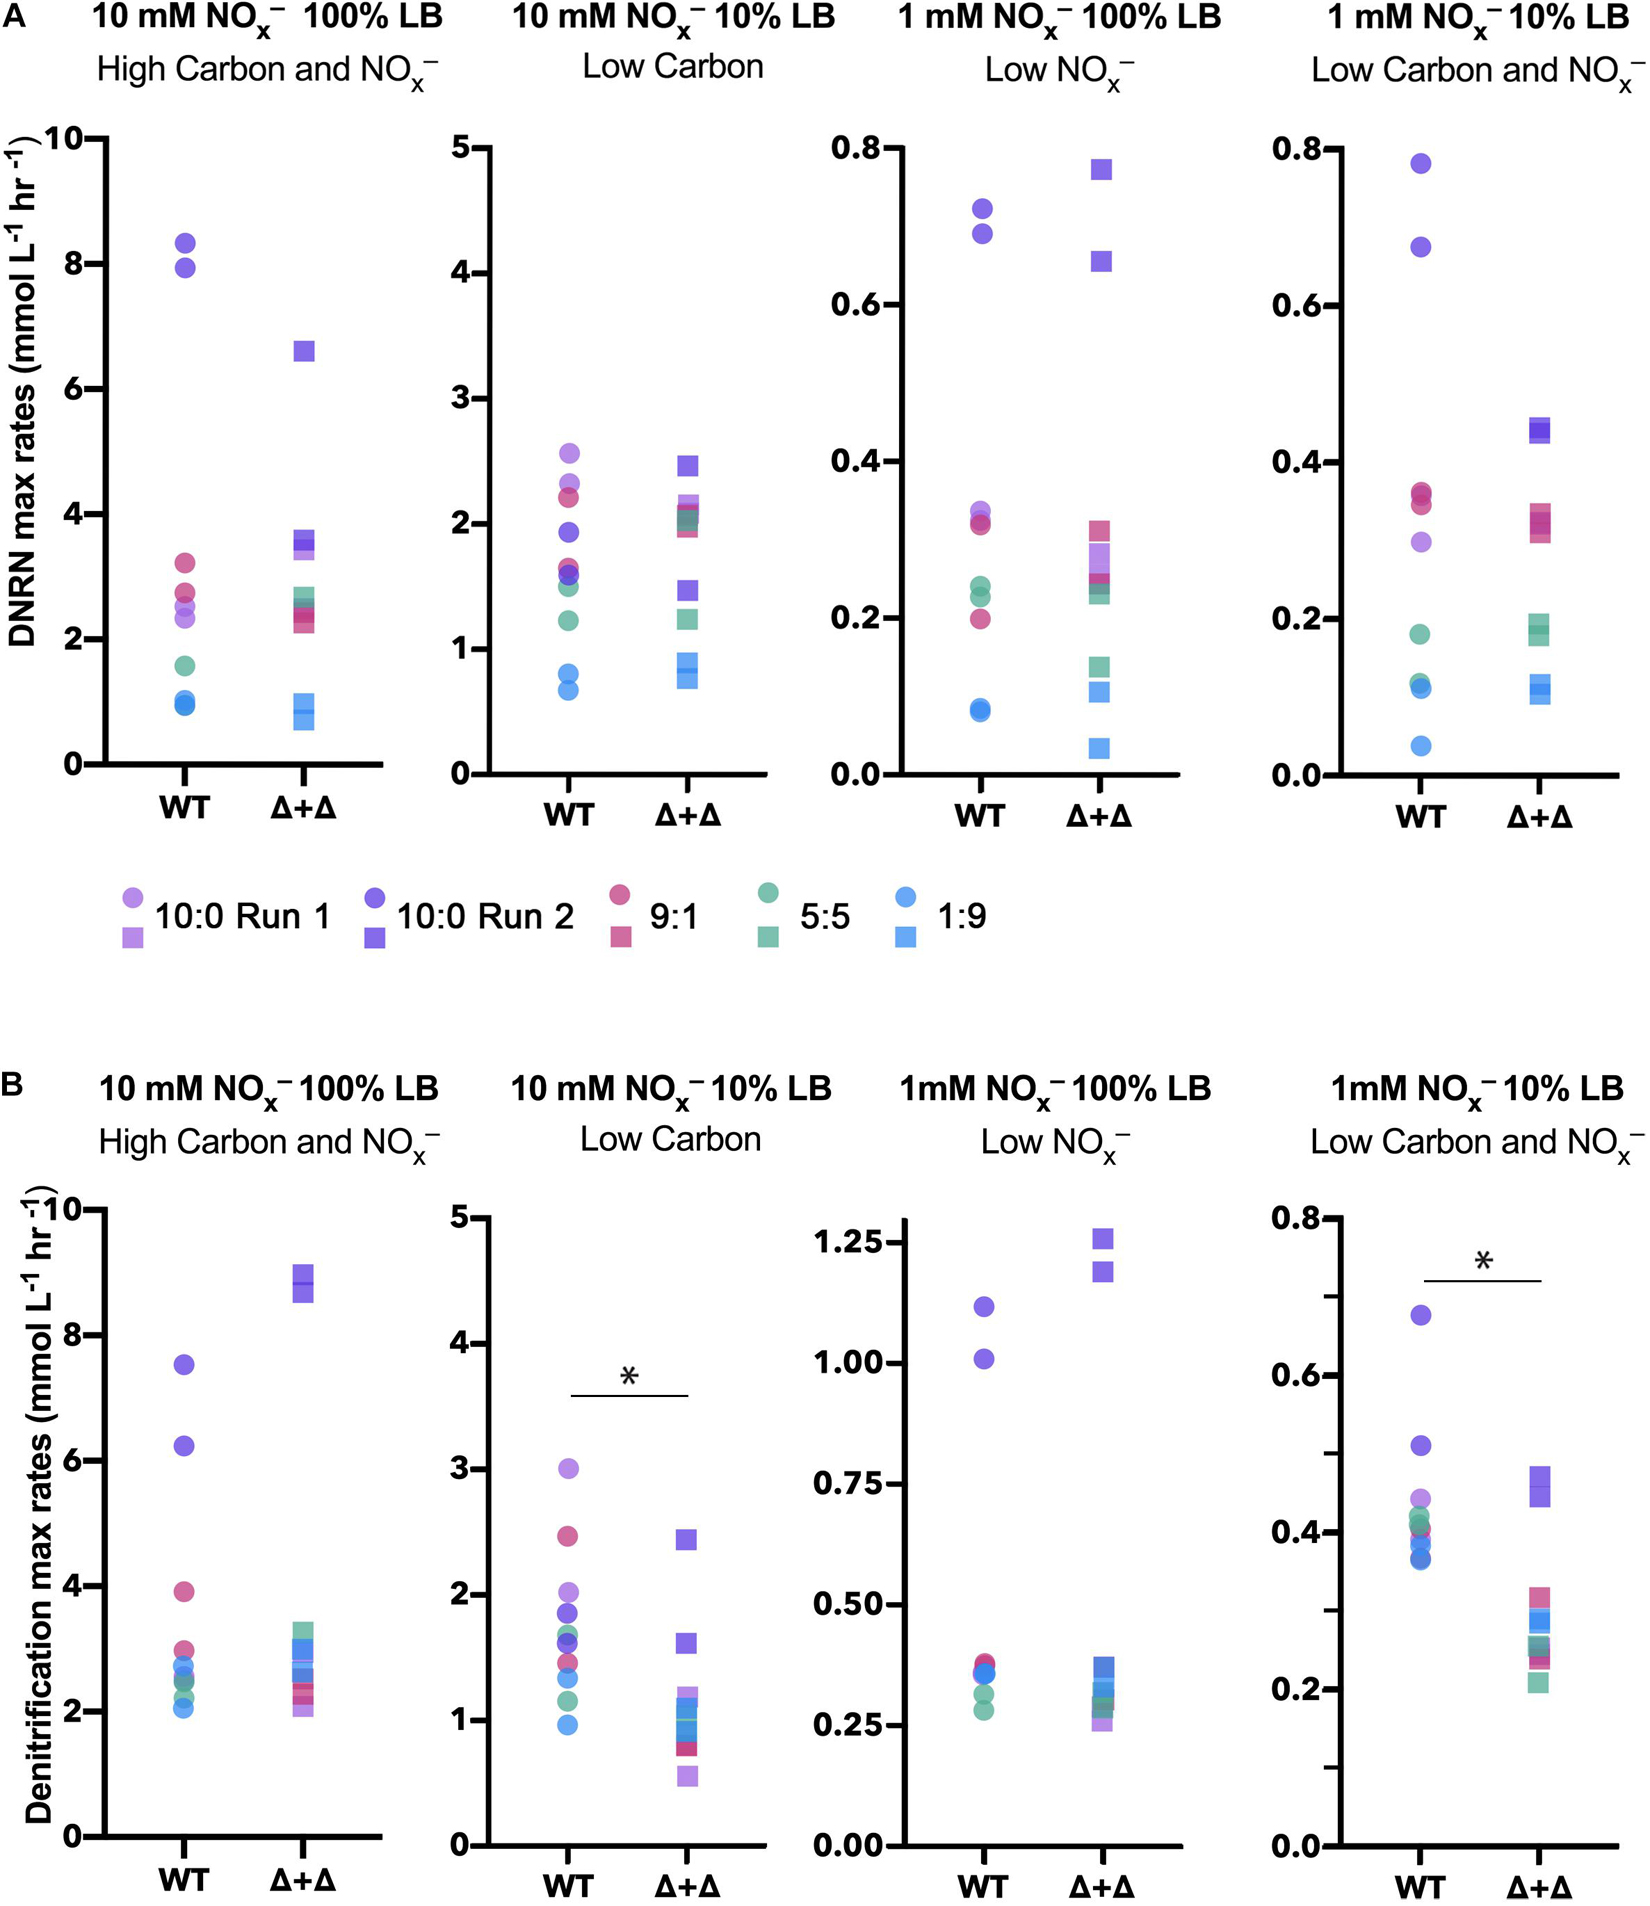
Figure 4. Maximum DNRN and denitrification rates for WT and Δ + Δ cultures in LB. Maximum DNRN rates are plotted for each culture under each nutrient condition and colored by NO3–/NO2– ratio (10:0 run 1, lavender; 10:0 run 2, dark purple; 9:1, red; 5:5, green; 1:9, blue). For both WT and Δ + Δ, n = 4 for the 10:0 NO3–/NO2– ratio and n = 2 for the 9:1 and 5:5 ratio for each nutrient regime, and n = 10 for each nutrient regime including all depicted ratios. There is no significant difference in DNRN rates when comparing between WT or Δ + Δ for any treatment. DNRN rates are 10-fold higher under 10-fold higher NOx–, but are not influenced by carbon availability. (B) Maximum denitrification rates for cultures and conditions, as in panel (A). For 10% LB regimes, denitrification rates decrease in Δ + Δ cultures, while there is no difference between denitrification rates when comparing cultures for 100% LB regimes. NO3–/NO2– ratios did not significantly affect denitrification rates.
To examine whether the NO2– accumulation differs between specialists and generalists, we compared the NO2– accumulation index (NAI) for each nutrient condition. NAI = 1 indicates all NO3– was reduced quantitatively to NO2– before NO2– reduction commenced whereas NAI = 0 reflects no transient NO2– accumulation. For the high carbon and NOx– regime, NO2– accumulates to a moderate extent in the 10:0 ratio (NAI = 0–0.5), and Δ + Δ co-cultures and WT do not differ significantly from each other (n = 8, paired 2-sided t-test, p = 0.9). The highest NAI values occurred in the Δ + Δ co-cultures under low carbon, reaching almost 100% of the initial nitrogen loading, significantly higher than WT under the same conditions (n = 8, paired 1-sided t-test, p = 0.002) (Figure 5). For the low NOx–, high carbon regime, WT cultures generally reached higher NAI than Δ + Δ co-cultures (n = 8, paired 1-sided t-test, p = 0.01). In the single carbon control, WT cultures did not accumulate measurable NO2– in any condition whereas Δ + Δ co-cultures consistently accumulated this intermediate (Supplementary Figure 4B). However, high variability was observed in NAI between replicates started from different inocula for the 10:0 ratio, indicating additional controls on NAI beyond nutrient condition or metabolic lifestyle.
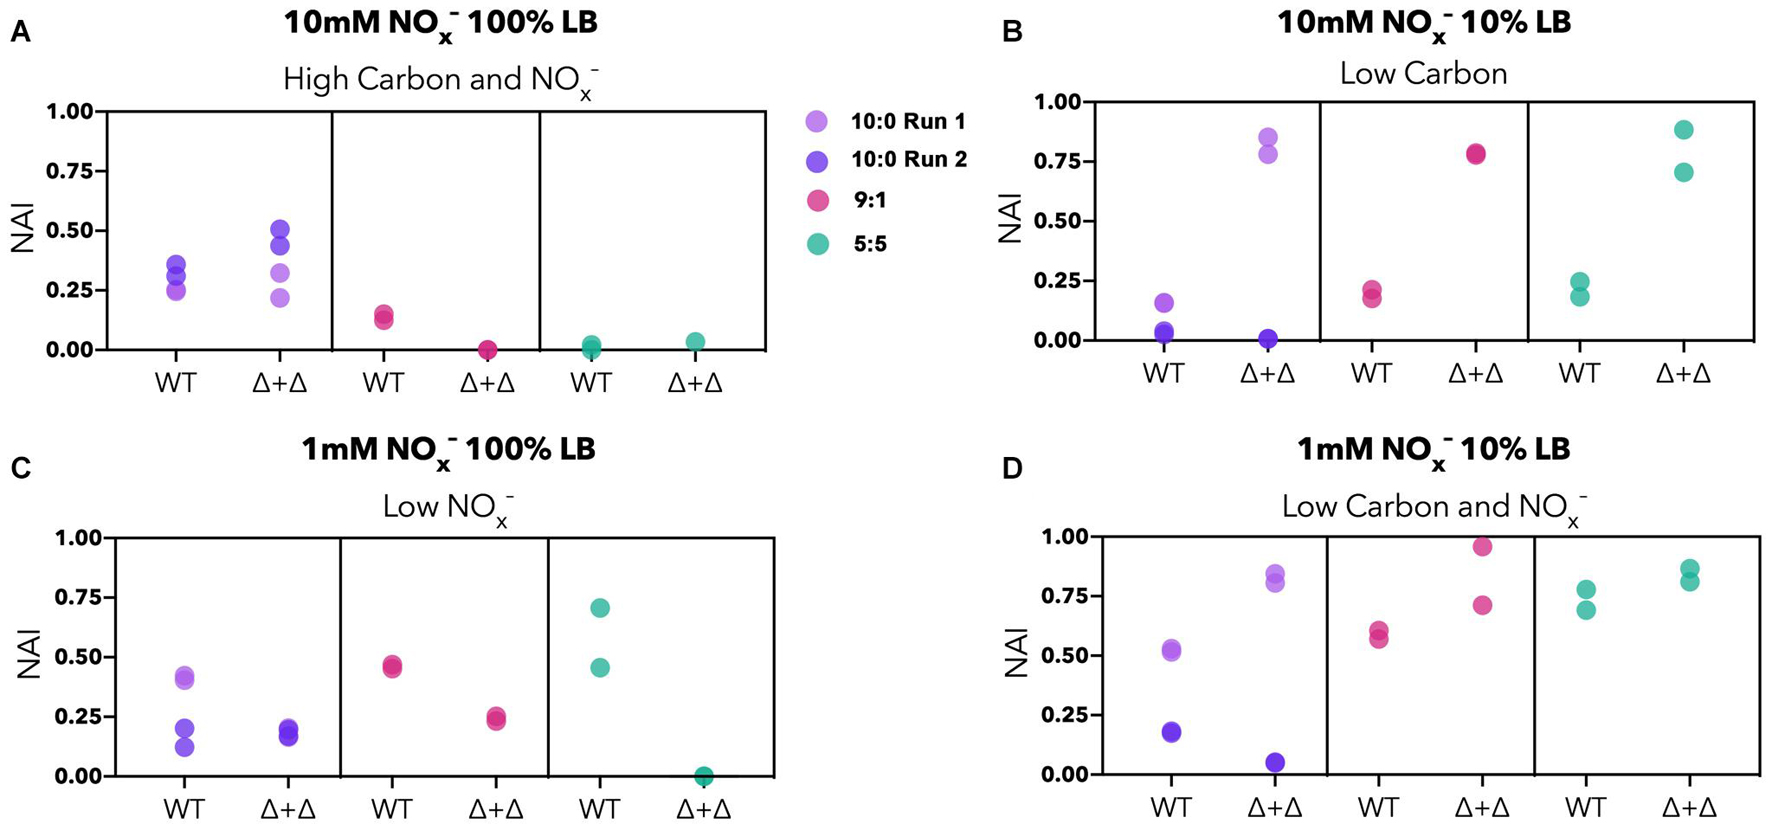
Figure 5. NO2– accumulation index (NAI) for generalist and specialist cultures in LB. Stoichiometric ratios are plotted separately for Δ + Δ co-cultures and WT for each nutrient regime (10:0 run 1, lavender; 10:0 run 2, dark purple; 9:1, red; 5:5, green). For both WT and Δ + Δ, n = 4 for the 10:0 NO3–/NO2– ratio and n = 2 for the 9:1 and 5:5 ratio for each nutrient regime, and n = 8 for each nutrient regime including all depicted ratios, omitting 1:9. NAI relates to synchronicity, with synchronous cultures exhibiting low NAI and asynchronous cultures exhibiting high NAI. (A) The NAI is low to moderate for high carbon and NOx– regimes; (B) NAI is generally higher for Δ + Δ for low carbon regimes, but variable between replicates; (C) NAI is generally higher for WT for low NOx– regimes; (D) NAI can reach high values for low carbon and NOx– but is variable between replicates.
In addition to maximum rates and NO2– changes, we explored the temporal dynamics of DNRN and denitrification during growth. We did not find clear partitioning of synchronicity according to either nutrient regime or specialist vs. generalist cultures (Supplementary Figure 5). The observed patterns of synchronicity follow the extent of NO2– accumulation. For cultures in LB exhibiting asynchronous DNRN and denitrification dynamics, more NO2– accumulates. Conversely, cultures exhibiting synchronous DNRN and denitrification accumulate less NO2–, and contemporaneous cultures accumulate some NO2– but not to levels as high as asynchronous cultures. In all conditions, DNRN always proceeds prior to denitrification. These patterns suggest that synchronicity, rather than maximal DNRN or denitrification rates, drives the accumulation of NO2–.
In general, Δ + Δ co-cultures required a longer time to begin growth, perform DNRN and denitrification, and reach the stationary phase. Lag times, defined as the period prior to cell division and exponential growth, are generally higher for Δ + Δ co-cultures vs. the WT PAO1 across all regimes (Supplementary Figure 2). The onset of DNRN and denitrification in Δ + Δ was generally slower than in WT, possibly reflecting the lower initial density of denitrification-capable cells (Δnar). The duration of time from inoculation to the total consumption of NOx– was consistently longer in Δ + Δ than in WT (Supplementary Figures 6–9), reflective of the same growth rate v. yield tradeoff between WT and Δ + Δ cultures. OD curves indicate that the Δ + Δ co-cultures require longer to reach saturation, which is consistent with the observation that logarithmic growth corresponds with the period of DNRN and denitrification activity.
Discussion
The results from this study, examining a high carbon and NOx– regime for the axenic Pseudomonas aeruginosa PAO1 wild-type (WT) generalist compared to co-cultured DNRN and denitrification (Δ + Δ) specialists, are consistent with a growth rate vs. growth yield tradeoff. Our results in both LB and M9 media offer evidence for this tradeoff. Growth rate and growth yield, a proxy for net growth efficiency, are two fundamental traits of microbes that influence community function, evolution, and species coexistence (Lipson, 2015). This rate vs. yield tradeoff has been found within laboratory evolution experiments using diverse organisms such as E. coli (Novak et al., 2006), Lactobacillus lactis (Bachmann et al., 2013), and yeasts (Weusthuis et al., 1994), as well as in natural microbial communities (Sorokin et al., 2003; Lipson et al., 2009). However, to our knowledge, this tradeoff has not previously been experimentally demonstrated using model generalists and specialists within the same strain in the context of varying nutrient regimes.
Previous numerical approaches have shown that the rate vs. yield tradeoff is not universal, but depends upon environmental conditions (Lipson et al., 2009; Beardmore et al., 2011). We find this tradeoff to be consistent for nutrient replete and low carbon conditions. When the amount of NOx– (electron acceptor) is decreased, some Δ + Δ co-cultures reach higher growth rates compared to WT and some WT cultures reach higher growth yields than Δ + Δ co-cultures (Figure 3). Metabolic savings alone are unlikely to explain this, so it may be useful to interpret this result through the lens of ecological interactions within each culture. Within axenic WT, each cell competes with others for NOx– and carbon. However, within a Δ + Δ co-culture, competitive pressure for NOx– is reduced as only a portion of the population can use NO3– while the other portion can only use NO2–. In addition, obligate NO2– consumers engage in a commensal relationship with obligate NO2– producers. Previous studies have demonstrated the differential effects of competition or commensalism on the spatial arrangements and communal behaviors of interacting denitrifiers (Hibbing et al., 2010; Faust and Raes, 2012; Lilja and Johnson, 2019; Ciccarese et al., 2020). Under a low NOx– regime, competition for NOx– may complicate the terms of the rate vs. yield tradeoff. Additionally, in nutrient-depleted conditions, low cell density may impede efficient substrate exchange between separate specialist populations. Further experiments are required to pinpoint the conditions under which the rate vs. yield tradeoff changes and the mechanisms, ecological or physiological, underlying this change.
The presence of metabolic division of labor generally correlates with increased potential accumulation of NO2– and other metabolic intermediates in natural environments. However, accumulation of NO2– may also occur in complete denitrifiers under certain conditions, and displays high variability even for cultures with the same genetic content growing under the same nutrient conditions. The accumulation of NO2– also changes for cultures growing in mixed vs. single carbon sources, as complexity in carbon resources will likely modify thermodynamic and kinetic stimuli (Rojo, 2010). Over the course of the cultures, interactions in the co-culture may lead to varied growth dynamics of each mutant. These specific dynamics, while not captured in our experimental scheme, may clarify this variability between cultures and serves as a basis for future experimental work. Additionally, further studies on the regulation of the denitrification pathway, the link between denitrification and carbon metabolism in generalist and specialist species, and the individual growth dynamics of each specialist within co-cultures are required to determine the exact drivers of intermediate accumulation and its impacts on denitrifying community behavior.
The accumulation of NO2– does not track with differences in maximal DNRN or denitrification rates between cultures or nutrient conditions. Obligate NO2– producers do not exhibit lower rates of NO3– conversion compared to wild-type generalists under any nutrient condition (Figure 4A). In contrast, obligate NO2– consumers maintain decreased rates of NO2– reduction compared to generalists only when carbon is low (Figure 4B). This indicates different sensitivities or regulations of nar and nir toward nutrient availability and type. However, differential accumulation of NO2– between WT and co-cultures occurred in low NOx– conditions, which displayed little difference in DNRN or denitrification rates. This may be explained by the temporal dynamics of DNRN and denitrification. Cultures exhibiting low NAI are more synchronous than cultures exhibiting high NAI (Supplementary Figure 5). For the WT, this synchronicity points to simultaneous activation of both portions of the denitrification pathway, but for the co-culture synchronous DNRN and denitrification indicates simultaneous metabolism by both specialists. Asynchronous behavior in the WT reveals a temporal delay between DNRN and denitrification, possibly due to regulatory differences in gene expression between nar and nir (Körner and Zumft, 1989; Schreiber et al., 2007). In the Δ + Δ co-culture, asynchrony indicates population succession, with the obligate NO2– producer growing first followed later by the obligate NO2– consumer. The only conditions under which specialists exhibit generally more synchronous behavior than WT are low NOx–. The ability of both populations to grow non-exclusively points to a commensal, rather than competitive, interaction for a scarce nutrient. This commensal interaction correlates with the only regime (low NOx–) in which NAI is lower for the Δ + Δ co-culture than for the WT (Figure 5). Broadly, these results suggest that the temporal dynamics rather than the maximal rates of the individual steps of denitrification may drive the extent of intermediate accumulation. Further work on individual dynamics of growth for each mutant and timing of nar and nir transcription may shed light upon the mechanisms underlying these behaviors.
Pseudomonas aeruginosa, along with many other denitrifying and non-denitrifying organisms, possesses an additional nitrate reductase system, periplasmic nitrate reductase enzyme Nap encoded by the nap gene (Alst et al., 2009). As nap was not deleted in our system, this may potentially influence NO3– reduction. However, since Nap cannot generate a proton motive force for ATP synthesis and growth, it is unlikely that Nap played a large role in the growth dynamics observed. Additionally, nap, along with fermentative processes, has been shown to activate mostly in the stationary phase, while nar is expressed during active growth (Alst et al., 2009; Schiessl et al., 2019). As the dynamics we observe are based upon pre-stationary phase growth and metabolism under anoxic conditions, we do not expect either of these processes to be a substantial influence. However, the regulation of the denitrification pathway is complex, so the influence of nap cannot be ruled out and requires further investigation. The role of nap in denitrification dynamics, denitrifier evolution, and metabolic niche differentiation is an exciting complementary research avenue.
Using engineered strains of Pseudomonas aeruginosa PAO1, we compare the behavior of complete denitrifiers against a community in which the denitrification pathway has been partitioned between obligate NO2– producers and consumers. Our results indicate a growth rate vs. growth yield tradeoff between complete denitrifiers, or generalists, and partial denitrifiers, or specialists under nutrient replete and high NOx– conditions. While few studies have surveyed complete vs. partial denitrifiers across various environments, several studies on denitrifying communities reveal a high prevalence of partial denitrifiers in soils and wetlands (Roco et al., 2017). A study of metagenome-assembled genomes from various environments also discovered a higher ratio of complete:partial denitrifiers in built environments and in marine and brackish systems (Hester et al., 2019). Relatively richer nutrient conditions and spatial segregation in soils and wetlands may select for metabolic specialization, while more nutrient-limited environments may select for complete denitrifiers. However, more work is required to link the prevalence of complete vs. partial denitrifiers across environments and their nutrient contexts.
We find that nutrient availability, relative amounts of carbon to NOx–, and the composition of metabolic lifestyles within a denitrifying system play key roles in driving the rate vs. yield tradeoff, the dynamics of NOx– consumption, and the accumulation of chemical intermediates. Our data provide evidence of the differences in the growth and denitrification behavior between a community of specialists and generalists, but variability between replicates in relation to the extent of NO2– accumulation indicates a complexity in the denitrification pathway that remains to be resolved. Denitrification regulation, bacterial carbon and nitrogen metabolism, the specific thermodynamics driving complete vs. partial denitrification, and the ecological and chemical interactions among denitrifying microbes are likely to be fruitful avenues of future investigation.
Data Availability Statement
The original contributions presented in the study are included in the article/Supplementary Material, further inquiries can be directed to the corresponding author/s.
Author Contributions
IZ, SM, DC, SS, and AB analyzed the data and wrote the manuscript. SM conducted the experiments. IZ, SM, DD, and DM analyzed nitrogen samples. MT and NN provided knockout strains for this research. AB designed the study and supervised the project. All authors contributed to the article and approved the submitted version.
Funding
Funding for this work was provided by Simons Foundation award 622065 and an MIT Environmental Solutions Initiative seed grant to AB. Additional support was received by the MIT Ferry Fund.
Conflict of Interest
The authors declare that the research was conducted in the absence of any commercial or financial relationships that could be construed as a potential conflict of interest.
Publisher’s Note
All claims expressed in this article are solely those of the authors and do not necessarily represent those of their affiliated organizations, or those of the publisher, the editors and the reviewers. Any product that may be evaluated in this article, or claim that may be made by its manufacturer, is not guaranteed or endorsed by the publisher.
Acknowledgments
We would like to thank Sarah Schwartz for her preliminary experimental results which have helped define the directions for this study.
Supplementary Material
The Supplementary Material for this article can be found online at: https://www.frontiersin.org/articles/10.3389/fmicb.2021.711073/full#supplementary-material
References
Almeida, J. S., Reis, M. A. M., and Carrondo, M. J. T. (1995). Competition between nitrate and nitrite reduction in denitrification by Pseudomonas fluorescens. Biotechnol. Bioeng. 46, 476–484.
Alst, V. E. N., Sherrill, L. A., Iglewski, B. H., and Haidaris, C. G. (2009). Compensatory periplasmic nitrate reductase activity supports anaerobic growth of Pseudomonas aeruginosa PAO1 in the absence of membrane nitrate reductase. Can. J. Microbiol. 55, 1133–1144. doi: 10.1139/w09-065
Alvarez, L., Bricio, C., Gómez, M. J., and Berenguer, J. (2011). Lateral transfer of the denitrification pathway genes among Thermus thermophilus strains. Appl. Environ. Microbiol. 77, 1352–1358. doi: 10.1128/aem.02048-10
Arrigo, K. R. (2005). Marine microorganisms and global nutrient cycles. Nature 437, 349–355. doi: 10.1038/nature04159
Bachmann, H., Fischlechner, M., Rabbers, I., Barfa, N., Branco, F., Santos, D., et al. (2013). Availability of public goods shapes the evolution of competing metabolic strategies. Proc. Natl. Acad. Sci. U.S.A. 110, 14302–14307. doi: 10.1073/pnas.1308523110
Beardmore, R. E., Gudelj, I., Lipson, D. A., and Hurst, L. D. (2011). Metabolic trade-offs and the maintenance of the fittest and the flattest. Nature 472, 342–346. doi: 10.1038/nature09905
Bergaust, L., Mao, Y., Bakken, L. R., and Frostegård, Å (2010). Denitrification response patterns during the transition to anoxic respiration and posttranscriptional effects of suboptimal pH on Nitrogen oxide reductase in Paracoccus denitrificans. Appl. Environ. Microbiol. 76, 6387–6396. doi: 10.1128/aem.00608-10
Blaszczyk, M. (1993). Effect of medium composition on the denitrification of nitrate by Paracoccus denitrificans. Appl. Environ. Microbiol. 59, 3951–3953. doi: 10.1128/aem.59.11.3951-3953.1993
Borrero-de Acuña, J. M., Timmis, K. N., Jahn, M., and Jahn, D. (2017). Protein complex formation during denitrification by Pseudomonas aeruginosa. Microb. Biotechnol. 10, 1523–1534.
Braman, R. S., and Hendrix, S. A. (1989). Nanogram nitrite and nitrate determination in environmental and biological materials by vanadium(III) reduction with chemiluminescence detection. Anal. Chem. 61, 2715–2718. doi: 10.1021/ac00199a007
Brandhorst, W. (1959). Nitrification and denitrification in the eastern tropical North Pacific. ICES J. Mar. Sci. 25, 3–20. doi: 10.1093/icesjms/25.1.3
Chen, R., Deng, M., He, X., and Hou, J. (2017). Enhancing nitrate removal from freshwater pond by regulating carbon/nitrogen ratio. Front. Microbiol. 8:1712. doi: 10.3389/fmicb.2017.01712
Ciccarese, D., Zuidema, A., Merlo, V., and Johnson, D. R. (2020). Interaction-dependent effects of surface structure on microbial spatial self-organization. Philos. Trans. R. Soc. Lond. B Biol. Sci. 375:20190246. doi: 10.1098/rstb.2019.0246
Costa, E., Pérez, J., and Kreft, J. U. (2006). Why is metabolic labour divided in nitrification? Trends Microbiol. 14, 213–219. doi: 10.1016/j.tim.2006.03.006
D’Souza, G., Shitut, S., Preussger, D., Yousif, G., Waschina, S., and Kost, C. (2018). Ecology and evolution of metabolic cross-feeding interactions in bacteria. Nat. Prod. Rep. 35, 455–488. doi: 10.1039/c8np00009c
Dolan, S. K., Kohlstedt, M., Trigg, S., Vallejo Ramirez, P., Kaminski, C. F., Wittmann, C., et al. (2020). Contextual flexibility in Pseudomonas aeruginosa central carbon metabolism during growth in single carbon sources. mBio 11, e2684–e2719.
Faust, K., and Raes, J. (2012). Microbial interactions: from networks to models. Nat. Rev. Microbiol. 10, 538–550. doi: 10.1038/nrmicro2832
Flemming, H. C., and Wuertz, S. (2019). Bacteria and archaea on Earth and their abundance in biofilms. Nat. Rev. Microbiol. 17, 247–260. doi: 10.1038/s41579-019-0158-9
Garside, C. (1982). A chemiluminescent technique for the determination of nanomolar concentrations of nitrate and nitrite in seawater. Mar. Chem. 11, 159–167. doi: 10.1016/0304-4203(82)90039-1
Ge, S., Peng, Y., Wang, S., Lu, C., Cao, X., and Zhu, Y. (2012). Nitrite accumulation under constant temperature in anoxic denitrification process: the effects of carbon sources and COD/NO3-N. Bioresour. Technol. 114, 137–143. doi: 10.1016/j.biortech.2012.03.016
Giovannoni, S. J. (2005). Genome streamlining in a cosmopolitan oceanic bacterium. Science 309, 1242–1245. doi: 10.1126/science.1114057
Graf, D. R. H., Jones, C. M., and Hallin, S. (2014). Intergenomic comparisons highlight modularity of the denitrification pathway and underpin the importance of community structure for N2O emissions. PLoS One 9:e114118. doi: 10.1371/journal.pone.0114118
Granger, J., and Ward, B. B. (2003). Accumulation of nitrogen oxides in copper-limited cultures of denitrifying bacteria. Limnol. Oceanogr. 48, 313–318. doi: 10.4319/lo.2003.48.1.0313
Hester, E. R., Jetten, M. S. M., Welte, C. U., and Lücker, S. (2019). Metabolic overlap in environmentally diverse microbial communities. Front. Genet. 10:989. doi: 10.3389/fgene.2019.00989
Hibbing, M. E., Fuqua, C., Parsek, M. R., and Peterson, S. B. (2010). Bacterial competition: surviving and thriving in the microbial jungle. Nat. Rev. Microbiol. 8, 15–25. doi: 10.1038/nrmicro2259
Johnson, D. R., Goldschmidt, F., Lilja, E. E., and Ackermann, M. (2012). Metabolic specialization and the assembly of microbial communities. ISME J. 6, 1985–1991. doi: 10.1038/ismej.2012.46
Jones, C. M., Stres, B., Rosenquist, M., and Hallin, S. (2008). Phylogenetic analysis of nitrite, nitric oxide, and nitrous oxide respiratory enzymes reveal a complex evolutionary history for denitrification. Mol. Biol. Evol. 25, 1955–1966. doi: 10.1093/molbev/msn146
Kinnersley, M. A., Holben, W. E., and Rosenzweig, F. (2009). E unibus plurum: genomic analysis of an experimentally evolved polymorphism in Escherichia coli. PLoS Genet. 5:e1000713. doi: 10.1371/journal.pgen.1000713
Körner, H., and Zumft, W. G. (1989). Expression of denitrification enzymes in response to the dissolved oxygen level and respiratory substrate in continuous culture of Pseudomonas stutzeri. Appl. Environ. Microbiol. 55, 1670–1676. doi: 10.1128/aem.55.7.1670-1676.1989
Lilja, E. E., and Johnson, D. R. (2016). Segregating metabolic processes into different microbial cells accelerates the consumption of inhibitory substrates. ISME J. 10, 1568–1578. doi: 10.1038/ismej.2015.243
Lilja, E. E., and Johnson, D. R. (2019). Substrate cross-feeding affects the speed and trajectory of molecular evolution within a synthetic microbial assemblage. BMC Evol. Biol. 19:129. doi: 10.1186/s12862-019-1458-4
Lipson, D. A. (2015). The complex relationship between microbial growth rate and yield and its implications for ecosystem processes. Front. Microbiol. 6:615. doi: 10.3389/fmicb.2015.00615
Lipson, D. A., Monson, R. K., Schmidt, S. K., and Weintraub, M. N. (2009). The trade-off between growth rate and yield in microbial communities and the consequences for under-snow soil respiration in a high elevation coniferous forest. Biogeochemistry 95, 23–35. doi: 10.1007/s10533-008-9252-1
Lycus, P., Soriano-Laguna, M. J., Kjos, M., Richardson, D. J., Gates, A. J., Milligan, D. A., et al. (2018). A bet-hedging strategy for denitrifying bacteria curtails their release of N2O. Proc. Natl. Acad. Sci.U.S.A. 115, 11820–11825. doi: 10.1073/pnas.1805000115
Marchant, H. K., Tegetmeyer, H. E., Ahmerkamp, S., Holtappels, M., Lavik, G., Graf, J., et al. (2018). Metabolic specialization of denitrifiers in permeable sediments controls N2O emissions. Environ. Microbiol. 12, 4486–4502. doi: 10.1111/1462-2920.14385
Matsubara, T., and Zumft, W. G. (1982). Identification of a copper protein as part of the nitrous oxide-reducing system in nitrite-respiring (denitrifying) pseudomonads. Arch. Microbiol. 132, 322–328. doi: 10.1007/bf00413383
Meijer, J., van Dijk, B., and Hogeweg, P. (2020). Contingent evolution of alternative metabolic network topologies determines whether cross-feeding evolves. Commun. Biol. 3:401.
Mira, A., Ochman, H., and Moran, N. A. (2001). Deletional bias and the evolution of bacterial genomes. Trends Genet. 17, 589–596. doi: 10.1016/s0168-9525(01)02447-7
Novak, M., Pfeiffer, T., Lenski, R. E., Sauer, U., and Bonhoeffer, S. (2006). Experimental tests for an evolutionary trade-off between growth rate and yield in E. coli. Am. Nat. 168, 242–251. doi: 10.2307/3844729
Pfeiffer, T., and Bonhoeffer, S. (2004). Evolution of cross-feeding in microbial populations. Am. Nat. 163, E126–E135.
Roco, C. A., Bergaust, L. L., Bakken, L. R., Yavitt, J. B., and Shapleigh, J. P. (2017). Modularity of nitrogen-oxide reducing soil bacteria: linking phenotype to genotype. Environ. Microbiol. 19, 2507–2519. doi: 10.1111/1462-2920.13250
Rojo, F. (2010). Carbon catabolite repression in Pseudomonas: optimizing metabolic versatility and interactions with the environment. FEMS Microbiol. Rev. 34, 658–684. doi: 10.1111/j.1574-6976.2010.00218.x
Sasaki, Y., Oguchi, H., Kobayashi, T., Kusama, S., Sugiura, R., Moriya, K., et al. (2016). Nitrogen oxide cycle regulates nitric oxide levels and bacterial cell signaling. Sci. Rep. 6:22038.
Savitzky, A., and Golay, M. J. E. (1964). Smoothing and differentiation of data by simplified least squares procedures. Anal. Chem. 36, 1627–1639. doi: 10.1021/ac60214a047
Schiessl, K. T., Hu, F., Jo, J., Nazia, S. Z., Wang, B., Price-Whelan, A., et al. (2019). Phenazine production promotes antibiotic tolerance and metabolic heterogeneity in Pseudomonas aeruginosa biofilms. Nat. Commun. 10:762.
Schreiber, K., Krieger, R., Benkert, B., Eschbach, M., Arai, H., Schobert, M., et al. (2007). The anaerobic regulatory network required for Pseudomonas aeruginosa nitrate respiration. J. Bacteriol. 189, 4310–4314. doi: 10.1128/jb.00240-07
Sorokin, D. Y., Banciu, H., van Loosdrecht, M., and Kuenen, J. G. (2003). Growth physiology and competitive interaction of obligately chemolithoautotrophic, haloalkaliphilic, sulfur-oxidizing bacteria from soda lakes. Extremophiles 7, 195–203. doi: 10.1007/s00792-002-0313-4
Strickland, J. D. H., and Parsons, T. R. (1972). A Practical Handbook of Seawater Analysis. Ottawa, ON: Fisheries Research Board Of Canada.
Thommes, M., Wang, T., Zhao, Q., Paschalidis, I. C., and Segrè, D. (2019). Designing metabolic division of labor in microbial communities. mSystems 4, e263–e218.
Toyofuku, M., and Sawada, I. (2014). Membrane vesicle formation is associated with pyocin production under denitrifying conditions in Pseudomonas aeruginosa PAO1. Environ. Microbiol. 16, 2927–2938. doi: 10.1111/1462-2920.12260
Treves, D. S., Manning, S., and Adams, J. (1998). Repeated evolution of an acetate-crossfeeding polymorphism in long-term populations of Escherichia coli. Mol. Biol. Evol. 15, 789–797. doi: 10.1093/oxfordjournals.molbev.a025984
Ulloa, O., Canfield, D. E., DeLong, E. F., Letelier, R. M., and Stewart, F. J. (2012). Microbial oceanography of anoxic oxygen minimum zones. Proc. Natl. Acad. Sci. U.S.A. 109, 15996–16003. doi: 10.1073/pnas.1205009109
Vázquez-Torres, A., and Bäumler, A. (2016). Nitrate, nitrite and nitric oxide reductases: from the last universal common ancestor to modern bacterial pathogens. Curr. Opin. Microbiol. 29, 1–8. doi: 10.1016/j.mib.2015.09.002
Weusthuis, R. A., Pronk, J. T., van den Broek, P. J., and van Dijken, J. P. (1994). Chemostat cultivation as a tool for studies on sugar transport in yeasts. Microbiol. Mol. Biol. Rev. 58, 616–630. doi: 10.1128/mmbr.58.4.616-630.1994
Wong, H. L., Smith, D. L., Visscher, P. T., and Burns, B. P. (2015). Niche differentiation of bacterial communities at a millimeter scale in Shark Bay microbial mats. Sci. Rep. 5, 1–17.
Wortel, M. T., Noor, E., Ferris, M., Bruggeman, F. J., and Liebermeister, W. (2018). Metabolic enzyme cost explains variable trade-offs between microbial growth rate and yield. PLoS Comput. Biol. 14:e1006010. doi: 10.1371/journal.pcbi.1006010
Zumft, W. G. (1997). Cell biology and molecular basis of denitrification. Microbiol. Mol. Biol. Rev. 61, 533–616. doi: 10.1128/.61.4.533-616.1997
Keywords: Pseudomonas aeruginosa, denitrification, rate-yield tradeoff, specialization, nitrite
Citation: Zhang IH, Mullen S, Ciccarese D, Dumit D, Martocello DE III, Toyofuku M, Nomura N, Smriga S and Babbin AR (2021) Ratio of Electron Donor to Acceptor Influences Metabolic Specialization and Denitrification Dynamics in Pseudomonas aeruginosa in a Mixed Carbon Medium. Front. Microbiol. 12:711073. doi: 10.3389/fmicb.2021.711073
Received: 17 May 2021; Accepted: 09 August 2021;
Published: 10 September 2021.
Edited by:
Harold J. Schreier, University of Maryland, Baltimore County, United StatesReviewed by:
Julian Damashek, Utica College, United StatesRichard Villemur, Université du Québec, Canada
Copyright © 2021 Zhang, Mullen, Ciccarese, Dumit, Martocello, Toyofuku, Nomura, Smriga and Babbin. This is an open-access article distributed under the terms of the Creative Commons Attribution License (CC BY). The use, distribution or reproduction in other forums is permitted, provided the original author(s) and the copyright owner(s) are credited and that the original publication in this journal is cited, in accordance with accepted academic practice. No use, distribution or reproduction is permitted which does not comply with these terms.
*Correspondence: Andrew R. Babbin, YmFiYmluQG1pdC5lZHU=
†Present address: Susan Mullen, Department of Earth and Planetary Science, University of California, Berkeley, Berkeley, CA, United States