 Eliška Konopáčová1,2*
 Jiří Nedoma2Kateřina Čapková2
 Petr Čapek3Petr Znachor2,3Miloslav Pouzar1,4
 Milan Říha2
 Klára Řeháková2
- 1Institute of Environmental and Chemical Engineering, Faculty of Chemical Technology, University of Pardubice, Pardubice, Czechia
- 2Institute of Hydrobiology, Biology Centre of the Czech Academy of Sciences, České Budějovice, Czechia
- 3Faculty of Sciences, University of South Bohemia, České Budějovice, Czechia
- 4Center of Materials and Nanotechnologies, University of Pardubice, Pardubice, Czechia
Epilithon contributes to phosphorus (P) cycling in lakes, but its P uptake traits have been rarely studied. We measured the chemical composition of epilithon and its inorganic P uptake kinetics using isotope 33P in three deep oligo- to mesotrophic post-mining lakes in April, July, and October 2019. Over the sampling period, epilithon biomass doubled, while the P content in biomass dropped to 60% of the April values, and the seasonal changes in P content expressed per epilithon area were only marginal and statistically not significant. High epilithic C:P molar ratios (677 on average) suggested strong P deficiency in all investigated lakes. Regarding the kinetic parameters of phosphorus uptake, maximum uptake velocity (Vmax, seasonal range 1.9–129 mg P g OM–1 h–1) decreased by an order of magnitude from April to October, while half-saturation constant (KS, seasonal range 3.9–135 mg P L–1) did not show any consistent temporal trend. Values of epilithic specific P uptake affinity (SPUAE, seasonal range 0.08–3.1 L g OM–1 h–1) decreased from spring to autumn and were two to four orders of magnitude lower than the corresponding values for seston (SPUAsest), which showed an opposite trend. Considering our results, we suggest a possible mechanism underlying a stable coexistence of planktonic and epilithic microorganisms, with plankton prospering mostly in summer and autumn and epilithon in winter and spring season. Additionally, a phenomenon of reversible abiotic P adsorption on epilithon was observed.
Introduction
Periphyton is an assemblage of autotrophic and heterotrophic organisms that produces extracellular polymeric substances, all together forming a biofilm attached to a solid substrate (Azim et al., 2005; Cantonati and Lowe, 2014). Epilithon is a subgroup of periphyton covering submerged surfaces of stones (Azim et al., 2005). Periphyton represents an important component of aquatic food webs and biodiversity (Vymazal and Richardson, 1995; Azim et al., 2005) and can contribute considerably to nutrient cycling (Dodds, 2003; Wyatt et al., 2019). Periphyton can account for up to 92% of the total algal primary production (production of phytoplankton and periphyton) in oligotrophic lakes (Vadeboncoeur and Steinman, 2002).
Periphyton productivity may be limited by the availability of inorganic nutrients, especially phosphorus (P), which is an essential constituent of microbial cells. Integrated into phospholipids, nucleic acids, coenzymes, and various metabolites, it is considered the most common element limiting the growth rates and metabolic activities of photoautotrophs in temperate freshwater ecosystems (Hudson et al., 2000; Grossman and Aksoy, 2018). Whereas P uptake by phytoplankton has been widely studied (Tanaka et al., 2006; Lindemann et al., 2016; Cáceres et al., 2019; Fitzsimons et al., 2020), only few studies have addressed the kinetics of P uptake by periphyton in lentic waters (Hwang et al., 1998; Scinto and Reddy, 2003), and no study ever quantified the P uptake of periphyton in temperate freshwaters. Given the above-mentioned importance of periphyton for total primary production of lakes, the periphyton P uptake might be significant as well. A study of P fluxes in the shallow subtropical Lake Okeechobee found a significantly greater P uptake in phytoplankton than in periphyton. However, in an oligotrophic marsh area in the lake, due to the well-developed periphytic biomass, the cumulative P uptake by periphyton was twice as high as P uptake by phytoplankton (Hwang et al., 1998).
A thorough analysis of periphyton and phytoplankton contributions to P cycling in lake ecosystems requires the determination of kinetic parameters of P uptake for both periphyton and phytoplankton. In osmotrophic organisms, phosphorus can only be taken up in a substantial amount in the form of inorganic orthophosphate (Pi) (Cembella et al., 1984). The relationship between Pi concentration in water and its uptake rate can be often described by a hyperbolic function analogous to the Michaelis–Menten equation for enzymatic reaction kinetics possessing two parameters: maximum velocity (Vmax) and half-saturation constant (KS, concentration at which Vmax = 1/2). However, at extremely low Pi concentrations, typical for oligotrophic waters, P uptake velocity is far below Vmax, as Pi is much smaller than KS (Taylor and Lean, 1991; Chen and Taylor, 2011). A relevant parameter describing P uptake and the competitive ability of microorganisms at low Pi is the specific P uptake affinity (SPUA), calculated as a proportion of Vmax and KS, equal to the slope of the velocity vs. concentration at the initial linear region of the curve (Healey, 1980; Button, 1985). Interpretation of the SPUA values is not straightforward due to their unusual units (L mg OM–1 h–1); however, it is analogous to the clearance rate of zooplankton—the volume of water cleared of phosphate per unit biomass per unit time (Thingstad and Rassoulzadegan, 1999).
Large lakes newly emerge during the hydric recultivation of post-mining pits. Understanding the nutrient cycling and energy fluxes in the unique ecosystems of post-mining lakes is urgently needed since their number is expected to rise in the upcoming decades due to the coal mining suppression associated with the European Union’s Green Deal (Larondelle and Haase, 2012; European Commission, 2018). Post-mining lakes are often oligotrophic with very low P concentrations (total phosphorus, TP < 15 μg L–1 and soluble reactive phosphorus concentration, SRP ∼ 1 μg L–1) (Schultze et al., 2010). However, no detailed report on P cycling in these anthropogenic lakes and about the periphytic organisms involved is available.
In the present study, we sampled three recently flooded oligo- to mesotrophic post-mining lakes in the north-west region of the Czech Republic (Milada, Medard, and Most Lakes) to evaluate the role of dissolved inorganic phosphorus acquisition for periphyton nutrition and in-lake nutrient cycling. Despite very low P concentration in water, dense mats of periphyton, mainly represented by epilithon, have developed in all investigated lakes (Bešta et al., in prep).
We sought to investigate P uptake traits of epilithon in these three lakes during the vegetation season, using 33P-labelled orthophosphate. Our specific objectives were: (i) to determine kinetic parameters of the epilithon P uptake, namely, the specific P uptake affinity (SPUAE), maximum P uptake velocity (Vmax), and half-saturation constant (KS); (ii) to decipher the environmental factors affecting the specific P uptake affinity; and (iii) to compare specific P uptake affinities and doubling times of epilithon and seston.
Materials and Methods
Study Sites
Three oligo- to mesotrophic post-mining lakes, Milada (area: 252 ha, max/average depth: 25/16 m, flooded in 2010), Medard (493 ha, 59/28 m, flooded in 2016), and Most (311 ha, 75/22 m, flooded in 2014), situated in the north-western Bohemia, the Czech Republic, were chosen as study sites (Figure 1 and Supplementary Figures 7–9). All lakes possess well-developed epilithon assemblages in their littoral zone (Supplementary Figure 10). Basic limnological parameters of the lakes are summarised in Table 1.
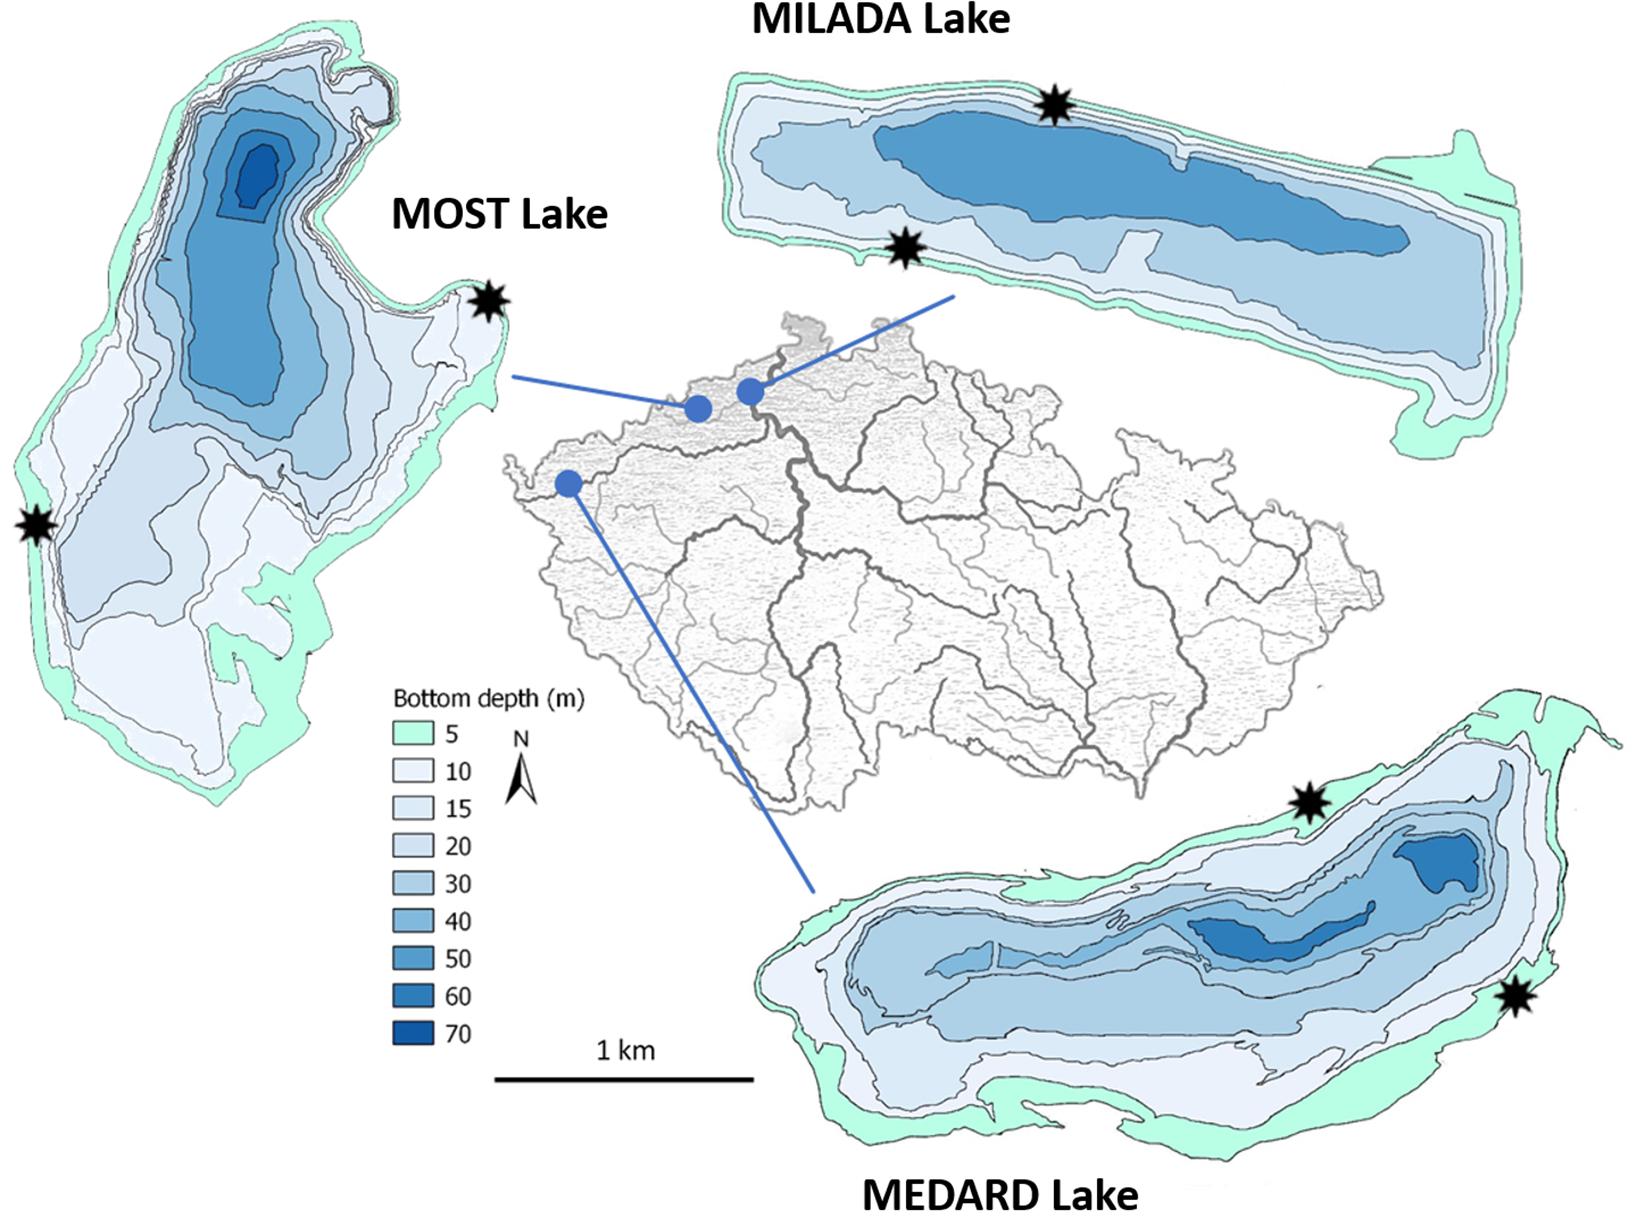
Figure 1. Maps of the investigated post-mining lakes and location of the sampling sites (asterisks).
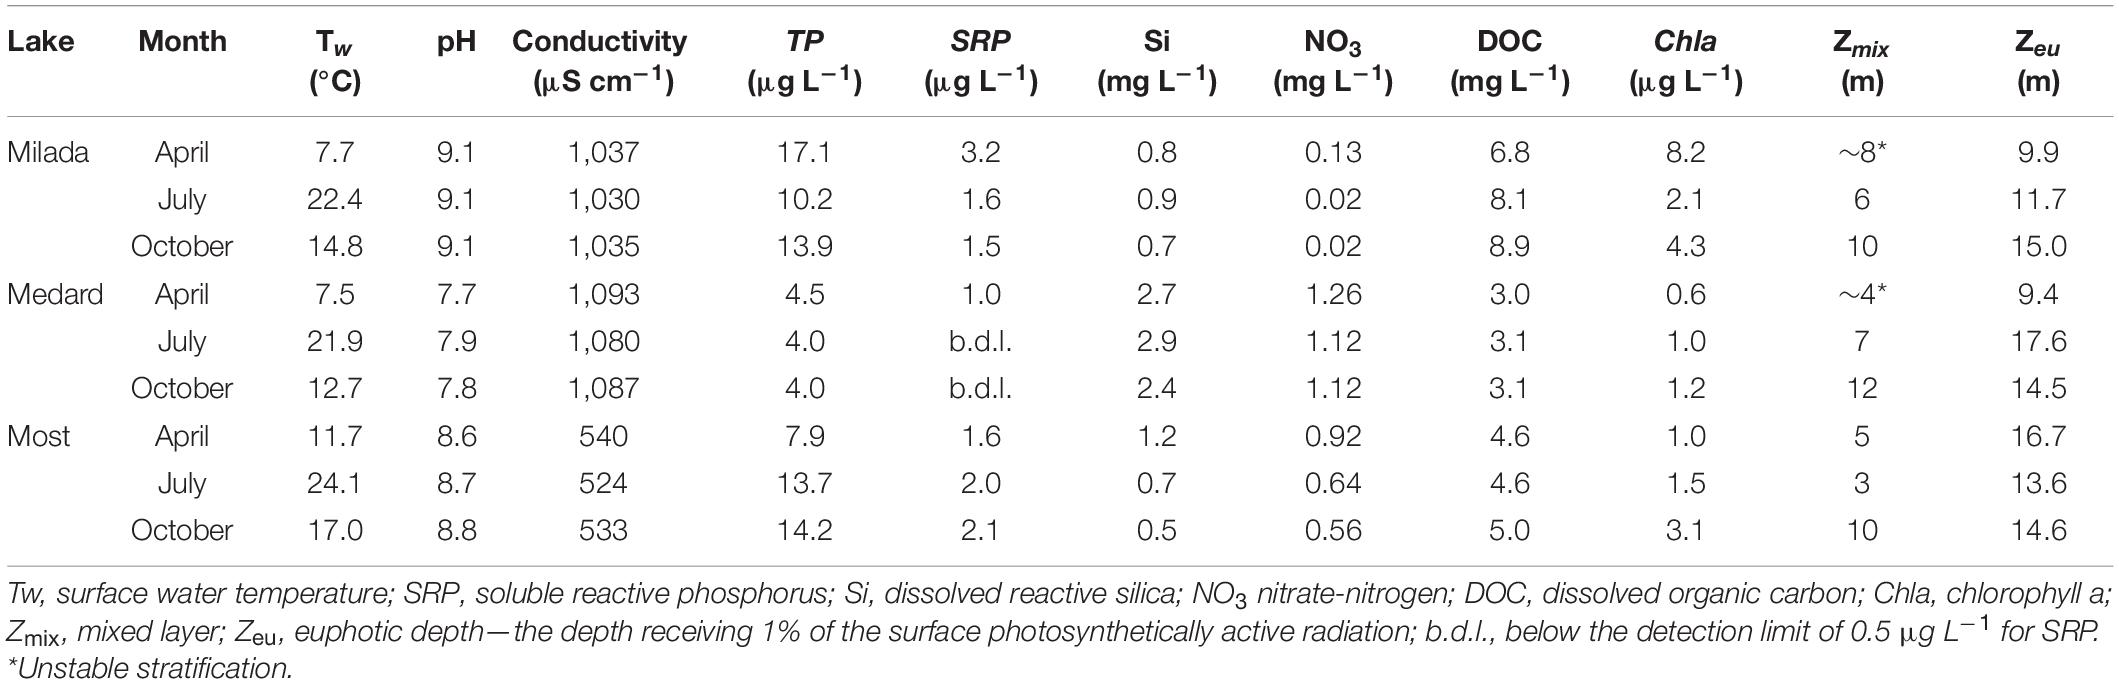
Table 1. Chemical and limnological parameters of the three post-mining lakes in the Czech Republic sampled from the depth of 0.5 m at their deepest points in 2019.
Sampling
In each lake, epilithon was sampled at two opposite shores of each lake, designated as North (N) and South (S) (see Figure 1 and Supplementary Table 4 for more details). Twelve small epilithon-covered stones (approx. diameter 4 cm) were randomly collected by scuba diving at each site from 0.5 and 1.5 m depths in April, July, and October 2019. Each stone was placed into a plastic container (volume 150 mL) filled with lake water. Epilithon samples were kept in the lake water at in situ temperature and a photoperiod of 16:8 (light:dark) until the P uptake experiments (<2 days). Lake water for chemical analyses and epilithon P uptake experiments was collected with a Friedinger sampler above the deepest points of the lakes from the depth of 0.5 m and stored in the dark at 4°C until analysis. The cell-free filtrate of lake water was prepared by passing it through a polycarbonate filter (0.22-μm porosity; Sterlitech Corporation, Seattle, WA, United States) and stored at 4°C until the start of the experiment (<2 days).
Background Limnological Parameters
Vertical profiles of water temperature, pH, and O2 concentration were measured with YSI EXO 2 multiparametric probe (YSI Inc., Yellow Springs, OH, United States). The euphotic depth was estimated as the depth of 1% of surface irradiance calculated from vertical light profiles obtained using LICOR LI-1400 datalogger with a spherical quantum underwater sensor LI 193 SA (LI-COR, Lincoln, NE, United States). Chlorophyll a (Chla) was determined according to ISO 10260:1992 (ISO, 1992); total organic carbon (TOC) and total nitrogen (TN) were determined using Shimadzu TOC/TN analyser (Shimadzu Corp., Kyoto, Japan). Total phosphorus (TP) was measured spectrophotometrically after nitric-perchloric acid digestion (Kopáček and Hejzlar, 1993) using Flow Injection Analyser. Dissolved reactive silica (DSi) (Mackereth et al., 1978) and soluble reactive phosphorus (SRP) (Murphy and Riley, 1962) were determined spectrophotometrically. Nitrate-nitrogen (NO3–N) was determined following the procedure by Procházková (1959).
Epilithon Chemical Characterisation
After the termination of 33P uptake experiments (see below), epilithon was quantitatively removed from each stone by scalpel and toothbrush and dried at 110°C to constant weight, and the dry weight (DW) was determined. To determine the organic matter (OM) content, the dry sample was combusted in a muffle furnace at 450°C for 12 h. For the determination of epilithon elemental (C, N, and P) composition and biomass (DW and OM per area), we used different stones than those used for uptake experiments, albeit collected from the same sampling site. Samples were frozen at –20°C till the analysis and homogenised using glass beads and an automatic homogeniser. TN, TOC, and TP were analysed, as described above.
Epilithon P Uptake Kinetics
Before each experiment, the lake water was removed from containers containing epilithon-covered stones. Stones were gently rinsed with 50 mL of the 0.2-μm filtered (cell-free) lake water, and 100 mL of the filtered water was added. The containers were supplemented with five different concentrations of orthophosphate (Padd, 1, 3, 10, 30, and 100 mg P L–1, added as KH2PO4) in duplicates. Incubations started by the addition of 20 μL of carrier-free 33P-labelled H3PO4 in the tracer amount (50–100 kBq; American Radiolabeled Chemicals, Inc., St. Louis, MO, United States) along with unlabelled orthophosphate into testing containers placed in a gently shaken (120 rpm) water bath tempered at in situ temperature of investigated lakes. Samples were incubated for 180 min under laboratory illumination (cca 10 μE m–2 s–1 PAR). At 15–30 min intervals, 0.6-mL aliquots were transferred into Eppendorf tubes containing 0.6 mL of scintillation cocktail (Packard Ultima Gold) and vortexed vigorously. Radioactivity (typically 20,000–40,000 c.p.m. per aliquot) was determined with a liquid scintillation counter (Tri-Carb 2900TR, Packard, Conroe, TX, United States).
P incorporation into the epilithon biomass was considered to be proportional to the 33P disappearance from incubation water, as confirmed in an experiment with simultaneous spectrophotometric and scintillation detection of dissolved P (not shown). The P uptake rate constant, kupt (h–1), which reflects the initial uptake rate, was calculated applying the second-order polynomial function (Currie and Kalff, 1984):
where t (hours) is time; At is 33P activity (c.p.m.) at the time t; and A0, A1, and A2 are parameters of the polynomial function fitted with non-linear regression; the ratio of A1 to A0 equals kupt. The second-degree polynomial function was used here to estimate the P uptake rate at time zero. The polynomial function can be used as an approximation of any differentiable function, and its second term then defines the slope of decrease of that function at time zero. Only the points where At/A0 > 0.3 were included in the calculations (Currie and Kalff, 1984).
The velocity of P uptake by epilithon, vupt (mg P g OM–1 h–1), was calculated as follows:
where Vinc (L) is incubation volume and OM (g) is organic matter content in the epilithon sample. To study concentration dependence of the P uptake velocity, it was plotted as a function of Padd and fitted either to a Michaelis–Menten model:
or, if the P uptake velocity did not show saturation, to a simplified linear model:
where Vmax (the maximum P uptake velocity; mg P g OM–1 h–1) and KS (half-saturation constant; mg P L–1) are the parameters of the Michaelis–Menten model (Eq. 3); the linear model (Eq. 4) had only one parameter, vslope (L g OM–1 h–1). The more complex model (Eq. 3) was selected in preference to the simpler one (Eq. 4) when improving the fit at the probability level of p < 0.05 (F test). Parameter estimations and model selection were performed in PRISM v.7 (GraphPad Software). For saturation data (Eqs 3, 4), relative weighting by 1/(vupt)2 was applied, as the error of the vupt was heteroscedastic, accounting for approximately 30% (average difference between duplicates), irrespectively of Padd. No weighting was applied to the time-course data. Outliers were excluded with the PRISM v.7 built-in algorithm using the recommended settings (Motulsky and Brown, 2006). We further used—assuming the Michaelis–Menten uptake kinetics—an alternative approach of kinetic parameters (^*Vmax and ^*KS) estimation based on fitting the integrated form of the Michaelis–Menten equation directly to 33P disappearance data across all concentrations of Padd (see Supplementary Material).
Epilithon specific P uptake affinity, SPUAE (L g OM–1 h–1), for the Michaelis–Menten model (Eq. 3) was calculated as:
while for the linear model (Eq. 4), it was directly equal to vslope.
Epilithon P doubling time, PDTE (h), i.e., the theoretical time necessary for doubling of the actual epilithon P content, was calculated as:
where EPC (μg P g OM–1) is epilithon phosphorus content and Pi is concentration of (bioavailable) dissolved inorganic phosphorus. As Pi cannot be reliably determined in lake water under conditions of P deficiency (see section “Discussion”), two scenarios were applied: (1) Pi = SRP (9.6–102 nmol L–1, assuming 0.3 μg L–1 for SRP values below the detection limit) and (2) Pi = 0.1 μg L–1 (3.2 nmol L–1).
Abiotic P Adsorption
To distinguish the P uptake by cells from the abiotic P adsorption, two samples with formaldehyde (final conc. 4%) were pre-incubated overnight (>12 h) in each experiment. These samples received the lowest concentration of Padd used (i.e., 1 mg L–1), and the effect of formaldehyde was expressed relative to uninhibited uptake velocity. Additional experiments were performed to elucidate concentration dependency of the abiotic adsorption over a wide range of P concentrations (Padd = 0.01, 0.1, 1, and 10 mg P L–1), and reversibility of the abiotic P adsorption using oxalacetate-based surface wash reagent (for composition, see Supplementary Table 3) (Tovar-Sanchez et al., 2003; Yao et al., 2011) applied immediately after termination of 33P uptake experiments for 1 h. The amount of 33P released by the surface wash reagent was expressed relative to the 33P removed from the water in the presence of 4% formaldehyde.
Seston P Uptake Kinetics
Lake-water samples (30 mL) were supplemented simultaneously with 50–100 kBq of carrier-free 33P-labelled H3PO4 in the tracer amount and seven concentrations of unlabelled orthophosphate (Padd, range 0.1–60 μg P L–1, added as KH2PO4) and incubated at in situ temperature for 180 min. At appropriate time intervals (2–30 min), 0.5-mL subsamples were filtered through polycarbonate filters (Poretics, 0.2 μm of mean porosity). The filter-retained activity was measured with the scintillation counter. The P uptake rate constants, kupt, were determined from the time courses of 33P incorporation with the method of Currie and Kalff (1984), applying the second-order polynomic equation:
where Pt is filter-retained 33P activity (c.p.m.) at time t, T is total 33P activity added, and P0 is filter-retained 33P activity at zero time, to the initial part of data (Pt/T < 0.7) (Currie, 1990). The P uptake velocity, vupt (μg P L–1 h–1), was calculated as:
The maximum velocity of P uptake, Vmaxsest (μg P L–1 h–1), and half-saturation constant, KSsest (μg P L–1), were determined by non-linear regression as described above (Eq. 3).
To compare specific P uptake affinities of epilithon and seston, expressed in the same units, the seston specific P uptake affinity, SPUAsest (L g OM–1 h–1), was calculated as:
where OM is seston organic matter content (g L–1) estimated from Chla concentration in lake water assuming OM:Chla (w/w) ratio of 200 (Yacobi and Zohary, 2010).
In order to compare epilithon and seston P doubling times, seston P doubling time, PDTsest (h), was calculated—assuming exponential growth—for both above defined Pi scenarios as:
where SPC is seston P content estimated as TP - SRP. Note that assuming the same Pi for seston and epilithon (homogeneous Pi distribution in epilimnion), the ratio PDTsest/PDTE does not depend on Pi.
Turnover time of dissolved orthophosphate, TT-PO4 (h), was determined as 1/kupt measured in the absence of added P and used for epilimnion P deficiency assessment (Istánovics et al., 1992).
Results
Background Limnological Parameters
All lakes had high water transparency corresponding to the euphotic depth (the depth of 1% of the surface irradiance) between 10 and 18 m (Table 1) and were stratified with the mixed depth varying from 3 to 11 m. In April, the sampling was performed shortly after the spring overturn; thus, the stratification was weak, nutrient concentrations were higher, and the temperature was lower (7–11°C) than in summer and autumn (13–24°C, Table 1). Lakes Medard and Most were characterised by low Chla and TP concentrations (0.9 and 1.9 μg L–1; and 4.2 and 11 μg L–1, respectively, in their seasonal averages). Lake Milada’s Chla and TP concentrations were slightly higher (5.1 and 14.1 μg L–1, respectively).
Epilithon Characterisation
Parameters related to epilithon biomass and chemical composition, as well as their differences among lakes and seasonal development with statistical differences, are summarised in Figure 2 and Table 2 (for the full two-way ANOVA table, see Supplementary Table 1). Epilithon biomass expressed as OM content and normalised per area on average doubled from April (1.8 mg cm–2) to October (3.6 mg cm–2), being about three times higher in Lake Milada (4.8 mg cm–2) than in the two other lakes (Table 2 and Figure 2A); the corresponding dry-weight figures showed a similar pattern (Table 2 and Figure 2A). Average biomass P content dropped to ∼60% from April (3.6 mg P g OM–1) to October (2.2 mg P g OM–1) independently of the lake (Table 2). In contrast, average epilithic P content per area considerably differed among the lakes, being 2.5 times higher in Milada Lake (11 μg P cm–2) than in the two other lakes but showing only marginal and statistically insignificant seasonal trends that were inconsistent among lakes.
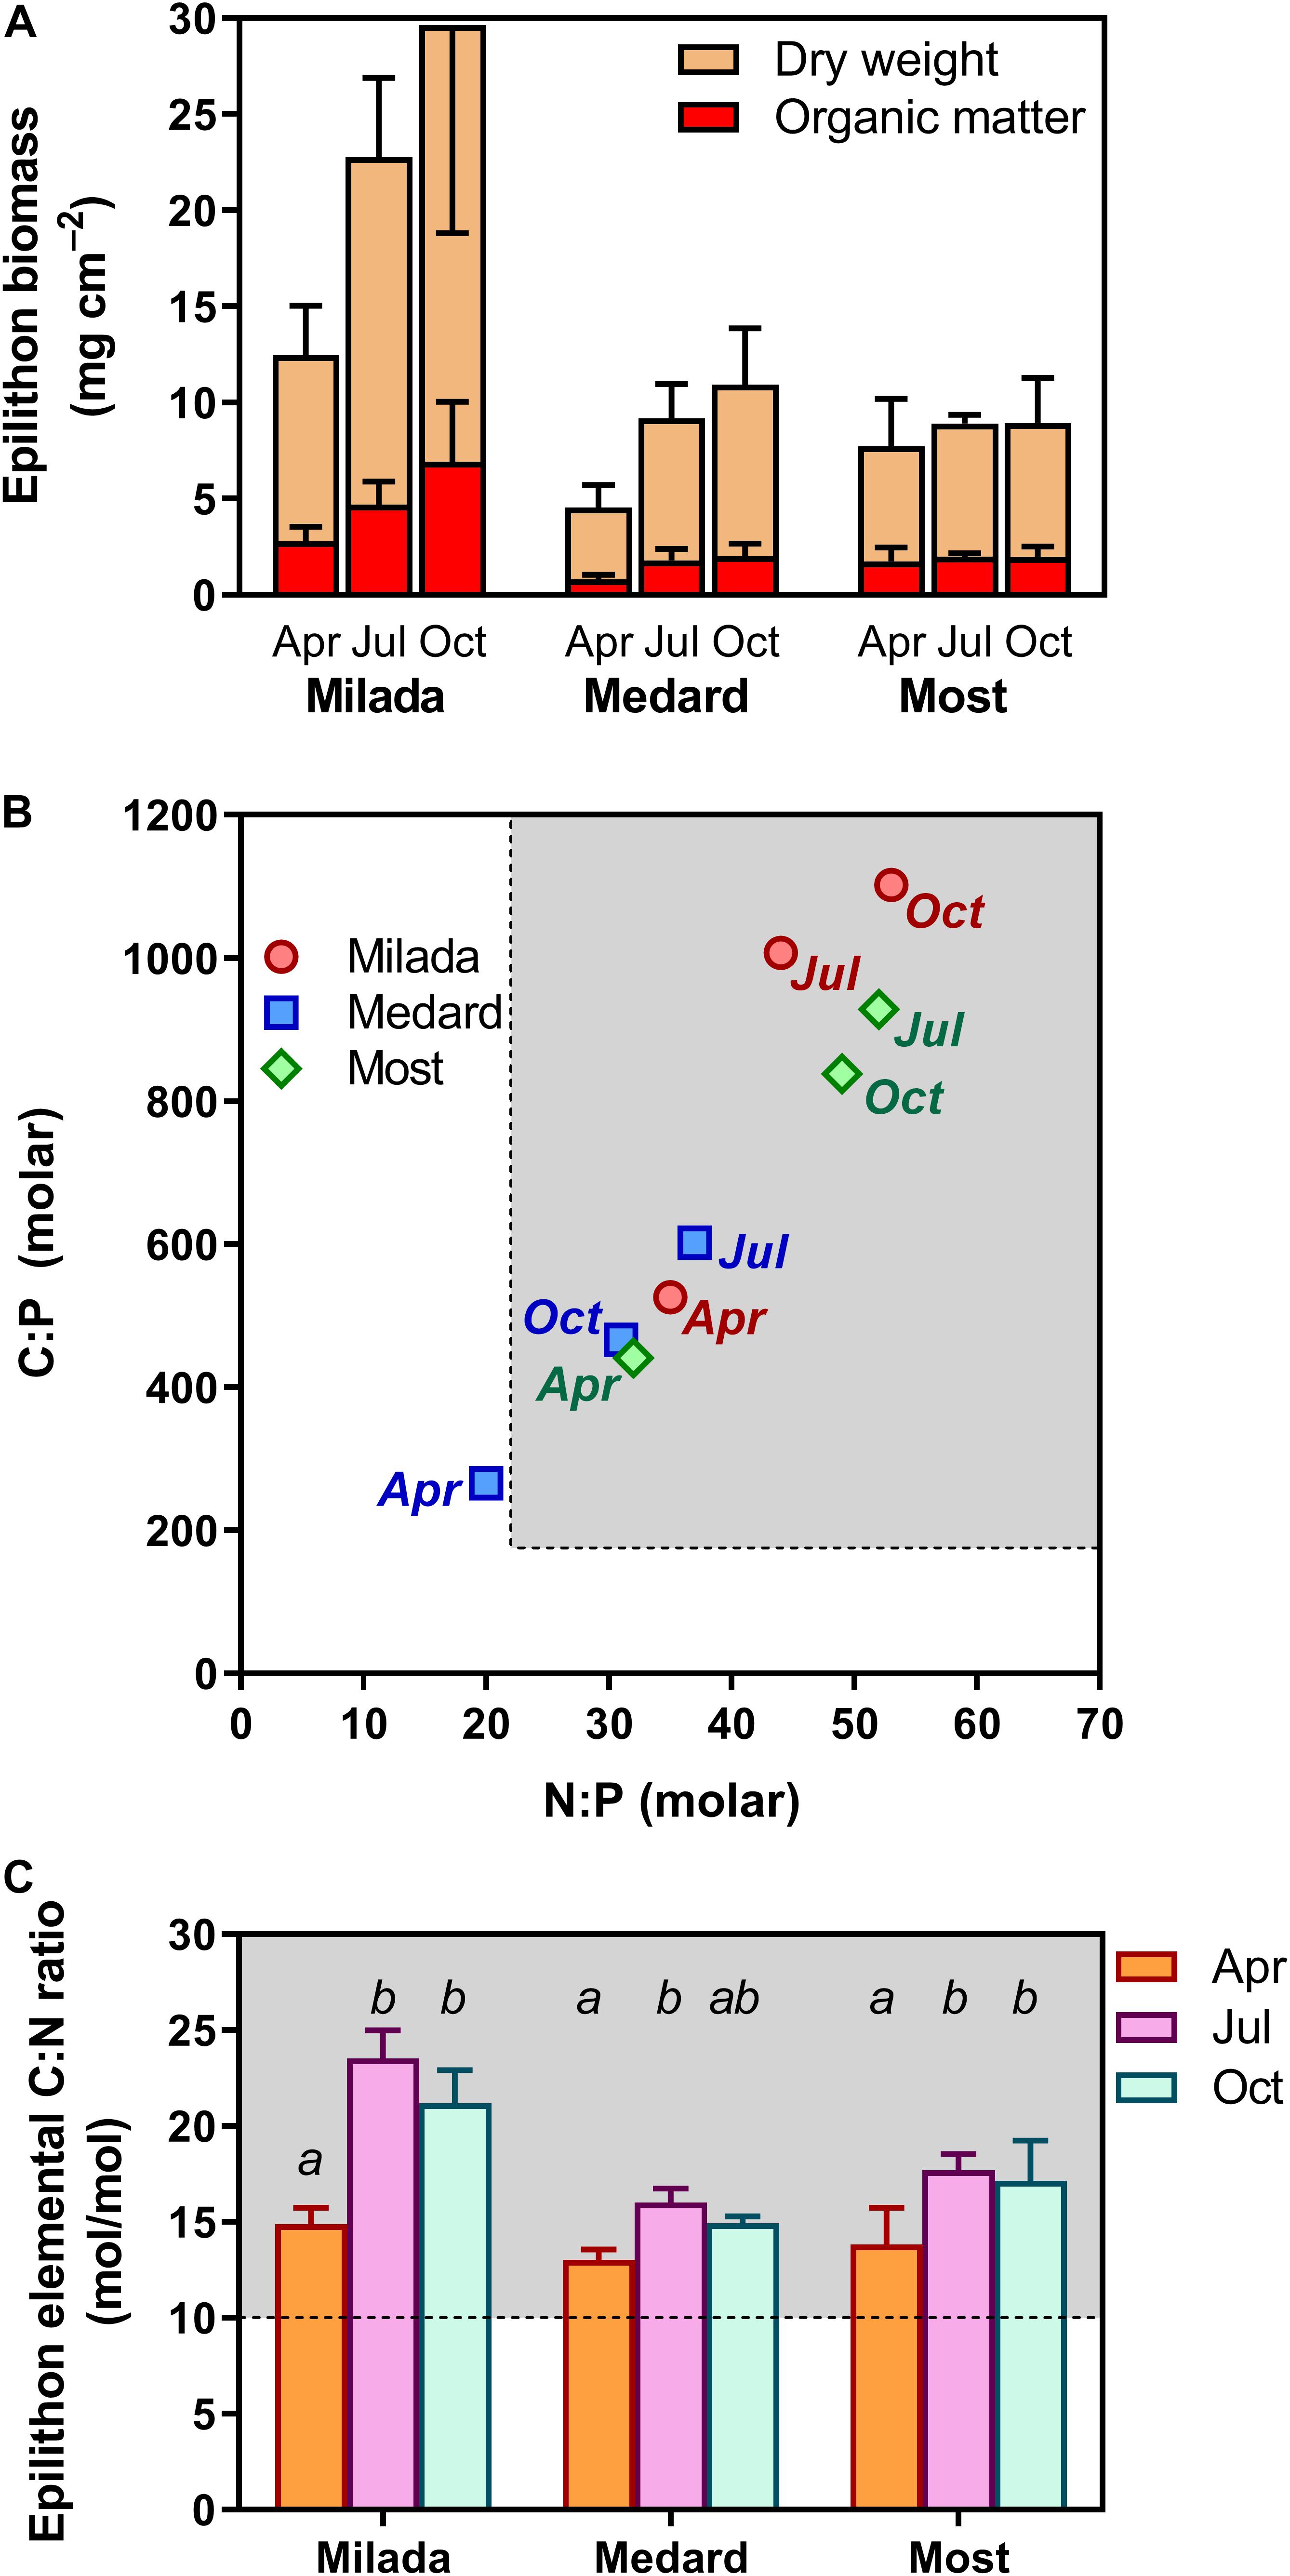
Figure 2. Biomass and elemental composition of epilithon in three post-mining lakes sampled in the Czech Republic in 2019. (A) Epilithon dry weight and organic matter content expressed per overgrown area, (B) relationship between epilithon molar N:P and C:P molar ratios (error bars omitted for the sake of clarity), and (C) epilithon C:N ratios. Columns show averages of 4 (2 × 2) values from two sampling sites and two depths ± SD. Different lowercase letters indicate significant seasonal differences within lakes (p < 0.05, two-way ANOVA with Tukey’s multiple comparisons post-test). Shaded areas (B,C) show values indicating P and N limitation, respectively, given by Hillebrand and Sommer (1999).
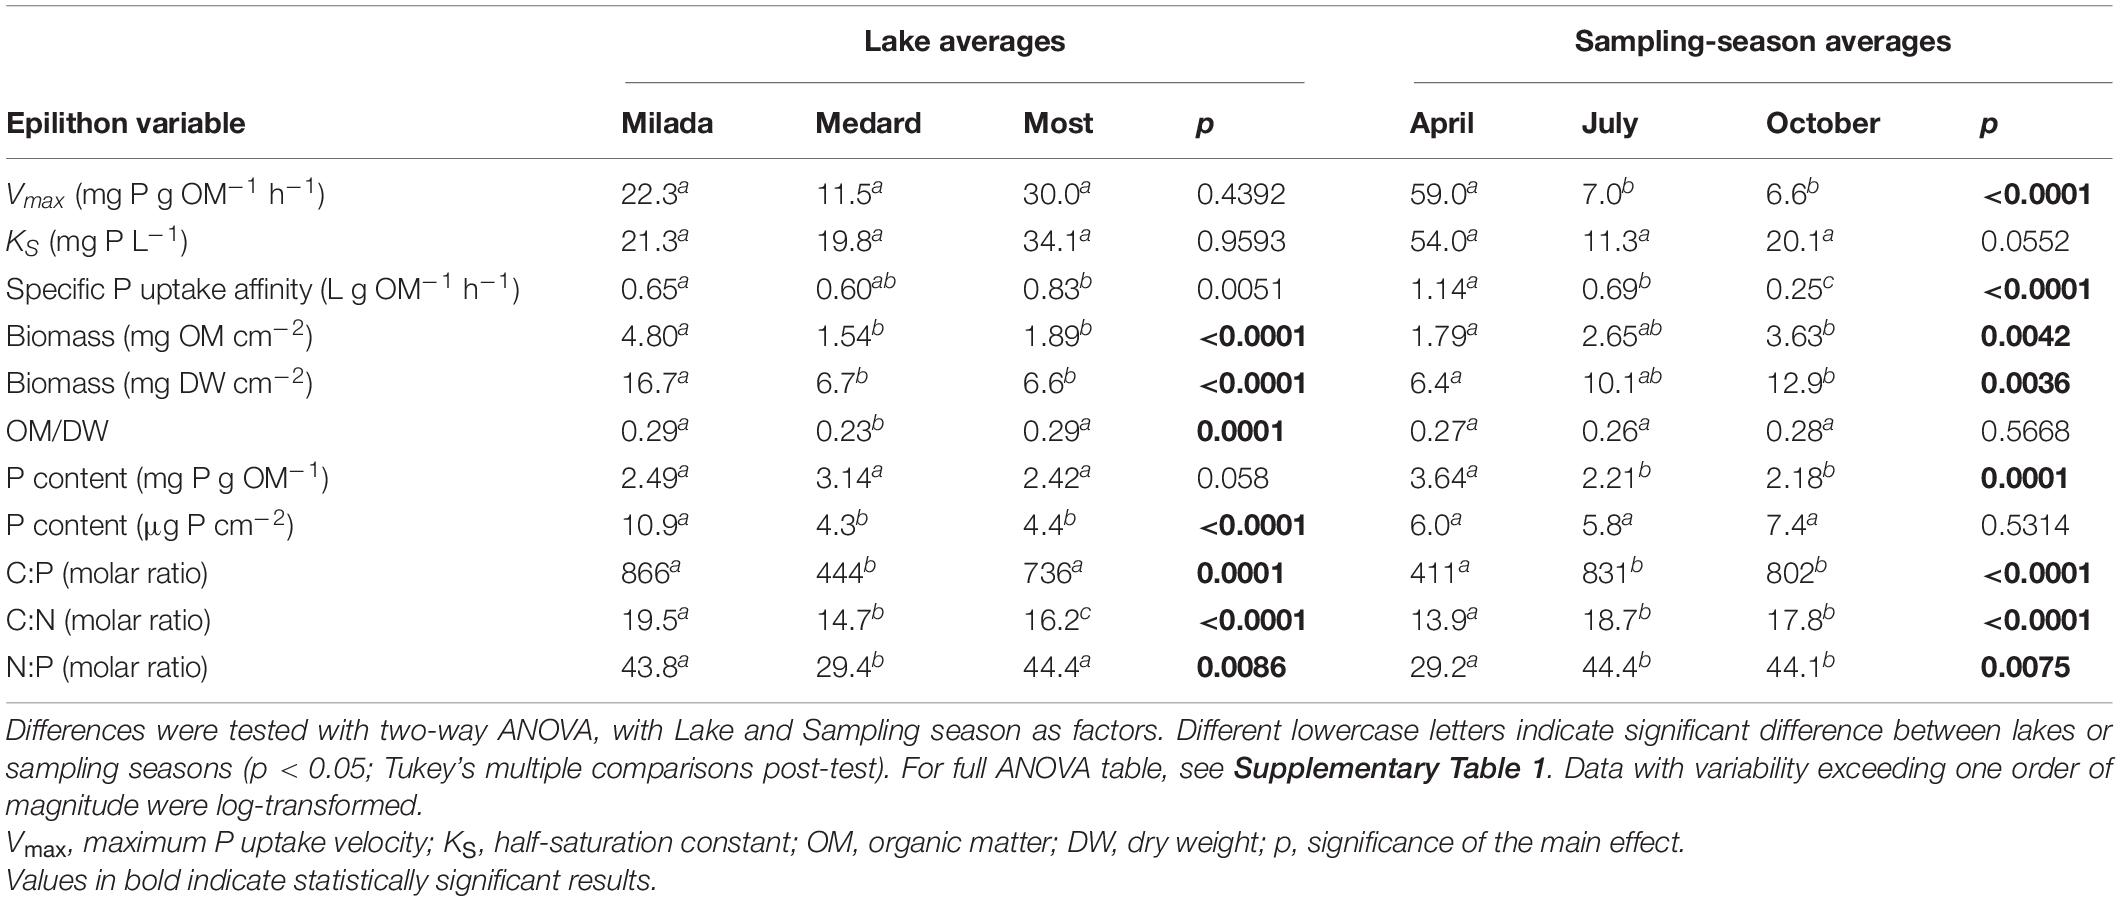
Table 2. Average values of epilithon biomass- and P uptake-related variables measured in three post-mining lakes in the Czech Republic in 2019.
Epilithon nutrient molar element ratios were generally high (Table 2)—C:P molar ratios ranged from 160 to 1,260, N:P molar ratios ranged from 13 to 68 (Figure 2B), and C:N molar ratios ranged from 12 to 25 (Figure 2C), being on average 1.3–2.0 times lower in Lake Medard than in the two other lakes (Table 2 and Figures 2B,C). All the ratios were significantly (up to two-fold) higher in June and October than in April (Table 2 and Figures 2B,C).
Epilithon P Uptake
There was no systematic variability in any epilithon P uptake parameter within lakes (north shore vs. south shore; a depth of 0.5 vs 1.5 m; paired t-tests, p = 0.12–0.81). Hence, all these in-lake values were treated as replicates (n = 4; see, e.g., Figures 3, 4). Time course data on P uptake by epilithon (i.e., 33P disappearance from water) fitted well to second-order polynomial model (Supplementary Figure 1 and Table 2). Fourteen out of the 348 progress curves were excluded due to a lack of fit (high scatter or an increasing trend in the data). Calculated P uptake velocities (vupt) varied widely from 0.015 to 75 mg P g OM–1 h–1 and were strongly concentration-dependent (Supplementary Figures 2–4). The relationship between the concentration of added orthophosphate, Padd, and vupt followed the Michaelis–Menten kinetics in 23 out of the 35 cases, while the remaining 12 followed the simplified linear model (Table 3 and Supplementary Figures 2–4). Maximum P uptake velocity (Vmax) ranged between 1.9 and 129 mg P g OM–1 h–1 and significantly decreased over the season by around one order of magnitude. The corresponding estimates of the half-saturation constant (KS) ranged from 3.9 to 135 mg P L–1 with no seasonal trend (Table 3 and Figure 3). Both Vmax and KS did not significantly differ between lakes.
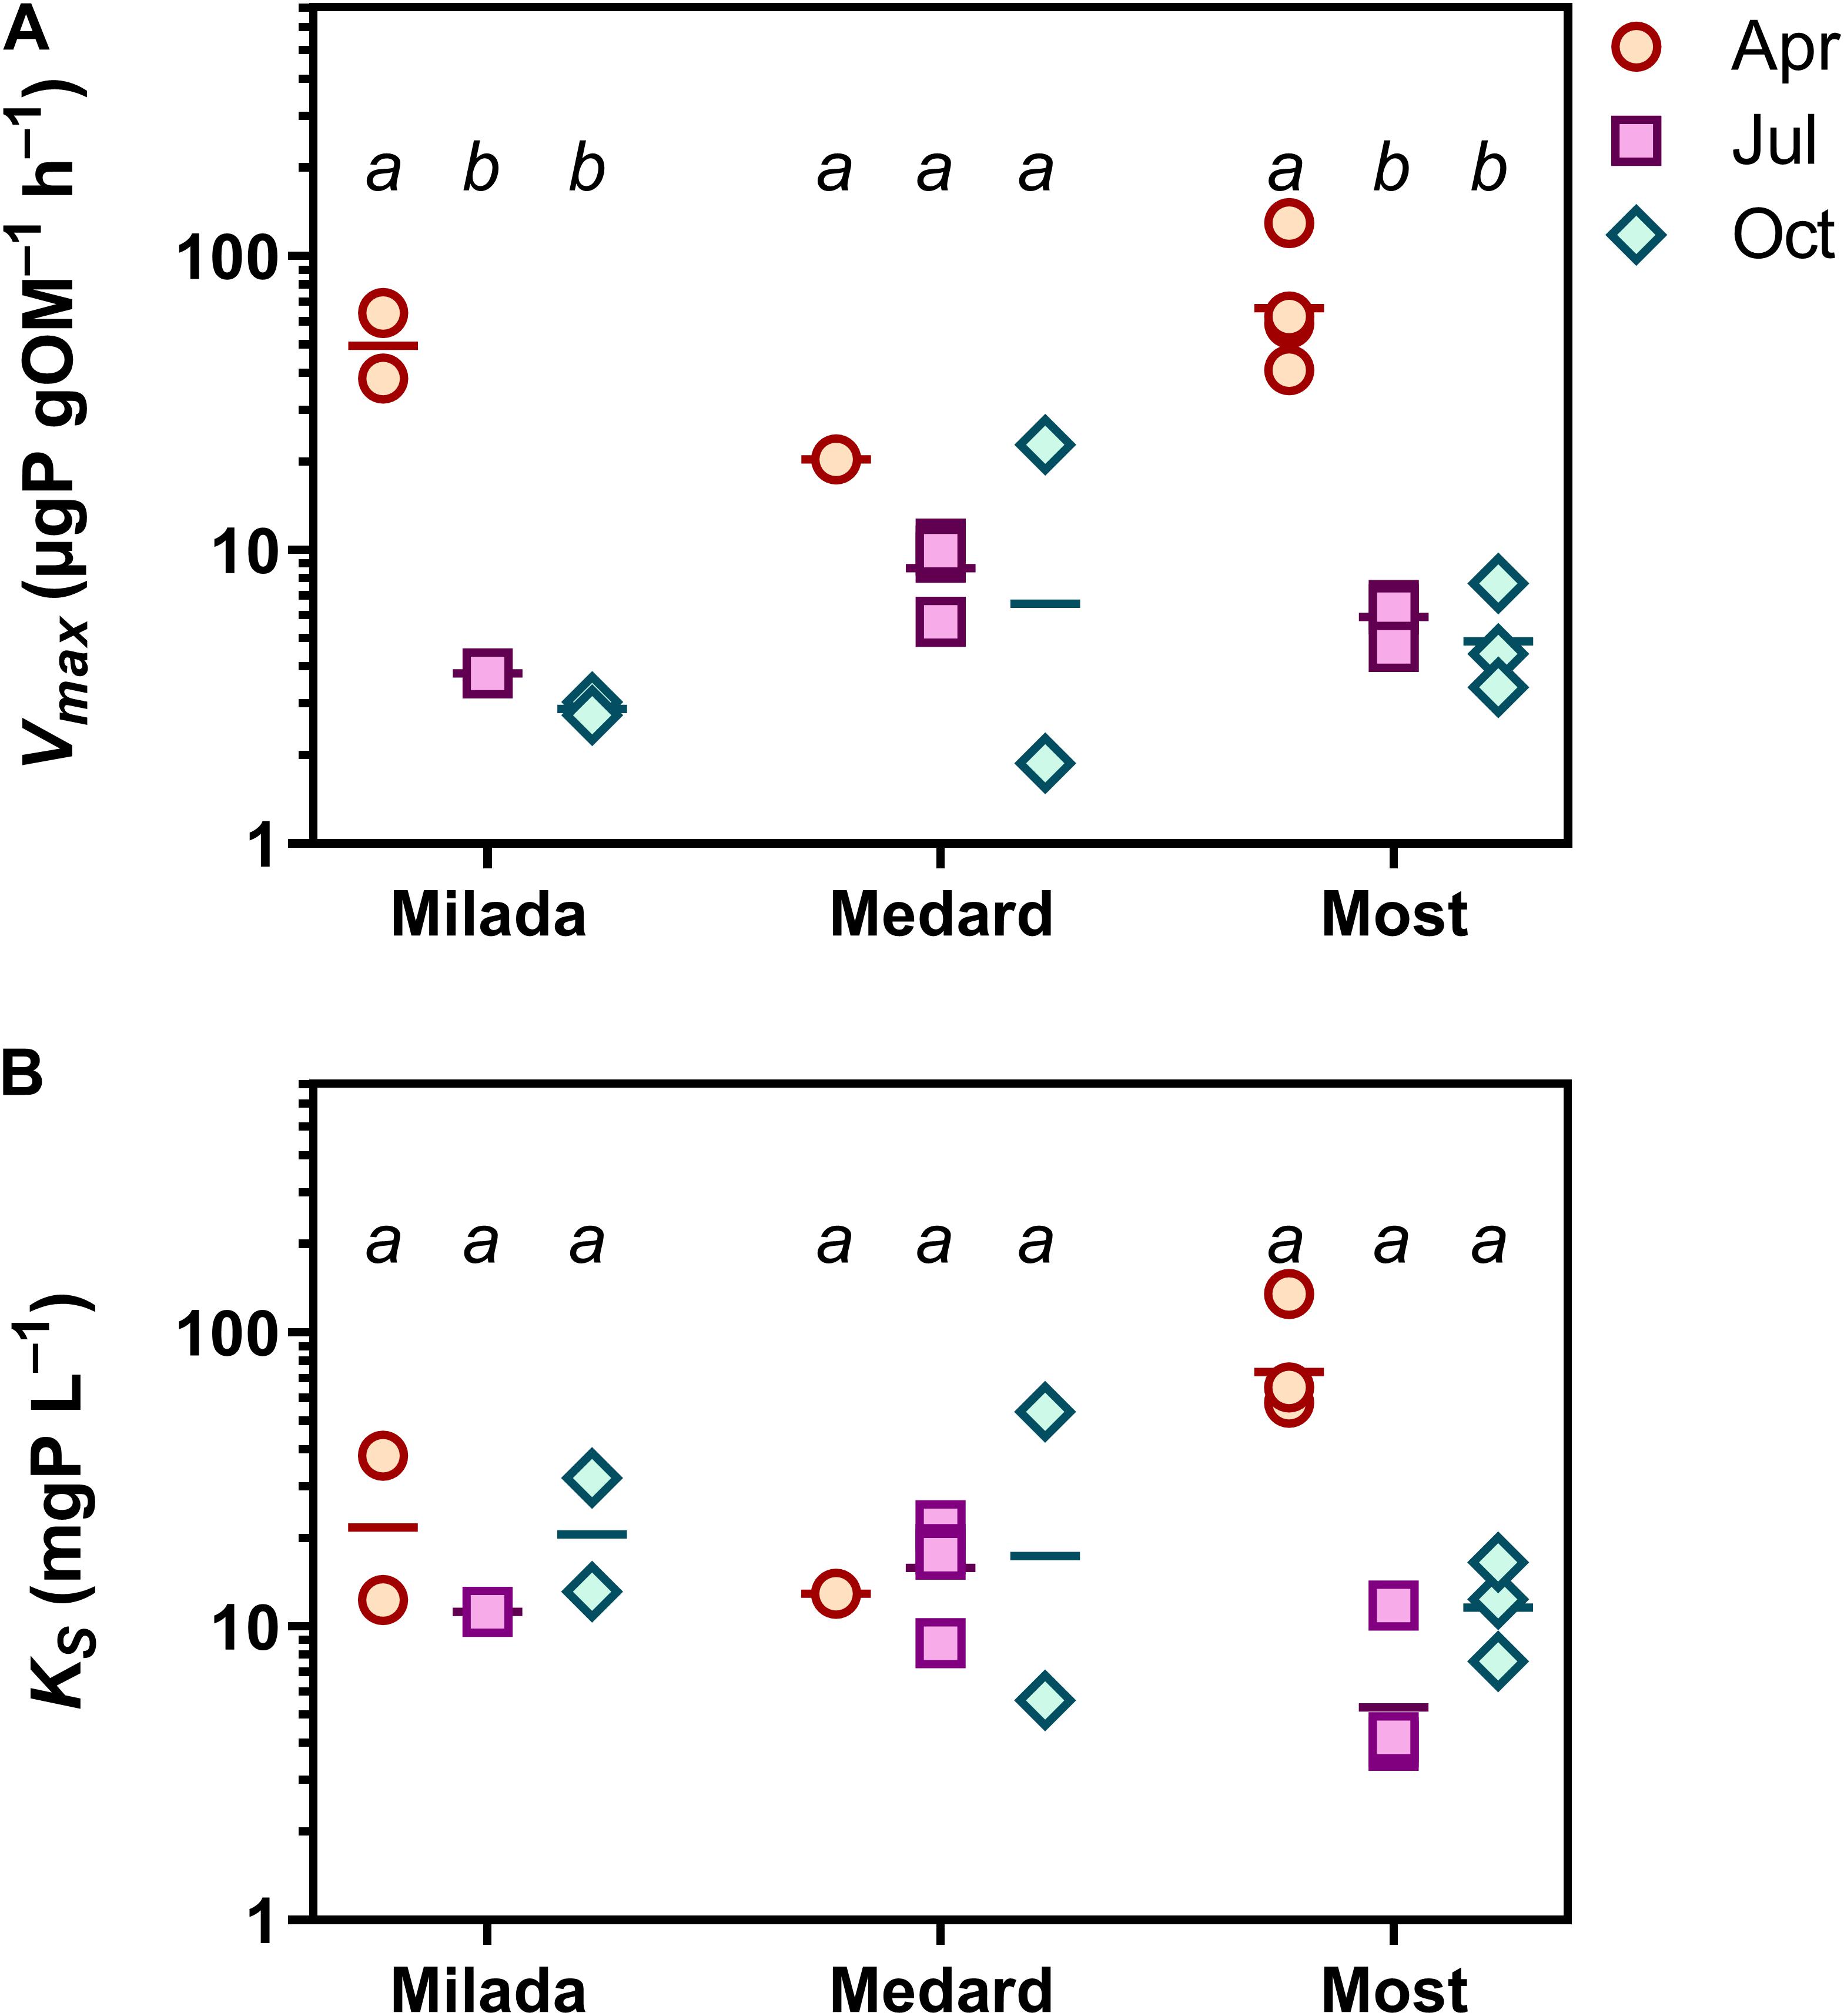
Figure 3. Epilithon P uptake in three post-mining lakes sampled in the Czech Republic in 2019. (A) Maximum P uptake capacity, Vmax. (B) Half-saturation constant, KS. Symbols in two lower panels show individual values. Different lowercase letters indicate significant seasonal differences within lakes (p < 0.05, two-way ANOVA and Tukey’s multiple comparisons post-test).
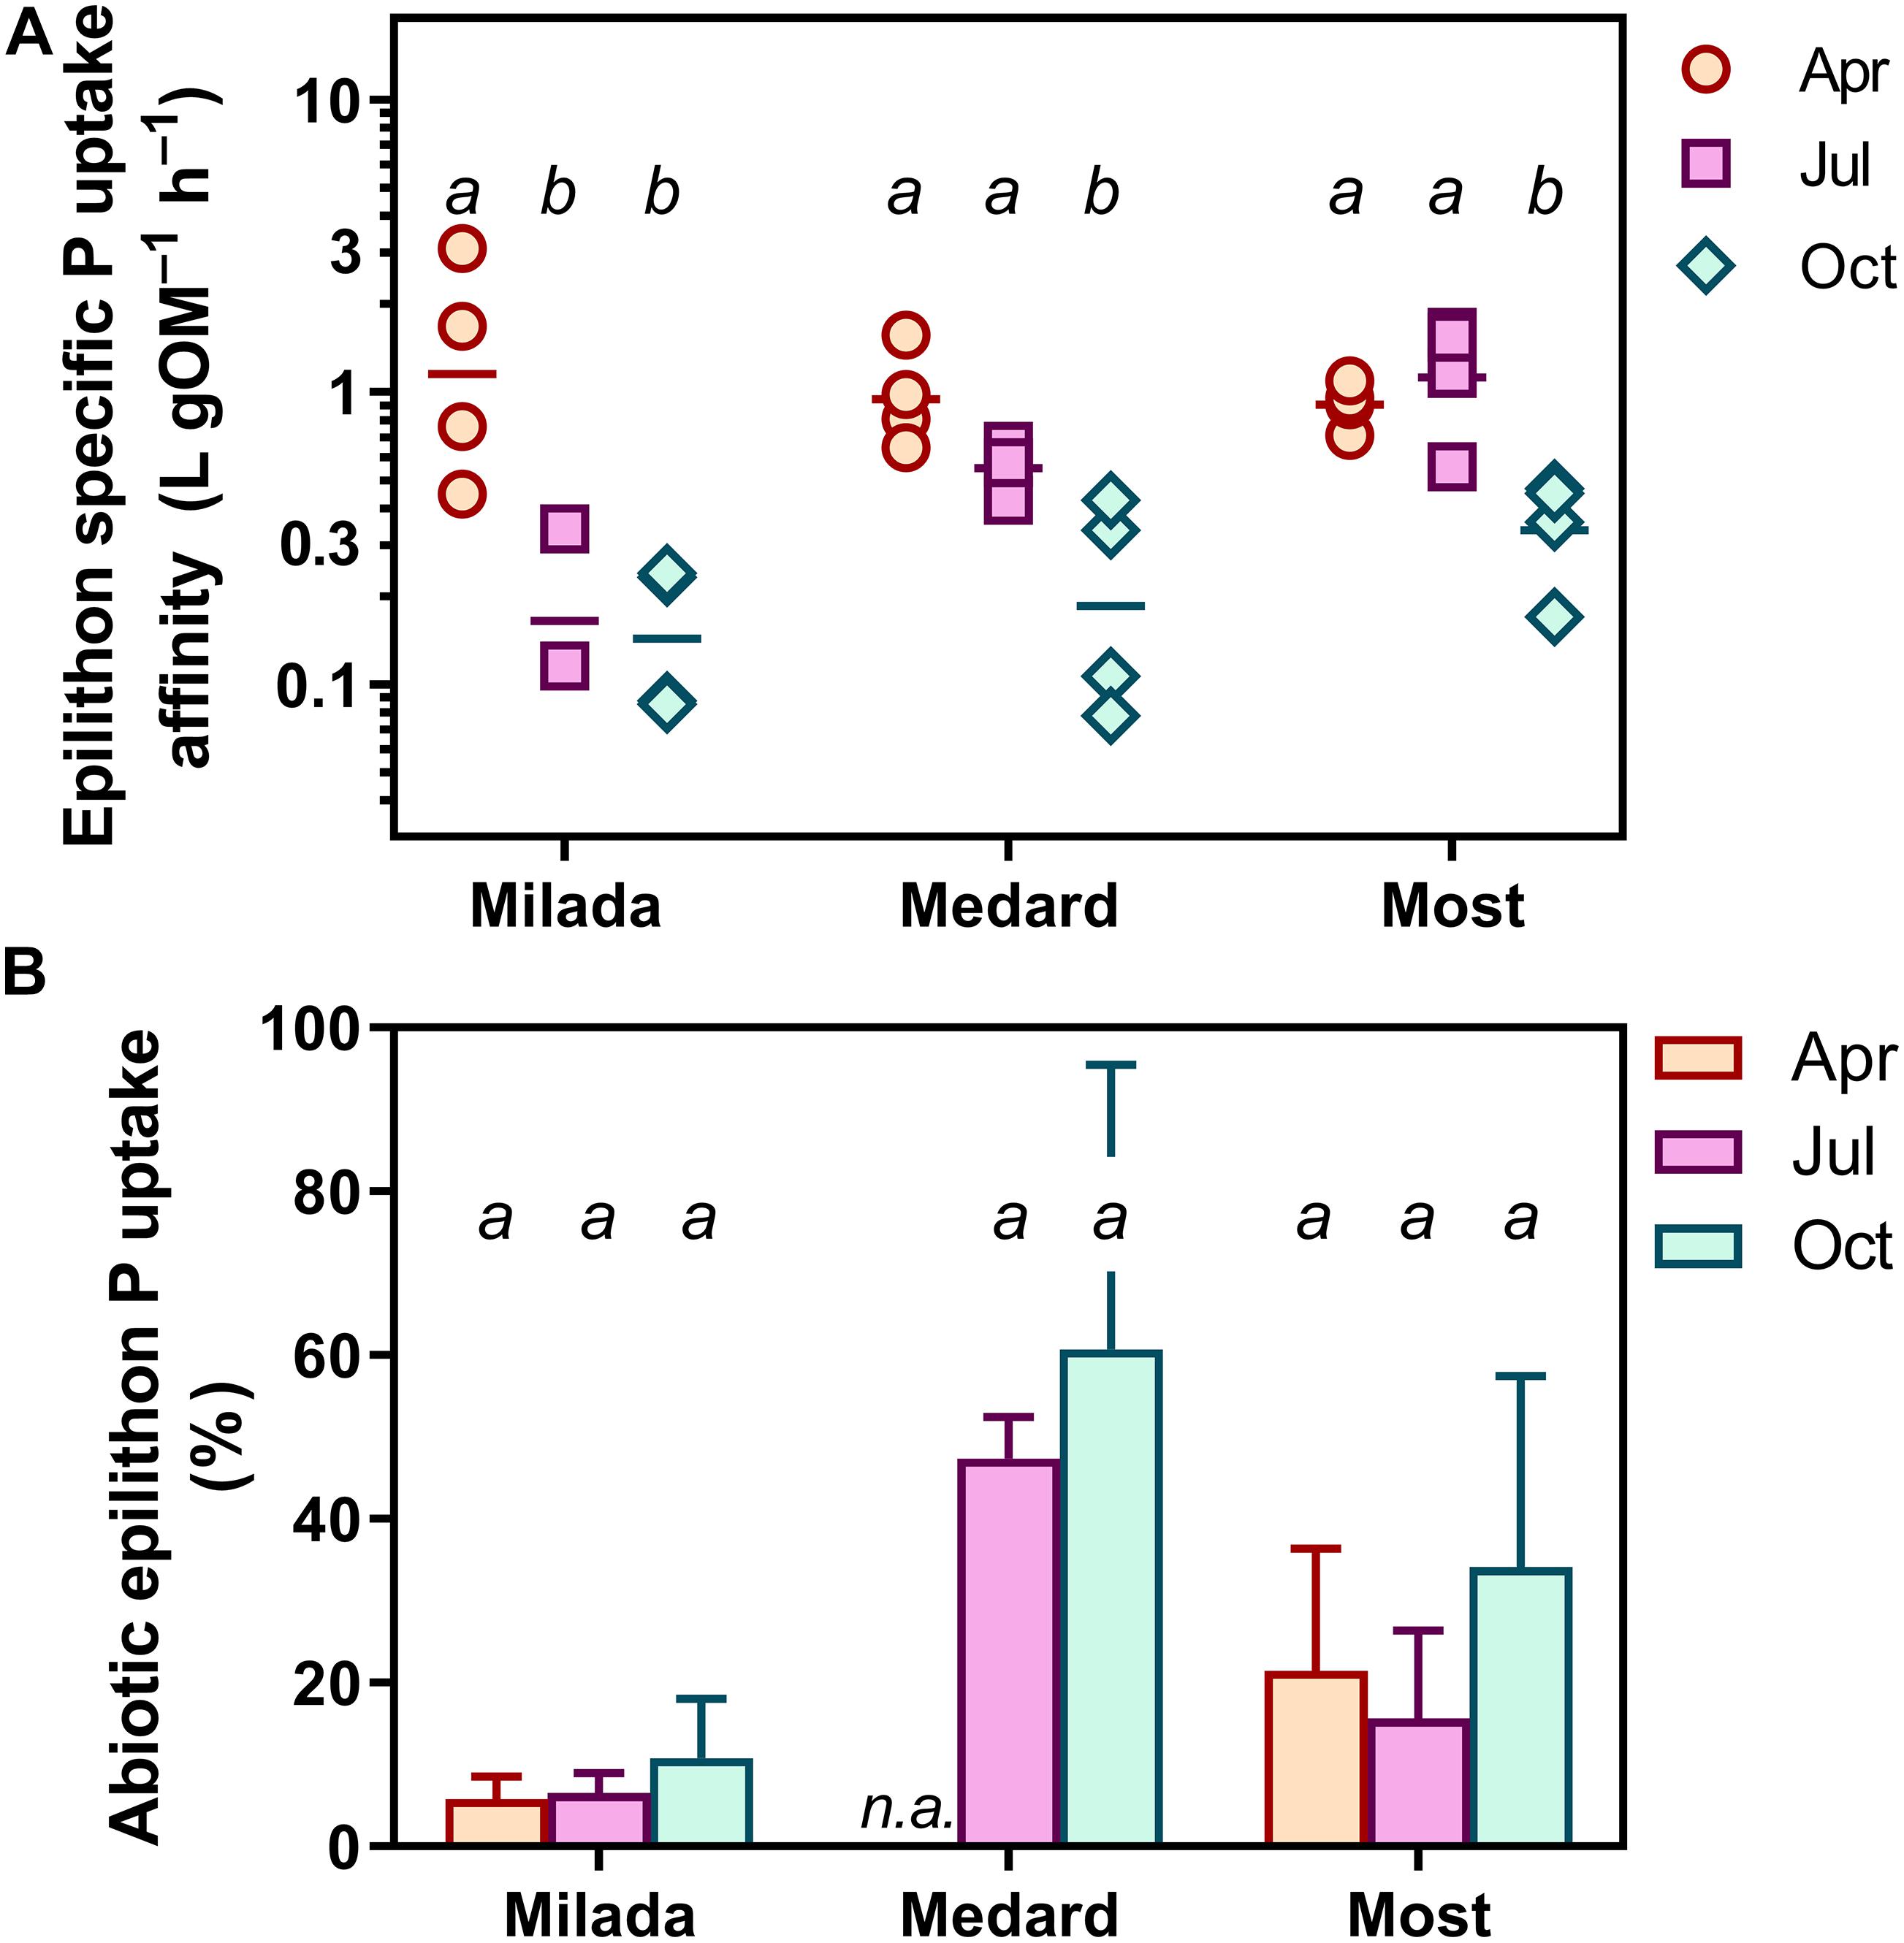
Figure 4. P uptake parameters of epilithon in three post-mining lakes sampled in the Czech Republic in 2019. Symbols show individual values; different lowercase letters indicate significant seasonal differences within lakes (p < 0.05; two-way ANOVA and Tukey’s multiple comparisons post-test). (A) Epilithon specific phosphorus uptake affinity (SPUAE). (B) Abiotic P uptake (adsorption). Columns show averages of four values from two sampling sites and two depths ± SD.
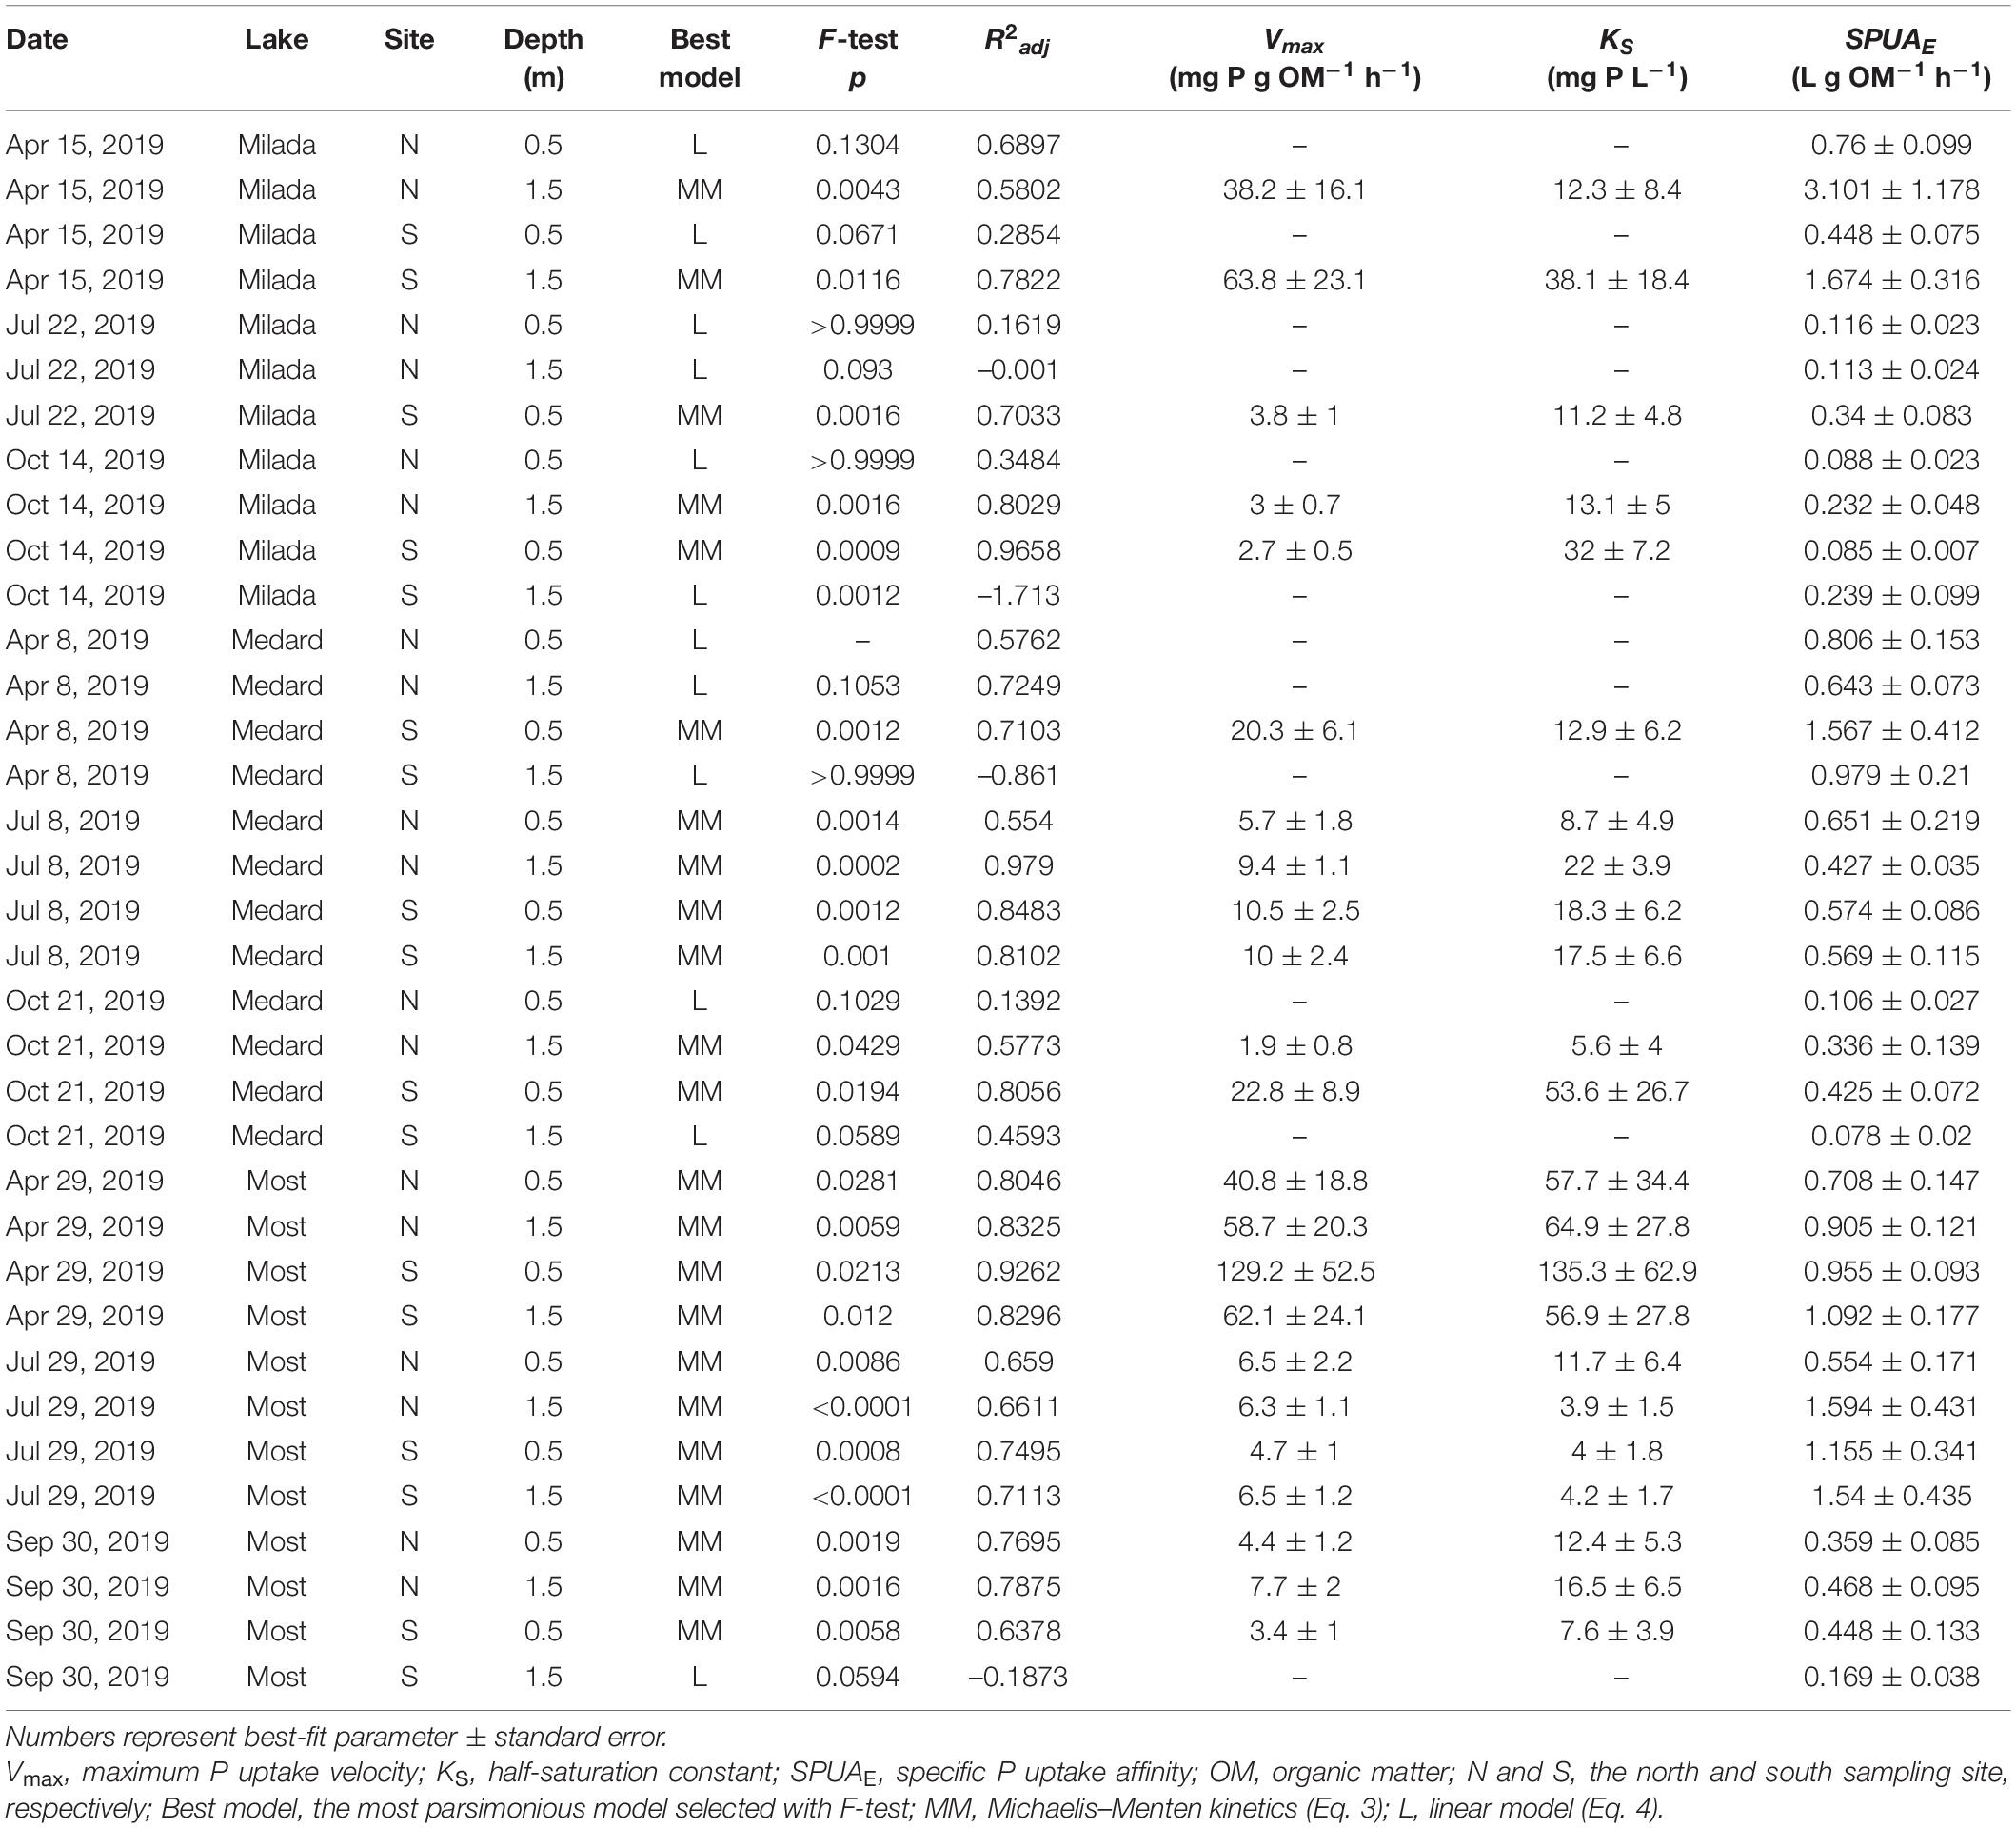
Table 3. A summary of estimates of kinetic parameters of P uptake by epilithon in three post-mining lakes in the Czech Republic in 2019 with indices of the goodness of fit.
Fitting integrated form of the Michaelis–Menten equation to data across all concentrations of added P resulted in roughly similar estimates of kinetic parameters (^*Vmax, ^*KS, and their ratio, ^*SPUAE) as compared with estimates provided by Eqs 2, 3 (Supplementary Figure 14 and Table 5). However, the integrated Michaelis–Menten equation showed substantial lack of fit to the measured data in several instances especially at higher Padd concentrations since the P uptake rate did not exhibit any saturation trend (Supplementary Figures 11–13). For that reason, there was a poor correlation between the values of some corresponding kinetic parameters estimated by two independent approaches (r2 values resulting from log–log linear regression were 0.85, 0.54, and 0.13 for Vmax, KS, and SPUAE, respectively). Therefore, the approach based on determination of initial uptake rate (Eq. 1) followed by fit to either the Michaelis–Menten or simplified linear model (Eqs 3, 4) was chosen for further calculations.
Specific P uptake affinity (SPUAE) ranged from 0.08 to 3.1 L g OM–1 h–1 (Table 3 and Figure 4A). There was a significant seasonal decrease in average SPUAE from 1.14 to 0.25 L g OM–1 h–1 independently of the lake (Table 2). The generalised linear mixed-effect model with season and lake treated as random factors indicated the C:N molar ratio of the epilithon biomass (p < 0.001) and the lake-water pH (p < 0.002) as significant drivers of SPUAE.
Epilithon P doubling time (PDTE), i.e., the theoretical time necessary for doubling the actual P content in the biomass assuming the actual in situ P uptake velocity, was rather long, ranging from 9.3 to 5,140 days or from 372 to 19,600 days, assuming Pi concentration equal to measured SRP or its assumed concentration 0.1 μg L–1, respectively (Table 4).
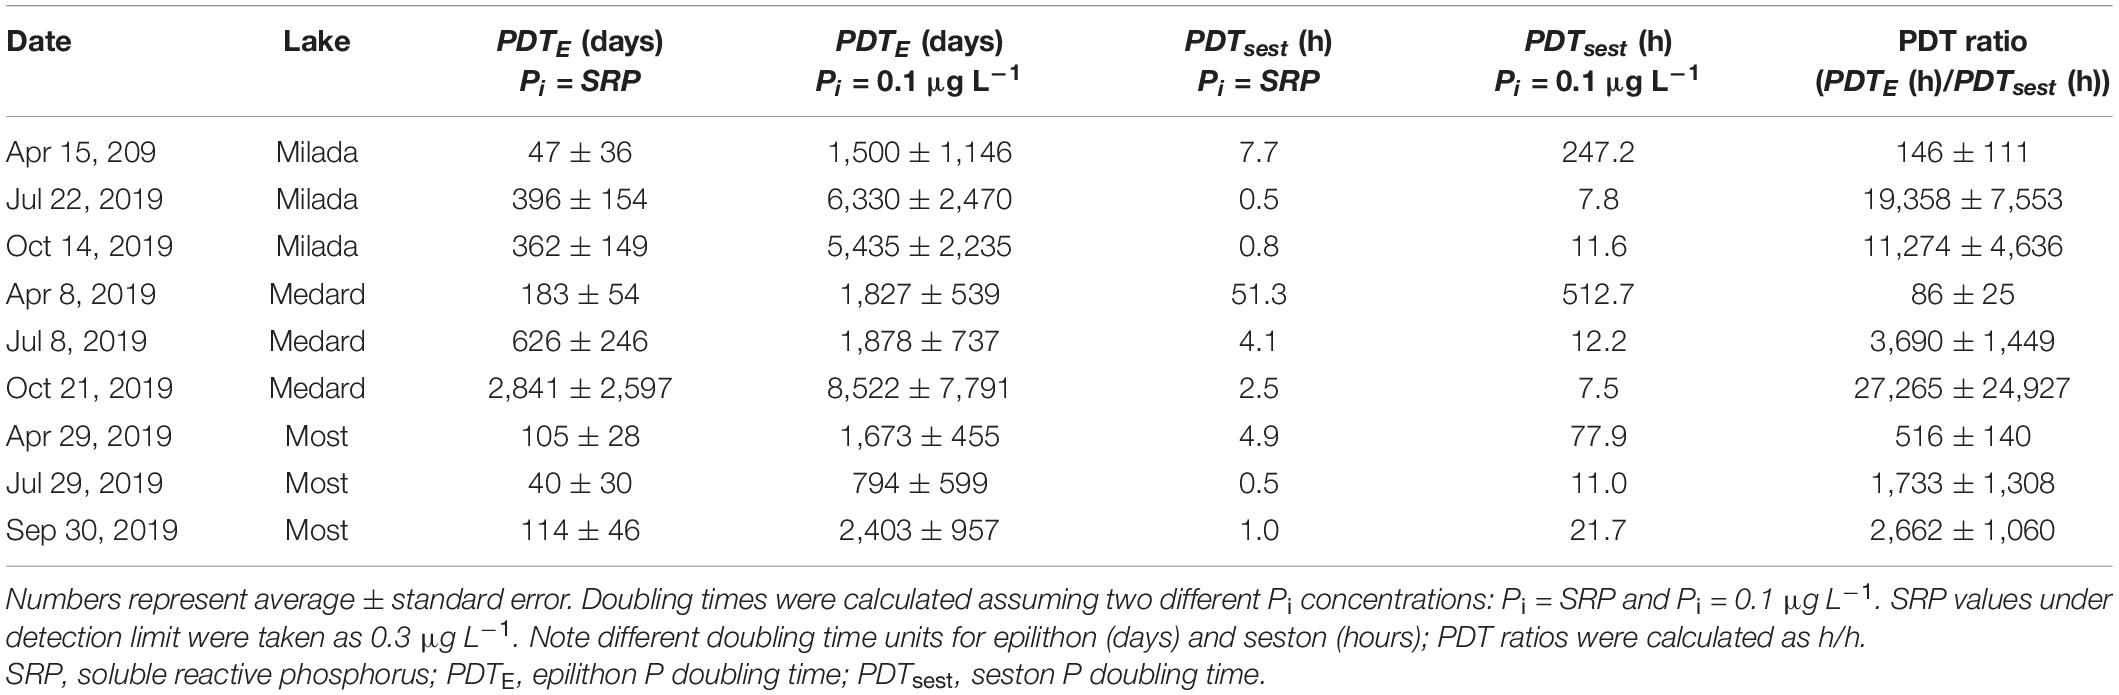
Table 4. A summary of estimates of phosphorus doubling times in epilithon (PDTE) and seston (PDTsest) in three post-mining lakes in the Czech Republic in 2019.
Abiotic 33P adsorption occurring in the presence of 4% formaldehyde was relatively high, accounting on average for 8% (range 1–18%), 24% (7–61%), and 54% (21–90%) of the formaldehyde-untreated samples in Lakes Milada, Most, and Medard, respectively (Figure 4B). In three additional experiments, we applied formaldehyde at a wide range of P concentrations (0.1–10 mg P L–1). In two of those, we observed a roughly two-fold increase in P adsorption with increasing P concentration, whereas no concentration dependence was found in the remaining experiment (Supplementary Figure 5). We discovered that more than one half of the adsorbed P (50–70%) could be readily released back to the dissolved phase during a 1-h treatment of the samples with an oxalacetate-based surface wash reagent (Supplementary Table 3), which indicates a weak and reversible abiotic P adsorption. No kinetic P uptake parameters reported throughout this paper have been corrected for abiotic P uptake (see section “Discussion”).
Seston P Dynamics and Comparison With Epilithon
Turnover time of dissolved orthophosphate measured in the lake water with 33P ranged from 7 min to 3.6 h, indicating moderate (in spring) to extreme (in summer and autumn) P deficiency in all lakes (Supplementary Table 5). Seston P uptake kinetics followed the Michaelis–Menten model (Supplementary Figure 6), yielding Vmax estimates ranging from 0.29 to 1.3 μg P L–1 h–1 and KS from 0.4 to 6.1 μg P L–1 (Table 5). The specific P uptake affinities in seston significantly increased (p < 0.01, ANOVA) from 240–2,800 L g OM–1 h–1 in April to 6,200–23,900 L g OM–1 h–1 in June and October, thus being two to four orders of magnitude higher (Table 5) than the corresponding epilithon-specific values (0.08–3.1 L g OM–1 h–1, Table 3). Estimates of seston P doubling time (PDTsest) ranged from 0.5 to 51 h or from 11 to 740 h, assuming Pi concentration equal to SRP or to 0.1 μg L–1, respectively, with a generally decreasing seasonal trend opposite to seasonal changes in PDTE. Ratio of PDTE to PDTsest ranged from 86 to 516 in April, while it increased to 1,730–27,300 in July and October (Table 4).
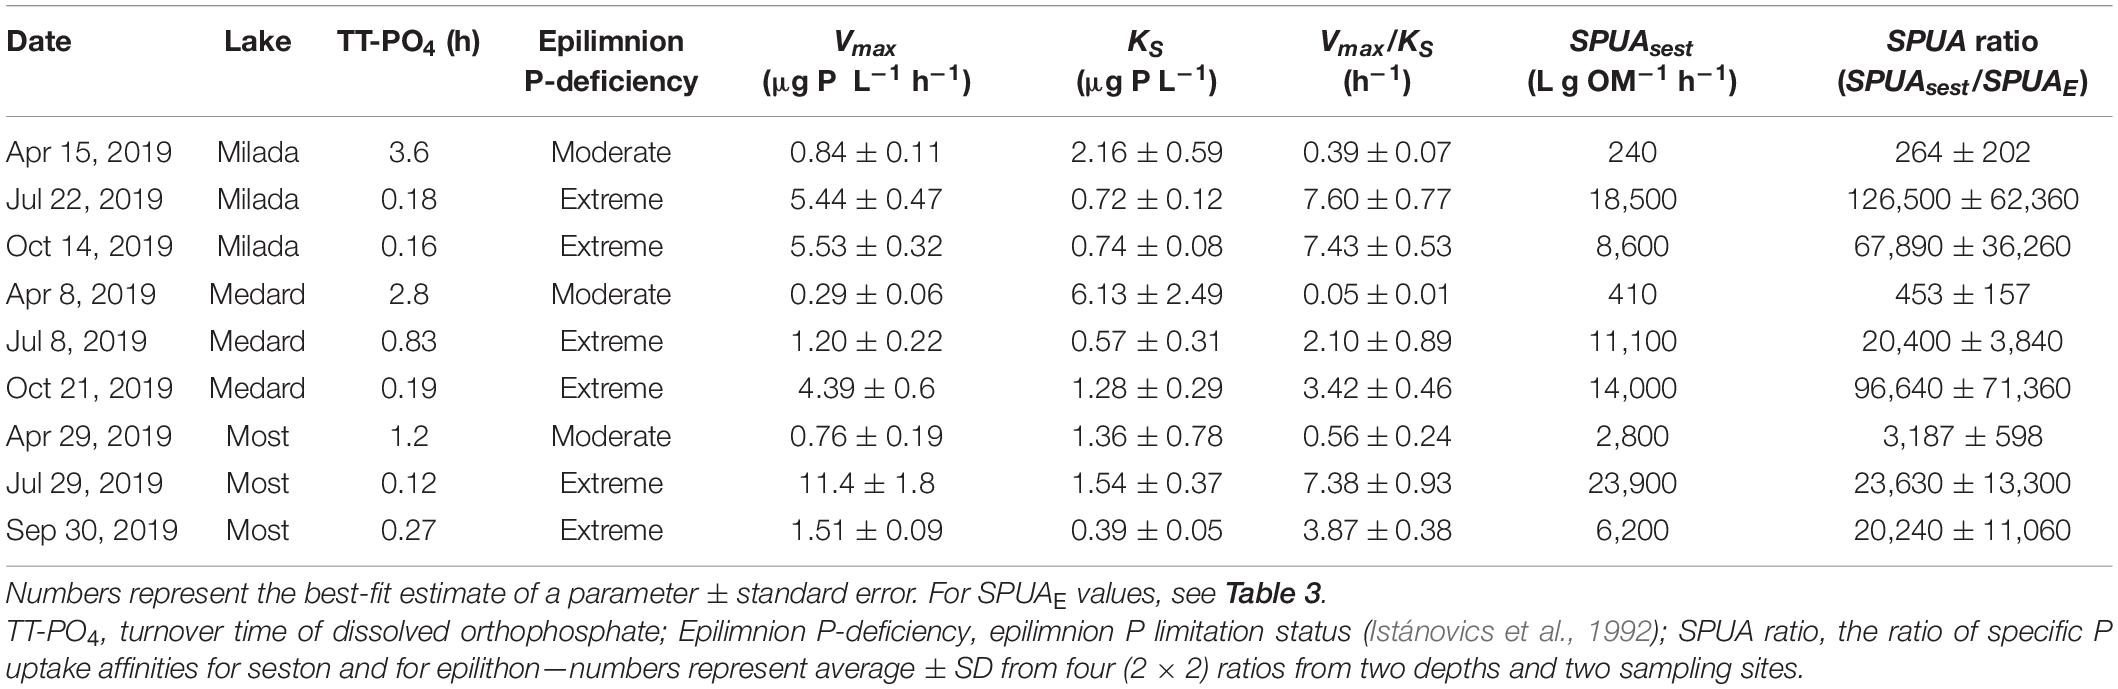
Table 5. A summary of estimates of kinetic parameters (Vmax and KS of Michaelis–Menten kinetics and specific P uptake affinity, SPUAsest) of P uptake by seston in lake water in three post-mining lakes in the Czech Republic in 2019.
Discussion
Data on periphyton P uptake kinetics in lentic systems are extremely scarce in the literature (Hwang et al., 1998; Scinto and Reddy, 2003; Wolfe and Lind, 2010). Our study represents the first report on P uptake kinetics by epilithon assemblages naturally growing on stones in temperate oligo- to mesotrophic lakes. The only comparable data are available from very different freshwater habitats (a subtropical lake and wetlands) (Hwang et al., 1998; Scinto and Reddy, 2003). The values of specific P uptake affinity (SPUAE) measured in this study (0.08–3.1 L g OM–1 h–1) were roughly one order of magnitude lower than those presented for periphyton by Scinto and Reddy in subtropical wetlands (Scinto and Reddy, 2003). While Vmax estimates presented in our study (1.9–129 mg P g OM–1 h–1) roughly match the values available in the literature, our KS estimates (3.9–135 mg P L–1) are one to three orders of magnitude higher than those previously reported (Hwang et al., 1998; Scinto and Reddy, 2003). The among-system differences in kinetic parameters might be attributed to the differences in abiotic and biotic drivers affecting P uptake in compared ecosystems, in the species composition of periphyton, environmental conditions, and morphological and limnological variances between studied lakes. In freshwater wetlands, extreme periphytic N:P ratios (152–231) have been reported (Scinto and Reddy, 2003). Such high values suggest a strong P limitation of these wetlands and may explain the 10 times higher SPUAE compared with our estimates. A positive relationship between the degree of P deficiency and SPUAE is well documented in algae (Krumhardt et al., 2013; Cáceres et al., 2019). The wide range of linear increase in P uptake velocity with a concentration of dissolved P, reflected by high KS values or even by the absence of saturation, might represent an adaptation of the epilithon community to episodic increases of dissolved P, ensuring optimal utilisation of available resources.
Variability in SPUAE was statistically related to both epilithon C:N molar ratio and lake-water pH. The negative relation between SPUAE and epilithon C:N could indicate a tendency to a decrease in specific P uptake affinity under conditions of N+P co-limitation of the epilithic microbial community (Hillebrand and Sommer, 1999). Notably, the highest epilithon C:N ratios (approximately 22) were observed at Lake Milada in July and October (Figure 2C), concomitantly with low SPUAE values (Figure 4A) and an extremely low lake-water nitrate concentration (0.02 mg L–1; Table 1), generally considered to be limiting for algal growth (Maberly et al., 2002). Since the naturally growing epilithon consist of a variety of species, some of them might have been N-limited, whereas the others might have been P-limited. Co-limitation of periphyton by N+P in oligotrophic lakes has been previously reported (Hogan et al., 2014). Following this logic, this could have led to a lower P demand and lower SPUAE values of the epilithic community. However, the relation of SPUAE to species composition was not a subject of this study. The positive relationship between SPUAE and pH remains rather obscure, since the reported pH values (8–9) are common in lakes worldwide (Michelutti et al., 2002; Liess et al., 2009; Keshri et al., 2017). The effect was most probably indirect, as no clues revealing the direct effect of pH on P uptake traits have been reported in the literature yet.
In the lakes studied, epilithon biomass per area and nutrient stoichiometry corresponded with the values reported for comparable oligotrophic lakes (Liess et al., 2009). Two slightly different stoichiometric definitions of growth-limiting conditions were suggested in the literature. According to Hillebrand and Sommer, P limitation of benthic algae is indicated when C:P > 180 and N:P > 22 (Hillebrand and Sommer, 1999). Kahlert reported the threshold for P limitation of periphyton when C:P > 369 and N:P > 32 (Kahlert, 1998). Applying both definitions, the values found in the investigated post-mining lakes (average C:P 680 and N:P 39) indicate P limitation of epilithic growth, which tends to strengthen over the season (Figure 2B). Comparably high epilithic C:P and N:P ratios were also reported for deep oligotrophic lakes in Sweden (C:P and N:P ratios up to 800 and 74, respectively) (Liess et al., 2009) and an oligotrophic lake in north-western Ontario (C:P ratio 820) (Frost et al., 2002).
We observed a discrepancy between the seasonal development of SPUAE and of the other limitation indices. Epilithon biomass cover (OM cm–2) roughly doubled, while biomass P content roughly halved from April to July and October. One would expect a simultaneous increase in SPUAE in response to strengthened P limitation (Krumhardt et al., 2013; Cáceres et al., 2019) implied by an observed decrease in P content and increase in C:P ratio. However, the opposite was found; i.e., SPUAE decreased roughly 10 times during the same period (Table 2 and Figure 4A). There are several possible explanations for this apparent contradiction: (1) the decreasing ratio of active living biomass to structural (mainly extracellular) polymers or detritus during the seasonal succession: SPUAE was normalised to the total OM content, not discriminating living and dead cells as well as extracellular polymeric substances. This notion appears to be supported by the fact that the C:P ratio doubled from spring (∼410) to the extreme values in summer and autumn (∼820, Figure 2B). Moreover, the generally decreasing growth and activity of epilithon during vegetation season were proved in a parallel study (Čapková et al., in prep.) showing a roughly one-order-of-magnitude decrease in OM-normalised in situ primary production of epilithon in all lakes. (2) Seasonal changes in the epilithic microbial community might favour species with lower P requirements or motile growth form able to glide out from biofilm. Seasonal shifts in the phototrophic assemblage composition were in fact observed; however, it is statistically unrelated to SPUAE (Bešta et al., in prep.). It has been reported that higher periphyton C:P ratios can be attributed to a higher proportion of heterotrophic to autotrophic organisms (Fitter and Hillebrand, 2009). (3) The high efficiency of P internal recycling in epilithon (ratio of P recycling to leakage into the lake water): phosphorus releasing out from the decomposing biomass may utilised by the living cells without leaving the biofilm and thus lowering the demand for external P input. (4) The decreased accessibility of P to epilithic microorganisms due to the thickening of the epilithic biofilm on the stone over the season: if true, this would markedly constrain P flux through the epilithon matrix described as a power function of flow velocity and as a negative power function of distance from the leading edge of the communities (Riber and Wetzel, 1987). As a result, the cells situated closer to the stone substrate could exhibit lower P uptake than the cells near the biofilm–water interface even if their individual P uptake affinities were high. Consequently, this would lead to lower values of overall P uptake and of the related parameters (SPUAE, Vmax, etc.) of the epilithon.
Values of epilithic specific P uptake affinity, SPUAE, were two to four orders of magnitude lower than the corresponding values for seston, SPUAsest, in all lakes studied (Table 4) with the highest difference (20,000–126,000-fold) in June and October. Similar but not as high (∼200-fold) differences in specific P uptake affinity were also reported for a shallow subtropical lake in Florida (Hwang et al., 1998). The differences between SPUAsest and SPUAE likely result from the mostly unicellular arrangement of sestonic bacterio- and phytoplankton that tends to maximise surface to volume ratio (Tambi et al., 2009), while epilithic P uptake is affected by multiple factors, e.g., a limited surface for nutrients entering the biofilm or the presence of an extracellular matrix interfering with nutrient transport from water into the cells (Riber and Wetzel, 1987; Larned et al., 2004).
Noteworthy, P uptake rate is calculated as a product of SPUA and the concentration of bioavailable P (Pi) in the lake water. Assuming homogenous P concentration in the epilimnion, both planktonic and epiphytic organisms are exposed to the same P levels. Therefore, irrespectively to actual P concentration, planktonic microbes were able to acquire up to 20,000–126,000 times more P per unit of biomass than epilithic ones.
Likewise, the time necessary for doubling their P content was up to 1.7,000–27,000 times shorter for seston than for epilithon in summer and autumn (Table 4), implying extremely slow growth of epilithic compared with sestonic microorganisms.
Reliability of estimates of P uptake rates and P doubling times depend on knowledge of actual Pi concentrations. SRP is not a reliable estimate of the lake-water Pi concentration at its low levels (SRP < 5 μg P L–1), as it is determined with molybdenum blue method known to highly (up to 100 times) overestimate the actual Pi concentration under such conditions (Rigler, 1966) mainly due to the interference with arsenates and hydrolysed organic phosphorus (see, e.g., Tanaka et al., 2006). Very short values of turnover time of dissolved orthophosphate measured in epilimnia of all the studied lakes (7–50 min, Table 5) were shown to be associated with extremely low Pi concentrations (in nanomolar range, i.e., ∼0.1 μg L–1) (Rigler, 1966; Taylor and Lean, 1991; Chen and Taylor, 2011). In accordance, seston P doubling time values calculated in this study assuming Pi = 0.1 μg L–1 (i.e., 3.2 nmol L–1) resulted in summer and autumn in doubling times in tens of hours, which fit typical growth rates of sestonic microorganisms, while the assumption Pi = SRP (i.e., 9.6–102 nmol L–1) led to unrealistically short values (frequently approximately 1 h; see Table 4). Hence, doubling times calculated by Pi concentration 0.1 μg L–1 seem to be closer to the reality than the ones calculated by using SRP. In April, on the other hand, the seston doubling times calculated assuming Pi = SRP seemed to be realistic (Table 4), while those calculated assuming Pi = 0.1 μg L–1 were too long (∼80–500 h). This would imply that in April, when water column stratification and P deficiency in the lakes were not yet fully developed, Pi was of the order of micrograms per litre (∼10–100 mnol L–1) and close to SRP, while under conditions of severe P limitation occurring in July and October, it was roughly one order of magnitude lower (∼1–10 mnol L–1). Interestingly, estimates of residual Pi concentrations in P limited algal cultures matched the latter range (Laws et al., 2011; Grant et al., 2013). At any rate, epilithon P doubling times were always extremely long compared with seston (thousands of days vs. tens of hours; Table 4).
Consequently, epilithon microorganisms might not be able to acquire enough P for their growth when lakes are thermally stratified (from spring to autumn) and might be virtually outcompeted for P by planktonic microorganisms dominating P uptake in this period. This has important implications for the coexistence of plankton and periphyton, affecting biogeochemical cycles in the lakes studied and supposedly in deep oligotrophic lakes in general. Epilithon could prosper mostly in late autumn, winter, or early in the spring, when the mixing of the water column increases P availability in the upper strata (Wetzel, 2001) and phytoplankton productivity is limited (Reynolds, 2006). Such a relationship between plankton and epilithon may be interpreted as an example of temporal niche separation, allowing a stable and long-term coexistence of both communities in the same ecosystem (Chesson, 2000). Facility of epilithon to acquire P from the solid substrate should not be forgotten; however, concentration of P in the solid substrate at investigated lakes was negligible (Supplementary Table 4) compared with values available in the literature (Porder and Ramachandran, 2013). Therefore, we assume that it does not play an important role in the investigated lakes.
The use of naturally growing epilithon assemblage in the present study is challenging, but on the other hand, it provides more ecologically relevant data than commonly used artificial substrates (Jackson et al., 2001; Mieczan and Tarkowska-Kukuryk, 2012). An obvious disadvantage is an inherent heterogeneity of individual samples, resulting in a high scatter of P uptake data (see Supplementary Figures 2–4), which, however, does not rule out the general patterns and temporal trends to be identified.
Values of P uptake parameters reported throughout this paper have not been corrected for abiotic P uptake (i.e., uptake occurring in the presence of 4% formaldehyde), since the results of abiotic adsorption experiments were inconclusive, showing variable concentration dependency of the formaldehyde effect (Supplementary Figure 5), which does not allow P uptake to be corrected properly. However, when subtracting the proportion of the abiotic P uptake at the lowest Padd (the closest concentration to the lake-water concentration), its proportion increased with the season (Figure 4B). This would lead to even bigger seasonal decrease in SPUAE, providing stronger support for the main findings of this study. The abiotic P uptake was substantial, averaging at 54% of total P uptake in Lake Medard, 24% in Lake Most, and 8% in Lake Milada (Figure 4B).
In additional experiments, oxalacetate-based surface wash reagent released 50–70% of such abiotically adsorbed P, indicating a weak and reversible P binding (Supplementary Table 3). Similarly, Sañudo-Wilhelmy et al. (2004) reported surface abiotic P adsorption ranging from 60 to 90% of the apparent total P uptake in the phytoplankton. Surface P adsorption has been suggested to be a mechanism for storing the temporary excess of P before it can be transported into the algal cells (Yao et al., 2011). Exact mechanism of abiotic binding is not clarified, but it can depend on specific proteins (Scanlan et al., 1993; Kamennaya et al., 2020). Our data indicate that the phenomenon of temporary abiotic P adsorption could be important also in periphyton, but so far, this has not been considered and thus requires further attention in both theoretical and experimental studies.
Data Availability Statement
The raw data supporting the conclusions of this article will be made available by the authors, without undue reservation.
Author Contributions
EK and JN designed and performed the experiments, interpreted the results, and wrote the manuscript. KČ, PZ, MŘ, EK, JN, and KŘ performed the field work. PZ, PČ, KČ, KŘ, and MP reviewed the early version of the manuscript. PČ analyzed the data and ran the statistical analyses. KČ designed a map of lakes and took photos of epilithon. PZ took aerial photos of the lakes (presented in the Supplementary Material). All authors reviewed and approved the final version of the manuscript.
Funding
This research was supported by grant No. 19-05791S funded by the Czech Science Foundation. Additional support was provided by the Czech Academy of Sciences within the internal program of the Strategy AV 21: Land save and recovery. The project would not be possible without tight cooperation with companies Palivový Kombinát Ústí s.p. and Sokolovská Uhelná, which provided a boat and chemical data.
Conflict of Interest
The authors declare that the research was conducted in the absence of any commercial or financial relationships that could be construed as a potential conflict of interest.
Publisher’s Note
All claims expressed in this article are solely those of the authors and do not necessarily represent those of their affiliated organizations, or those of the publisher, the editors and the reviewers. Any product that may be evaluated in this article, or claim that may be made by its manufacturer, is not guaranteed or endorsed by the publisher.
Supplementary Material
The Supplementary Material for this article can be found online at: https://www.frontiersin.org/articles/10.3389/fmicb.2021.735498/full#supplementary-material
References
Azim, M. E., Verdegem, M. C. J., van Dam, A. A., and Beveridge, M. C. M. (2005). Periphyton: Ecology, Exploitation and Management. Wallingford: CABI.
Button, D. K. (1985). Kinetics of nutrient-limited transport and microbial growth. Microbiol. Rev. 49, 270–297.
Cáceres, C., Spatharis, S., Kaiserli, E., Smeti, E., Flowers, H., and Bonachela, J. A. (2019). Temporal phosphate gradients reveal diverse acclimation responses in phytoplankton phosphate uptake. ISME J. 13, 2834–2845. doi: 10.1038/s41396-019-0473-1
Cantonati, M., and Lowe, R. L. (2014). Lake benthic algae: toward an understanding of their ecology. Freshw. Sci. 33, 475–486. doi: 10.1086/676140
Cembella, A. D., Antia, N. J., and Harrison, P. J. (1984). The utilization of inorganic and organic phosphorous compounds as nutrients by eukaryotic microalgae: a multidisciplinary perspective: part I. CRC Crit. Rev. Microbiol. 10, 317–391. doi: 10.3109/10408418209113567
Chen, F., and Taylor, W. D. (2011). A model of phosphorus cycling in the epilimnion of oligotrophic and mesotrophic lakes. Ecol. Modell. 222, 1103–1111. doi: 10.1016/j.ecolmodel.2010.12.007
Chesson, P. (2000). General theory of competitive coexistence in spatially-varying environments. Theor. Popul. Biol. 58, 211–237. doi: 10.1006/tpbi.2000.1486
Currie, D. J. (1990). Phosphorus deficiency and its variation among lakes. Can. J. Fish. Aquat. Sci. 47, 1077–1084. doi: 10.1139/f90-124
Currie, D. J., and Kalff, J. (1984). A comparison of the abilities of freshwater algae and bacteria to acquire and retain phosphorus. Limnol. Oceanogr. 29, 298–310. doi: 10.4319/lo.1984.29.2.0298
Dodds, W. (2003). The role of periphyton in phosphorus retention in shallow freshwater aquatic systems. J. Phycol. 39, 840–849. doi: 10.1046/j.1529-8817.2003.02081.x
Fitter, A., and Hillebrand, H. (2009). Microbial food web structure affects bottom-up effects and elemental stoichiometry in periphyton assemblages. Limnol. Oceanogr. 54, 2183–2200. doi: 10.4319/lo.2009.54.6.2183
Fitzsimons, M. F., Probert, I., Gaillard, F., and Rees, A. P. (2020). Dissolved organic phosphorus uptake by marine phytoplankton is enhanced by the presence of dissolved organic nitrogen. J. Exp. Mar. Biol. Ecol. 530:151434.
Frost, P., Elser, J., and Turner, M. (2002). Effects of caddisfly grazers on the elemental composition of epilithon in a Boreal Lake. J. North Am. Benthol. Soc. 21, 54–63. doi: 10.2307/1468299
Grant, S. A., Bienfang, P. K., and Laws, E. A. (2013). Steady state bioassay approach applied to phosphorus limited continuous cultures: a growth study of the marine chlorophyte Dunaliella salina. Limnol. Oceanogr. 58, 314–324.
Grossman, A. R., and Aksoy, M. (2018). Algae in a phosphorus-limited landscape. Annu. Plant Rev. 48, 337–374.
Healey, F. P. (1980). Slope of the Monod equation as an indicator of advantage in nutrient competition. Microb. Ecol. 5, 281–286. doi: 10.1007/BF02020335
Hillebrand, H., and Sommer, U. (1999). The nutrient stoichiometry of benthic microalgal growth: redfield proportions are optimal. Limnol. Oceanogr. 44, 440–446. doi: 10.4319/lo.1999.44.2.0440
Hogan, E. J., McGowan, S., and Anderson, N. J. (2014). Nutrient limitation of periphyton growth in arctic lakes in south-west Greenland. Polar Biol. 37, 1331–1342. doi: 10.1007/s00300-014-1524-8
Hudson, J. J., Taylor, W. D., and Schindler, D. W. (2000). Phosphate concentrations in lakes. Nature 406, 54–56. doi: 10.1038/35017531
Hwang, S., Havens, K. E., and Steinman, A. D. (1998). Phosphorus kinetics of planktonic and benthic assemblages in a shallow subtropical lake. Freshw. Biol. 40, 729–745. doi: 10.1046/j.1365-2427.1998.d01-660.x
ISO (1992). ISO 10260:1992 Water Quality — Measurement of Biochemical Parameters — Spectrometric Determination of the Chlorophyll-A Concentration. Geneva: ISO.
Istánovics, V., Pettersson, K., Pierson, D., and Duarte, R. (1992). Evaluation of phosphorus deficiency indicators for summer phytoplankton in Lake Erken. Limnol. Oceanogr. 37, 890–900. doi: 10.4319/lo.1992.37.4.0890
Jackson, C. R., Churchill, P. F., and Roden, E. E. (2001). Successional changes in bacteral assamblage structure during epilithic biofilm development. Ecology 82, 555–566.
Kamennaya, N. A., Geraki, K., Scanlan, D. J., and Zubkov, M. V. (2020). Accumulation of ambient phosphate into the periplasm of marine bacteria is proton motive force dependent. Nat. Commun. 11:2642. doi: 10.1038/s41467-020-16428-w
Keshri, J., Angia Sriram, P. R., Colombet, J., Perriere, F., Antoine, T., and Sime-Ngando, T. (2017). Differential impact of lytic viruses on the taxonomical resolution of freshwater bacterioplankton community structure. Water Res. 124, 129–138. doi: 10.1016/j.watres.2017.07.053
Kopáček, J., and Hejzlar, J. (1993). Semi-micro determination of total phosphorus in freshwaters with perchloric acid digestion. Int. J. Environ. Anal. Chem. 53, 173–183.
Krumhardt, K. M., Callnan, K., Roache-Johnson, K., Swett, T., Robinson, D., Reistetter, E. N., et al. (2013). Effects of phosphorus starvation versus limitation on the marine cyanobacterium Prochlorococcus MED4 I: uptake physiology. Environ. Microbiol. 15, 2114–2128. doi: 10.1111/1462-2920.12079
Larned, S. T., Nikora, V. I., and Biggs, B. J. F. (2004). Mass-transfer-limited nitrogen and phosphorus uptake by stream periphyton: a conceptual model and experimental evidence. Limnol. Oceanogr. 49, 1992–2000. doi: 10.4319/lo.2004.49.6.1992
Larondelle, N., and Haase, D. (2012). Valuing post-mining landscapes using an ecosystem services approach—an example from Germany. Ecol. Indic. 18, 567–574. doi: 10.1016/j.ecolind.2012.01.008
Laws, E. A., Pei, S., Bienfang, P., Grant, S., and Sunda, W. G. (2011). Phosphate-limited growth of Pavlova Lutheri (Prymnesiophyceae) in continuous culture: determination of growth rate limiting substrate concentrations with a sensitive bioassay procedure. J. Phycol. 47, 1089–1097.
Liess, A., Drakare, S., and Kahlert, M. (2009). Atmospheric nitrogen-deposition may intensify phosphorus limitation of shallow epilithic periphyton in unproductive lakes. Freshw. Biol. 54, 1759–1773. doi: 10.1111/j.1365-2427.2009.02222.x
Lindemann, C., Fiksen, Ø, Andersen, K. H., and Aksnes, D. L. (2016). Scaling laws in phytoplankton nutrient uptake affinity. Front. Mar. Sci. 3:26. doi: 10.3389/fmars.2016.00026
Maberly, S. C., King, L., Dent, M. M., Jones, R. I., and Gibson, C. E. (2002). Nutrient limitation of phytoplankton and periphyton growth in upland lakes. Freshw. Biol. 47, 2136–2152. doi: 10.1046/j.1365-2427.2002.00962.x
Mackereth, F. J. H., Talling, J., and Heron, J. F. (1978). Water Analysis: Some Revised Methods for Limnologists, Freshwater Biological Association. Ambleside: Freshwater Biological Association.
Michelutti, N., Douglas, M. S. V., Lean, D. R. S., and Smol, J. P. (2002). Physical and chemical limnology of 34 ultra-oligotrophic lakes and ponds near Wynniatt Bay, Victoria Island, Arctic Canada. Hydrobiologia 482, 1–13. doi: 10.1023/A:1021201704844
Mieczan, T., and Tarkowska-Kukuryk, M. (2012). Effect of substrate on periphyton communities and relationships among food web components in shallow hypertrophic lake. J. Limnol. 71, 53–64. doi: 10.4081/jlimnol.2012.e30
Motulsky, H. J., and Brown, R. E. (2006). Detecting outliers when fitting data with nonlinear regression – a new method based on robust nonlinear regression and the false discovery rate. BMC Bioinformatics 7:123. doi: 10.1186/1471-2105-7-123
Murphy, J., and Riley, J. P. (1962). A modified single solution method for the determination of phosphate in natural waters. Anal. Chim. Acta 27, 31–36. doi: 10.1016/S0003-2670(00)88444-5
Porder, S., and Ramachandran, S. (2013). The phosphorus concentration of common rocks—a potential driver of ecosystem P status. Plant Soil 367, 41–55. doi: 10.1007/s11104-012-1490-2
Procházková, L. (1959). Bestimmung der nitrate im Wasser. Fresenius’ Z. Anal. Chem. 167, 254–260. doi: 10.1007/BF00458786
Riber, H. H., and Wetzel, R. G. (1987). Boundary-layer and internal diffusion effects on phosphorus fluxes in lake periphyton1. Limnol. Oceanogr. 32, 1181–1194. doi: 10.4319/lo.1987.32.6.1181
Rigler, F. (1966). Radiobiological analysis of inorganic phosphorus in lakewater. Int. Vereinigung Theor. Angew. Limnol. Verh. 16, 465–470. doi: 10.1080/03680770.1965.11895717
Sañudo-Wilhelmy, S. A., Tovar-Sanchez, A., Fu, F.-X., Capone, D. G., Carpenter, E. J., and Hutchins, D. A. (2004). The impact of surface-adsorbed phosphorus on phytoplankton Redfield stoichiometry. Nature 432, 897–901. doi: 10.1038/nature03125
Scanlan, D. J., Mann, N. H., and Carr, N. G. (1993). The response of the picoplanktonic marine cyanobacterium Synechococcus species WH7803 to phosphate starvation involves a protein homologous to the periplasmic phosphate-binding protein of Escherichia coli. Mol. Microbiol. 10, 181–191. doi: 10.1111/j.1365-2958.1993.tb00914.x
Schultze, M., Pokrandt, K. H., and Hille, W. (2010). Pit lakes of the Central German lignite mining district: creation, morphometry and water quality aspects. Limnologica 40, 148–155. doi: 10.1016/j.limno.2009.11.006
Scinto, L. J., and Reddy, K. R. (2003). Biotic and abiotic uptake of phosphorus by periphyton in a subtropical freshwater wetland. Aquat. Bot. 77, 203–222. doi: 10.1016/S0304-3770(03)00106-2
Tambi, H., Flaten, G. A., Egge, J., Bødtker, G., Jacobsen, A., and Thingstad, T. F. (2009). Relationship between phosphate affinities and cell size and shape in various bacteria and phytoplankton. Aquat. Microb. Ecol. 57, 311–320. doi: 10.3354/ame01369
Tanaka, T., Henriksen, P., Lignell, R., Olli, K., Seppälä, J., Tamminen, T., et al. (2006). Specific affinity for phosphate uptake and specific alkaline phosphatase activity as diagnostic tools for detecting phosphorus-limited phytoplankton and bacteria. Estuaries Coasts 29, 1226–1241. doi: 10.1007/BF02781823
Taylor, W. D., and Lean, D. R. S. (1991). Phosphorus pool sizes and fluxes in the epilinnnion of a mesotrophic Lake. Can. J. Fish. Aquat. Sci. 48, 1293–1301. doi: 10.1139/f91-155
Thingstad, T. F., and Rassoulzadegan, F. (1999). Conceptual models for the biogeochemical role of the photic zone microbial food web, with particular reference to the Mediterranean Sea. Prog. Oceanogr. 44, 271–286. doi: 10.1016/S0079-6611(99)00029-4
Tovar-Sanchez, A., Sañudo-Wilhelmy, S. A., Garcia-Vargas, M., Weaver, R. S., Popels, L. C., and Hutchins, D. A. (2003). A trace metal clean reagent to remove surface-bound iron from marine phytoplankton. Mar. Chem. 82, 91–99. doi: 10.1016/S0304-4203(03)00054-9
Vadeboncoeur, Y., and Steinman, A. D. (2002). Periphyton function in lake ecosystems. Sci. World J. 2, 1449–1468. doi: 10.1100/tsw.2002.294
Vymazal, J., and Richardson, C. J. (1995). Species composition, biomass, and nutrient content of periphyton in the Florida Everglades. J. Phycol. 31, 343–354. doi: 10.1111/j.0022-3646.1995.00343.x
Wolfe, J. E., and Lind, O. T. (2010). Phosphorus uptake and turnover by periphyton in the presence of suspended clays. Limnology 11, 31–37. doi: 10.1007/s10201-009-0287-3
Wyatt, K. H., Seballos, R. C., Shoemaker, M. N., Brown, S. P., Chandra, S., Kuehn, K. A., et al. (2019). Resource constraints highlight complex microbial interactions during lake biofilm development. J. Ecol. 107, 2737–2746. doi: 10.1111/1365-2745.13223
Yacobi, Y. Z., and Zohary, T. (2010). Carbon:chlorophyll a ratio, assimilation numbers and turnover times of Lake Kinneret phytoplankton. Hydrobiologia 639, 185–196. doi: 10.1007/s10750-009-0023-3
Keywords: epilithon, phosphorus uptake, specific P affinity, oligotrophic lakes, periphyton, hydric recultivation
Citation: Konopáčová E, Nedoma J, Čapková K, Čapek P, Znachor P, Pouzar M, Říha M and Řeháková K (2021) Low Specific Phosphorus Uptake Affinity of Epilithon in Three Oligo- to Mesotrophic Post-mining Lakes. Front. Microbiol. 12:735498. doi: 10.3389/fmicb.2021.735498
Received: 02 July 2021; Accepted: 10 September 2021;
Published: 06 October 2021.
Edited by:
Debora Iglesias-Rodriguez, University of California, Santa Barbara, United StatesReviewed by:
Edward Allen Laws, Louisiana State University, United StatesJohn Albert Raven, University of Dundee, United Kingdom
Copyright © 2021 Konopáčová, Nedoma, Čapková, Čapek, Znachor, Pouzar, Říha and Řeháková. This is an open-access article distributed under the terms of the Creative Commons Attribution License (CC BY). The use, distribution or reproduction in other forums is permitted, provided the original author(s) and the copyright owner(s) are credited and that the original publication in this journal is cited, in accordance with accepted academic practice. No use, distribution or reproduction is permitted which does not comply with these terms.
*Correspondence: Eliška Konopáčová, ZWxpc2thLmtvbm9wYWNvdmFAaGJ1LmNhcy5jeg==