 Stefan Karlowsky
 Caroline Buchen-Tschiskale
 Luca Odasso1
 Dietmar Schwarz
- 1Leibniz Institute of Vegetable and Ornamental Crops (IGZ) e.V., Großbeeren, Germany
- 2Thünen Institute of Climate-Smart Agriculture, Federal Research Institute for Rural Areas, Forestry and Fisheries, Braunschweig, Germany
- 3Operation Mercy, Amman, Jordan
Introduction: Hydroponic vegetable cultivation is characterized by high intensity and frequent nitrogen fertilizer application, which is related to greenhouse gas emissions, especially in the form of nitrous oxide (N2O). So far, there is little knowledge about the sources of N2O emissions from hydroponic systems, with the few studies indicating that denitrification could play a major role.
Methods: Here, we use evidence from an experiment with tomato plants (Solanum lycopersicum) grown in a hydroponic greenhouse setup to further shed light into the process of N2O production based on the N2O isotopocule method and the 15N tracing approach. Gas samples from the headspace of rock wool substrate were collected prior to and after 15N labeling at two occasions using the closed chamber method and analyzed by gas chromatography and stable isotope ratio mass spectrometry.
Results: The isotopocule analyses revealed that either heterotrophic bacterial denitrification (bD) or nitrifier denitrification (nD) was the major source of N2O emissions, when a typical nutrient solution with a low ammonium concentration (1–6 mg L−1) was applied. Furthermore, the isotopic shift in 15N site preference and in δ18O values indicated that approximately 80–90% of the N2O produced were already reduced to N2 by denitrifiers inside the rock wool substrate. Despite higher concentrations of ammonium present during the 15N labeling (30–60 mg L−1), results from the 15N tracing approach showed that N2O mainly originated from bD. Both, 15N label supplied in the form of ammonium and 15N label supplied in the form of nitrate, increased the 15N enrichment of N2O. This pointed to the contribution of other processes than bD. Nitrification activity was indicated by the conversion of small amounts of 15N-labeled ammonium into nitrate.
Discussion/Conclusion: Comparing the results from N2O isotopocule analyses and the 15N tracing approach, likely a combination of bD, nD, and coupled nitrification and denitrification (cND) was responsible for the vast part of N2O emissions observed in this study. Overall, our findings help to better understand the processes underlying N2O and N2 emissions from hydroponic tomato cultivation, and thereby facilitate the development of targeted N2O mitigation measures.
1. Introduction
Based on a variety of technical innovations in greenhouse vegetable production, the use of soilless culture systems (commonly referred to as “hydroponics”) has grown in importance during the last 30–40 years (Gruda, 2009; Savvas et al., 2013; Savvas and Gruda, 2018). Controlled environment systems are considered by some as key part of future food production (Lakhiar et al., 2018; Cowan et al., 2022). This is largely due to the possibility of operating hydroponic systems in greenhouses in regions with unfavorable climatic conditions and in urban areas (Sharma et al., 2018; Small et al., 2019). Closed hydroponic systems also allow the re-utilization of drained nutrient solution from the root zone by recirculating the collected drain after mixing with stock solution. The high water and nutrient efficiency of closed hydroponic systems as well as the reduction of soil-borne diseases are considered as major advantages compared to soil-based cultivation (Gruda, 2009; Savvas and Gruda, 2018). Besides, the high water and nutrient efficiency makes hydroponic systems also interesting for the production of supplemental fresh food during space missions (Wheeler, 2017). Nonetheless, there are still losses occurring in the form of gaseous nitrogen (N) emissions, which may sum up to more than 10% of the N applied in the nutrient solution (Daum and Schenk, 1996a). Due to the high N application rate and dosage frequency in hydroponics, there is also a high potential for gaseous N emissions, in particular nitrous oxide (N2O) from microbial processes such as nitrification (Ni) and heterotrophic bacterial denitrification (bD; Daum and Schenk, 1996b; Lin et al., 2022). If bD is complete, N losses in the form of molecular nitrogen (N2) due to N2O reduction might also occur. So far, only a few studies investigated volatile N losses from hydroponic systems. Some of these studies found N2O emission factors higher than the IPCC estimate of 1% N2O-N for applied N fertilizer in soil cultivation (Daum and Schenk, 1996a; Hashida et al., 2014; Yoshihara et al., 2016), while others found lower N2O emission factors (Llorach-Massana et al., 2017; Halbert-Howard et al., 2021; Karlowsky et al., 2021).
The specialty of hydroponic systems is that inert substrates such as sand, perlite, or rock wool can be used, which limits the availability of organic carbon for heterotrophic denitrifiers. In this case, the hydroponic growing medium consists only of the substrate matrix and the supplied nutrient solution, which is mostly composed of mineral fertilizers dissolved in water. Nevertheless, bD has been considered as the main source of gaseous N emissions from hydroponic systems with inert substrates (Daum and Schenk, 1996a, 1996b, 1998). Whereas a more recent study by Lin et al. (2022) with tomato plants cultivated on peat and coir substrates found also significant shares of N2O produced by Ni, which depended on the substrate used. In hydroponic systems with inert growing media, various factors may favor bD over Ni activity, i.e., (i) frequent irrigation pulses, (ii) slightly acidic pH values (pH 5–6.5) in the nutrient solution, (iii) often high nitrate (NO3−) to ammonium (NH4+) ratios, and (iv) the presence of root exudates and debris. Yet, there is little knowledge on the processes underlying gaseous N emissions from hydroponic systems. In particular, it is unclear to which extend other processes such as fungal denitrification (fD), nitrifier denitrification (nD), or coupled nitrification and denitrification (cND) play a role in hydroponic systems. A study of functional microbial genes by Hashida et al. (2014) found 3–5 times higher gene copy numbers for denitrifiers than for nitrifiers, but the abundance of functional Ni and bD genes had no clear relationship with measured N2O emissions. N2 emissions from bD, which are more difficult to analyze due to the high atmospheric concentration of N2, have only been researched by Daum and Schenk (1996a, 1996b, 1997, 1998) in hydroponic systems, using the acetylene inhibition method. However, today, it is known that this method is not suitable to quantify N2 production, mainly due to catalytic decomposition of NO in presence of O2 (Felber et al., 2012; Nadeem et al., 2013), which cannot be excluded in the setup used in the Daum and Schenk studies (ibid.).
Alternative methods for detecting N2 emissions include (i) the use of closed chambers filled with other inert gases such as helium and the analysis of N2 in gas samples on a gas chromatograph (helium incubation method) (Scholefield et al., 1997), (ii) the labeling with 15N supplied by the fertilizer and the measurement of 15N contents in N2O and N2 (15N tracing approach) (e.g., Stevens and Laughlin, 1998; Buchen et al., 2016), and (iii) the analysis of the isotopic composition (δ18O, δ15Nbulk value and the intramolecular distribution of 15N in N2O) of the four most abundant N2O isotopocules, which are indicative for N2O production pathways, but also altered during the N2O reduction process (N2O isotopocule method) (e.g., Decock and Six, 2013; Lewicka-Szczebak et al., 2017). Unfortunately, the helium incubation method to directly measure N2 emissions requires a high technical effort and is very prone to leakage and is therefore mainly used for the analysis of soil cores in the laboratory (Groffman et al., 2006). Both, the N2O isotopocule method and the 15N tracing approach, require little technical effort in the field or greenhouse, can be combined with the usual chamber-based gas flux measurements for detecting N2O emission rates, and are suitable to assess the microbial processes that drive the N2O emission (Lewicka-Szczebak et al., 2020). The N2 isotopocule method works well with natural abundance stable isotope ratios and only requires the capacity for stable isotope analyses. However, due to the multitude of possible N2O processes (Butterbach-Bahl et al., 2013) and the variability found in isotope contents and fractionation factors, uncertainties of its results have to be taken into account (Wu et al., 2019). The 15N tracing approach allows to quantify the conversion of 15N-enriched substrates such as NO3− or NH4+ to different products, including N2O and N2 (15N mass balance). Though to obtain sufficient 15N enrichment of N2 for detection of N2 production, high amounts of expensive 15N tracer have to be applied, limiting the use of the 15N tracing approach for detecting N2 fluxes by the experimental budget. Moreover, under ambient atmosphere, its sensitivity is quite low (Zaman et al., 2021).
In this study, we used a combination of the N2O isotopocule method and the 15N tracing approach to further shed light into the processes underlying gaseous N emissions from hydroponic systems. Analyzing the N2O isotopocules and using the dual isotope plot (“isotopocule mapping approach”) is the most common interpretation strategy to estimate the fractions of N2O produced by bD and/or nD, fD, and Ni (e.g., Lewicka-Szczebak et al., 2017). The results from N2O isotopocule analysis were also recently found to be in good accordance with the analysis of functional nitrifier and denitrifier genes (Lin et al., 2022). In contrast to the isotopocule method, the 15N tracing approach allows to estimate the fraction of N2O derived from bD, without overlapping nD (e.g., Deppe et al., 2017). Hence, by combining the N2O isotopocule method and the 15N tracing approach, it is possible to assess potential contributions of not well-studied microbial processes such as nD or cND in N2O formation. Furthermore, we used two types of 15N label, i.e., 15NH4+ and 15NO3−, to determine the contribution of each N form in the emitted N2O and to gain additional insights into N transformation processes. In our study, we focused on rock wool hydroponics and used tomato plants as a model, as the use of rock wool substrate is widespread in modern production greenhouses (Dannehl et al., 2015; Savvas and Gruda, 2018) and tomato is the most important vegetable crop worldwide (Schwarz et al., 2014). We conducted two sampling campaigns: (i) at the beginning of flowering and (ii) during fruit ripening, at which we expected different N2O emission rates. In previous studies with rock wool substrate, higher N2O emissions were found during tomato fruit ripening compared to earlier plant stages (Hashida et al., 2014; Karlowsky et al., 2021), and were attributed to shifts in plant physiology.
Overall, our aim was to better understand which microbial processes contribute to N2O emission from hydroponic systems to enable tailored mitigation measures. We hypothesized that bD is the main source of N2O emissions from hydroponic tomato cultivation on rock wool, and that NO3− is contributing to a higher share to N2O emissions than NH4+. Furthermore, we assumed that most of the applied 15N tracer can be recovered in the labeled nutrient solution, plant biomass, and gaseous N emissions in a hydroponic system with inert rock wool substrate.
2. Materials and methods
2.1. Experimental setup and hydroponic tomato cultivation
The experiment took place in an experimental glasshouse consisting of multiple heated cabins, each with a size of 64 m2 and a roof top height of 4 m. Two of these cabins were used for this study, cabin no. 7 for pre-cultivating tomato plants (Solanum lycopersicum cv. ‘Cheramy F1’) and cabin no. 5 for conducting the experiment. Temperature in the cabins was set to 20/18°C (day/night), and roof top ventilation was opened at temperatures above 23/20°C (day/night). Shading was done automatically at photosynthetically active radiation (PAR) values above 900 μmol m−2 s−1 and artificial lighting was applied between 5:00 and 12:00 CET, if PAR values were below 180 μmol m−2 s−1. Air temperature and humidity in the cabins as well as roof top PAR were continuously monitored by a climate computer (Supplementary Figure S1). Tomato plants were sown on 26th July 2021 and after germination in moistened sand, 64 seedlings were transplanted into pre-weighed rock wool cubes (10 × 10 × 6.5 cm; Grodan B.V., Roermond, Netherlands) for further cultivation. On 2nd September each two planted rock wool cubes were put on one rock wool slab (100 × 20 × 7.5 cm; Grodan Vital, Grodan B.V., Roermond, Netherlands) at a distance of 50 cm. One-half of the planted rock wool slabs were installed in eight hydroponic units with elevated gutters in cabin no. 5, which included separate fertigation systems and were later used for the 15N labeling. The other half was further cultivated in cabin no. 7 in four gutters on the ground, which shared one fertigation system. In both cases, the collected drain solution (i.e., leachate) was re-used and mixed with fresh nutrient solution in storage tanks as needed (closed hydroponic system with re-circulating nutrient solution). The nutrient solution from the storage tanks was supplied to plants via pumps, PE tubes, and drippers inserted into the rock wool cubes. The tomato plants were supplied with a custom-made nutrient solution modified after the recipe of de Kreij et al. (2003), which had a high NO3− to NH4+ ratio (~20:1) that was found optimal for tomato cultivation. Macro and micro nutrients were dissolved in de-ionized water targeting a pH of 5.6 and an electrical conductivity (EC) of 2 mS cm−1. The pH and EC values in the storage tanks were regularly monitored (Supplementary Figure S2). Tomato seedlings were supplied with an N concentration of 361 mg L−1 at the beginning (starter solution; 338 mg L−1 NO3−-N and 23 mg L−1 NH4+-N). After the development of the 5th truss and the first green fruits on, from 4th October, the N concentration in the nutrient solution was reduced to 165 mg L−1 (refill solution; 151 mg L−1 NO3−-N and 14 mg L−1 NH4+-N). The composition of the different nutrient solutions used in this study can be found in Supplementary Table S1. Each hydroponic unit in cabin no. 5 consisted of a 4 m gutter in which three rock wool slabs, two with plants and one unplanted, were placed and a nutrient solution storage tank filled up to approximately 40 L (Supplementary Figure S3). Two sampling periods were selected according to expected differences in plant N uptake and associated assimilate distribution in the root-shoot system, representing high growth and N uptake rates during early development and a more balanced assimilate distribution during fruit ripening. The first sampling and 15N labeling campaign were performed on 22nd and 23rd September, when the tomato plants developed the 3rd truss and first flowers. Subsequently, the 16 planted rock wool slabs (32 plants) in cabin no. 5 were completely removed (destructive sampling, described below) and replaced by the other 16 planted rock wool slabs pre-cultivated in cabin no. 7 on 24th September. The eight unplanted rock wool slabs were also exchanged with fresh rock wool slabs. To avoid carryover of 15N label, the hydroponic gutters were covered with plastic film below the rock wool slabs until 23rd September to reduce contact with the 15N-enriched nutrient solution. Both, the gutters and pumps for nutrient solution, were thoroughly cleaned with a detergent/disinfectant (MENNO Florades®, MENNO CHEMIE-VERTRIEB GMBH, Langer Kamp, Germany) before installing the unlabeled plants and rock wool slabs. Furthermore, the storage tanks and the tubing as well as the drippers for nutrient solution were completely replaced with new material. To ensure the supply of further growing plants with water and nutrients, larger storage tanks were used (Supplementary Figure S4) and filled up to approximately 200 l. The experiment ended with the second sampling and 15N labeling campaign on 3rd and 4th November, when the tomato plants developed the 8th truss and the first fruits were ripe.
2.2. Gas flux measurements
For measuring the gas fluxes, the closed chamber method as described by Karlowsky et al. (2021) was used. Acrylic glass chambers with two small openings for plant stems were fitted around the rock wool slabs (planted and unplanted) and sealed with foam rubber to obtain a closed headspace with a volume of approximately 16 l (Supplementary Figure S5). Over a period of 1 hour after closing, four gas samples (each 30 ml) were taken in 20 min intervals with a 30 ml syringe through a sampling port on top of the chamber. The gas samples were transferred to 20 ml glass vials with silicone/PTFE septa (type N17, MACHEREY-NAGEL GmbH & Co. KG, Düren, Germany) for transport and were analyzed on the same day by a gas chromatograph (GC 2010 Plus, Shimadzu Corporation, Kyoto, Japan) equipped with an electron capture detector (ECD) for N2O. The measured concentrations in μmol mol−1 were converted to μmol m−3 by applying the ideal gas law, including a correction for the temperature at the time of sampling. Afterward, gas fluxes were calculated using the R package “gasfluxes” [version 0.4–4; (Fuss et al., 2020)] by robust linear regression (except one case with only 3 time points, for which standard linear regression had to be used). Input variables used were gas concentration (μmol m−3), chamber volume (m3), time after closing the chamber (h), and area covered (m2). The latter was set to 1 m2 assuming a typical density of greenhouse-cultivated tomato plants of 2 plants m−2. The resulting gas fluxes in μmol m−2 h−1 were further converted to g ha−1 d−1 based on molar masses.
2.3. Sampling and 15N labeling
Natural abundance samples were taken on 22nd September and 3rd November shortly before the 15N labeling from each hydroponic unit in cabin no. 5 (from here on called “experimental unit”). These included plant samples, nutrient solution samples, and gas samples from planted rock wool slabs. For the latter, 140 ml of air was collected from the headspace of rock wool substrate with a syringe at the end of gas flux measurements after 1 h of N2O enrichment in the closed chambers. The gas samples were transferred into 120 ml crimp-cap glass vials closed with gray butyl septa (type ND20, IVA Analysentechnik GmbH & Co. KG, Meerbusch, Germany) for later stable isotope analysis. To determine natural abundance δ15N values of plants, the tips (first three leaflets) of 2–3 fully developed leaves from one plant in each experimental unit were sampled and dried at 80°C for at least 48 h. Approximately 15 ml of nutrient solution (mixture with leachates) was sampled from the storage tank of each experimental unit and then stored at −20°C for later δ15N analyses. In addition, three samples of de-ionized water were taken to determine the natural abundance δ18O values of the nutrient solution water.
On both dates, the 15N labeling took place directly after the natural abundance sampling at approximately 12:00 pm CET. The remaining nutrient solution in the experimental units was removed as far as possible and 15 l of 15N-labeled nutrient solution was added in the storage tanks of each unit. In a randomized way, four units received a nutrient solution with 15N-enriched NH4+ (15NH4+) and four units received a nutrient solution with 15N-enriched NO3− (15NO3−). This was done by adding ammonium nitrate (NH4NO3; SIGMA-ALDRICH, Saint Louis, MO, United States) with 10.5/11 atom-% 15N (15NH4+/15NO3−) as only N source. The composition of the nutrient solution used for the 15N labeling can also be found in Supplementary Table S1. In total, 115 mg of 15N was applied to each 15NH4+ unit and 120 mg of 15N to each 15NO3− unit (3.1 g NH4NO3 per unit), yielding an N concentration of 146 mg L−1 (comparable to the standard refill solution). To distribute the 15N label in the hydroponic system, drip fertigation was run continuously for 30 min after adding the 15N labeled nutrient solution to the experimental units. After 4 h, a first sampling to determine the 15N enrichment in plant, nutrient solution and gas samples took place. The sampling was done analogously to the natural abundance sampling, including the determination of gas flux rates and the collection of gas samples for isotopic analyses as well as leaf and nutrient solution samples. Following the same scheme, the last sampling took place 24 h after the labeling. This time, also samples from the tomato stems, roots and fruits were taken. From the middle of the tomato plant ca., 10 cm of the stem was cut. Around 0.5 g of fresh roots was sampled from the interface of rock wool cubes and rock wool slabs, where a dense root net allowed to obtain root material without rock wool fibers. Root samples were washed in de-ionized water and dried with lint-free cellulose wipes to remove the 15N label from adhering nutrient solution. During the second sampling campaign, each three green fruits from different positions (top, mid, and bottom) of one plant per experimental unit were sampled. All plant samples were dried for a minimum of 48 h at 80°C before later processing for analysis. Different plants were used for obtaining plant material before labeling, 4 h after labeling, and 24 h after labeling in order to minimize sampling effects on 15N uptake. Gas samplings for stable isotope analysis always took place on the rock wool slab in the middle of each experimental unit, from which plant samples were taken only after the last gas sampling (24 h after labeling). On the unplanted rock wool slabs, additional gas flux measurements took place shortly before the 24 h sampling to determine the N2O emission potential from re-circulated nutrient solution with leachate and therein contained organic carbon.
2.4. Analyses on nutrient solution, plant, and gas samples
The concentrations of NO3− and NH4+ [mg N L−1] were determined using flow injection analysis with photometric detection (FIAmodula; MLE GmbH, Dresden, Germany). Measurements of δ18O values in water samples were done by TC/EA coupled to a Delta V plus IRMS (Thermo Finnigan, Bremen, Germany) via a ConFlo IV interface. The δ15N values of NH4+ and NO3− were determined according to Dyckmans et al. (2021) using a sample preparation unit for inorganic nitrogen (SPIN) coupled to a membrane inlet isotope ratio mass spectrometer (MIRMS; Delta plus; Thermo Finnigan) via a ConFlo III interface. Additional nutrient solution samples taken one day after the labeling were analyzed for their dissolved organic carbon content (DOC) using a liquiTOC analyzer (Elementar Analysensysteme GmbH, Langenselbold, Germany). Dried plant samples were transferred into 20 ml HDPE vials (Zinsser Analytic GmbH, Eschborn, Germany) and ground to a fine powder using a steel ball mill (MM400; RETSCH GmbH, Haan, Germany). Plant samples were analyzed for total N content (Nt) and their δ15N values using an Elemental Analyzer (EA) Flash 2000 (Thermo Fisher Scientific, Bremen, Germany), coupled with a Delta V isotope ratio mass spectrometer via a ConFlo IV interface (Thermo Fisher Scientific, Bremen, Germany). Data were normalized to the international scale for atmospheric nitrogen, by analysis of the international standards USGS40 and USGS41 (L-glutamic acid). Gas samples were analyzed for N2O isotopocules (δ15NN2O, δ18ON2O) using a Delta V Isotope ratio mass spectrometer (Thermo Scientific, Bremen, Germany), coupled to an automatic preparation system with Precon plus Trace GC Isolink (Thermo Scientific, Bremen, Germany). In this setup, N2O was pre-concentrated, separated, and purified, and afterward m/z 44, 45, and 46 of the intact N2O+ ions as well as m/z 30 and 31 of NO+ fragment ions were determined (Lewicka-Szczebak et al., 2014). All measured delta values (δ) were expressed in permil (‰) deviation from the 15N/14N and 18O/16O ratios of the international reference standards (i.e., atmospheric N2 and Vienna Standard Mean Ocean Water (VSMOW), respectively).
2.5. Data processing and calculations
Data from the analysis of natural abundance gas samples were evaluated for δ15Nα (δ15N of the central N position of the N2O molecule), δ15Nβ (δ15N of the peripheral N position of the N2O), and δ18O according to Toyoda and Yoshida (1999) and Röckmann et al. (2003). The 15N site preference (δ15NSP) was defined as the difference of δ15Nα and δ15Nβ. The δ18O values of N2O depend on δ18O values of precursors, i.e., for denitrification to >80% on H2O-O of the nutrient solution (Lewicka-Szczebak et al., 2016). Therefore, δ18O values of the emitted N2O (δ18ON2O) were corrected for the δ18O values measured in the de-ionized water (δ18OH2O) and expressed as δ18ON2O/H2O values:
In the case of nitrification, the δ18ON2O values depend on atmospheric oxygen (O2) as a precursor (Kool et al., 2007). In contrast to bulk δ15NN2O, δ15NSP is known to be independent from source processes. During chamber air sampling, the collected N2O was a mixture of atmospheric and substrate-emitted N2O. Thus, δ values of substrate-emitted N2O were corrected using a basic isotope mixing model according to Well et al. (2006). To calculate the contribution of N2O production pathways and N2O reduction to N2, the isotopocule mapping approach based on δ15NSPN2O and δ18ON2O values was applied (Lewicka-Szczebak et al., 2017; Buchen et al., 2018). For the mapping approach, literature values for δ18O and δ15NSPN2O of bD, fD, nD, and Ni were used as proposed by Yu et al. (2020) and Lewicka-Szczebak et al. (2020). To account for differences in oxygen precursors between denitrification and Ni, the literature values for δ18ON2O of bD, fD, and nD were adjusted by the addition of δ18OH2O (Lewicka-Szczebak et al., 2020). Based on the sample position in the map, the contribution of bD and/or nD, Ni, and fD was calculated based on mixing equations, while the contribution of N2O reduction to N2 was calculated from the Rayleigh equation. All calculations were done as described in detail by Buchen et al. (2018) and Zaman et al. (2021) (Chapter 7: “Isotopic Techniques to Measure N2O, N2 and Their Sources). Two possible cases of N2O mixing and reduction were assumed: (i) N2O, which is produced by bD is first partially reduced to N2, followed by mixing of the residual N2O with N2O from other pathways or (ii) N2O produced by various pathways is first mixed and then reduced to N2. A detailed description is given in the supplement of Wu et al. (2019). Five samples from sampling 1 and four samples from sampling 2 with a low fraction of substrate-derived N2O were excluded from the data analyses because the uncertainty in substrate-derived δ values increases exponentially as sample and atmospheric N2O concentrations converge. Similar to Buchen et al. (2018), a threshold was used for the minimum difference between sample and atmospheric N2O concentrations, which was determined based on measured N2O concentrations in ambient air during the sampling. For sampling 1, the threshold was 337 ppb and for sampling 2, it was 359 ppb (65 ppb above the ambient air N2O concentration). This was supported by a Gaussian error propagation, with the threshold limiting the propagated errors of δ15NSPN2O and δ18ON2O to <6‰ and < 5‰, respectively.
Data from the analysis of 15N-enriched gas samples were only evaluated for bulk δ15NN2O. For further calculations, δ15N values were converted to atom-%15N to express the 15N enrichment:
with RSTD being the isotopic ratio (15N/14N = 0.0036765) of atmospheric nitrogen. Calculations of the contributions of N2O originating from the labeled and non-labeled pools were based on the non-equilibrium distribution of N2O isotopocules, as described by Spott et al. (2006) and Bergsma et al. (2001). For labeling with 15NO3−, this approach directly determines the 15N enrichment of the labeled N pool producing N2O (apN2O) and the fraction of N2O derived from that pool. Considering, the fraction of atmospheric N2O in the samples, the fraction of NO3−-derived N2O in the emitted N2O (fPN2O) can be calculated. A detailed procedure is given in Deppe et al. (2017). However, due to the experimental setup, labeled N2O could originate from two pools (NO3−, NH4+, or a mixture of both pools). Thus, for labeling with 15NH4+, fPN2O was estimated based on the 15N atom fraction of emitted N2O (15aN2O) using a mixing equation:
with 15aNO3− being the 15N enrichment of the NO3− pool and 15aNH4+ being the 15N enrichment of the NH4+ pool (cf. Eq. 2). The N2O flux from the NO3− pool (NO3−-derived N2O) was calculated from fPN2O by ordinary linear regression using the measured N2O concentrations at t0 and after 1 h of chamber closure to determine the total N2O flux (total N2O), assuming that the increase in the N2O emitted from the 15N-labeled pool was also linear as shown for the emission of total N2O (Buchen et al., 2016). The N2O flux from the NH4+ pool (NH4+-derived N2O) was calculated analogously based on the fraction of NH4+-derived N2O in the emitted N2O (fNH4), which was deduced from fPN2O (fNH4 = 1 – fPN2O). Thus, the NH4+-derived N2O was calculated as the difference between total N2O and NO3−-derived N2O.
2.6. Calculation of excess 15N and 15N mass balance
To determine the amount of 15N tracer, which was recovered in the different pools 4 and 24 h after the labeling (excess 15N), atom-%15N values were used to calculate atom-% 15N excess (APE):
with atom-%15N,labeled being the atom-%15N values of labeled samples and atom-%15N,natural abundance being the atom-%15N values of natural abundance samples. Afterward, excess 15N [mg 15N unit−1] for each pool was calculated:
with Npool being the N amount in each pool [mg N unit−1] at the time of sampling (4/24 h after labeling). The Npool values for plant biomass were calculated by multiplying the measured dry weight [g] of shoots (leaves + stems), roots and fruits per unit with their Nt content [g N gdry weight−1]. The Npool values for NO3−-N and NH4+-N from the nutrient solution were calculated by multiplying the measured N concentrations [mg N L−1] with the total volume of nutrient solution per unit [L]. The latter was a mixture of nutrient solution added for the labeling and remaining (unlabeled) nutrient solution in the rock wool substrate. The total volume of the nutrient solution was estimated based on the dilution of NH4+-N concentrations from the labeled nutrient solution (73 mg N L−1 in 15 l) at the 4 h sampling point, assuming that NH4+-N concentrations in the unlabeled nutrient solutions were negligible (measured concentrations in natural abundance samples <2.5 mg N L−1 at first sampling campaign and <7 mg N L−1 at second sampling campaign) and that the Nt content as well as composition in the mixed nutrient solution did not substantially change during the 4 h. For the calculation of excess 15N, two neighboring units were excluded from the second sampling campaign, because of a spillover of labeled nutrient solution between these units. The Npool values for N2O were calculated from the measured gas flux rates [mg N h−1] of planted and unplanted rock wool slabs. For the planted rock wool slabs, cumulative N2O emissions [mg N] were calculated by linear integration between the natural abundance (0 h), 4 h, and 24 h samplings, and summation of hourly gas fluxes. For unplanted rock wool slabs, constant N2O emission rates were assumed and used to calculate cumulative N2O emissions, as they were not affected by plant activity. For calculating the Npool value per unit, cumulative N2O emissions from planted rock wool slabs were multiplied by 2 (two planted slabs per unit) and the cumulative N2O emissions from unplanted slabs (one per unit) were added. Finally, the excess 15N values from the different pools were summed up to obtain the total amount of 15N recovered from the labeling (15Ntotal) and the 15N recovery rate [%] was calculated:
with 15Nlabel being the amount of 15N tracer [mg 15N unit−1] added during the labeling.
2.7. Statistical analyses
All statistical analyses were done using the R software (version 4.2.0). Linear mixed-effects models were done using the R package ‘lme4’ (version 1.1–29), including the effects of individual hydroponic units as random intercept. Post-hoc tests on linear mixed-effects models were done using the R package “emmeans” (version 1.7.4–1), applying the Holm-Bonferroni correction method for multiple comparisons. If necessary, data were log- or square root-transformed prior to analysis to fulfill the requirements of normality and variance homogeneity.
3. Results
3.1. N2O flux, isotopocule, and 15N tracer analyses
The N2O flux measurements from this study are summarized in Table 1. In general, all fluxes were in the same range, except for the measurement 24 h after labeling during the first sampling, which was significantly (p < 0.05) higher than the other measurements. There was no significant difference between planted and unplanted rock wool slabs from the same sampling campaign. The trend to higher N2O emissions from unplanted substrate during sampling 2 was reflected by higher DOC contents in the nutrient solution compared to sampling 1 (Table 1).
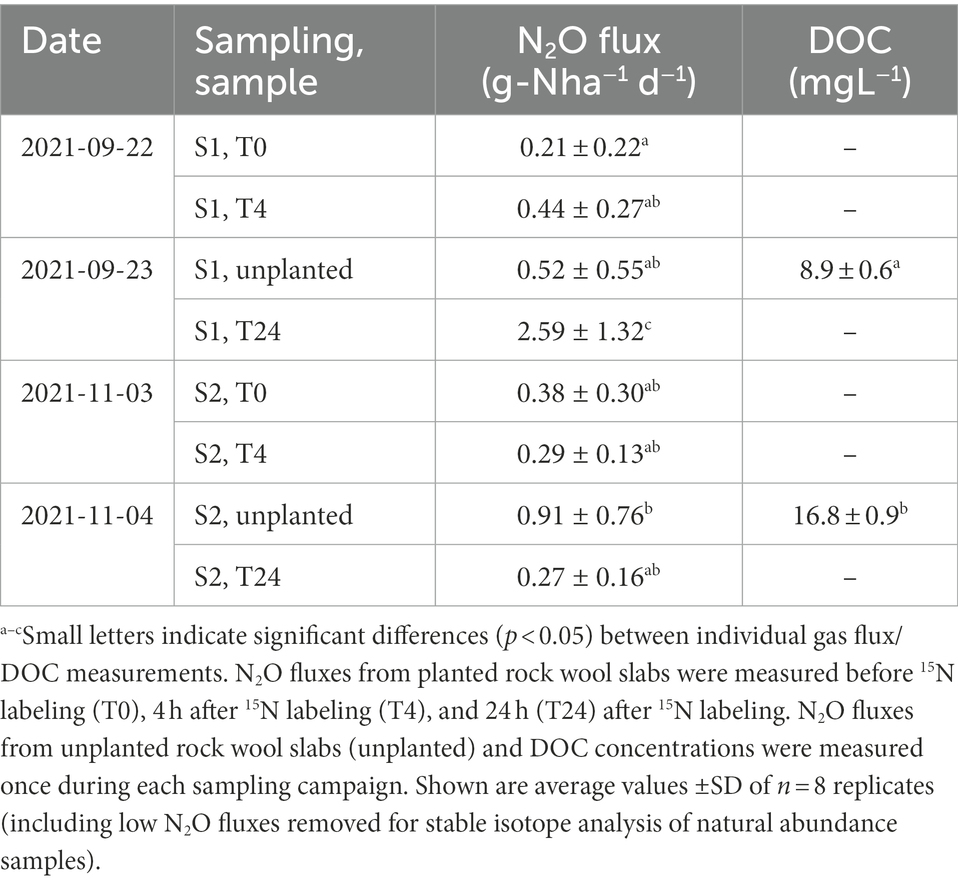
Table 1. N2O fluxes (determined by gas chromatography) and dissolved organic carbon (DOC) concentrations at the two sampling campaigns (sampling 1, S1; sampling 2, S2).
Results from isotopic analyses of N2O are shown in Figure 1 as a δ15NSPN2O/δ18ON2O map. The δ values from both samplings clearly scatter around the reduction line of N2O derived from bD, indicating that either bD or nD or a mixture of both was the main source of N2O. Moreover, the increased δ15NSPN2O and δ18ON2O values compared to the literature value for bD indicate that a high share of N2O was reduced before emitted to the atmosphere. Altogether, the differences in isotopic results between the first and the second sampling campaign were negligible (Table 2). Depending on which scenario (mixing of bD and fD or bD and Ni) and case (first reduction than mixing or first mixing than reduction) was assumed, the fraction of bD varied between 0.85 and 0.90, while the N2O/(N2O + N2) ratio of bD (rN2O) varied between 0.08 and 0.14. In consequence, the calculated N2 fluxes were between six to ten times higher than the measured N2O fluxes.
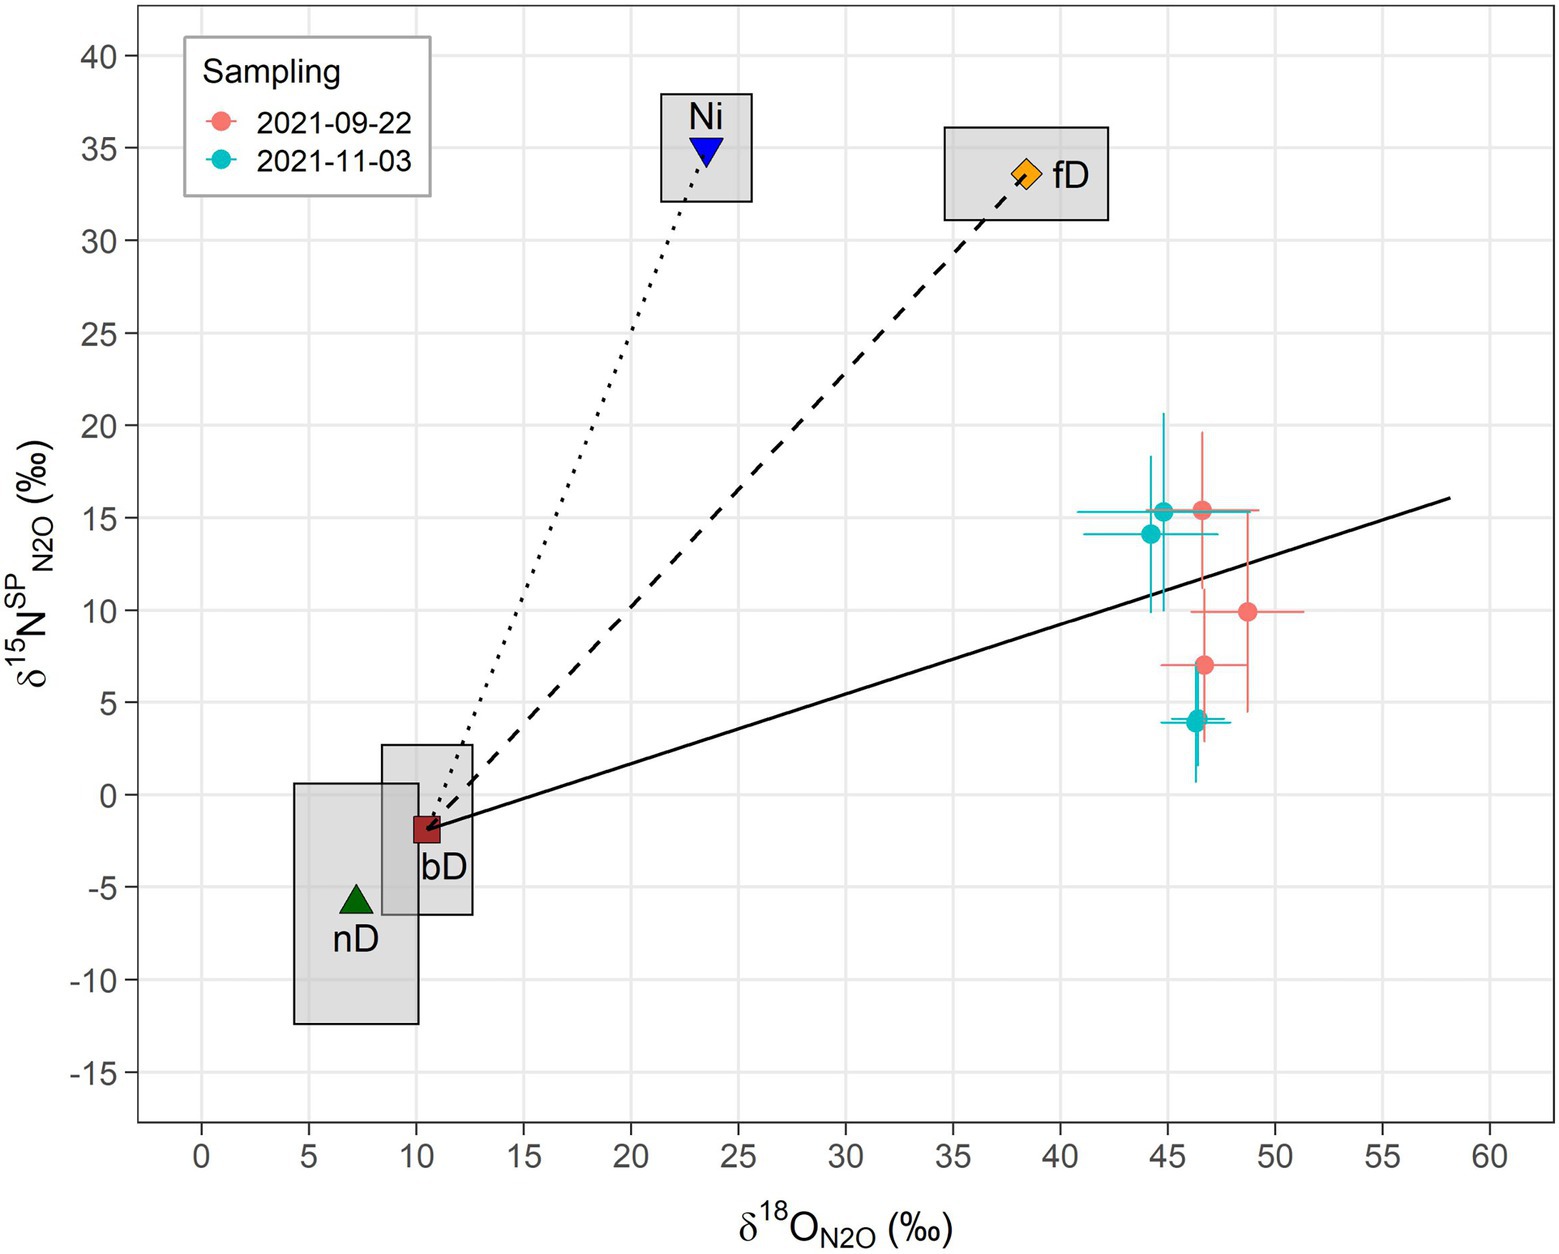
Figure 1. Results from N2O isotopocule analysis of natural abundance 15N gas samples illustrated as δ15NSPN2O/δ18ON2O map. The vertical axis shows the 15N site preference of N2O (δ15NSPN2O) and the horizontal axis the abundance of the 18O isotope in the N2O molecules (δ18ON2O). Sample δ18ON2O values were corrected for the 18O composition of water from the nutrient solution (δ18ON2O/H2O) as described in Eq. 1. Closed circles represent the measurement-derived values and the corresponding error bars the estimated uncertainty. Other symbols indicate literature values as compiled in Lewicka-Szczebak et al. (2020) for N2O produced from different microbial processes and the surrounding boxes reflect their variation (based on SD): Ni, nitrification (Yoshida, 1988; Sutka et al., 2006; Mandernack et al., 2009; Frame and Casciotti, 2010); fD, fungal denitrification (Sutka et al., 2008; Rohe et al., 2014; Maeda et al., 2015; Rohe et al., 2017); nD, nitrifier denitrification (Sutka et al., 2006; Frame and Casciotti, 2010); and bD, bacterial denitrification (Barford et al., 1999; Toyoda et al., 2005; Sutka et al., 2006; Lewicka-Szczebak et al., 2014, 2016; Rohe et al., 2017). According to Lewicka-Szczebak et al. (2020), the literature values of bD, fD and nD were adjusted by addition of the δ18O of water (−8.5‰) measured in this study to display expected endmember ranges. The solid line indicates the isotopic shift of N2O due to fractionation from the partial reduction of N2O to N2 by bD (Menyailo and Hungate, 2006; Ostrom et al., 2007; Jinuntuya-Nortman et al., 2008; Well and Flessa, 2009; Lewicka-Szczebak et al., 2014, 2015) and is shown for theoretical rN2O values of 1 to 0.05. The dotted and the dashed lines represent expected values for different mixing ratios of N2O from bD and fD (bD-fD line) and N2O from bD and Ni (bD-Ni line), respectively.
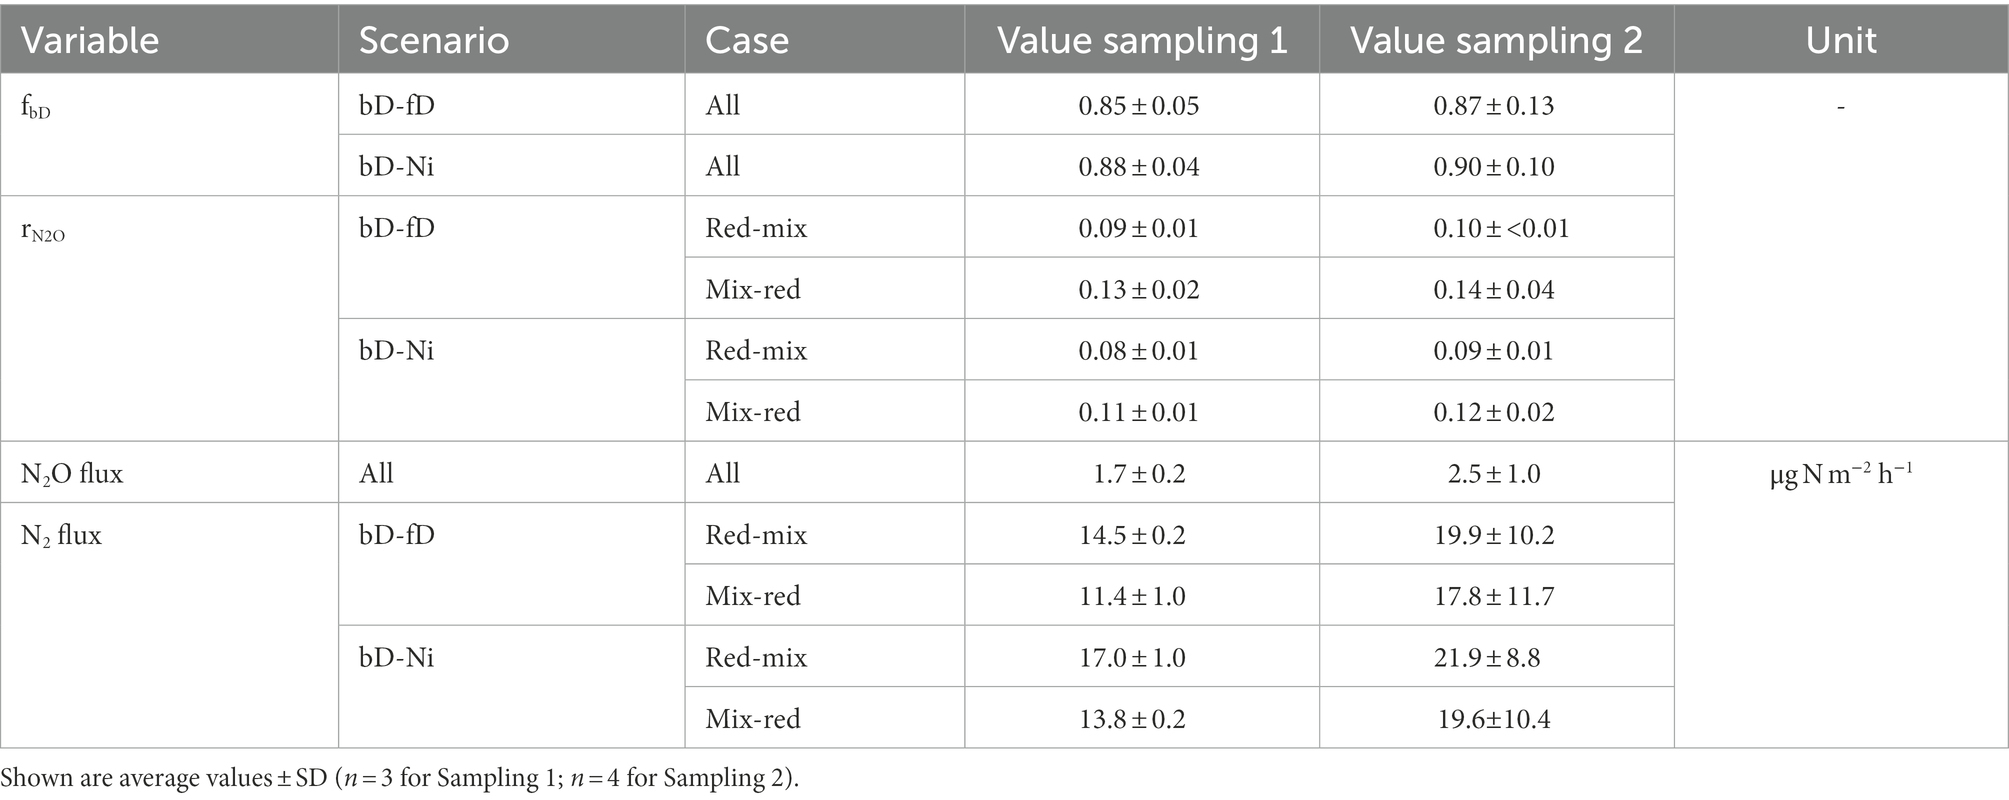
Table 2. Measured N2O flux, estimated fraction of N2O from bacterial denitrification (fbD), estimated N2O/(N2O + N2) ratio of denitrification (rN2O), and estimated N2 flux for different mixing scenarios (bacterial denitrification and fungal denitrification, bD-fD; bacterial denitrification and nitrification, bD-Ni) and cases (reduction of N2O from denitrification followed by mixing with N2O from other sources, red-mix; mixing of N2O from denitrification and other source followed by N2O reduction, mix-red).
Although the same amounts of NO3−-N and NH4+-N were added in the form of NH4NO3 during each 15N labeling, NO3- concentrations were clearly higher than NH4+ concentrations in the nutrient solution after labeling (Table 3). This indicated that a significant amount of unlabeled nutrient solution with a high NO3− to NH4+ ratio was still present in the rock wool substrate during 15N labeling. Regardless of the higher dilution of 15NO3− label (Table 3; Supplementary Figure S6), the 15N tracer could be detected in the emitted N2O independent of the applied form (15NH4+ or 15NO3−). The 15aN2O values mirrored the 15N enrichments of the labeled NO3− and NH4+ pools, with higher values in of 15NH4+-labeled units compared to 15NO3−-labeled units (Supplementary Figure S6). The label dilution was considered for calculating NO3−-derived N2O and NH4+-derived N2O. The NO3−-derived N2O (Figures 2A,B) reflected the N2O emission rates measured by GC (Table 1), with highest values found 24 h after the first labeling. There was no clear difference in NO3−-derived N2O between the 15NH4+ and 15NO3− labels. In general, the NH4+-derived N2O values (Figures 2C,D) were lower than the NO3−-derived N2O values, but also followed the dynamics of N2O emission rates measured by GC. Notably, NH4+-derived N2O was higher for 15NO3−-labeled units compared to 15NH4+-labeled units during sampling 2. Consequently, the calculated average fPN2O values varied from 0.4 to 0.9 between the applied label forms, sampling times, and sampling campaigns (Figures 2C,D). During both sampling campaigns, an increase of fPN2O from 4 h to 24 h after labeling was present for the 15NO3−-labeled units, while there was no effect of sampling time for the 15NH4+-labeled units. The latter showed higher fPN2O values during the second sampling campaign, which was also significantly higher than for the 15NO3−-labeled units at 4 h after labeling.
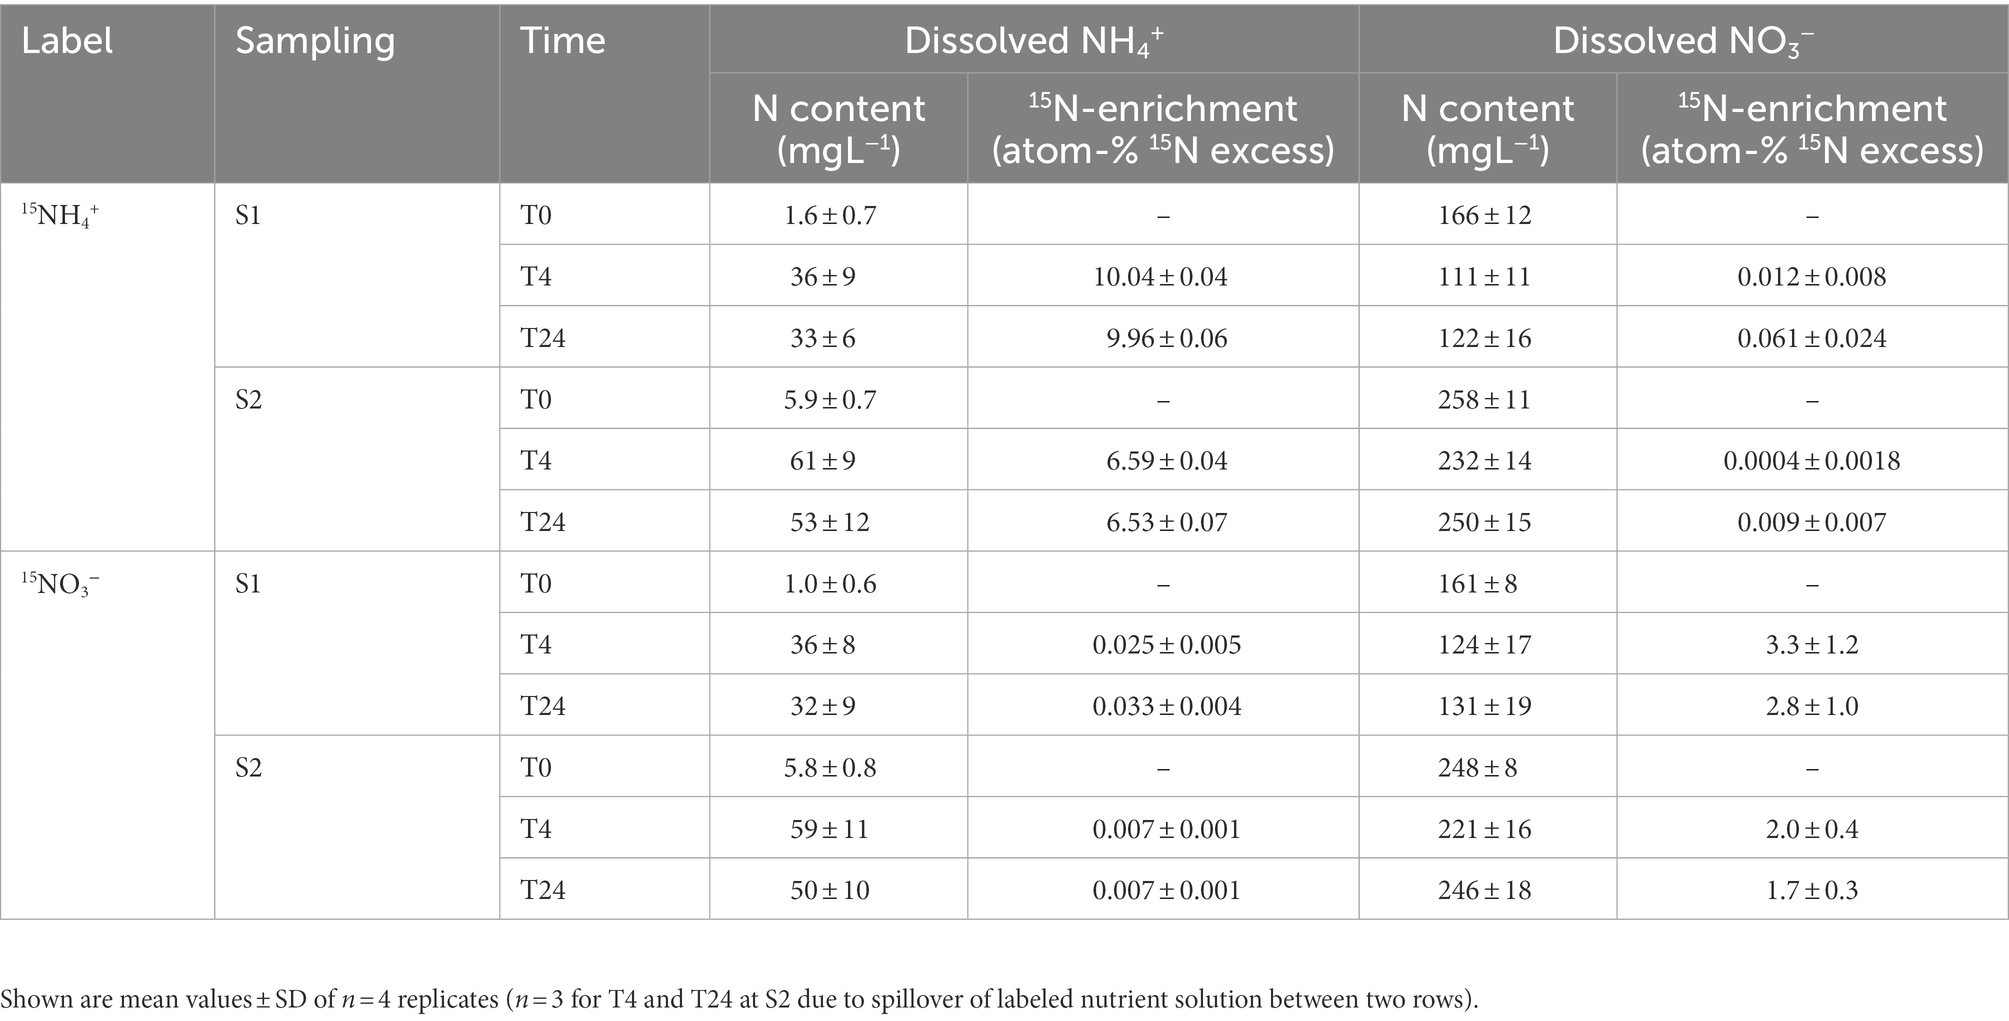
Table 3. Concentrations and 15N-enrichment of dissolved ammonium and nitrate in the nutrient solution during the two sampling campaigns, including samples taken before 15N labeling (T0) and 4/24 h afterward (T4/T24).
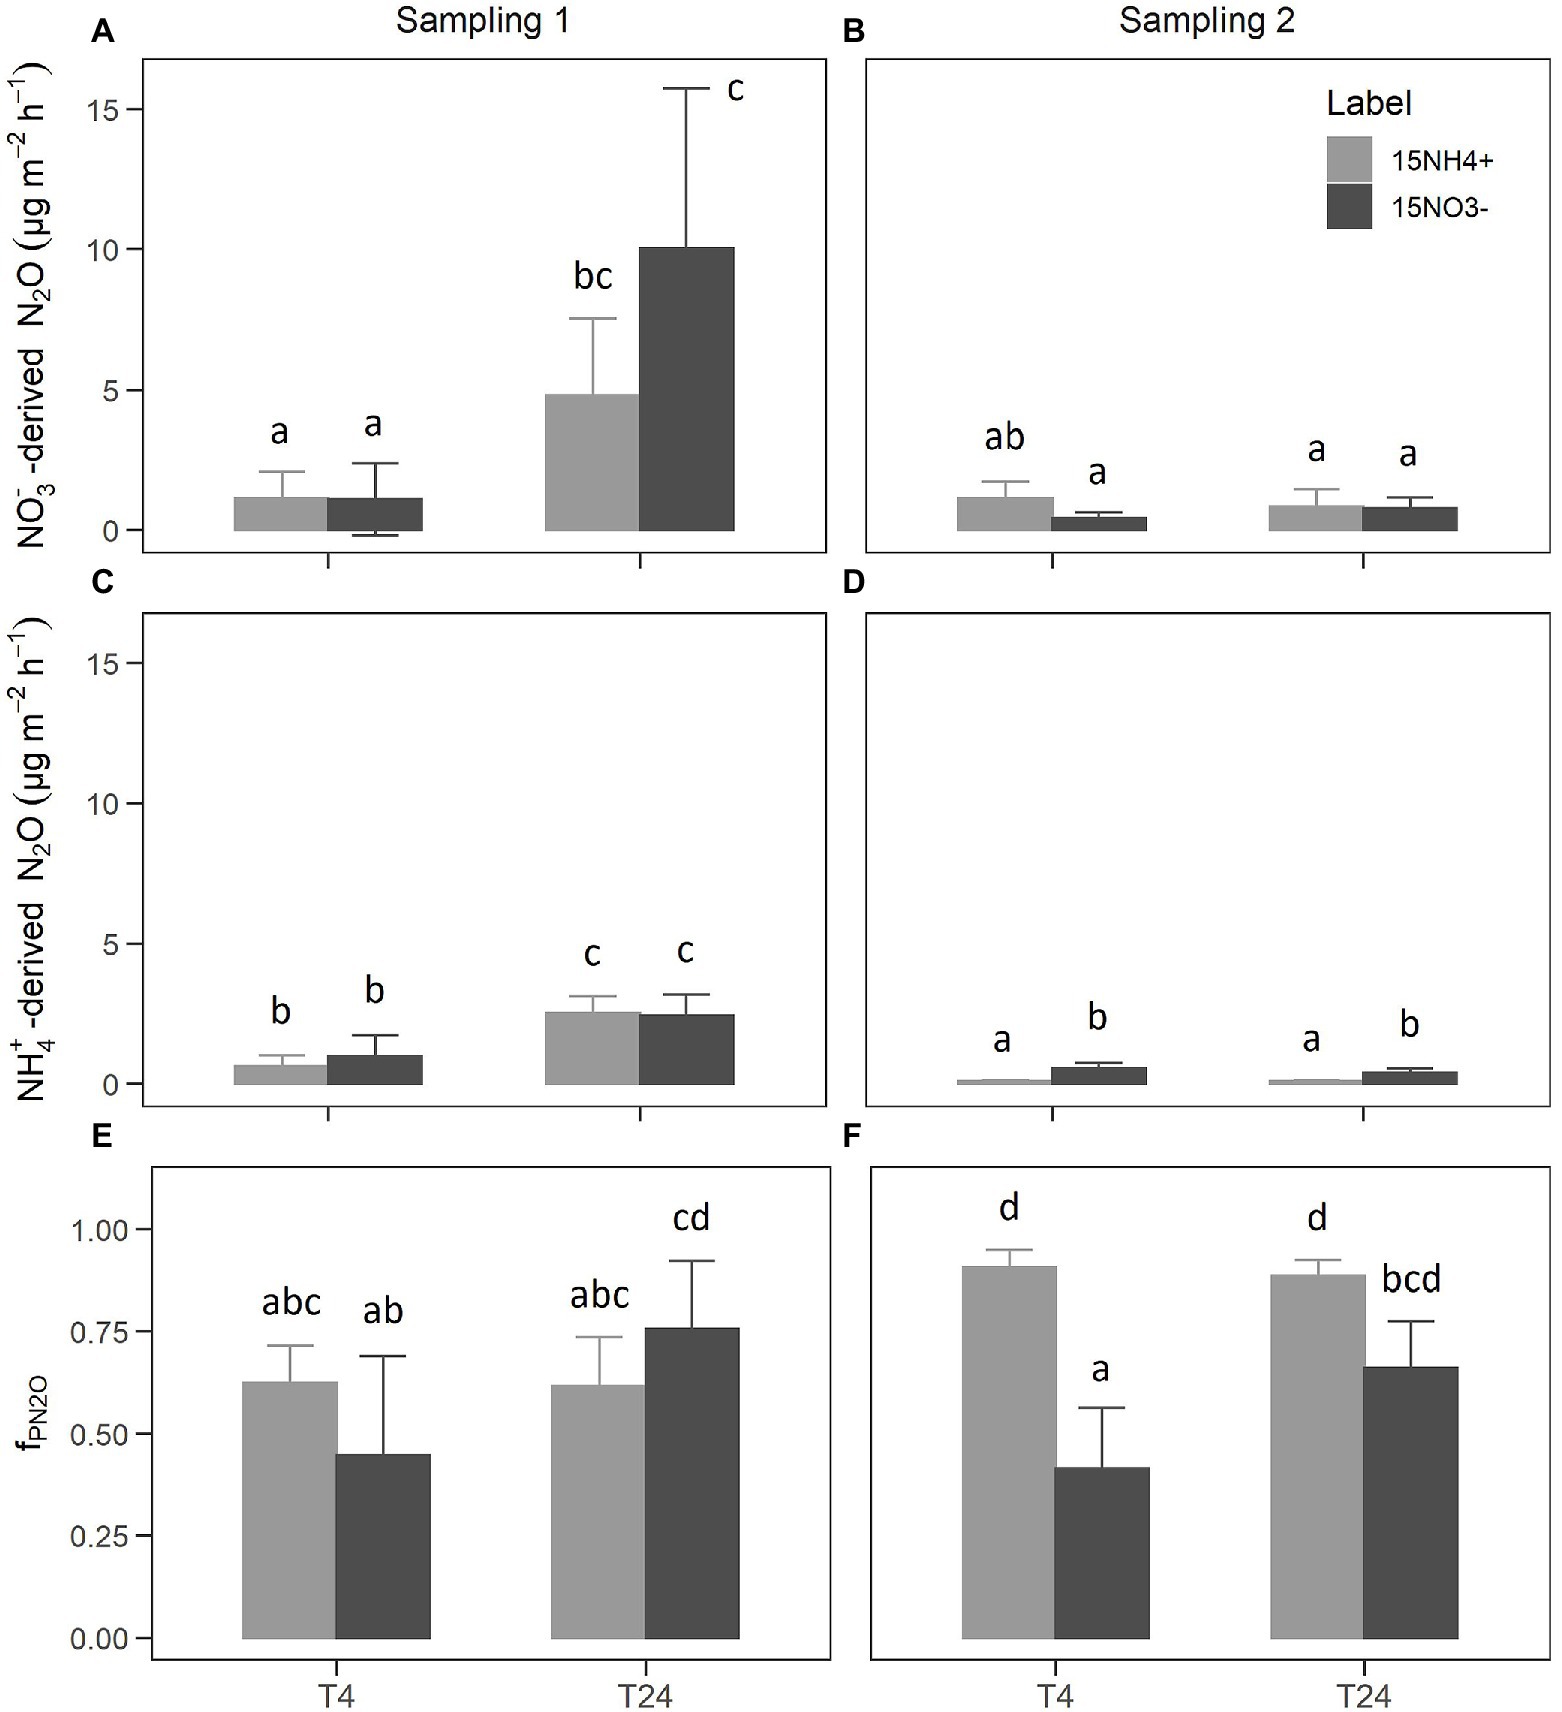
Figure 2. NO3−-derived N2O fluxes (A,B), NH4+-derived N2O fluxes (C,D), and the estimated share of NO3−-derived N2O fluxes [fPN2O; (E,F)]. Bars show the mean of n = 4 replicates and error bars the corresponding SD. Small letters indicate levels of significance for differences between label and sampling with p < 0.05 from linear mixed-effects models and Tukey post-hoc tests.
3.2. Recovery of 15N tracer in different pools
The natural abundance δ15N values from both samplings were equal (leaves) or slightly lower (NH4+, NO3− and N2O) at the second sampling, indicating that no carryover of 15N label occurred from the first sampling. The amount of 15N tracer from the 15N-enriched NH4NO3 added during the labelings that was recovered in different pools (dissolved NH4+ and NO3−, N2O, plant biomass) was calculated as excess 15N (15Nexc). At both samplings, most of the 15N label remained in its original form after 24 h, i.e., as dissolved NH4+ and NO3− (Table 4). There was a notable increase of 15Nexc of dissolved NO3− in the 15NH4+-labeled units, indicating the conversion of NH4+ to NO3− by Ni (up to 2% of added label during sampling 1). On the other side, the 15Nexc of dissolved NH4+ in the 15NO3−-labeled units was comparably low (at maximum 0.3% of added label during sampling 1). The 15Nexc of N2O strongly differed between the two samplings, with up to 20 times higher values at sampling 1, reflecting the APE values of N2O (Supplementary Figure S7). Despite the higher dilution of 15N tracer in the NO3− pool (Table 3) and the resulting lower 15N enrichments in the 15NO3−-labeled units compared to 15NH4+-labeled units (Supplementary Figure S6), there were no significant differences between the label types regarding the amount of 15N tracer found in N2O, as shown by the 15Nexc values (Table 4). In all cases, the 15Nexc of total plant biomass was higher than the 15Nexc of N2O. The highest plant 15N uptake was observed during the second sampling in 15NH4+-labeled units. Irrespective of the generally higher 15N-enrichment of roots (Supplementary Table S2), most 15N tracer was found in shoots (i.e., the sum of stem leaf biomass; Table 4), as a consequence of the biomass difference (root to shoot ratio of 0.23). Only marginal amounts of 15N tracer were found in tomato fruits during sampling 2. Overall, the majority of 15N added during labelings was recovered in the studied pools, with the calculated 15N recovery rates varying around 100%.
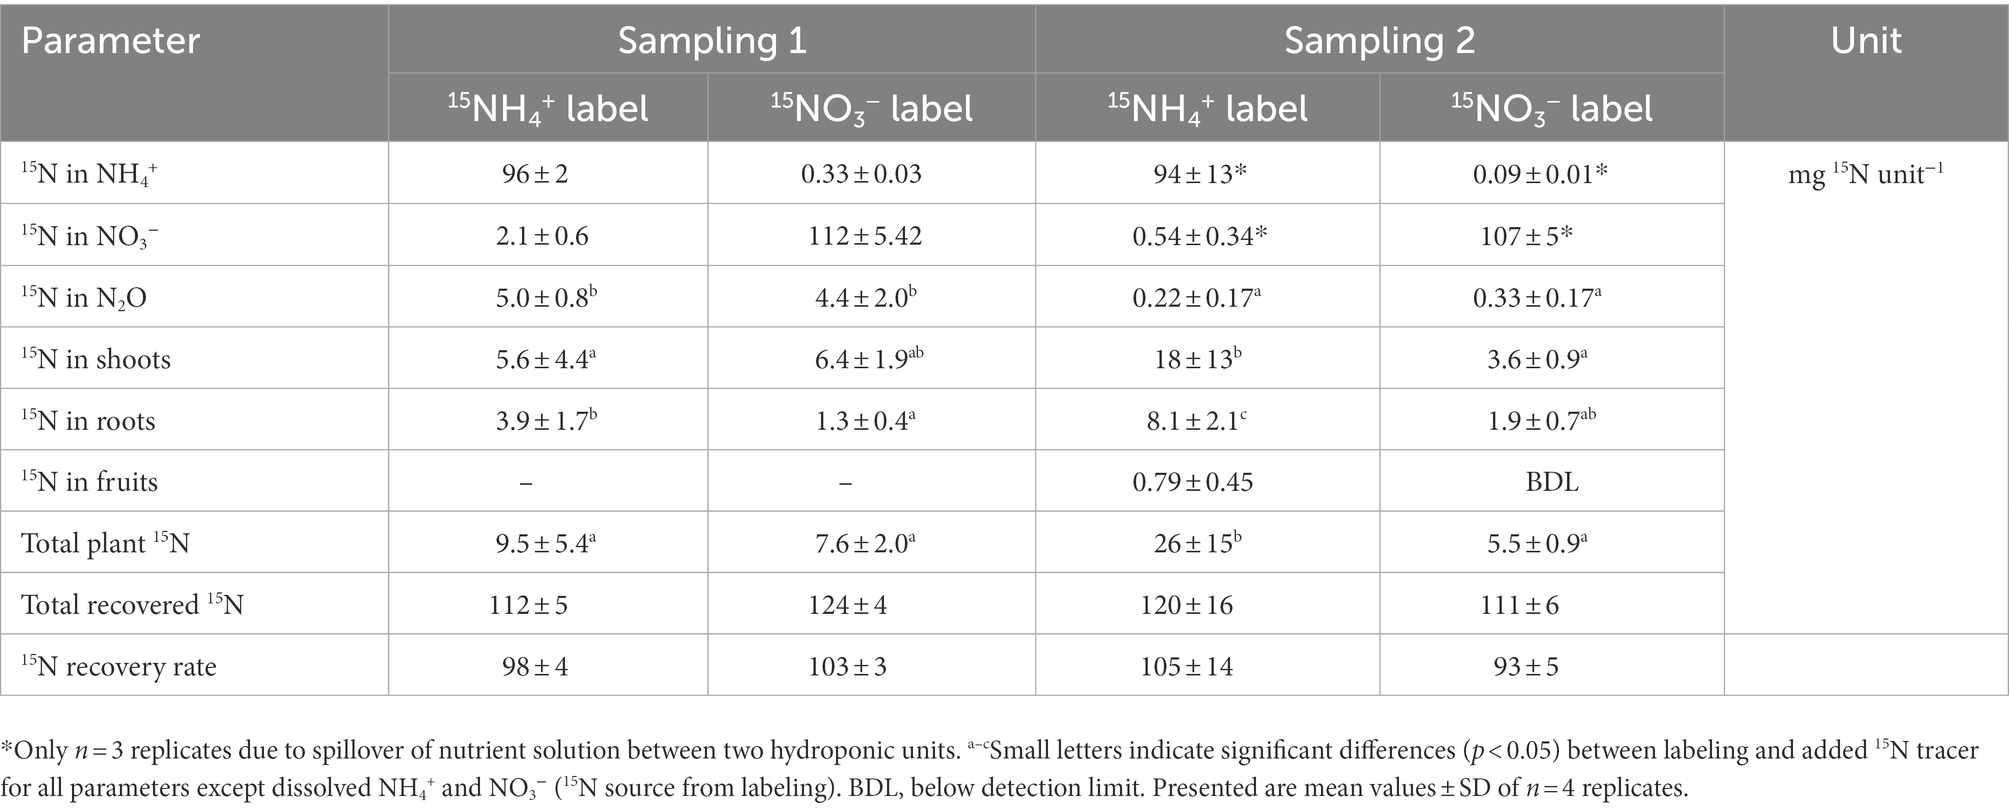
Table 4. Excess 15N (15Nexc) found in different pools 24 h after labeling with 15NH4+ and 15NO3−, total recovered 15N and recovery rate of 15N tracer from the labeling.
4. Discussion
In this study, we applied the N2O isotopocule and 15N tracing approaches to better understand the sources of N2O emission from hydroponic vegetable production systems, using tomato cultivation on rock wool substrate as a model. Furthermore, in our study, we determined rN2O using the isotopocule mapping method (Lewicka-Szczebak et al., 2017), which had been shown to be in good agreement with the 15N gas flux method (Buchen et al., 2018; Lewicka-Szczebak et al., 2020). Therefore, for hydroponic systems, we determined this ratio for the first using an appropriate method.
As we hypothesized, the results from both N2O isotope analyses (non-labeled and 15N-labeled) point to bD as main source of N2O emissions from the hydroponic units. The scattering of the values around the reduction line of bD in the mapping approach of the N2O isotopocules (Figure 1) suggests that most of the N2O was produced by bD. Unfortunately, nD cannot be clearly separated from bD by the N2O isotopocule mapping approach (Lewicka-Szczebak et al., 2017), due to the overlap of endmember values (i.e., theoretical values determined from literature values of pure cultures and the isotopic composition of water and N substrates). Thus, the calculated fbD could actually be a mixture of bD and nD. The same is true for the fraction of Ni in N2O emission (fNi), which cannot be clearly separated from the fraction of fD (ffD) in the mapping approach. However, a mixed fraction (fNi/fD = 1 – fbD) can be calculated, as previously done by Buchen et al. (2018). Depending on the mapping scenario and sampling campaign, the fNi/fD values vary between 0.10 and 0.15 in our study. In consequence, the contribution of fD and/or Ni seems small under typical tomato growing conditions in rock wool hydroponics with low NH4+ supply. For better distinction of bD, we used the 15N tracing approach to determine the fraction of NO3−-derived N2O fluxes, i.e., fPN2O. While fPN2O can principally also include contributions from fD, we assume its impact was minor as shown by the isotopocule map (Figure 2). Therefore we assume fPN2O is equivalent to fbD from the isotopocule mapping approach but does not include N2O fluxes from nD. Although the fPN2O values are relatively variable (Figures 2E,F), they generally show that bD was the main source of N2O emissions, even under increased NH4+ supply. Hence the results from N2O isotope analysis and 15N tracing were in good accordance with each other. On the other hand, the results from the 15N-labeling also show that a large part of N2O can be formed from NH4+ (Figures 2C,D), suggesting processes other than denitrification of added NO3− (Firestone and Davidson, 1989). Possibly, the increase of the NH4+ concentration in the nutrient solution used for 15N-labeling compared to the non-labeled nutrient solution could have increased Ni and the associated N2O formation from NH4+. This is supported by the slight 15N-enrichment of NO3− found in units labeled with 15NH4+ (Table 4), indicating the presence of Ni. Notably, the average fbD values of ~0.87 from N2O isotopocule analysis (Table 2) were higher than the average fPN2O values of ~0.68 from 15N tracing (Figure 2). Assuming that microbial activities did no significantly change after adding the NH4+-rich 15N label, we hypothesize that the observed difference in fbD and fPN2O values is due to microbial processes other than Ni that are associated with the release of N2O from NH4+.
Besides the conversion of hydroxyl amine (NH2OH) to N2O during Ni, there are several known pathways that explain the production of N2O derived from NH4+, in particular nD and cND (Baggs, 2011). Wrage-Mönnig et al. (2018) argue in their review that nD can be the predominant source of N2O emissions under certain conditions. For example, this includes “environments with fluctuating aerobic-anaerobic conditions”, which are likely to occur in hydroponic systems with regular irrigation intervals (Schröder and Lieth, 2002). In contrast, Bakken and Frostegard (2017) fundamentally disagree with the concept of nD, based on the preferential electron flow in nitrifiers, and rather suggest that it is cND that accounts for the observations after all. In this sense, the O2 consumption by Ni could lead to anoxic conditions facilitating bD (Zhu et al., 2015). Additionally, a process that also needs to be taken into account is co-denitrification (coD), i.e., the formation of hybrid N2O and N2 molecules with each one N atom derived from the classical denitrification pathway (N species: nitrite, NO2−; nitric oxide, NO) and one N atom from another N species such as NH2OH or amino compounds (Spott et al., 2011). In our study, coD may have been stimulated by the increased NH4+ availability after adding the nutrient solutions for 15N labeling. This is supported by the lower apN2O values compared to the 15aNO3− values found in 15NO3−-labeled units (Supplementary Figures S6A,B,E,F; Spott and Stange, 2007), suggesting that part of the emitted N2O was derived from non-labeled NH4+. Albeit the use of NH4+ in coD was found quite rarely and organic N sources are thus perceived as the main source for forming hybrid N2O/N2 molecules with NO2−-N or NO-N (Spott et al., 2011). Therefore, the combined fraction of nD and cND (fnD/cND) can be estimated from fPN2O and fbD as described by Deppe et al. (2017), i.e., by calculating the difference of fbD and fPN2O (fnD/cND = fbD – fPN2O). Depending on the scenario for fbD, the values of fnD/cND vary between 0.40–0.48 at T4 and 0.09–0.24 at T24 for the 15NO3−-labeled units during both sampling campaigns. For the 15NH4+-labeled units, this comparison seems not appropriate because the estimated fPN2O values were partially higher than fbD values. This is probably due to the assumption used in Eq. 3, i.e., that the labeled pool (15NO3− and 15NH4+) is the same as the active pool. In contrast, the fPN2O values of 15NO3−-labeled units were determined via the non-random distribution of N2O isotopologues and delivered the fraction of the active labeled pool used for N2O production, which is not necessarily identical to the bulk NO3− pool (Deppe et al., 2017; Zaman et al., 2021).
Notably, measured N2O emissions from the experimental units we used were low compared to previous studies of hydroponic systems (Daum and Schenk, 1996a; Hashida et al., 2014; Karlowsky et al., 2021), which reported emission rates that were one to two orders of magnitude higher. The low N2O emission rates could have been a result of unfavorable conditions for denitrifier activity, such as low organic carbon contents and/or high oxygen availability in the substrate (Morley and Baggs, 2010). The accumulation of organic carbon due to root exudation and root decay might be key to N2O emissions from inert substrates like rock wool, as we found in a previous study a steep increase of N2O emission rates after 5 months of tomato cultivation following a phase of low N2O emission rates (Karlowsky et al., 2021). In this study, we found an increase of DOC in the re-circulating nutrient solution from sampling 1 to sampling 2, but this was not related to higher N2O emissions. Here, the slightly acidic conditions (pH values <4.6; Supplementary Figure S2) during sampling 2 may have limited denitrification, considering that N emissions from denitrification typically decrease at low pH values (Daum and Schenk, 1998; Farquharson and Baldock, 2007), which is also associated with a higher rN2O value (e.g., Liu et al., 2010), but this was only visible in trend (Table 2). In general, N2O fluxes were highly variable (Table 1), with a trend to higher emissions from planted rock wool slabs compared to unplanted rock wool slabs, especially during sampling 1. Thus, our findings indicate that considerable N2O emissions may also occur from re-circulated nutrient solution, e.g., in collection and storage tanks or bio-filtration/disinfection units. Although it is unclear to which extent the rock wool matrix with its high pore space volumes (Dannehl et al., 2015) and a large surface area for microbial biofilms (Brand and Wohanka, 2001) might have promoted N2O emissions from the re-circulated nutrient solution.
In addition to the above-discussed findings, we performed a 15N mass balance to check the plausibility of rN2O and the calculated N2O and N2 emissions from the mapping approach, and to gain more insights into N dynamics in the hydroponic units. Unfortunately, the proportion of applied 15N label recovered as N2O strongly varied between the two samplings, which can be attributed to temporal fluctuations resulting in a peak of N2O emission rates at 24 h after labeling during sampling 1. This peak probably led to an overestimation of cumulative N2O fluxes, especially considering that N2O emission rates are typically lower during nighttime when no fertigation is done (Daum and Schenk, 1998; Yoshihara et al., 2016; Karlowsky et al., 2021). Due to highly variable and generally very moderate N2O emissions as well as the high variability of 15N excess in plant material, the 15N mass balance in our case proved to be too uncertain to validate the calculated gas fluxes from the isotopocule mapping approach. In general, the results of the 15N mass balance reflect the findings from the 15N tracing approach and show in addition that the majority of 15N tracer applied to the hydroponic units was recovered in the nutrient solution, plant biomass, and N2O emissions after 24 h. However, since only short-term N dynamics are included in the 15N mass balance, N use efficiency cannot be calculated with these data.
5. Conclusion
The findings of our study clearly show that bD was the major source of N2O emissions from hydroponic tomato cultivation on rock wool substrate, and that up to 90% of initially produced N2O was reduced to N2 before gas emission. The combined results of N2O isotopocule analysis and 15N tracing suggest that other microbial processes related to N2O formation from NH4+ (i.e., Ni, nD, and cND) play only a moderate role. However, with the methods used, it was not possible to determine the individual contribution of each of these processes to the observed N2O emissions. Furthermore, the involvement of fD and coD remains unclear, but seems less likely since organic matter is supplied only by plant roots in the rock wool substrate. Therefore, future studies are needed to better distinguish N2O sources other than bD, possibly combing isotopic approaches with molecular genetic methods such as functional gene analysis. As we also found N2O emissions from root-less rock wool substrate, potential N2O emissions from drained nutrient solution should be further researched. Ultimately, on the basis of our study, measures to reduce denitrifier activity appear to be the most promising option to mitigate N2O emissions and N losses from hydroponic cultivation.
Data availability statement
The raw data supporting the conclusions of this article will be made available by the authors, without undue reservation.
Author contributions
SK: conceptualization, investigation, formal analysis, and writing—original draft. CB-T: investigation, formal analysis, and writing—original draft. LO: investigation and formal analysis. DS: conceptualization and methodology. RW: methodology and writing—review and editing. All authors contributed to the article and approved the submitted and revised version.
Funding
This project is supported by the Federal Ministry of Food and Agriculture (BMEL) based on the decision of the Parliament of the Federal Republic of Germany via the Federal Office for Agriculture and Food (BLE) under the innovation support program (funding code 281B204116 for project “HydroN2O”).
Acknowledgments
We thank Gundula Aust and the gardener team at IGZ for setting up and maintaining the experiment in the greenhouse. Martina Heuer, Jennifer Gier und Ute Rieß at Thünen Institute for help during isotopic analyses. Jens Dyckmanns and his team at Göttingen University for SPIN-MIRMS analysis.
Conflict of interest
The authors declare that the research was conducted in the absence of any commercial or financial relationships that could be construed as a potential conflict of interest.
Publisher’s note
All claims expressed in this article are solely those of the authors and do not necessarily represent those of their affiliated organizations, or those of the publisher, the editors and the reviewers. Any product that may be evaluated in this article, or claim that may be made by its manufacturer, is not guaranteed or endorsed by the publisher.
Supplementary material
The Supplementary material for this article can be found online at: https://www.frontiersin.org/articles/10.3389/fmicb.2022.1080847/full#supplementary-material
References
Baggs, E. M. (2011). Soil microbial sources of nitrous oxide: recent advances in knowledge, emerging challenges and future direction. Curr. Opin. Environ. Sustain. 3, 321–327. doi: 10.1016/j.cosust.2011.08.011
Bakken, L. R., and Frostegard, A. (2017). Sources and sinks for N2O, can microbiologist help to mitigate N2O emissions? Environ. Microbiol. 19, 4801–4805. doi: 10.1111/1462-2920.13978
Barford, C. C., Montoya, J. P., Altabet, M. A., and Mitchell, R. (1999). Steady-state nitrogen isotope effects of N2 and N2O production in Paracoccus denitrificans. Appl. Environ. Microbiol. 65, 989–994. doi: 10.1128/AEM.65.3.989-994.1999
Bergsma, T., Ostrom, N., Emmons, M., and Robertson, G. (2001). Measuring simultaneous fluxes from soil of N2O and N2 in the field using the 15N-gas “nonequilibrium” technique. Environ. Sci. Technol. 35, 4307–4312. doi: 10.1021/es010885u
Brand, T., and Wohanka, W. (2001). Importance and characterization of the biological component in slow filters. Acta Hortic. 554, 313–322. doi: 10.17660/ActaHortic.2001.554.34
Buchen, C., Lewicka-Szczebak, D., Flessa, H., and Well, R. (2018). Estimating N2O processes during grassland renewal and grassland conversion to maize cropping using N2O isotopocules. Rapid Commun. Mass Spectrom. 32, 1053–1067. doi: 10.1002/rcm.8132
Buchen, C., Lewicka-Szczebak, D., Fuß, R., Helfrich, M., Flessa, H., and Well, R. (2016). Fluxes of N2 and N2O and contributing processes in summer after grassland renewal and grassland conversion to maize cropping on a plaggic anthrosol and a histic gleysol. Soil Biol. Biochem. 101, 6–19. doi: 10.1016/j.soilbio.2016.06.028
Butterbach-Bahl, K., Baggs, E. M., Dannenmann, M., Kiese, R., and Zechmeister-Boltenstern, S. (2013). Nitrous oxide emissions from soils: how well do we understand the processes and their controls? Philos. Trans. R. Soc. B 368, 20130122–20130113. doi: 10.1098/rstb.2013.0122
Cowan, N., Ferrier, L., Spears, B., Drewer, J., Reay, D., and Skiba, U. (2022). CEA systems: the means to achieve future food security and environmental sustainability? Front. Sustain. Food Syst. 6:891256. doi: 10.3389/fsufs.2022.891256
Dannehl, D., Suhl, J., Ulrichs, C., and Schmidt, U. (2015). Evaluation of substitutes for rock wool as growing substrate for hydroponic tomato production. J. Appl. Bot. Food Qual. 88, 68–77. doi: 10.5073/JABFQ.2015.088.010
Daum, D., and Schenk, M. K. (1996a). Gaseous nitrogen losses from a soilless culture system in the greenhouse. Plant Soil 183, 69–78. doi: 10.1007/bf02185566
Daum, D., and Schenk, M. K. (1996b). Influence of nitrogen concentration and form in the nutrient solution on N2O and N2 emissions from a soilless culture system. Plant Soil 203, 279–288. doi: 10.1023/a:1004350628266
Daum, D., and Schenk, M. K. (1997). Evaluation of the acetylene inhibition method for measuring denitrification in soilless plant culture systems. Biol. Fertil. Soils 24, 111–117. doi: 10.1007/bf01420230
Daum, D., and Schenk, M. K. (1998). Influence of nutrient solution pH on N2O and N-2 emissions from a soilless culture system. Plant Soil 203, 279–287. doi: 10.1023/A:1004350628266
de Kreij, C., Voogt, W., and Baas, R. (2003). “Nutrient Solutions and Water Quality for Soilless Cultures ”. (Naaldwijk, The Netherlands: Applied Plant Research, Division Glasshouse).
Decock, C., and Six, J. (2013). How reliable is the intramolecular distribution of 15N in N2O to source partition N2O emitted from soil? Soil Biol. Biochem. 65, 114–127. doi: 10.1016/j.soilbio.2013.05.012
Deppe, M., Well, R., Giesemann, A., Spott, O., and Flessa, H. (2017). Soil N2O fluxes and related processes in laboratory incubations simulating ammonium fertilizer depots. Soil Biol. Biochem. 104, 68–80. doi: 10.1016/j.soilbio.2016.10.005
Dyckmans, J., Eschenbach, W., Langel, R., Szwec, L., and Well, R. (2021). Nitrogen isotope analysis of aqueous ammonium and nitrate by membrane inlet isotope ratio mass spectrometry (MIRMS) at natural abundance levels. Rapid Commun. Mass Spectrom. 35:e9077. doi: 10.1002/rcm.9077
Farquharson, R., and Baldock, J. (2007). Concepts in modelling N2O emissions from land use. Plant Soil 309, 147–167. doi: 10.1007/s11104-007-9485-0
Felber, R., Conen, F., Flechard, C. R., and Neftel, A. (2012). Theoretical and practical limitations of the acetylene inhibition technique to determine total denitrification losses. Biogeosciences 9, 4125–4138. doi: 10.5194/bg-9-4125-2012
Firestone, M. K., and Davidson, E. A. (1989). “Microbiological basis of NO and N2O production and consumption in soil” in Exchange of Trace Gases Between Terrestrial Ecosystems and the Atmosphere: Report of the Dahlem Workshop on Exchange of Trace Gases Between Terrestrial Ecosystems and the Atmosphere. eds. M. O. Andreae and D. S. Schimel (New York, NY, USA: Wiley), 7–21.
Frame, C. H., and Casciotti, K. L. (2010). Biogeochemical controls and isotopic signatures of nitrous oxide production by a marine ammonia-oxidizing bacterium. Biogeosciences 7, 2695–2709. doi: 10.5194/bg-7-2695-2010
Fuss, R., Hueppi, R., and Pedersen, A. R. (2020). gasfluxes: Greenhouse Gas Flux Calculation from Chamber Measurements: Functions for greenhouse gas flux calculation from chamber measurements; Version: 0.4-4, Depends: R (>= 3.5.0) [Software]. https://CRAN.R-project.org/package=gasfluxes
Groffman, P. M., Altabet, M. A., Böhlke, J. K., Butterbach-Bahl, K., David, M. B., Firestone, M. K., et al. (2006). Methods for measuring denitrification: diverse approaches to a difficult problem. Ecol. Appl. 16, 2091–2122. doi: 10.1890/1051-0761(2006)016[2091:Mfmdda]2.0.Co;2
Gruda, N. (2009). Do soilless culture systems have an influence on product quality of vegetables? J. Appl. Bot. Food Qual. 82, 141–147. doi: 10.18452/9433
Halbert-Howard, A., Hafner, F., Karlowsky, S., Schwarz, D., and Krause, A. (2021). Evaluating recycling fertilizers for tomato cultivation in hydroponics, and their impact on greenhouse gas emissions. Environ. Sci. Pollut. Res. 28, 59284–59303. doi: 10.1007/s11356-020-10461-4
Hashida, S.-N., Johkan, M., Kitazaki, K., Shoji, K., Goto, F., and Yoshihara, T. (2014). Management of nitrogen fertilizer application, rather than functional gene abundance, governs nitrous oxide fluxes in hydroponics with rockwool. Plant Soil 374, 715–725. doi: 10.1007/s11104-013-1917-4
Jinuntuya-Nortman, M., Sutka, R. L., Ostrom, P. H., Gandhi, H., and Ostrom, N. E. (2008). Isotopologue fractionation during microbial reduction of N2O within soil mesocosms as a function of water-filled pore space. Soil Biol. Biochem. 40, 2273–2280. doi: 10.1016/j.soilbio.2008.05.016
Karlowsky, S., Gläser, M., Henschel, K., and Schwarz, D. (2021). Seasonal nitrous oxide emissions from hydroponic tomato and cucumber cultivation in a commercial greenhouse company. Front. Sustain. Food Syst. 5:626053. doi: 10.3389/fsufs.2021.626053
Kool, D. M., Wrage, N., Oenema, O., Dolfing, J., and Van Groenigen, J. W. (2007). Oxygen exchange between (de)nitrification intermediates and H2O and its implications for source determination of NO3- and N2O: a review. Rapid Commun. Mass Spectrom. 21, 3569–3578. doi: 10.1002/rcm.3249
Lakhiar, I. A., Gao, J., Syed, T. N., Chandio, F. A., and Buttar, N. A. (2018). Modern plant cultivation technologies in agriculture under controlled environment: a review on aeroponics. J. Plant Interact. 13, 338–352. doi: 10.1080/17429145.2018.1472308
Lewicka-Szczebak, D., Augustin, J., Giesemann, A., and Well, R. (2017). Quantifying N2O reduction to N2 based on N2O isotopocules – validation with independent methods (helium incubation and 15N gas flux method). Biogeosciences 14, 711–732. doi: 10.5194/bg-14-711-2017
Lewicka-Szczebak, D., Dyckmans, J., Kaiser, J., Marca, A., Augustin, J., and Well, R. (2016). Oxygen isotope fractionation during N2O production by soil denitrification. Biogeosciences 13, 1129–1144. doi: 10.5194/bg-13-1129-2016
Lewicka-Szczebak, D., Lewicki, M. P., and Well, R. (2020). N2O isotope approaches for source partitioning of N2O production and estimation of N2O reduction – validation with the 15N gas-flux method in laboratory and field studies. Biogeosciences 17, 5513–5537. doi: 10.5194/bg-17-5513-2020
Lewicka-Szczebak, D., Well, R., Bol, R., Gregory, A. S., Matthews, G. P., Misselbrook, T., et al. (2015). Isotope fractionation factors controlling isotopocule signatures of soil-emitted N(2)O produced by denitrification processes of various rates. Rapid Commun. Mass Spectrom. 29, 269–282. doi: 10.1002/rcm.7102
Lewicka-Szczebak, D., Well, R., Köster, J., Fuß, R., Senbayram, M., Dittert, K., et al. (2014). Experimental determinations of isotopic fractionation factors associated with N2O production and reduction during denitrification in soils. Geochim. Cosmochim. Acta 134, 55–73. doi: 10.1016/j.gca.2014.03.010
Lin, W., Li, Q., Zhou, W., Yang, R., Zhang, D., Wang, H., et al. (2022). Insights into production and consumption processes of nitrous oxide emitted from soilless culture systems by dual isotopocule plot and functional genes. Sci. Total Environ. 856:159046. doi: 10.1016/j.scitotenv.2022.159046
Liu, B., Morkved, P. T., Frostegard, A., and Bakken, L. R. (2010). Denitrification gene pools, transcription and kinetics of NO, N2O and N2 production as affected by soil pH. FEMS Microbiol. Ecol. 72, 407–417. doi: 10.1111/j.1574-6941.2010.00856.x
Llorach-Massana, P., Muñoz, P., Riera, M. R., Gabarrell, X., Rieradevall, J., Montero, J. I., et al. (2017). N2O emissions from protected soilless crops for more precise food and urban agriculture life cycle assessments. J. Clean. Prod. 149, 1118–1126. doi: 10.1016/j.jclepro.2017.02.191
Maeda, K., Spor, A., Edel-Hermann, V., Heraud, C., Breuil, M. C., Bizouard, F., et al. (2015). N2O production, a widespread trait in fungi. Sci. Rep. 5:9697. doi: 10.1038/srep09697
Mandernack, K. W., Mills, C. T., Johnson, C. A., Rahn, T., and Kinney, C. (2009). The δ15N and δ18O values of N2O produced during the co-oxidation of ammonia by methanotrophic bacteria. Chem. Geol. 267, 96–107. doi: 10.1016/j.chemgeo.2009.06.008
Menyailo, O. V., and Hungate, B. A. (2006). Stable isotope discrimination during soil denitrification: production and consumption of nitrous oxide. Glob. Biogeochem. Cycles 20:GB3025. doi: 10.1029/2005gb002527
Morley, N., and Baggs, E. M. (2010). Carbon and oxygen controls on N2O and N2 production during nitrate reduction. Soil Biol. Biochem. 42, 1864–1871. doi: 10.1016/j.soilbio.2010.07.008
Nadeem, S., Dörsch, P., and Bakken, L. R. (2013). Autoxidation and acetylene-accelerated oxidation of NO in a 2-phase system: implications for the expression of denitrification in ex situ experiments. Soil Biol. Biochem. 57, 606–614. doi: 10.1016/j.soilbio.2012.10.007
Ostrom, N. E., Pitt, A., Sutka, R., Ostrom, P. H., Grandy, A. S., Huizinga, K. M., et al. (2007). Isotopologue effects during N2O reduction in soils and in pure cultures of denitrifiers. J. Geophys. Res. 112:287. doi: 10.1029/2006jg000287
Röckmann, T., Kaiser, J., Brenninkmeijer, C., and Brand, W. (2003). Gas chromatography/isotope-ratio mass spectrometry method for high-precision position-dependent 15N and 18O measurements of atmospheric nitrous oxide. Rapid Commun. Mass Spectrom. 17, 1897–1908. doi: 10.1002/rcm.1132
Rohe, L., Anderson, T. H., Braker, G., Flessa, H., Giesemann, A., Lewicka-Szczebak, D., et al. (2014). Dual isotope and isotopomer signatures of nitrous oxide from fungal denitrification - a pure culture study. Rapid Commun. Mass Spectrom. 28, 1893–1903. doi: 10.1002/rcm.6975
Rohe, L., Well, R., and Lewicka-Szczebak, D. (2017). Use of oxygen isotopes to differentiate between nitrous oxide produced by fungi or bacteria during denitrification. Rapid Commun. Mass Spectrom. 31, 1297–1312. doi: 10.1002/rcm.7909
Savvas, D., Gianquinto, G., Tuzel, Y., and Gruda, N. (2013). “Good agricultural practices for greenhouse vegetable crops - principles for Mediterranean climate areas, 12: soilless culture” in FAO Plant Production and Protection Paper eds. W. Baudoin, R. Nono-Womdim, N. Lutaladio, A. Hodder, N. Castilla, C. Leonardi, S. D. Pascale, M. Qaryouti, and R. Duffy, et al. (Rome, Italy: Food and Agriculture Organization of the United Nations).
Savvas, D., and Gruda, N. (2018). Application of soilless culture technologies in the modern greenhouse industry – a review. Eur. J. Hortic. Sci. 83, 280–293. doi: 10.17660/eJHS.2018/83.5.2
Scholefield, D., Hawkins, J. M. B., and Jackson, S. M. (1997). Development of a helium atmosphere soil incubation technique for direct measurement of nitrous oxide and dinitrogen fluxes during denitrification. Soil Biol. Biochem. 29, 1345–1352. doi: 10.1016/s0038-0717(97)00021-7
Schröder, F.-G., and Lieth, J. H. (2002). “Chapter 7 irrigation control in hydroponics” in Hydroponic Production of Vegetables and Ornamentals. eds. D. Savvas and H. Passam (Egaleo, Greece: Embryo Publications).
Schwarz, D., Thompson, A. J., and Klaring, H. P. (2014). Guidelines to use tomato in experiments with a controlled environment. Front. Plant Sci. 5:625. doi: 10.3389/fpls.2014.00625
Sharma, N., Acharya, S., Kumar, K., Singh, N., and Chaurasia, O. P. (2018). Hydroponics as an advanced technique for vegetable production: an overview. J. Soil Water Conserv. 17:364. doi: 10.5958/2455-7145.2018.00056.5
Small, G. E., McDougall, R., and Metson, G. S. (2019). Would a sustainable city be self-sufficient in food production? Int. J. Des. Nat. Ecodyn. 14, 178–194. doi: 10.2495/dne-v14-n3-178-194
Spott, O., Russow, R., Apelt, B., and Stange, C. (2006). A 15N-aided artificial atmosphere gas flow technique for online determination of soil N2 release using the zeolite Köstrolith SX6®. Rapid Commun. Mass Spectrom. 20, 3267–3274. doi: 10.1002/rcm.2722
Spott, O., Russow, R., and Stange, C. F. (2011). Formation of hybrid N2O and hybrid N2 due to codenitrification: first review of a barely considered process of microbially mediated N-nitrosation. Soil Biol. Biochem. 43, 1995–2011. doi: 10.1016/j.soilbio.2011.06.014
Spott, O., and Stange, C. F. (2007). A new mathematical approach for calculating the contribution of anammox, denitrification and atmosphere to an N2 mixture based on a 15N tracer technique. Rapid Commun. Mass Spectrom. 21, 2398–2406. doi: 10.1002/rcm.3098
Stevens, R. J., and Laughlin, R. J. (1998). Measurement of nitrous oxide and di-nitrogen emissions from agricultural soils. Nutr. Cycl. Agroecosyst. 52, 131–139. doi: 10.1023/a:1009715807023
Sutka, R. L., Adams, G. C., Ostrom, N. E., and Ostrom, P. H. (2008). Isotopologue fractionation during N(2)O production by fungal denitrification. Rapid Commun. Mass Spectrom. 22, 3989–3996. doi: 10.1002/rcm.3820
Sutka, R. L., Ostrom, N. E., Ostrom, P. H., Breznak, J. A., Gandhi, H., Pitt, A. J., et al. (2006). Distinguishing nitrous oxide production from nitrification and denitrification on the basis of isotopomer abundances. Appl. Environ. Microbiol. 72, 638–644. doi: 10.1128/AEM.72.1.638-644.2006
Toyoda, S., Mutobe, H., Yamagishi, H., Yoshida, N., and Tanji, Y. (2005). Fractionation of N2O isotopomers during production by denitrifier. Soil Biol. Biochem. 37, 1535–1545. doi: 10.1016/j.soilbio.2005.01.009
Toyoda, S., and Yoshida, N. (1999). Determination of nitrogen isotopomers of nitrous oxide on a modified isotope ratio mass spectrometer. Anal. Chem. 71, 4711–4718. doi: 10.1021/ac9904563
Well, R., and Flessa, H. (2009). Isotopologue enrichment factors of N(2)O reduction in soils. Rapid Commun. Mass Spectrom. 23, 2996–3002. doi: 10.1002/rcm.4216
Well, R., Kurganova, I., de Gerenyu, V., and Flessa, H. (2006). Isotopomer signatures of soil-emitted N2O under different moisture conditions - a microcosm study with arable loess soil. Soil Biol. Biochem. 38, 2923–2933. doi: 10.1016/j.soilbio.2006.05.003
Wheeler, R. M. (2017). Agriculture for space: people and places paving the way. Open Agric. 2, 14–32. doi: 10.1515/opag-2017-0002
Wrage-Mönnig, N., Horn, M. A., Well, R., Müller, C., Velthof, G., and Oenema, O. (2018). The role of nitrifier denitrification in the production of nitrous oxide revisited. Soil Biol. Biochem. 123, A3–A16. doi: 10.1016/j.soilbio.2018.03.020
Wu, D., Well, R., Cárdenas, L., Fuß, R., Lewicka-Szczebak, D., Köster, J., et al. (2019). Quantifying N2O reduction to N2 during denitrification in soils via isotopic mapping approach: model evaluation and uncertainty analysis. Environ. Res. 179:108806. doi: 10.1016/j.envres.2019.108806
Yoshida, N. (1988). 15N-depleted N2O as a product of nitrification. Nature 335, 528–529. doi: 10.1038/335528a0
Yoshihara, T., Tokura, A., Hashida, S. N., Kitazaki, K., Asobe, M., Enbutsu, K., et al. (2016). N2O emission from a tomato rockwool culture is highly responsive to photoirradiation conditions. Sci. Hortic. 201, 318–328. doi: 10.1016/j.scienta.2016.02.014
Yu, L., Harris, E., Lewicka-Szczebak, D., Barthel, M., Blomberg, M. R. A., Harris, S. J., et al. (2020). What can we learn from N2O isotope data? - analytics, processes and modelling. Rapid Commun. Mass Spectrom. 34:e8858. doi: 10.1002/rcm.8858
Zaman, M., Kleineidam, K., Bakken, L., Berendt, J., Bracken, C., Butterbach-Bahl, K., et al. (2021). “Isotopic techniques to measure N2O, N2 and their sources” in Measuring emission of agricultural greenhouse gases and developing mitigation options using nuclear and related techniques: Applications of nuclear techniques for GHGs. eds. M. Zaman, L. Heng, and C. Müller (Cham: Springer International Publishing), 213–301. doi: 10.1007/978-3-030-55396-8_7
Keywords: glasshouse vegetable production, horticulture, greenhouse gas emission, N2O isotopocules, 15N labeling, denitrification
Citation: Karlowsky S, Buchen-Tschiskale C, Odasso L, Schwarz D and Well R (2023) Sources of nitrous oxide emissions from hydroponic tomato cultivation: Evidence from stable isotope analyses. Front. Microbiol. 13:1080847. doi: 10.3389/fmicb.2022.1080847
Edited by:
Zengming Chen, Institute of Soil Science (CAS), ChinaReviewed by:
Wei Lin, Chinese Academy of Agricultural Sciences, ChinaKoki Maeda, Japan International Research Center for Agricultural Sciences (JIRCAS), Japan
Copyright © 2023 Karlowsky, Buchen-Tschiskale, Odasso, Schwarz and Well. This is an open-access article distributed under the terms of the Creative Commons Attribution License (CC BY). The use, distribution or reproduction in other forums is permitted, provided the original author(s) and the copyright owner(s) are credited and that the original publication in this journal is cited, in accordance with accepted academic practice. No use, distribution or reproduction is permitted which does not comply with these terms.
*Correspondence: Stefan Karlowsky, ✉ a2FybG93c2t5QGlnemV2LmRl