 Kseniia V. Galkina1,2
 Valeria M. Zubareva1,2
 Nataliia D. Kashko2
 Anna S. Lapashina1,2,3Olga V. Markova1
 Boris A. Feniouk1,2
 Dmitry A. Knorre1,2*
- 1A. N. Belozersky Institute of Physico-Chemical Biology, Lomonosov Moscow State University, Moscow, Russia
- 2Faculty of Bioengineering and Bioinformatics, Lomonosov Moscow State University, Moscow, Russia
- 3Department of Biological Chemistry, Sechenov First Moscow State Medical University, Moscow, Russia
In mitochondria, a small protein IF1 suppresses the hydrolytic activity of ATP synthase and presumably prevents excessive ATP hydrolysis under conditions of energy deprivation. In yeast Saccharomyces cerevisiae, IF1 homologs are encoded by two paralogous genes: INH1 and STF1. INH1 expression is known to aggravate the deleterious effects of mitochondrial DNA (mtDNA) depletion. Surprisingly, no beneficial effects of INH1 and STF1 were documented for yeast so far, and the functions of INH1 and STF1 in wild type cells are unclear. Here, we put forward a hypothesis that INH1 and STF1 bring advantage during the fast start of proliferation after reentry into exponential growth from post-diauxic or stationary phases. We found that yeast cells increase the concentration of both proteins in the post-diauxic phase. Post-diauxic phase yeast cells formed two subpopulations distinct in Inh1p and Stf1p concentrations. Upon exit from the post-diauxic phase cells with high level of Inh1-GFP started growing earlier than cells devoid of Inh1-GFP. However, double deletion of INH1 and STF1 did not increase the lag period necessary for stationary phase yeast cells to start growing after reinoculation into the fresh medium. These results point to a redundancy of the mechanisms preventing uncontrolled ATP hydrolysis during energy deprivation.
Introduction
Oxidative phosphorylation (OxPhos) is one of the major mechanisms of energy conversion in living cells (Wilson, 2017). During OxPhos, respiratory chain enzymes generate the transmembrane difference of electrochemical proton potential (Δμ˜H+) that powers H+-transport through FOF1 ATP-synthase coupled to synthesis of ATP from ADP and inorganic phosphate. When Δμ˜H+ decreases below the thermodynamic threshold for ATP synthesis, FOF1 activity reverses and the enzyme works as an ATP-driven proton pump and generates Δμ˜H+ (Zubareva et al., 2020). Surprisingly, complete dissipation of Δμ˜H+ often leads to inhibition of FOF1 ATPase activity. In mitochondria, this inhibition is mediated by a small protein IF1 that binds to F1 subcomplex of FOF1 (Pullman and Monroy, 1963; Satre et al., 1975) and blocks ATP hydrolysis in de-energized mitochondria. IF1 is believed to prevent the depletion of ATP and cell death under energy deprivation conditions (Campanella et al., 2008). In animal mitochondria, IF1 plays an important role in the assembly of FOF1 (He et al., 2018), inhibits autophagy (Campanella et al., 2009), and is involved in the formation of mitochondrial cristae (Weissert et al., 2021). Since cancer cells usually proliferate in poorly aerated environments, they upregulate IF1 expression: an increase in IF1 is an important prognostic factor of tumor development (Galber et al., 2020).
Yeast Saccharomyces cerevisiae harbor two genes encoding IF1 homologs: INH1 and STF1 (Ichikawa et al., 1990). In the presence of protonophores, mitochondria isolated from the yeast strain with double deletion of IF1 genes, Δinh1Δstf1, hydrolyze ATP much faster than the mitochondria of wild type yeast do (Ichikawa et al., 1990; Venard et al., 2003). Moreover, deletion of IF1 homolog increased ATP hydrolysis rate in another yeast species, Ustilago maydis (Lucero et al., 2021).
At the same time, Inh1p protein plays a detrimental role in the metabolism of rho0 S. cerevisiae cells that lack mitochondrial DNA (mtDNA) and are incapable of OxPhos. Since three subunits of the ATP-synthase FO-subcomplex are encoded in mtDNA, rho0 cells assemble only the F1-subcomplex in the matrix. In rho0 cells, futile ATP hydrolysis by F1 is coupled with the electrogenic exchange of matrix ADP3− to cytosolic ATP4− mediated by adenine nucleotide carriers. Inhibition of F1-subcomplex ATPase activity by Inh1p decreases Δμ˜H+ in rho0 yeast mitochondria, whereas mitochondrial Δμ˜H+ is essential for rho0 cells proliferation. Indeed, increased INH1 expression decreases the growth rate of rho0 yeast cells, while INH1 deletion accelerates growth (Liu et al., 2021). Furthermore, while yeast cells with deleted i-AAA protease gene YME1 cannot survive without mtDNA, the Δyme1Δinh1 rho0 strain proved to be viable. It is suggested that deletion of YME1 suppresses Inh1p degradation, increases Inh1p concentration in the mitochondrial matrix and, therefore, prevents ATP hydrolysis in rho0 cells (Kominsky et al., 2002). However, the INH1 deletion phenotypes discussed above do not clarify its physiological role in wild type yeast cells. On the contrary, the examples show that the presence of a functional INH1 gene is detrimental under conditions when the respiratory chain activity is low.
INH1 or STF1 genes were also identified in several high-throughput screenings. For instance, Δinh1 strain was found to be highly susceptible to propionic acid stress (Mira et al., 2009) and incapable of filamentous growth (Jin et al., 2008). STF1 deletion increased the survival of yeast cells during prolonged starvation in synthetic medium (Garay et al., 2014). These results imply that the deletion of ATPase inhibitor proteins can manifest at the level of the whole cells, but these results were not verified with independently obtained mutants.
Taken together, these works show that information about the biological role of IF1-like proteins is largely limited to (1) experiments on isolated mitochondria; (2) the results of genetic screenings; or (3) deleterious effects of these proteins that reduce the growth rate of intact rho0 cells. In our work, we attempted to get an insight into the physiological (adaptive) role of Inh1p and Stf1p in yeast cells. We assessed the expression of these proteins under different yeast growth conditions. We also tested how Inh1p level in post-diauxic phase yeast cells is correlated with the chance to proliferate within the first few hours after inoculation into a rich growth medium. Finally, we investigated the phenotype of INH1 and STF1 genes double deletion in a variety of stressful conditions, e.g., in the stationary phase and in the presence of protonophores.
Materials and Methods
Yeast Strains, Growth Conditions, and Reagents
Yeast strains used in the study are listed in Supplementary Table S1. Deletion, prototrophy, and GFP-fusion strains were obtained by homologous recombination of the PCR product with heterologous selection markers. All newly generated strains were verified by PCR with primers annealed to DNA regions outside the disruption cassette (Supplementary Table S2; Supplementary Figure S1). Deletions of INH1 and STF1 were validated using Reverse transcription-qPCR (RT-qPCR, see below). We also verified that Stf1-GFP and Inh1-GFP expressing cells show mitochondrial localization of GFP (Supplementary Figure S2).
We prepared standard rich (yeast peptone, YP) growth media as described by Sherman (2002). We obtained peptone and yeast extract from BioSpringer, D-glucose and galactose from Helicon, raffinose from Chimmed, glycerol from Panreac, lactate from Alfa Aesar, and agar from DiaM. Before the experiments, yeast cells were grown at 30°C in 5 ml of the liquid medium in 50 ml flasks overnight up to the exponential growth phase. We also assessed yeast cells incubated in batch cultures for 2 days (post-diauxic cells) and 7–10 days (stationary phase cells).
Flow-Cytometry and Fluorescent Microscopy
GFP fluorescence was assessed with a CytoFlex (Beckman-Coulter) flow cytometer using excitation wavelength of 488 nm and the emission filter (525/40 nm). At least 10,000 events were analyzed in each experiment. To quantify the proportion of yeast cells expressing Inh1-GFP and Stf1-GFP, we introduced the gating threshold so that 98% of control yeast cells without GFP would be below this threshold. Thereafter, we applied this threshold to all flow-cytometry data of Inh1-GFP and Stf1-GFP expressing cells. We considered events above this threshold as GFP-positive cells and below this threshold as GFP-negative cells. Acquisition and analysis were performed using CytExpert v 2.0 software; we rendered representative images using flowCore and ggcyto libraries of R programming language (Hahne et al., 2009; Van et al., 2018). The fluorescence intensity values were log-transformed using logicleTransform function of flowCore (Parks et al., 2006).
We photographed the cells expressing GFP using the fluorescence microscope Olympus BX41 with the U-MNIBA3 (excitation wavelength 470–495 nm; beamsplitter filter 505 nm; and emission 510–550 nm) filter set. Photographs were taken with a DP30BW charged-coupled device camera.
Cell-to-Cell Heterogeneity Analysis
The strain expressing Inh1p-GFP was grown for 2 days in liquid yeast peptone dextrose (YPD) medium up to the post-diauxic or for 7 days to the stationary phase. Then, we inoculated the cells into the fresh YPD medium to the final OD550 = 0.1 (2 × 10⁶ cell/ml). We analyzed photographs of cells taken after 0, 2, and 4 h of incubation. We counted the number of cells with/without buds and with/without GFP. About 130–630 cells were analyzed in each sample.
Quantitative Reverse Transcription PCR Analysis
RNA was isolated from yeast cells using the hot formamide extraction method described in Shedlovskiy et al. (2017). cDNA was synthesized by annealing 2 μg of RNA with 0.1 μg of random hexamers and 0.1 μg of Oligo-dT using Superscript III reverse transcriptase (Thermo Fisher Scientific) for 1 h at 42°C. RT-qPCR was carried out using the CFX96 Touch™ Real-Time PCR Detection System (Bio-Rad, Hercules, CA, United States). Primer sequences for quantification of INH1 and STF1 gene expression are listed in Supplementary Table S2. Eva Green master mix (Syntol, Russia) was used for the detection of DNA accumulation during the reaction. The thermal profile for the EVA Green RT-qPCR included an initial heat-denaturing step at 95°C for 3 min, 40 cycles at 95°C for 15 s, an annealing step for 30 s, and 72°C for 30 s, coupled with fluorescence measurements. Following amplification, the melting curves of the PCR products were monitored to determine the specificity of the amplification. Target mRNA levels were normalized to the reference gene ACT1.
Isolation of Mitochondria and Respirometry
We isolated mitochondria from the WT (HIS+ TRP+) and Δinh1Δstf1 strains grown in yeast peptone glycerol (YPGly) medium using the protocol described earlier by Bazhenova et al. (1998). To test whether mitochondrial preparations of wild type and Δinh1Δstf1 strains are similar in mitochondrial protein content, we assessed the uncoupled respiration of isolated mitochondria with Clark-type oxygen electrode (Strathkelvin Instruments 782, United Kingdom) at 25°C. Measurements were performed in the mitochondria incubation medium containing 0.6 M mannitol, 10 mM Tris–HCl, 0.5 mM MgCl2, and 2 mM potassium phosphate (pH 7.4). We measured the rate of succinate (5 mM) oxidation and NADH-dependent respiration (8 mM pyruvate with 2 mM malate) as the substrates, to uncouple mitochondria we added 200 nM FCCP (carbonyl cyanide-p-trifluoromethoxyphenylhydrazone).
ATP Hydrolysis Measurements
ATP hydrolysis by isolated mitochondria was registered via NADH oxidation in the ATP regenerating system as in Vasilyeva et al. (1980). The buffer contained 20 mM HEPES, pH 8.0, 0.65 M sorbitol, 17 mM KCl, 3 mM K2HPO4, 1 mM MgCl2, 1 mg/ml bovine serum albumin (BSA), 2 μM myxothiazol, 200 μM NADH, 2.5 mM phosphoenolpyruvate, 20 U/ml pyruvate kinase, and 20 U/ml lactate dehydrogenase. ATP was added to 1 mM to start the reaction. If indicated, valinomycin and nigericin were added to 500 nM each to dissipate Δμ˜H+.
Yeast Growth Analysis
Cells were diluted to the optical density of OD550 = 0.05 (106 cell/ml) and inoculated in 100 μl of the liquid medium into a 96-well plate (Eppendorf). Plates were incubated in a spectrophotometer (SpectrostarNANO) with the following settings: orbital shaking at 500 rpm for 2 min at 30°C before measurements; measurements were performed at 5-min intervals. We compared the maximal growth rates (μmax) and lag-period between the control and mutant strains. To calculate growth rate μmax, we took log2-transformed OD values and fitted them with the standard linear model using R. We calculated slopes for each curve in 250 min sliding windows and took maximal values. μmax here is equal to 1/duplication time.
Determination of ATP Level in Yeast Cells
Cells grown in YPD to the post-diauxic phase (2 days) or the stationary phase (7 or 10 days) were harvested by centrifugation and resuspended in PBS buffer to the OD550 of about 0.1–0.2. To measure the ATP level in yeast during exponential growth, the resuspension step was omitted and ATP was extracted directly from the growing culture. The suspensions were mixed with dimethyl sulfoxide (v/v 1:9) to extract ATP (Romanova et al., 1997). ATP amount in the extracts was determined using ATP Bioluminescence Assay Kit CLS II (Roche). The resulting values were normalized to the number of yeast cells in the corresponding samples measured by flow cytometry (Beckman-Coulter).
Competitive Assay
We mixed exponentially growing (1) WT LEU+ with WT HIS+TRP+ leu− and (2) WT LEU+ with Δinh1Δstf1 leu− HIS+TRP+ in liquid YPD medium in equal proportion (1:1) to the final concentration of 4 × 10⁴ cell/ml. Then, every day we took a part of the suspension and inoculated it into the fresh YPD medium (1:500). Each time, we plated this suspension on the SD-Leu and SD-His agar plates and after 2 days calculated the proportion of LEU+ cells in the suspension as the number of the colonies on SD-Leu divided by the total number of colonies on SD-Leu and SD-His.
Results
Heterogeneity of Inh1p and Stf1p Levels in Post-diauxic Yeast Cultures
Deletion of a gene usually produces a pronounced phenotype under the conditions that induce high expression of this gene. Therefore, before testing the effects of INH1 and STF1 deletion, we assessed the expression of these genes in yeast utilizing different carbon sources. We took yeast strains with chromosomal copies of the INH1 and STF1 genes tagged with the GFP gene (Supplementary Table S1) and analyzed them using fluorescent microscopy and flow cytometry. We assumed that C-terminal GFP tagging would not affect the inhibitory function of Inh1p or Stf1p, since they bind to F1 by the N-terminal domain (Robinson et al., 2013). During exponential growth in a rich medium with glucose, yeast cells maintained low levels of Stf1-GFP and Inh1-GFP. Meanwhile, the concentration of both Inh1-GFP and Stf1-GFP increased in yeast utilizing poorly fermentable carbon sources (e.g., raffinose) or non-fermentable glycerol or lactate (Figure 1). Expression of Inh1-GFP and Stf1-GFP in another strain background (W303) showed a similar pattern (Supplementary Figure S3).

Figure 1. Accumulation of Stf1-GFP (left panel) and Inh1-GFP (right panel) in exponentially growing and post-diauxic BY4741 yeast cells. Boxplots show the proportion of yeast cells with GFP levels above the autofluorescence signal. Histograms show the results of representative experiments. Upper histograms correspond to autofluorescence of the control cells without GFP which are the same for both strains.
Next, we showed that starved yeast cells increase the levels of both IF1-like proteins. Post-diauxic yeast BY4741 culture showed heterogeneity in the content of Inh1-GFP and Stf1-GFP (Figure 1). We detected two subpopulations of cells that were distinct in Inh1-GFP levels in the stationary culture cultivated in a medium supplied with glucose; for Stf1-GFP post-diauxic yeast heterogeneity was also detected in galactose based growth medium. The difference in Inh1-GFP levels was not a result of genetic variation: the cultures that were grown from single colonies also showed heterogeneity in Inh1-GFP levels (Supplementary Figure S4). Inh1-GFP concentration remained high in 10-day stationary phase cells (Supplementary Figure S5). Furthermore, when we analyzed Stf1-GFP expression, stationary phase yeast cells demonstrated three peaks corresponding to cells with different Stf1-GFP accumulation levels (Figure 1). It should be noted that there was no heterogeneity in the expression levels of Stf1-GFP and Inh1-GFP if the cultures were grown in YP raffinose medium and in W303-based yeast strains (Supplementary Figure S3).
Given that BY4741-based yeast cells in the post-diauxic phase had two subpopulations (with and without Inh1-GFP), we decided to trace separately the cells from these subpopulations after transfer to a fresh medium. We suggested that the cells with high Inh1-GFP levels begin to form buds faster than the cells without Inh1-GFP. To test this hypothesis, we inoculated stationary phase BY4741 Inh1-GFP cells into the fresh YPD medium and photographed them immediately or after 2 or 4 h after the transfer. We counted the cells belonging to one of the four categories: (1) unbudded cells with Inh1-GFP; (2) unbudded cells without detectable GFP signal; (3) budding cells with Inh1-GFP; and (4) budding cells without detectable GFP signal. Figure 2A shows representative photographs of all these categories. On average, 16.6 ± 6.8% (mean + SE) Inh1-GFP-positive cells started budding during the first 4 h of growth in a fresh medium, while only 2.0 ± 1.4% (mean + SE) Inh1-GFP-negative cells started budding during this period (Figure 2B).
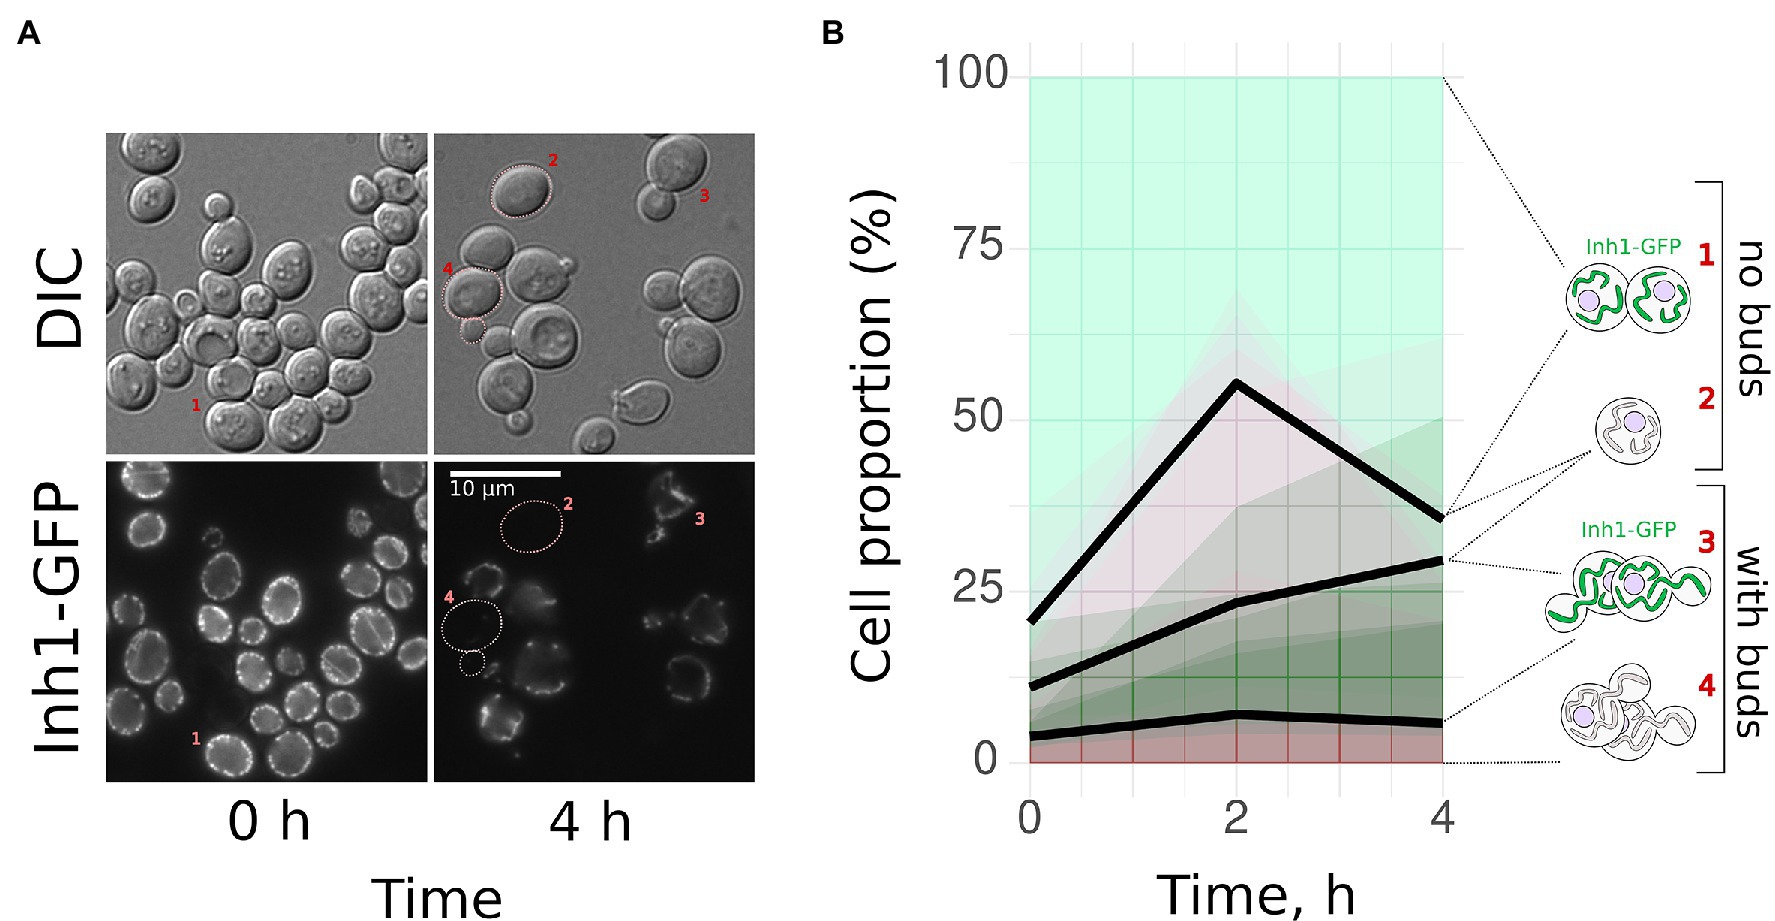
Figure 2. Yeast cells with Inh1-GFP start budding faster than the cells without Inh1-GFP. Post-diauxic phase yeast cells expressing Inh1-GFP were transferred into a fresh yeast peptone dextrose (YPD) medium. We observed two types of cells: those expressing Inh1-GFP and those with no detectable GFP signal. We calculated the percentages of budded vs. unbudded cells separately for these groups. (A) Representative photograph of the cells at the beginning of the experiment and after 4 h of growth in the fresh medium. DIC—Differential Interference Contrast; (B) Change in the proportion of (1) Inh1-GFP positive non-budding; (2) Inh1-GFP negative non-budding; (3) Inh1-GFP positive budding; and (4) Inh1-GFP negative budding cells. The average proportions are shown as black lines, the results of the individual experiments are illustrated with semi-transparent green or red areas (data of five separate experiments, 369 cells on average in each data point). The number of budding cells with GFP (category 3) increased significantly more than the number of budding cells without GFP (category 4); p = 0.016 according to Wilcoxon rank sum test (n = 5).
Genetic and Biochemical Verification of INH1 and STF1 Double Deletion
Although Inh1p and Stf1p proteins have pronounced differences in amino acid sequence and in pH dependency of their inhibitory activity (Cabezon et al., 2002), their functions may overlap. Therefore, to test the phenotypes associated with IF1-like proteins deficiency, we produced a strain in which both INH1 and STF1 were deleted. We also produced a control strain with the same set of prototrophic marker genes (Supplementary Table S1). Using qRT-PCR, we found no detectable expression of INH1 and STF1 in the double deletion strain (Figures 3A,B). Moreover, mitochondria isolated from the Δinh1Δstf1 strain demonstrated an increased rate of ATP hydrolysis which, in contrast to the wild type mitochondria, was further stimulated by uncoupling (Figure 3C). Importantly, ATPase activity normalized to succinate oxidation rate in uncoupled wild type mitochondria was lower (0.27 ± 0.10, ATP hydrolyzed/O2 consumed; mean ± SD) than in uncoupled mutant mitochondria (2.69 ± 1.94, ATP hydrolyzed/O2 consumed; mean ± SD). Similar results we obtained when we normalized the ATPase activity to respiration rate in the presence of NADH-dependent substrate (pyruvate + malate): the ratio of the activities was 0.57 ± 0.31 (ATP hydrolyzed/O2 consumed; mean ± SD) for the wild type mitochondria, while in Δinh1Δstf1 mitochondria it was 3.68 ± 1.45 (ATP hydrolyzed/O2 consumed; mean ± SD). Using Blue Native PAGE, we assessed the relative level of FOF1 in two mitochondrial preparations of each strain. The amount of FOF1 in the Δinh1Δstf1 mutant did not exceed that in the wild type mitochondria (Supplementary Figure S6). Therefore, the high ATP hydrolysis rate of Δinh1Δstf1 mitochondria cannot be explained by a mere increase in FOF1 concentration. Together, these results are in good agreement with earlier experiments on Δinh1Δstf1 yeast mitochondria (Venard et al., 2003). Finally, in line with previous studies (Liu et al., 2021), Δinh1Δstf1 strain with depleted mtDNA (Δinh1Δstf1 rho0) demonstrated an increase in the proliferation rate compared to the control rho0 strain, although the amplitude of the effect was small (Figure 3D).
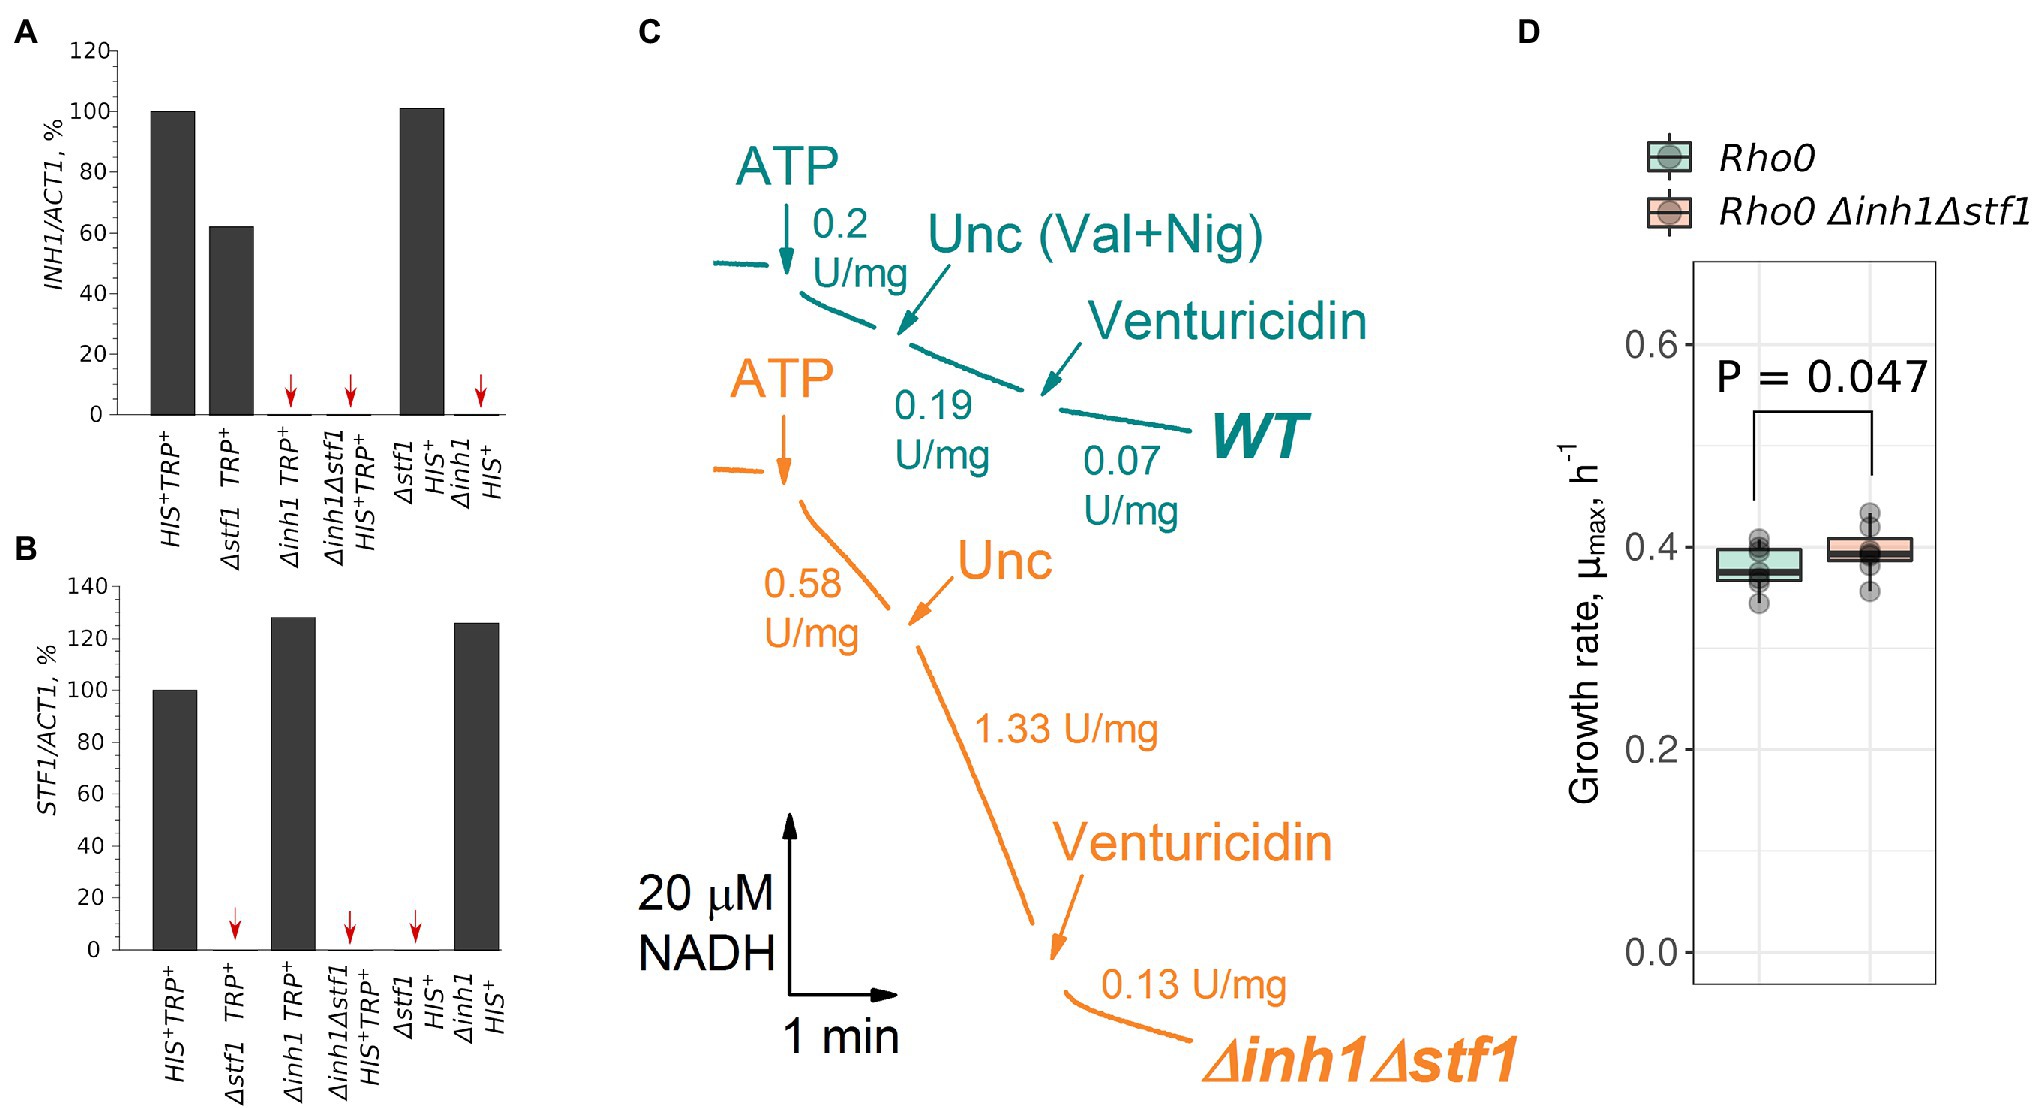
Figure 3. Double deletion of INH1 and STF1 increases the rate of ATP hydrolysis by isolated mitochondria and the growth rate of cells without mitochondrial DNA (mtDNA; rho0). (A,B) INH1 and STF1 mRNA levels in the control and deletion strains. All mRNA levels were normalized to the ACT1 mRNA level, and the value in control (HIS+ TRP+) cells was set at 100%. Red arrows indicate strains with undetectable mRNA levels (single experiment); (C) ATP hydrolysis rate by mitochondria isolated from the control (WT) and Δinh1Δstf1 cells. ATP hydrolysis was registered as NADH oxidation in ATP regenerating system (see Materials and Methods) in the presence of respiratory chain inhibitor myxothiazole. The reaction was started by addition of ATP to 1 mM. When indicated (Unc, Val + Nig), a mixture of valinomycin and nigericin was added to dissipate ΔμH+.; Venturicidin was added to reveal FOF1-specific activity; representative curves of two independent mitochondrial isolations; (D) Growth rates (μmax) of rho0 cells lacking mtDNA derived from the control (WT) and Δinh1Δstf1 strains in rich medium supplemented with glucose (YPD). p value was calculated according to paired Wilcoxon signed-rank test.
Next, we compared the growth characteristics of Δinh1Δstf1 (rho+) and control HIS + TRP+ (rho+) strains. No differences in maximal growth rate μmax were observed under conditions favoring glycolysis (YPD) or OxPhos (YPGly, Figure 4A). Then, we measured ATP levels in yeast cells that were collected from exponential, post-diauxic, and stationary growth phases. We calculated the ATP amount per cell using flow cytometry to assess the cell number in the samples. Although ATP levels decreased in post-diauxic and stationary phases, we did not detect significant differences between control and mutant strains (Figure 4B).

Figure 4. Double deletion of INH1 and STF1 has no effect on yeast cells fitness. (A) Growth rates (μmax) of the control HIS + TRP+ (WT) and Δinh1Δstf1 strains in rich medium supplemented with glucose (YPD) or glycerol (YPGly); (B) ATP concentration in the control HIS + TRP + (WT) and Δinh1Δstf1 exponential, post-diauxic and stationary phases. Each circle data point represents an average of three ATP level measurements (individual values marked by grey crosses) in a separate day experiment. (C) Representative growth curves of yeast cells inoculated from the exponential (WTexp and Δinh1Δstf1exp) or 10-days stationary phase (WTst and Δinh1Δstf1st) into fresh YPD medium and (D) Quantification of the lag periods (in minutes) measured as time from the inoculation to the moment when yeast culture reached maximum growth rate. (E) Relative fitness of Δinh1Δstf1 yeast cells in a competitive assay experiment. The proportion of LEU+ cells in the suspension was calculated from CFU numbers after plating suspensions on selective mediums (see the section Materials and Methods, n = 2).
INH1 and STF1 Double Deletion Shows No Pronounced Phenotype at the Level of Cell Suspension
The experimental results in Figure 2B indicated an earlier start of proliferation in the wild type strain compared to the Δinh1Δstf1 mutant. We measured the time it took for Δinh1Δstf1 and control yeast cells to reach their maximum growth rate (lag period) after inoculation into a fresh medium from the starved stationary phase culture. However, the difference in the lag period values between WT and Δinh1Δstf1 was insignificant: p value according to Mann–Whitney U test was equal to 0.2 (Figures 4C,D). We also did not detect a difference in the number of colony-forming units in Δinh1Δstf1 and wild type yeast suspensions during starvation in the stationary phase (Supplementary Figure S7).
Next, we performed a competitive assay experiment in which Δinh1Δstf1 and wild type strains were grown together in the same flask. Such experiments can detect minor beneficial effects that are indistinguishable by growth rate measurements. Suspension of wild type leu− and Δinh1Δstf1 LEU+ cells was passed through daily cycles of growth up to the post-diauxic phase, and then we transferred small aliquots of the suspension mix into the fresh medium. As a control, we compared changes in the proportion of LEU+ cells during co-cultivation of wild type leu− and wild type LEU+ cells. In two experiments lasting at least 6 days (six cycles), we detected a decreasing trend of LEU+ cells proportion but no effect of INH1 and STF1 double deletion was found (Figure 4E).
We also compared yeast growth rates in the presence of protonophores. We expected that protonophores would induce mitochondrial depolarization, make FOF1 switch from ATP synthesis to hydrolysis and therefore suppress the growth of Δinh1Δstf1 mutant but not of the wild type cells. We tested three anionic protonophores, FCCP, niclosamide (NCA), and pentachlorophenol (PCP). These compounds inhibited growth in the glycerol-based medium and increased the rate of oxygen consumption in yeast cells (Galkina et al., 2020a). It should be noted that the concentration of protonophores required for stimulation of respiration in intact cells is about an order of magnitude higher (Galkina et al., 2020a) than the concentration stimulating respiration of isolated mitochondria (Galkina et al., 2020b). However, in line with our results with starved yeast cells, we did not detect any difference in the maximal growth rate μmax between control and Δinh1Δstf1 strains (Supplementary Figure S8).
We also assessed the survival rate of Δinh1Δstf1 and control strains under various stressful conditions: elevated temperature, high osmolarity, oxidative stress, and high concentrations of ethanol, but in all these experiments we did not detect a decrease in survival of Δinh1Δstf1 strain (Supplementary Figure S9). Finally, we did not detect a decrease in Δinh1Δstf1 resistance to acetic acid (Supplementary Figure S10), which is known to acidify mitochondrial matrix and inhibit the respiratory chain (Chaves et al., 2021).
Discussion
Inhibition of FOF1 ATP-synthase by IF1 was characterized in detail on the biochemical level a long time ago (see reviews Schwerzmann and Pedersen, 1986; Rouslin, 1987; Hashimoto et al., 1990). It was established that the binding stoichiometry of IF1 and FOF1 is 1:1, that the binding occurs under conditions when the enzyme hydrolyzes ATP, and that upon membrane energization IF1 is released from the enzyme and ATP synthesis restarts. On a cellular level, IF1 protects cultivated animal cells from certain kinds of stress. It was found that lowering the amount of IF1 resulted in increased cell death in glucose-free medium during anoxia (Campanella et al., 2008). Similar effect was observed when cells were exposed to 2-deoxyglucose and cyanide so that both glycolysis and OxPhos were inhibited (Fujikawa et al., 2012). These results were explained by faster cellular ATP depletion occurring when IF1 was not inhibiting the ATPase activity of FOF1.
However, on the level of whole organisms, the role of IF1 is still unclear. No phenotype was found in mice with IF1 knockout (Nakamura et al., 2013). In nematode Caenorhabditis elegans, IF1 homolog was non-essential under normal physiological conditions but was found to increase survival under stresses induced by paraquat, cyanide, protonophore FCCP, and heat shock (Fernández-Cárdenas et al., 2017). In unicellular organisms, phenotypes of IF1 depletion are characterized at the level of isolated mitochondria or suggest the detrimental function of IF1.
Free-living microorganisms spend most of their time under the conditions of energy limitation (Lever et al., 2015). When the substrate becomes available, the rapid transition from growth arrest to proliferation becomes a crucial advantage in the competition for substrates. Therefore, microbial cells should maintain functional energy conversion machinery and be ready to start producing ATP for anabolic processes without delay. In batch cultures, when the glucose present in the medium is exhausted, yeast cells enter the post-diauxic phase. In this phase, yeast cells use non-fermentable carbon sources accumulated during exponential growth, such as ethanol. In several days, after ethanol is depleted, yeast cells enter the stationary phase (Herman, 2002).
It should be noted that glycolysis intermediate fructose-1,6-bisphosphate inhibits yeast respiration (Díaz-Ruiz et al., 2008). Therefore, post-diauxic and stationary phase cells inoculated into glucose-containing medium are expected to harbor inhibited respiration but active FOF1. Here, we suggested that ATPase inhibitory protein Inh1p in starved yeast cells could help them maintain a high level of functional FOF1 ATP-synthase while not wasting ATP due to its ATPase activity and enabling rapid growth recovery after starvation. In line with our suggestion, we found that post-diauxic and stationary-phase yeast cells accumulate high levels of Inh1p and Stf1p (Figure 1, Supplementary Figures S3, S4, S5).
Starving yeast cells differentiate into quiescent and non-quiescent cells. Quiescent (Q-) cells do not proliferate and are stress-resistant, whereas non-quiescent (NQ-) cells continue to proliferate but are susceptible to stresses (Aragon et al., 2008). Systematic analysis of yeast protein GFP fusions revealed that Q-cells usually have higher concentrations of mitochondrial proteins, including Inh1-GFP, if compared to NQ-cells (Davidson et al., 2011). Therefore, it is likely that in our experiments, Inh1p-positive cells represent the Q-cell subpopulation. Indeed, Figure 2B shows that Inh1p-positive cells at the beginning of the experiment have a low budding index. Moreover, we showed that high concentration of Inh1p-GFP in yeast cells correlates with their chances of budding shortly after the glucose was added to the medium (Figure 2).
At the same time, the effect of double deletion of INH1 and STF1 on yeast recovery from the stationary phase was marginal (Figures 4C–E). This seeming contradiction with the effect on budding can be explained in several ways. First, INH1 expression can be correlated with an early exit from the stationary phase but not directly (causatively) contribute to the growth restart. Indeed, some other proteins accumulated in Inh1p-positive cells may limit the stationary phase exit. Second, given that yeast cells in dense cultures can communicate with each other (Hlavácek et al., 2009), the effect of ATPase protein inhibitors on growth recovery might be pronounced only in heterogeneous populations. We also cannot exclude the possibility that the effects of INH1 on the recovery from starvation to growth are specific to the genetic background and genetic markers.
It should be noted that the strain with double deletion of INH1 and STF1 can rely on other mechanisms preventing ATP depletion. While IF1 inhibits ATPase activity of FOF1 ATPase upon mitochondrial matrix acidification, ADP can also lock the enzyme in the inactive state under de-energized conditions (Galkin and Vinogradov, 1999, see also Lapashina and Feniouk, 2018 for a recent review). This mechanism is conserved in eukaryotic mitochondria, chloroplasts and bacteria although the strength of the effect may vary between species (Lapashina and Feniouk, 2019; Lapashina et al., 2019). Therefore, ADP-inhibition of mitochondrial ATPase activity appears to be an inherent mechanism preventing excessive ATP hydrolysis under the conditions of mitochondrial depolarization. The redundancy of ADP-inhibition and IF1-mediated inhibition of ATP hydrolysis can mask the manifestations of IF1 deletion on the level of whole organisms including yeast. Therefore, we speculate that IF1 might appear to be crucial under the conditions when ADP-inhibition is ineffective, e.g., upon the depletion of adenine nucleotide pool in the cells.
To summarize, here we have shown that ATPase inhibitor proteins accumulate in starved yeast cells. Moreover, clonal suspensions of BY4741 yeast strains show natural heterogeneity in IF1 level. Upon the addition of the fermentable carbon source, yeast cells with high mitochondrial concentration of IF1 were able to start budding more rapidly than cells lacking IF1. These observations suggest that IF1 plays an important role during starvation. However, given that the double deletion of INH1 and STF1 genes did not produce a pronounced effect, we suggest that the function of IF1 is partially redundant.
Data Availability Statement
The raw data supporting the conclusions of this article will be made available by the authors, without undue reservation.
Author Contributions
BF and DK designed the research and supervised the project. BF obtained the funding. KG, VZ, and NK generated and verified mutant strains. KG performed flow-cytometry and microscopy experiments and performed competition assay experiments. KG, OM, and VZ isolated mitochondria. AL and VZ measured ATP levels in yeast cells and ATP hydrolysis rates. KG and VZ measured yeast growth and survival. KG, AL, and DK prepared the illustrations. DK drafted the text. KG, NK, AL, and BF substantially edited the text. KG, VZ, NK, AL, OM, BF, and DK contributed to the conceptualization and text editing. All authors contributed to the article and approved the submitted version.
Funding
This work was supported by the Russian Science Foundation (project 20-14-00268).
Conflict of Interest
The authors declare that the research was conducted in the absence of any commercial or financial relationships that could be construed as a potential conflict of interest.
Publisher’s Note
All claims expressed in this article are solely those of the authors and do not necessarily represent those of their affiliated organizations, or those of the publisher, the editors and the reviewers. Any product that may be evaluated in this article, or claim that may be made by its manufacturer, is not guaranteed or endorsed by the publisher.
Acknowledgments
We thank the Interdisciplinary Scientific and Educational School of Moscow University Molecular Technologies of the Living Systems and Synthetic Biology for support. This work was performed using equipment acquired in the framework of Lomonosov MSU Program of Development.
Supplementary Material
The Supplementary Material for this article can be found online at: https://www.frontiersin.org/articles/10.3389/fmicb.2022.816622/full#supplementary-material
References
Aragon, A. D., Rodriguez, A. L., Meirelles, O., Roy, S., Davidson, G. S., Tapia, P. H., et al. (2008). Characterization of differentiated quiescent and nonquiescent cells in yeast stationary-phase cultures. Mol. Biol. Cell 19, 1271–1280. doi: 10.1091/mbc.e07-07-0666
Bazhenova, E. N., Deryabina, Y. I., Eriksson, O., Zvyagilskaya, R. A., and Saris, N. E. (1998). Characterization of a high capacity calcium transport system in mitochondria of the yeast Endomyces magnusii. J. Biol. Chem. 273, 4372–4377. doi: 10.1074/jbc.273.8.4372
Cabezon, E., Butler, P. J. G., Runswick, M. J., Carbajo, R. J., and Walker, J. E. (2002). Homologous and heterologous inhibitory effects of ATPase inhibitor proteins on F-ATPases. J. Biol. Chem. 277, 41334–41341. doi: 10.1074/jbc.M207169200
Campanella, M., Casswell, E., Chong, S., Farah, Z., Wieckowski, M. R., Abramov, A. Y., et al. (2008). Regulation of mitochondrial structure and function by the F1Fo-ATPase inhibitor protein, IF1. Cell Metab. 8, 13–25. doi: 10.1016/j.cmet.2008.06.001
Campanella, M., Seraphim, A., Abeti, R., Casswell, E., Echave, P., and Duchen, M. R. (2009). IF1, the endogenous regulator of the F(1)F(o)-ATPsynthase, defines mitochondrial volume fraction in HeLa cells by regulating autophagy. Biochim. Biophys. Acta 1787, 393–401. doi: 10.1016/j.bbabio.2009.02.023
Chaves, S. R., Rego, A., Martins, V. M., Santos-Pereira, C., Sousa, M. J., and Côrte-Real, M. (2021). Regulation of cell death induced by acetic acid in yeasts. Front. Cell Dev. Biol. 9:642375. doi: 10.3389/fcell.2021.642375
Davidson, G. S., Joe, R. M., Roy, S., Meirelles, O., Allen, C. P., Wilson, M. R., et al. (2011). The proteomics of quiescent and nonquiescent cell differentiation in yeast stationary-phase cultures. Mol. Biol. Cell 22, 988–998. doi: 10.1091/mbc.e10-06-0499
Díaz-Ruiz, R., Avéret, N., Araiza, D., Pinson, B., Uribe-Carvajal, S., Devin, A., et al. (2008). Mitochondrial oxidative phosphorylation is regulated by fructose 1,6-bisphosphate. A possible role in Crabtree effect induction? J. Biol. Chem. 283, 26948–26955. doi: 10.1074/jbc.M800408200
Fernández-Cárdenas, L. P., Villanueva-Chimal, E., Salinas, L. S., José-Nuñez, C., de Gómez, T., Puyou, M., et al. (2017). Caenorhabditis elegans ATPase inhibitor factor 1 (IF1) MAI-2 preserves the mitochondrial membrane potential (Δψm) and is important to induce germ cell apoptosis. PLoS One 12:e0181984. doi: 10.1371/journal.pone.0181984
Fujikawa, M., Imamura, H., Nakamura, J., and Yoshida, M. (2012). Assessing actual contribution of IF1, inhibitor of mitochondrial FoF1, to ATP homeostasis, cell growth, mitochondrial morphology, and cell viability. J. Biol. Chem. 287, 18781–18787. doi: 10.1074/jbc.M112.345793
Galber, C., Acosta, M. J., Minervini, G., and Giorgio, V. (2020). The role of mitochondrial ATP synthase in cancer. Biol. Chem. 401, 1199–1214. doi: 10.1515/hsz-2020-0157
Galkin, M. A., and Vinogradov, A. D. (1999). Energy-dependent transformation of the catalytic activities of the mitochondrial F0· F1-ATP synthase. FEBS Lett. 448, 123–126. doi: 10.1016/s0014-5793(99)00347-6
Galkina, K. V., Finkelberg, J. M., Markova, O. V., Azbarova, A. V., Banerjee, A., Kumari, S., et al. (2020a). Protonophore FCCP provides fitness advantage to PDR-deficient yeast cells. J. Bioenerg. Biomembr. 52, 383–395. doi: 10.1007/s10863-020-09849-1
Galkina, K. V., Zyrina, A. N., Golyshev, S. A., Kashko, N. D., Markova, O. V., Sokolov, S. S., et al. (2020b). Mitochondrial dynamics in yeast with repressed adenine nucleotide translocator AAC2. Eur. J. Cell Biol. 99:151071. doi: 10.1016/j.ejcb.2020.151071
Garay, E., Campos, S. E., González de la Cruz, J., Gaspar, A. P., Jinich, A., and Deluna, A. (2014). High-resolution profiling of stationary-phase survival reveals yeast longevity factors and their genetic interactions. PLoS Genet. 10:e1004168. doi: 10.1371/journal.pgen.1004168
Hahne, F., LeMeur, N., Brinkman, R. R., Ellis, B., Haaland, P., Sarkar, D., et al. (2009). flowCore: a bioconductor package for high throughput flow cytometry. BMC Bioinformatics 10:106. doi: 10.1186/1471-2105-10-106
Hashimoto, T., Yoshida, Y., and Tagawa, K. (1990). Regulatory proteins of F1F0-ATPase: role of ATPase inhibitor. J. Bioenerg. Biomembr. 22, 27–38. doi: 10.1007/BF00762843
He, J., Ford, H. C., Carroll, J., Douglas, C., Gonzales, E., Ding, S., et al. (2018). Assembly of the membrane domain of ATP synthase in human mitochondria. Proc. Natl. Acad. Sci. U. S. A. 115, 2988–2993. doi: 10.1073/pnas.1722086115
Herman, P. K. (2002). Stationary phase in yeast. Curr. Opin. Microbiol. 5, 602–607. doi: 10.1016/S1369-5274(02)00377-6
Hlavácek, O., Kucerová, H., Harant, K., Palková, Z., and Váchová, L. (2009). Putative role for ABC multidrug exporters in yeast quorum sensing. FEBS Lett. 583, 1107–1113. doi: 10.1016/j.febslet.2009.02.030
Ichikawa, N., Yoshida, Y., Hashimoto, T., Ogasawara, N., Yoshikawa, H., Imamoto, F., et al. (1990). Activation of ATP hydrolysis by an uncoupler in mutant mitochondria lacking an intrinsic ATPase inhibitor in yeast. J. Biol. Chem. 265, 6274–6278. doi: 10.1016/S0021-9258(19)39321-4
Jin, R., Dobry, C. J., McCown, P. J., and Kumar, A. (2008). Large-scale analysis of yeast filamentous growth by systematic gene disruption and overexpression. Mol. Biol. Cell 19, 284–296. doi: 10.1091/mbc.e07-05-0519
Kominsky, D. J., Brownson, M. P., Updike, D. L., and Thorsness, P. E. (2002). Genetic and biochemical basis for viability of yeast lacking mitochondrial genomes. Genetics 162, 1595–1604. doi: 10.1093/genetics/162.4.1595
Lapashina, A. S., and Feniouk, B. A. (2018). ADP-inhibition of H+-FOF1-ATP synthase. Biochem. Mosc. 83, 1141–1160. doi: 10.1134/S0006297918100012
Lapashina, A. S., and Feniouk, B. A. (2019). Mutation Q259L in subunit beta in Bacillus subtilis ATP synthase attenuates ADP-inhibition and decreases fitness in mixed cultures. Biochem. Biophys. Res. Commun. 509, 102–107. doi: 10.1016/j.bbrc.2018.12.075
Lapashina, A. S., Prikhodko, A. S., Shugaeva, T. E., and Feniouk, B. A. (2019). Residue 249 in subunit beta regulates ADP inhibition and its phosphate modulation in Escherichia coli ATP synthase. Biochim. Biophys. Acta Bioenerg. 1860, 181–188. doi: 10.1016/j.bbabio.2018.12.003
Lever, M. A., Rogers, K. L., Lloyd, K. G., Overmann, J., Schink, B., Thauer, R. K., et al. (2015). Life under extreme energy limitation: a synthesis of laboratory- and field-based investigations. FEMS Microbiol. Rev. 39, 688–728. doi: 10.1093/femsre/fuv020
Liu, S., Liu, S., He, B., Li, L., Li, L., Wang, J., et al. (2021). OXPHOS deficiency activates global adaptation pathways to maintain mitochondrial membrane potential. EMBO Rep. 22:e51606. doi: 10.15252/embr.202051606
Lucero, R.-A., Mercedes, E.-P., Thorsten, L., Giovanni, G.-C., Michael, F., Guadalupe, Z., et al. (2021). Deletion of the natural inhibitory protein Inh1 in Ustilago maydis has no effect on the dimeric state of the F1FO-ATP synthase but increases the ATPase activity and reduces the stability. Biochim. Biophys. Acta Bioenerg. 1862:148429. doi: 10.1016/j.bbabio.2021.148429
Mira, N. P., Lourenço, A. B., Fernandes, A. R., Becker, J. D., and Sá-Correia, I. (2009). The RIM101 pathway has a role in Saccharomyces cerevisiae adaptive response and resistance to propionic acid and other weak acids. FEMS Yeast Res. 9, 202–216. doi: 10.1111/j.1567-1364.2008.00473.x
Nakamura, J., Fujikawa, M., and Yoshida, M. (2013). IF1, a natural inhibitor of mitochondrial ATP synthase, is not essential for the normal growth and breeding of mice. Biosci. Rep. 33:e00067. doi: 10.1042/BSR20130078
Parks, D. R., Roederer, M., and Moore, W. A. (2006). A new “Logicle” display method avoids deceptive effects of logarithmic scaling for low signals and compensated data. Cytometry A 69, 541–551. doi: 10.1002/cyto.a.20258
Pullman, M. E., and Monroy, G. C. (1963). A naturally occurring inhibitor of mitochondrial adenosine triphosphatase. J. Biol. Chem. 238, 3762–3769. doi: 10.1016/S0021-9258(19)75338-1
Robinson, G. C., Bason, J. V., Montgomery, M. G., Fearnley, I. M., Mueller, D. M., Leslie, A. G. W., et al. (2013). The structure of F₁-ATPase from Saccharomyces cerevisiae inhibited by its regulatory protein IF₁. Open Biol. 3:120164. doi: 10.1098/rsob.120164
Romanova, N. A., Brovko, L. I., and Ugarova, N. N. (1997). Comparative evaluation of methods of intracellular ATP extraction from different types of microorganisms for bioluminescent determinationof microbial cells. Prikl. Biokhim. Mikrobiol. 33, 344–349.
Rouslin, W. (1987). The mitochondrial adenosine 5′-triphosphatase in slow and fast heart rate hearts. Am. J. Phys. 252, H622–H627.
Satre, M., de Jerphanion, M. B., Huet, J., and Vignais, P. V. (1975). ATPase inhibitor from yeast mitochondria. Purification and properties. Biochim. Biophys. Acta 387, 241–255. doi: 10.1016/0005-2728(75)90107-3
Schwerzmann, K., and Pedersen, P. L. (1986). Regulation of the mitochondrial ATP synthase/ATPase complex. Arch. Biochem. Biophys. 250, 1–18. doi: 10.1016/0003-9861(86)90695-8
Shedlovskiy, D., Shcherbik, N., and Pestov, D. G. (2017). One-step hot formamide extraction of RNA from Saccharomyces cerevisiae. RNA Biol. 14, 1722–1726. doi: 10.1080/15476286.2017.1345417
Sherman, F. (2002). Getting started with yeast. Methods Enzymol. 350, 3–41. doi: 10.1016/S0076-6879(02)50954-X
Van, P., Jiang, W., Gottardo, R., and Finak, G. (2018). ggCyto: next generation open-source visualization software for cytometry. Bioinformatics 34, 3951–3953. doi: 10.1093/bioinformatics/bty441
Vasilyeva, E. A., Fitin, A. F., Minkov, I. B., and Vinogradov, A. D. (1980). Kinetics of interaction of adenosine diphosphate and adenosine triphosphate with adenosine triphosphatase of bovine heart submitochondrial particles. Biochem. J. 188, 807–815. doi: 10.1042/bj1880807
Venard, R., Brèthes, D., Giraud, M.-F., Vaillier, J., Velours, J., and Haraux, F. (2003). Investigation of the role and mechanism of IF1 and STF1 proteins, twin inhibitory peptides which interact with the yeast mitochondrial ATP synthase. Biochemistry 42, 7626–7636. doi: 10.1021/bi034394t
Weissert, V., Rieger, B., Morris, S., Arroum, T., Psathaki, O. E., Zobel, T., et al. (2021). Inhibition of the mitochondrial ATPase function by IF1 changes the spatiotemporal organization of ATP synthase. Biochim. Biophys. Acta Bioenerg. 1862:148322. doi: 10.1016/j.bbabio.2020.148322
Wilson, D. F. (2017). Oxidative phosphorylation: regulation and role in cellular and tissue metabolism. J. Physiol. 595, 7023–7038. doi: 10.1113/JP273839
Keywords: ATPase, stationary phase, heterogeneity, IF1, mitochondria, FOF1, starvation recovery
Citation: Galkina KV, Zubareva VM, Kashko ND, Lapashina AS, Markova OV, Feniouk BA and Knorre DA (2022) Heterogeneity of Starved Yeast Cells in IF1 Levels Suggests the Role of This Protein in vivo. Front. Microbiol. 13:816622. doi: 10.3389/fmicb.2022.816622
Edited by:
Omar Orellana, University of Chile, ChileReviewed by:
Francisco A. Cubillos, University of Santiago, ChileAlfredo Cabrera-Orefice, Radboud University Nijmegen Medical Center, Netherlands
Copyright © 2022 Galkina, Zubareva, Kashko, Lapashina, Markova, Feniouk and Knorre. This is an open-access article distributed under the terms of the Creative Commons Attribution License (CC BY). The use, distribution or reproduction in other forums is permitted, provided the original author(s) and the copyright owner(s) are credited and that the original publication in this journal is cited, in accordance with accepted academic practice. No use, distribution or reproduction is permitted which does not comply with these terms.
*Correspondence: Dmitry A. Knorre, a25vcnJlQGJlbG96ZXJza3kubXN1LnJ1