 Ting Wang
 Xiaomin Xia
 Jiawei Chen
 Hongbin Liu
 Hongmei Jing
- 1CAS Key Laboratory for Experimental Study Under Deep-Sea Extreme Conditions, Institute of Deep-Sea Science and Engineering, Chinese Academy of Sciences, Sanya, China
- 2Key Laboratory of Tropical Marine Bio-Resources and Ecology, South China Sea Institute of Oceanology, Chinese Academy of Sciences, Guangzhou, China
- 3Department of Ocean Science, The Hong Kong University of Science and Technology, Kowloon, Hong Kong SAR, China
- 4HKUST-CAS Sanya Joint Laboratory of Marine Science Research, Chinese Academy of Sciences, Sanya, China
- 5Southern Marine Science and Engineering Guangdong Laboratory, Zhuhai, China
Synechococcus is a major contributor to global marine primary production. Here, its spatio-temporal variations in abundance and phylogenetic structure were studied at three stations of the South China Sea at both DNA and cDNA levels. Synechococcus cell abundance was lowest in March, but highest in October at two coastal stations. Its abundance was higher at the estuarine station, which reached a peak value of 1.36 × 10⁵ cells/ml in April, owing to the nitrogen nutrients discharged from the Sanya River. Gene and gene transcript abundances of four Synechococcus lineages, clades II, III, VIII, and S5.3, were studied by quantitative PCR, which showed that clade II was the most abundant lineage at both DNA and cDNA levels. High-throughput sequencing revealed that, at the DNA level, Synechococcus assemblage was dominated by clade SY4 (a novel clade defined in this study), S5.2, and clade II in the coastal waters and was dominated by freshwater/S5.2 Synechococcus, reaching a value up to 88.61% in June, in estuarine waters. Changes in salinity and nutrient concentration caused by seasonal monsoonal forcing and river discharge were the key determinants of the spatio-temporal variation in Synechococcus assemblages at the DNA level. In comparison, high dissimilation among samples at the same stations and in the same seasons leads to the imperceptible spatio-temporal variation pattern of Synechococcus assemblages at the cDNA level. Furthermore, co-occurrence networks disclosed that Synechococcus community had closer and more complex internal interactions at the cDNA level. These discrepancies highlighted the necessity to study Synechococcus assemblages at both DNA and cDNA levels.
Introduction
Marine Synechococcus represents one of the most abundant phytoplankton in the global ocean (Flombaum et al., 2013). It is widely distributed in marine ecosystems from equatorial to polar sea waters without a latitude limit (Farrant et al., 2016). Niche models even project an increase in global cell numbers of Synechococcus in the future (Flombaum et al., 2013; Schmidt et al., 2020), which may attribute to its specific accommodative strategies, such as efficient harvesting of both light and iron to sustain photosynthesis (Palenik et al., 2006; Schmidt et al., 2020). On the other hand, Synechococcus is an important component of the marine microbial food loop and contributes significantly to the primary productivity of the world’s oceans, creating 16.7% of ocean net primary production (Iturriaga and Mitchell, 1986; Flombaum et al., 2013). As a result, Synechococcus attracts increasing research attention (Palenik et al., 2006; Buitenhuis et al., 2012; Flombaum et al., 2013; Schmidt et al., 2020).
Marine Synechococcus exhibits high genetic diversity (Farrant et al., 2016; Xia et al., 2019). Gene markers, such as the 16S rRNA gene (Mackey et al., 2017), the 16S–23S internally transcribed spacer (ITS) (Li et al., 2021; Nagarkar et al., 2021), the RNA polymerase gene (rpoC1) (Kent et al., 2019; Wang et al., 2021a), the nitrate reductase gene (narB) (Robidart et al., 2012), the cytochrome b6 gene (petB) (Mazard et al., 2012), and the ribulose–1,5–bisphosphate carboxylase oxygenase gene (rbcL) (Paerl et al., 2012), have been commonly applied to study the genetic diversity of Synechococcus. Among these gene markers, ITS is the locus with the most sequences available for primer design (Ahlgren and Rocap, 2012). Meanwhile, although ITS is divergent, it contains conserved regions for the design of non-degenerate primers (Ahlgren and Rocap, 2012). The rpoC1 gene is single copy in all known genomes of Synechococcus strains and displays higher genetic resolution than the 16S rRNA gene (Mühling et al., 2006). On the basis of gene markers, like the 16S rRNA gene, marine Synechococcus strains can be classified into three major subclusters, i.e., S5.1, S5.2, and S5.3 (Dufresne et al., 2008). S5.1 as the most diversified group contains at least 20 known lineages including clades I to XVI, CRD1/CRD2, and WPC1/WPC2. (Mühling et al., 2006; Ahlgren and Rocap, 2012; Choi et al., 2013b; Ahlgren et al., 2014). In contrast, S5.2 and S5.3 contain less recognizable lineages (Choi et al., 2013a). The distribution of different Synechococcus lineages varies geographically in the global ocean (Farrant et al., 2016; Sohm et al., 2016; Xia et al., 2019). Clade II is dominant in warm subtropical and tropical open ocean. In contrast, clades I and IV are largely confined in cold waters (Zwirglmaier et al., 2007, 2008). Clade III prevails in the oligotrophic, warm open ocean, whereas clades CRD1 and CRD2 are confined in sites with limited iron, high nutrient, and low chlorophyll including equatorial upwelling regions and North Pacific sites (Ahlgren et al., 2020). In addition, temporal variation in the distribution of Synechococcus lineages has also been observed (Jing et al., 2009; Tai and Palenik, 2009; Xia et al., 2015). For example, clade I is more abundant prior to spring, whereas clades II and III only appear in late summer and winter in the California Current (Tai and Palenik, 2009); clades II and VI are the major lineages when the summer monsoon prevailed, but clades II, IX, and miyav are the dominant clades during winter in subtropical coastal waters of Hong Kong (Xia et al., 2015).
Luhuitou Peninsula (∼109.47–109.52°E, ∼18.18–18.23°N) is located in the southernmost of Sanya city, Hainan Island in South China. It has a typical tropical monsoon climate, wet from May to October but dry from November to April. Typhoons in the wet season usually bring about 90% of the annual rainfall (Zhang C. et al., 2013). Luhuitou fringing reef (109.47°E, 18.22°N, ∼3 km long and ∼0.25–0.5 km wide) is situated in the west of the Peninsula with less disturbance from human activities since the establishment of Sanya National Coral Reefs Nature Reserve in 1990 (Meixia et al., 2008; Qiu, 2013). Xiaodong Hai (∼109.50–109.51°E, ∼18.19–18.21°N) in the east of the Peninsula also has coral reefs, but its water quality is poor in comparison with Luhuitou due to the increasing number of tourists and hotel buildings along the coast (Titlyanov et al., 2019). Sanya River located in the northern part of the Peninsula suffers from serious eutrophication and pollution in recent years and is affected by the inflow of freshwater and sanitary sewage as well (Dong et al., 2010). Synechococcus has been reported as an important primary producer in the surrounding waters of the Luhuitou Peninsula; however, its community composition and distribution in these different water bodies have not been well investigated yet (Ling et al., 2013).
Previous studies have mostly investigated the community composition of Synechococcus assemblage at the DNA level, whereas only a few studies focused on it at the cDNA level (e.g., Chung et al., 2011). Considering the fact that only metabolic active cells could be identified at the cDNA level, there must be discrepancies between these two levels. To achieve a comprehensive picture of the tempo-spatial distribution of Synechococcus in tropical estuarine and coastal waters, monthly samples collected from three stations with different hydrographic conditions in the tropical Sanya waters were investigated using high-throughput sequencing and real-time quantitative polymerase chain reaction (qPCR) at both DNA and cDNA levels.
Materials and Methods
Sampling
Monthly water samples were collected from the west side of the Luhuitou Peninsula (Stn. SL1, 109.47°E, 18.21°N) together with Xiaodong Hai (Stn. SL2, 109.50°E, 18.21°N) and Sanya River estuary (Stn. SL3, 109.50°E, 18.23°N) from June 2014 to May 2015 (Supplementary Figure 1). Stns. SL1 and SL2 are at the edge of coral reefs, representing ocean-influenced coastal stations. Stn. SL3 represents the estuarine station in the Sanya River.
In each sampling, about 5 L of seawater was sequentially filtered through 3- and 0.22-μm polycarbonate filters (47 mm, EMD Millipore, Billerica, MA, United States) for DNA/RNA extraction. Filters were put in RNAlater™ Stabilization Solution (Thermo Scientific, Wilmington, DE, United States) and stored at −80°C until further analysis. To determine the cell abundance of Synechococcus, 1.8 ml of seawater was fixed with 0.5%∼1% paraformaldehyde and stored at −80°C. For nutrient measurement, water samples were filtered with 0.22-μm polycarbonate filters (47 mm, EMD Millipore, Billerica, MA, United States), and the filtered liquids were stored at −20°C until analysis. For chlorophyll a (Chl a) measurement, water samples were sequentially filtered through 20-μm, 2-μm, and GF/F glass-fiber filters under low vacuum. Filters were wrapped in aluminum foil and kept frozen at −80°C.
Measurement of Environmental Variables
Hydrographical parameters, temperature and salinity, were recorded in situ using an MC601 thermometer (Hangxin Technology Co., Ltd., China) and MASTER-S/MillM refractometer (ATAGO Co., Ltd., Japan), respectively. pH was determined using an ST300 portable pH meter (Ohaus Instruments Co., Ltd, China) in the laboratory. The concentration of nutrients, including nitrite (NO2–), ammonium (NH4+), total nitrogen (TN), silicate (SiO32–), and phosphate (PO43–), were measured with an auto-analyzer (QuAAtro, Blue Tech Co., Ltd., Tokyo, Japan). Chl a concentration was determined from the GF/F glass-fiber filter because its size is closer to Synechococcus. After extraction in 90% acetone at 4°C in the dark for 20 h, chl a concentration was determined using a Turner Designs fluorometer (model Trilogy 040) (Chen et al., 2009). Synechococcus cell abundance was counted using a Becton-Dickinson FACSCalibur flow cytometer (FCM) equipped with dual lasers of 488 and 635 nm. Forward and right-angle light scattering and four fluorescence signals were collected, saved, and analyzed using WinMDI 2.9 (Liu et al., 2014).
DNA and RNA Extraction and cDNA Synthesis
Total DNA and RNA were extracted from the 0.22-μm filters with the PureLink Genomic DNA kit (Invitrogen, Carlsbad, CA, United States) and RNA purification kit (Invitrogen) with TRIzol® Reagent, respectively. Concentrations of DNA and RNA were determined with a NanoDrop 2000C spectrophotometer (Thermo Scientific, Wilmington, DE, United States). RNA was purified with DNase I (Ambion, Life Technologies, Austin, TX, United States) and then reverse-transcribed with a SuperScript III First-strand Synthesis kit (Invitrogen). A parallel reaction without SuperScript III reverse transcription (RT) was used as a negative control (non-RT control) for the RT-PCR conducted for each sample. Residual RNA was removed by treatment with 2 U of RNase H at 37°C for 20 min. DNA and cDNA were stored at −20°C before further analysis.
Sequencing and Real-Time Quantitative Polymerase Chain Reaction
The rpoC1 gene and gene transcripts were amplified using nested PCR protocols as described previously (Mühling et al., 2006). Purified amplicons were sequenced with an Illumina HiSeq PE250 sequencer (Novogene Technology Co., Ltd, China).
The ITS gene and gene transcripts of Synechococcus clades II, III, VIII, and S5.3 were quantified via a StepOnePlus Real-Time PCR System (Applied Biosystems Inc., Carlsbad, CA, United States). Each qPCR reaction comprised 7.5 μl of 2 × SYBR® Premix Ex™ Taq II (TaKaRa Bio Inc., Shiga, Japan), 0.5 μM primer (Ahlgren and Rocap, 2012), 1 μl of DNA/cDNA as the template, 0.4 μl of ROX reference dye, and water to a total volume of 15 μl. The qPCR reactions and calibrations were performed following a protocol described previously (Ahlgren and Rocap, 2012). Triplicate qPCR reactions were performed for each sample with an efficiency range of ∼90%–105%, and the gene copy number was normalized to the quantity of the gene and gene transcripts. As a positive control, a linear plasmid was used, which was constructed using the amplified PCR products and a TOPO-TA vector cloning kit (Invitrogen). Both non-RT control and non-template control were always used as a negative control.
Bioinformatics Analysis
Raw sequencing data were processed with QIIME 2 (v.2020.8.0) (Bolyen et al., 2019). The sequences were quality-controlled and then used to create amplicon sequence variants (ASVs) using DADA2 version 1.6.0 (Callahan et al., 2016) (with the q2-dada2 plugin). Diversity indices (Shannon) were calculated on the basis of the ASV data. Then, taxonomy was assigned to ASVs using the q2-feature-classifier (Bokulich et al., 2018) on the basis of a local database (Xia et al., 2017a). There were some ASVs taxonomically close to both freshwater Synechococcus and S5.2 (Synechococcus sp. CB0101) sequences, which were defined as FS/S5.2. Representative sequences with similarity to reference sequences less than 90% were defined as unclassified. Representative sequences of unclassified ASVs in top 700 ASVs were selected to construct the maximum likelihood (ML) tree with reference sequences using IQ-TREE version 1.6.12 (Nguyen et al., 2015). The best-fit model SYM + I + G4 according to the Bayesian Information Criterion with 5,000 bootstraps was set to construct the tree.
Statistical Analyses
One-way analysis of variance with post hoc test least significant difference was performed to test the significance of differences in cell or gene abundances among samples at different stations in different seasons. Linear discriminant analysis effect size (LEfSe) analysis was performed to identify Synechococcus lineages with significant differences in relative abundance among samples at different stations in different seasons (Segata et al., 2011). Redundancy analysis (RDA) was performed with package vegan in R Language (version 3.4.2), to estimate correlations between the distributions of Synechococcus lineages and environmental variables. The proportion of different phylogenetic groups was Hellinger transformed, environmental variables were logarithm transformed, and the effects of collinearity (variance inflation factor > 10) were removed. The statistical significance of an explanatory variable added in the course of forwarding selection was tested with the Monte Carlo permutation test (9,999 permutations, p < 0.05). Box plots were drawn using Origin version 9.65. Co-occurrence networks were constructed on the basis of the Spearman’s correlation matrixes (p < 0.05) of ASVs at DNA and cDNA levels, respectively. The Fruchterman–Reingold algorithm in Gephi was used to lay out the networks (Bastian et al., 2009).
Data Available
All the rpoC1 gene sequences obtained from this study have been deposited in the National Center for Biotechnology Information Sequence Read Archive under the accession number PRJNA753587.
Results
Hydrographic Conditions
Coastal Stns. SL1 and SL2 without direct river input exhibited similar hydrographic and trophic conditions (Figure 1). Salinity was high but Chl a and nutrient concentrations (i.e., of TN, NH4+, NO2–, and SiO32–) were low at these two stations throughout the studied period. PO43– concentration was seasonally fluctuant and was higher at Stn. SL2 with stronger human activities effect. On the contrary, estuarine Stn. SL3 was strongly influenced by freshwater discharge from the Sanya River, with low salinity and Chl a concentrations. Seasonally, temperature was significantly higher in summer (June to August) (p < 0.01), whereas salinity was significantly higher in winter (December to February) at all three stations (p < 0.05). Besides, higher nutrient concentrations including TN, NH4+, NO2–, PO43–, and SiO32– were usually detected in winter.
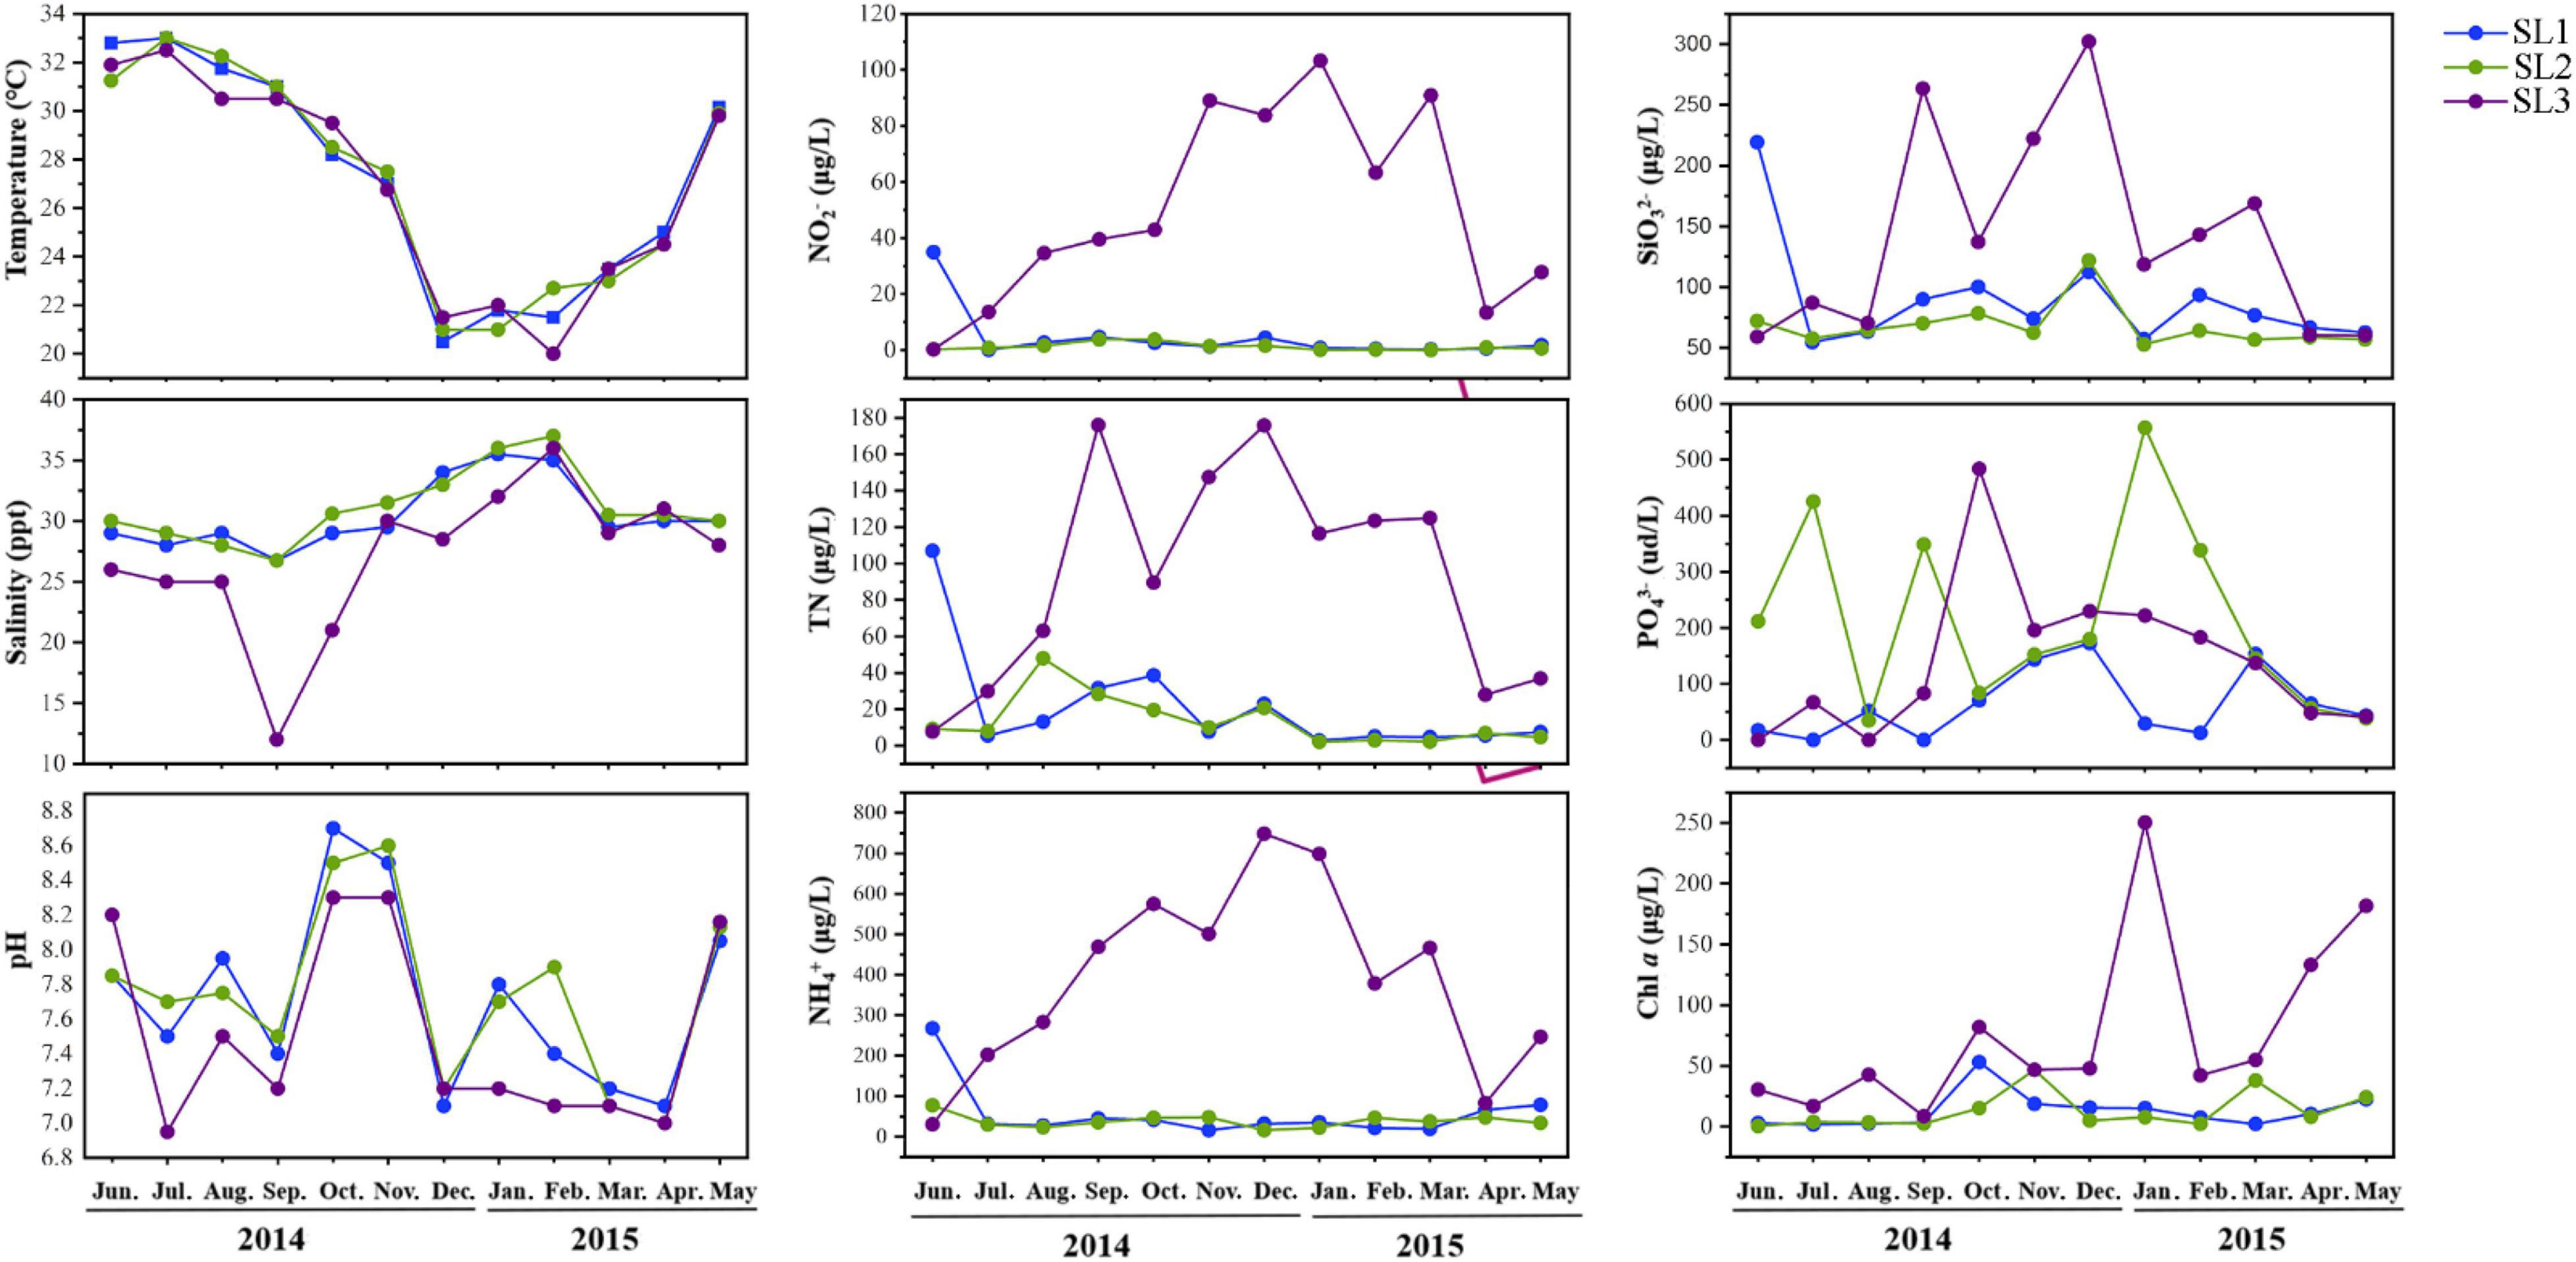
Figure 1. Environmental parameters of the three stations during the studied period.
Cell and Gene Abundance
The cell abundance of Synechococcus measured by FCM ranged from 1.59 × 10³ to 1.36 × 10⁵ cells/ml at the three sampling stations. The average cell abundance was 6.16 × 10⁴ cells/ml at estuarine Stn. SL3, which was significantly higher than that at the coastal Stns. SL1 (1.09 × 10⁴ cells/ml) and SL2 (1.80 × 10⁴ cells/ml) (p < 0.01) (Figure 2A). Coastal stations had higher Synechococcus abundance in Autumn (September to November), reaching peak values of 4.73 × 10⁴ cells/ml in September at Stn. SL1 and 6.62 × 10⁴ cells/ml in October at Stn. SL2, respectively. In comparison, estuarine Stn. SL3 had higher Synechococcus abundance in Spring (March to May) and Summer, reaching a value up to 1.36 × 10⁵ cells/ml in April.
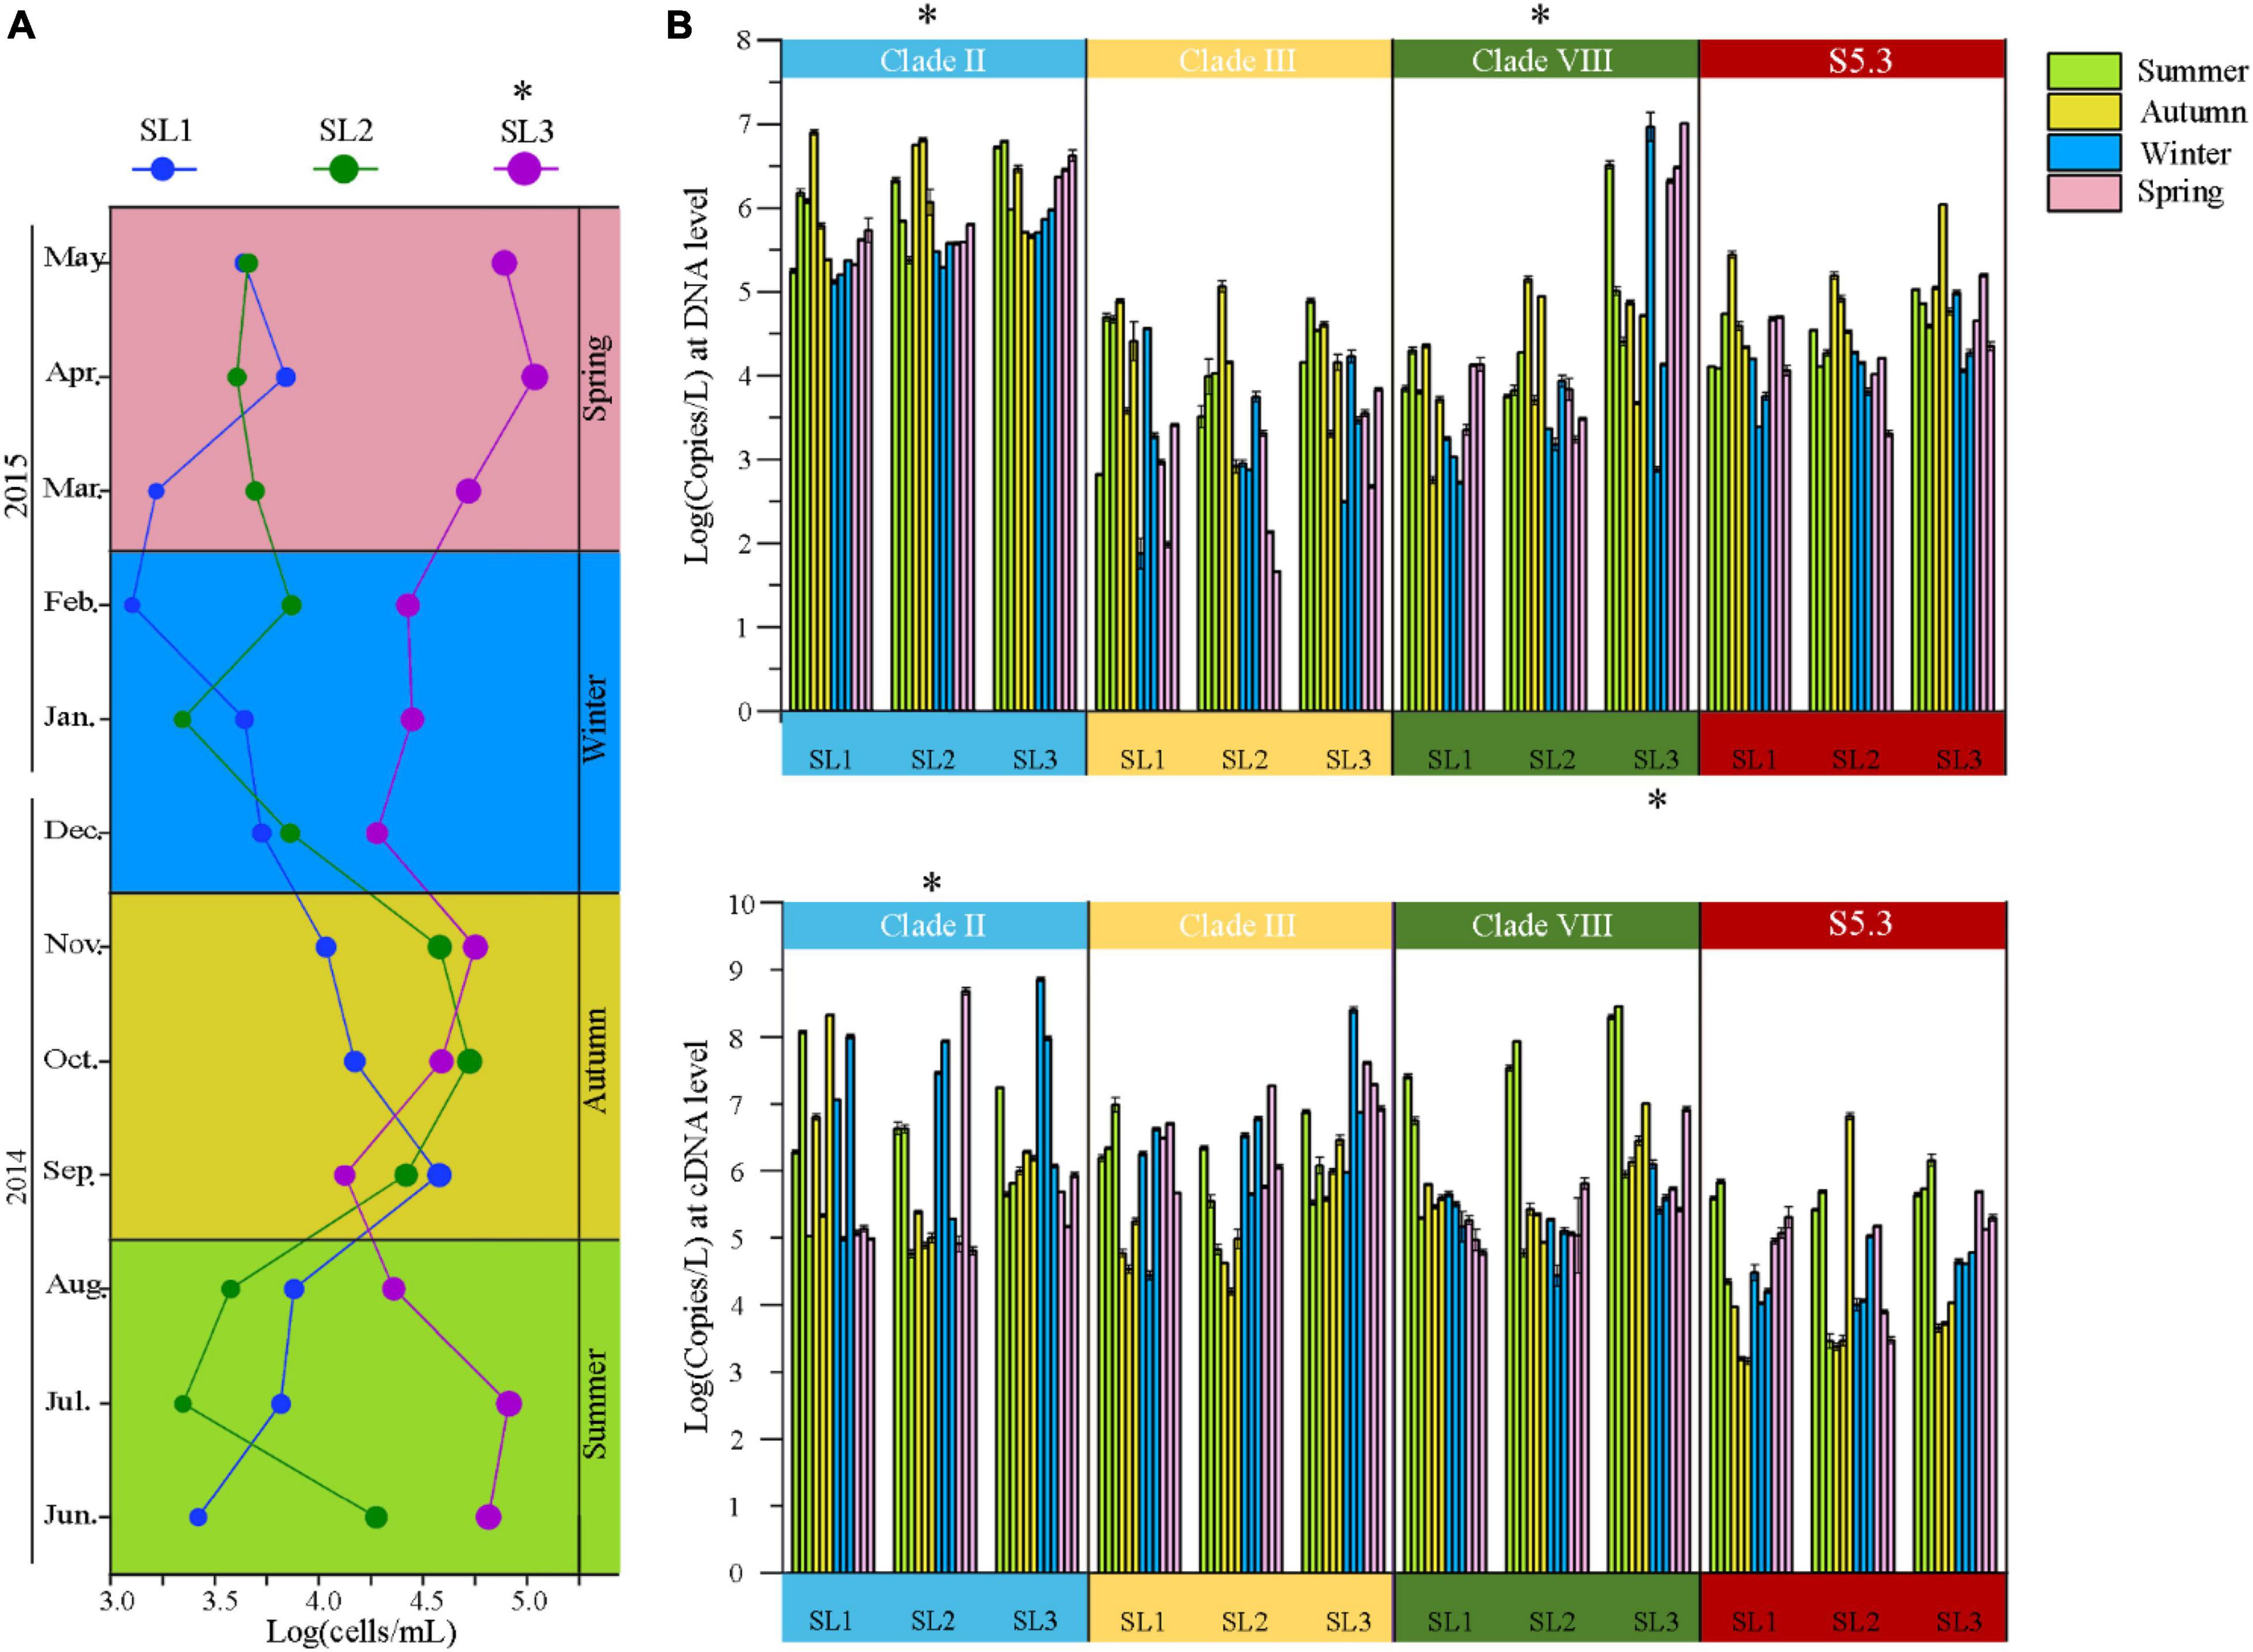
Figure 2. (A) Temporal variation of Synechococcus cell abundance at three stations. (B) Gene (top panel) and gene transcript (bottom panel) abundance of Synechococcus lineages at three stations. * – p < 0.05; Summer, June to August; Autumn, September to November; Spring, December to February; Winter, March to May.
The gene abundance of Synechococcus S5.1 clades II, III, and VIII as well as S5.3 ranged from 4.79 × 101 to 1.06 × 10⁷ copies/L (Figure 2B). Generally, Synechococcus clade II had the highest gene abundance, reaching 1.73 × 10⁶ copies/L on average at three stations. The gene abundance of clade VIII was also high, with an average of 8.25 × 10⁵ copies/L at three stations. Comparatively, that of clade III and S5.3 was only 1.81 and 8.07 × 10⁵ copies/L, respectively. Spatially, we found significantly higher gene abundances of clade VIII at Stn. SL3 than that at the two coastal stations. Seasonally, clades II and S5.3 had higher gene abundance from September to November, whereas clade III was more abundant from June to August than that in other months (Supplementary Figure 2).
As for the gene transcript, the abundance of four detected lineages was from 1.50 × 10³ to 7.27 × 10⁸ copies/L (Figure 2B). The gene transcript abundance of clade II was also significantly higher than other three lineages at three stations (p < 0.05). Higher gene transcript abundance of clade III was found from March to May, whereas clade VIII from June to August. Generally, the metabolic activity of clade III was the highest, especially from March to May (p < 0.05), as indicated by the cDNA/DNA ratio (Supplementary Figure 2). Significantly higher metabolic activity of the clade VIII was also detected from June to August (p < 0.05).
Community Diversity and Phylogeny
High-throughput sequencing generated ∼1.6 million high-quality reads from all 36 samples (Table 1). These reads were further assigned to 8,228 ASVs. Samples at the DNA level had much higher ASV number and Shannon index than those at the cDNA level. At the DNA level, ASV number ranged from 145 (SL3, June) to 490 (SL1, August) and Shannon index ranged from 4 (SL1, January) to 5.23 (SL1, August). Higher ASV number and Shannon index usually appeared at coastal Stns. SL1 and SL2. Seasonally, ASV number and Shannon index were higher in summer at coastal stations, whereas in winter at the estuarine station. On the other hand, at the cDNA level, ASV number ranged from 59 (SL1, December) to 523 (SL2, February) and Shannon index ranged from 0.83 (SL2, January) to 5.29 (SL3, January). Higher ASV number was found at Stn. SL2 (205 on average), whereas higher Shannon index was shown at Stn. SL3 (3.06 on average). Seasonally, both higher ASV number and Shannon index were found in winter at three stations.
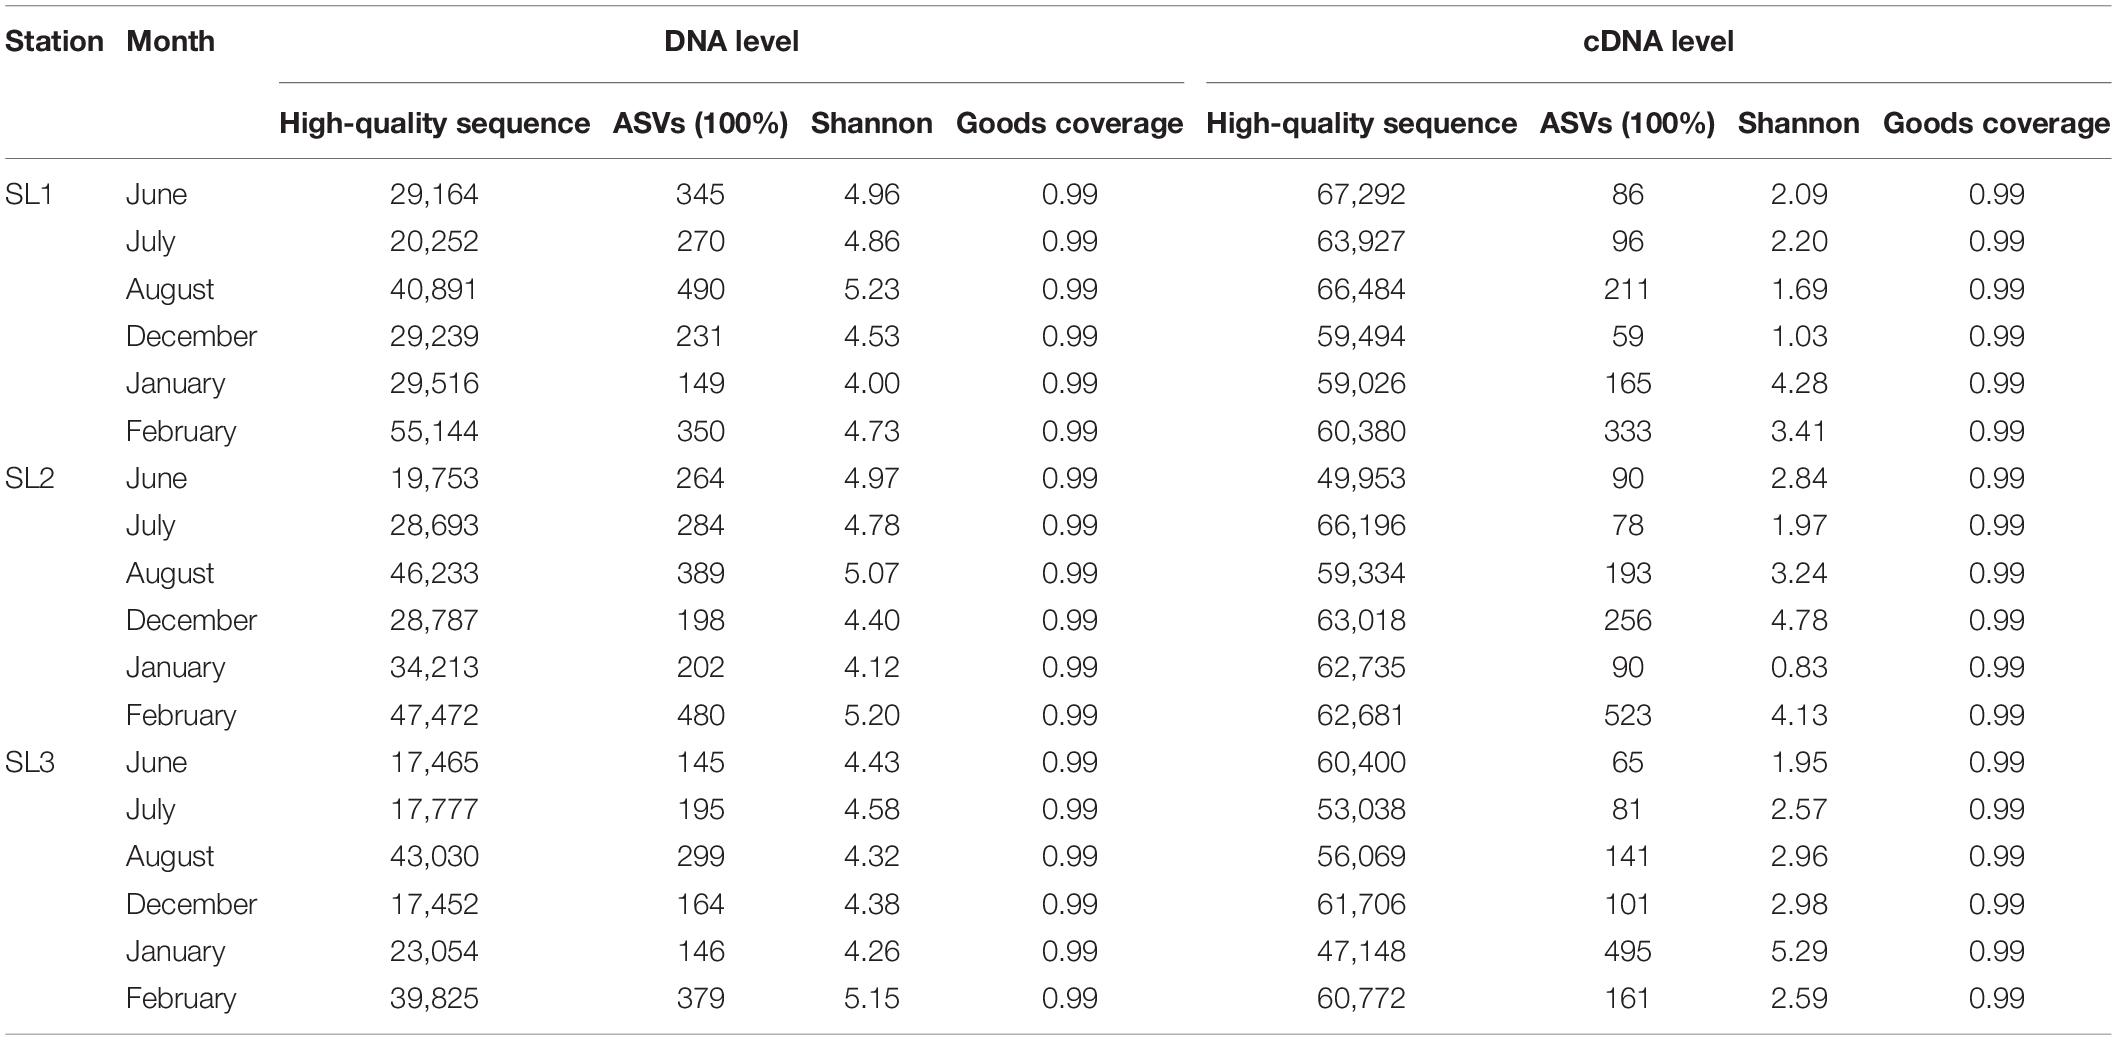
Table 1. Results of rpoC1 amplicon sequencing at DNA and cDNA levels.
Four novel clades, SY1 to SY4, belonging to Synechococcus S5.1 were identified from the ML phylogenetic tree (Supplementary Figure 3). Both clades SY1 and SY2 contained 15 ASVs, which were phylogenetically closed to clades CRD2 (average phylogenetical distances were 13.4% and 12.4%, respectively). Clade SY3, which included only one ASV, was phylogenetically closed to some rare clades, such as WPC1 (average phylogenetical distance 10.0%). Finally, 24 ASVs fell into the last novel clade, SY4, which had a close phylogenetic distance to clade XVI (14.1%).
Spatio-Temporal Variations of Synechococcus Community Composition
At the DNA level, a total of 25 Synechococcus lineages were detected at three stations, including the four novel clades (Figure 3A). The community structure showed a similar pattern at coastal Stns. SL1 and SL2. The most dominant lineage was clade SY4, followed by S5.2 and clade II at the coastal waters. Among them, clade SY4 was more abundant in winter at both two stations. Especially at Stn. SL1, clade SY4 occupied 35.49% of the total Synechococcus community in winter. S5.2 reached a peak of 16.26% in January at Stn. SL1, and 27.54% in December at Stn. SL2. Clade II had a higher proportion in July (24.18%) at Stn. SL1 and in February (29.08%) at Stn. SL2. On the contrary, the community structure at estuarine Stn. SL1 was different to that at coastal stations at the DNA level. FS/S5.2 was the absolute predominant lineage, reaching 73.61% on average in all estuarine samples. Besides, six clades, including clades UC-A, PAC2, CRD2, SY3, XX, and XVI, were absent in the estuarine station at the DNA level.
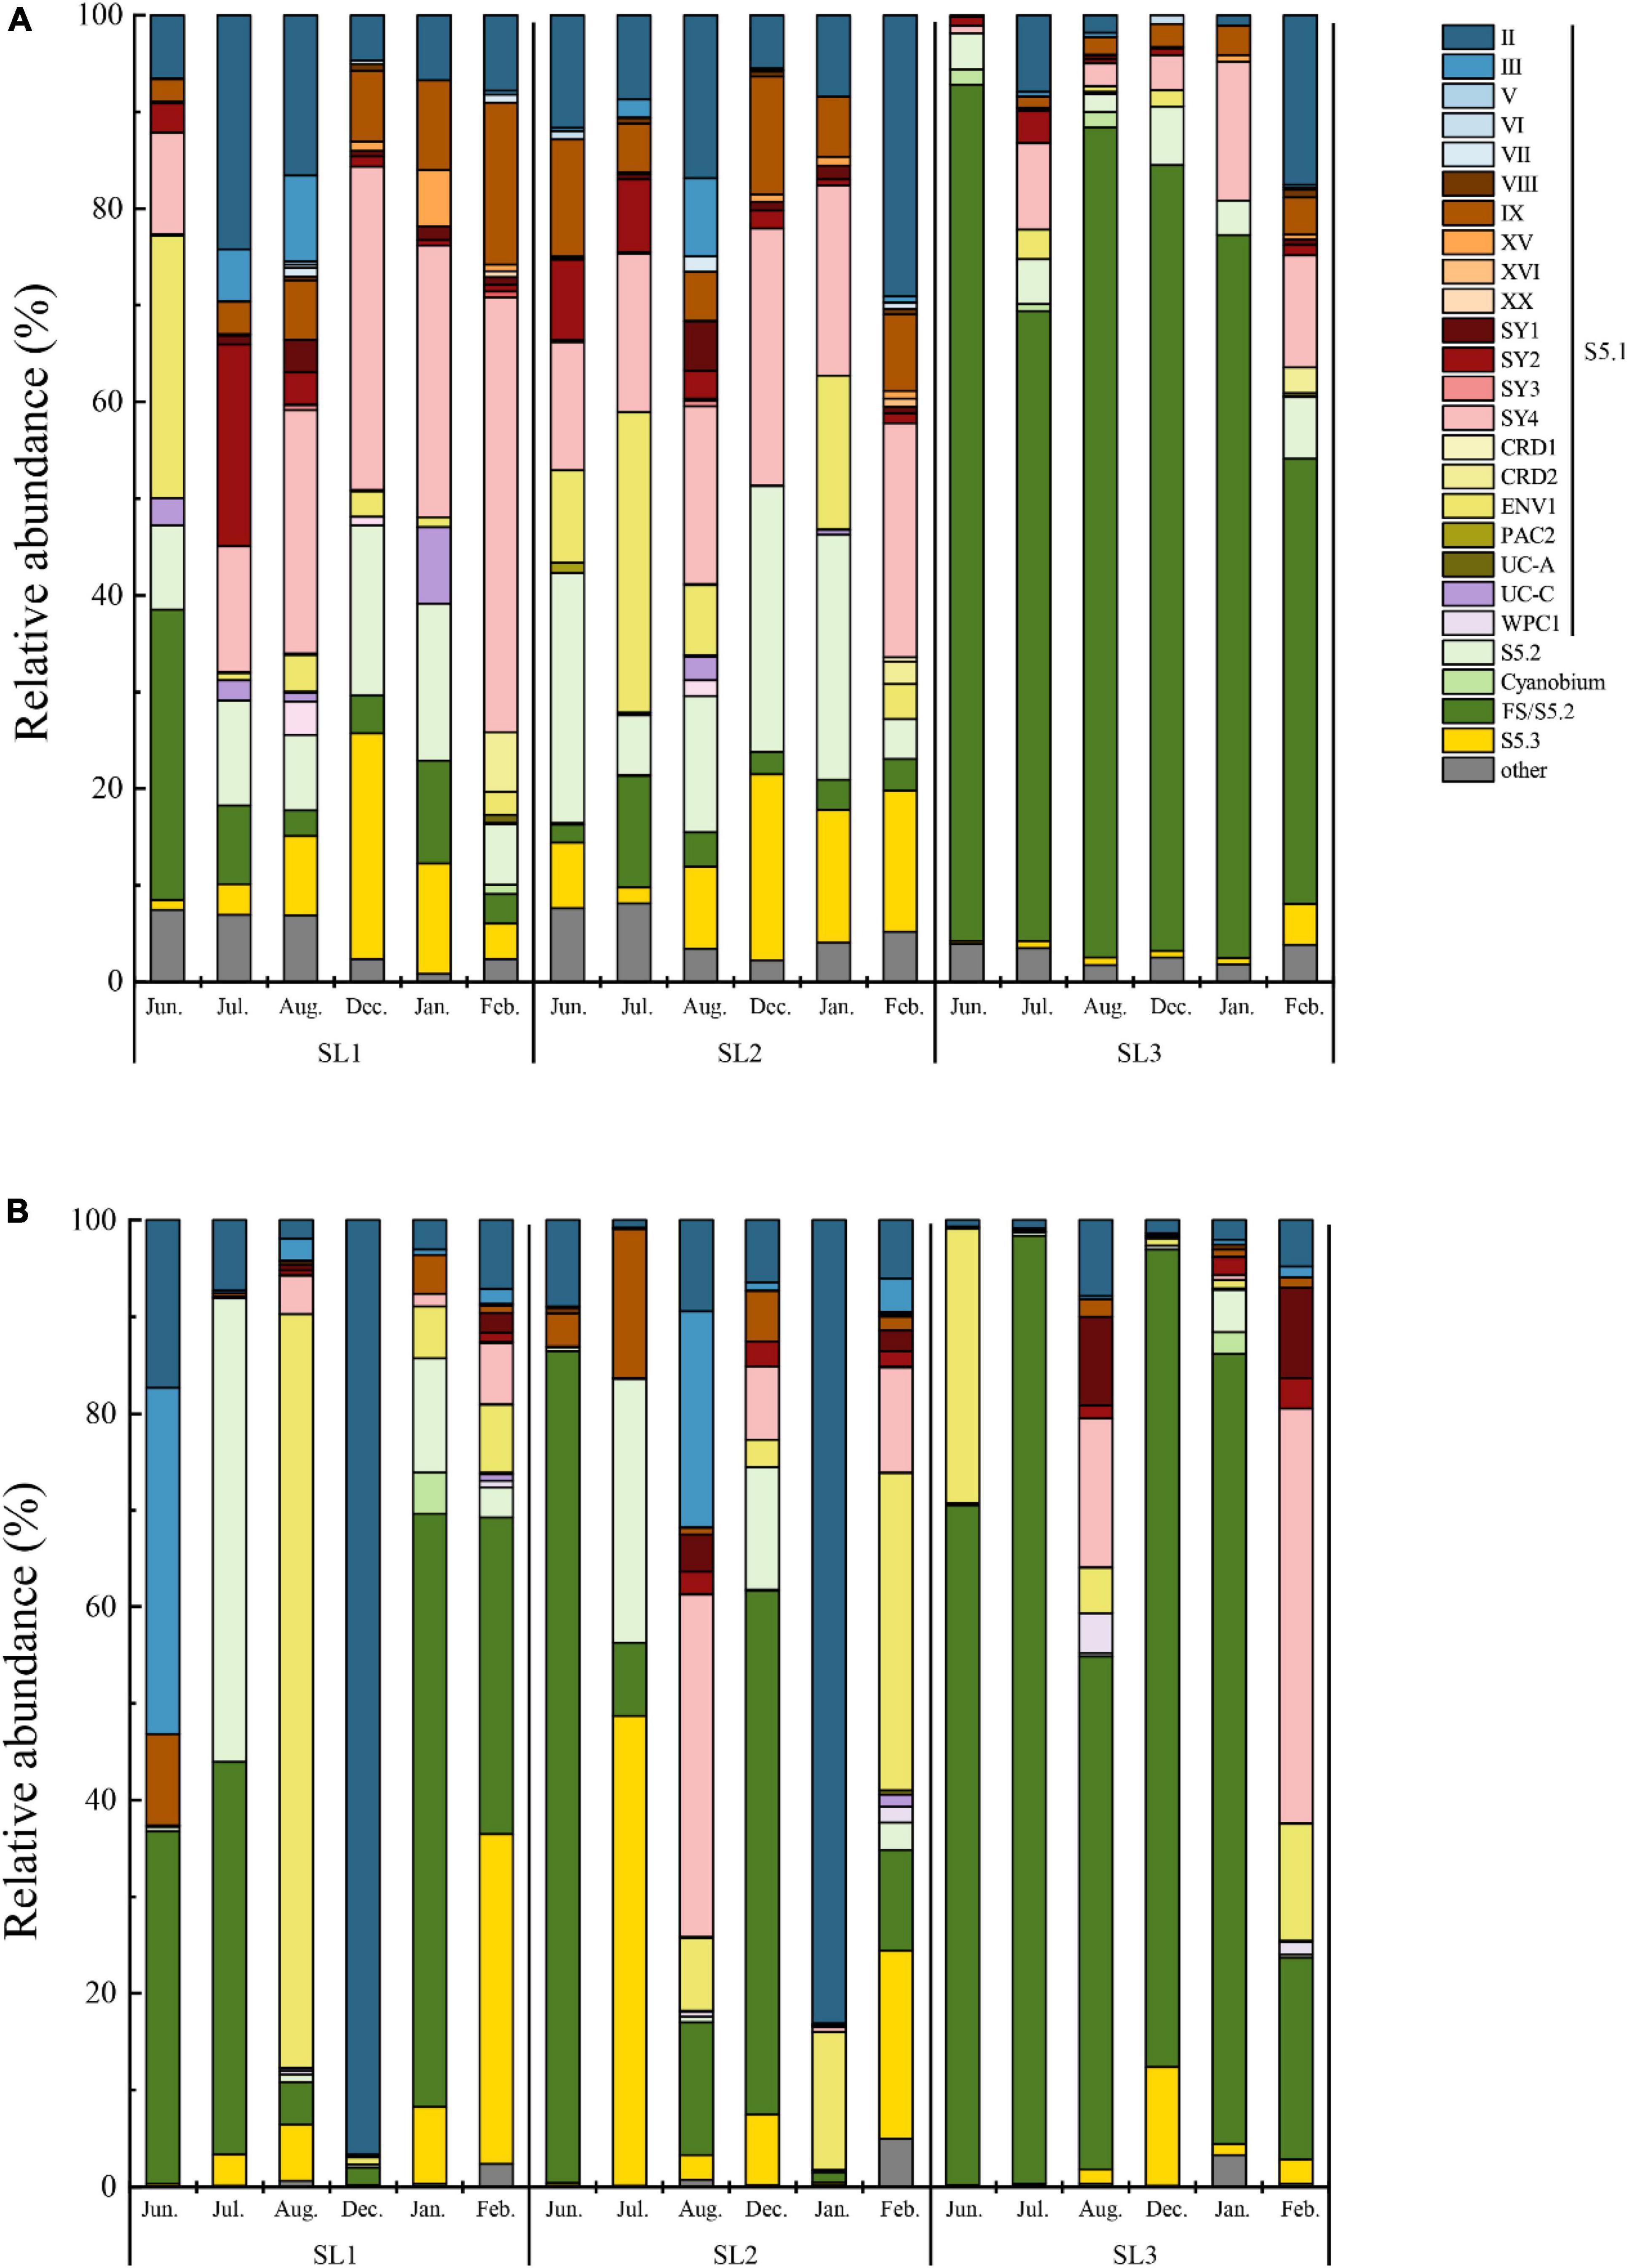
Figure 3. Community structure of Synechococcus assemblages at DNA (A) and cDNA (B) levels.
At the cDNA level, only a total of 22 Synechococcus lineage were detected at three stations, in which clades PAC2, CRD2, and XX were absent (Figure 3B). Furthermore, clade XVI was not detected at coastal Stns. SL1 and SL2, whereas clades V and VII were not detected at estuarine Stn. SL3. The dominant lineage changed to FS/S5.2, followed by clades II and ENV1 at the coastal waters at the cDNA level. The average percentage of FS/S5.2 was only 29.20% in all coastal samples, whereas, it was increased in some months, such as in June at Stn. SL2 (86.13%). Similarly, clade II had high proportions in December at Stn. SL1 (96.67%) and in January at Stn. SL2 (83.10%), but kept low proportions (commonly less than 10%) in other samples. Clade ENV1 had high relative abundance in August at Stn. SL1 (77.92%). Although clade SY4 dominated Synechococcus communities in the coastal stations at the DNA level, it had a low relative abundance at the cDNA level, except in August at SL2. Compared to the wide distribution of S5.2 at the DNA level, S5.2 was only found with high proportions in a few samples of coastal stations at the cDNA level. On the other hand, FS/S5.2 was also the absolutely predominant lineage, reaching 68.10% on average in all estuarine samples at the cDNA level, which was lower than that at the DNA level. Furthermore, compared to that at the DNA level, a higher abundance of clade SY4 in February and clade ENV1 in June was found at Stn. SL3 at the cDNA level.
LEfSe analysis demonstrated that there were eight differential lineages between DNA and its corresponding cDNA, and all of them were with higher proportions at the DNA level (Figure 4A). Significantly differential lineages among stations or seasons were detected only at the DNA level (p < 0.05) (Figure 4B). At the DNA level, clade SY2 was the differential lineage that had significantly higher relative abundance in summer at Stn. SL1; Clades XV, IX, and SY4 had significantly higher relative abundance in winter at Stn. SL1; the total percentage of each clade of S5.1 was significantly higher in summer at Stn. SL2; S5.3 had significantly higher relative abundance in winter at Stn. SL2; and FS/S5.2 had significantly higher relative abundance in summer at estuarine Stn. SL3.
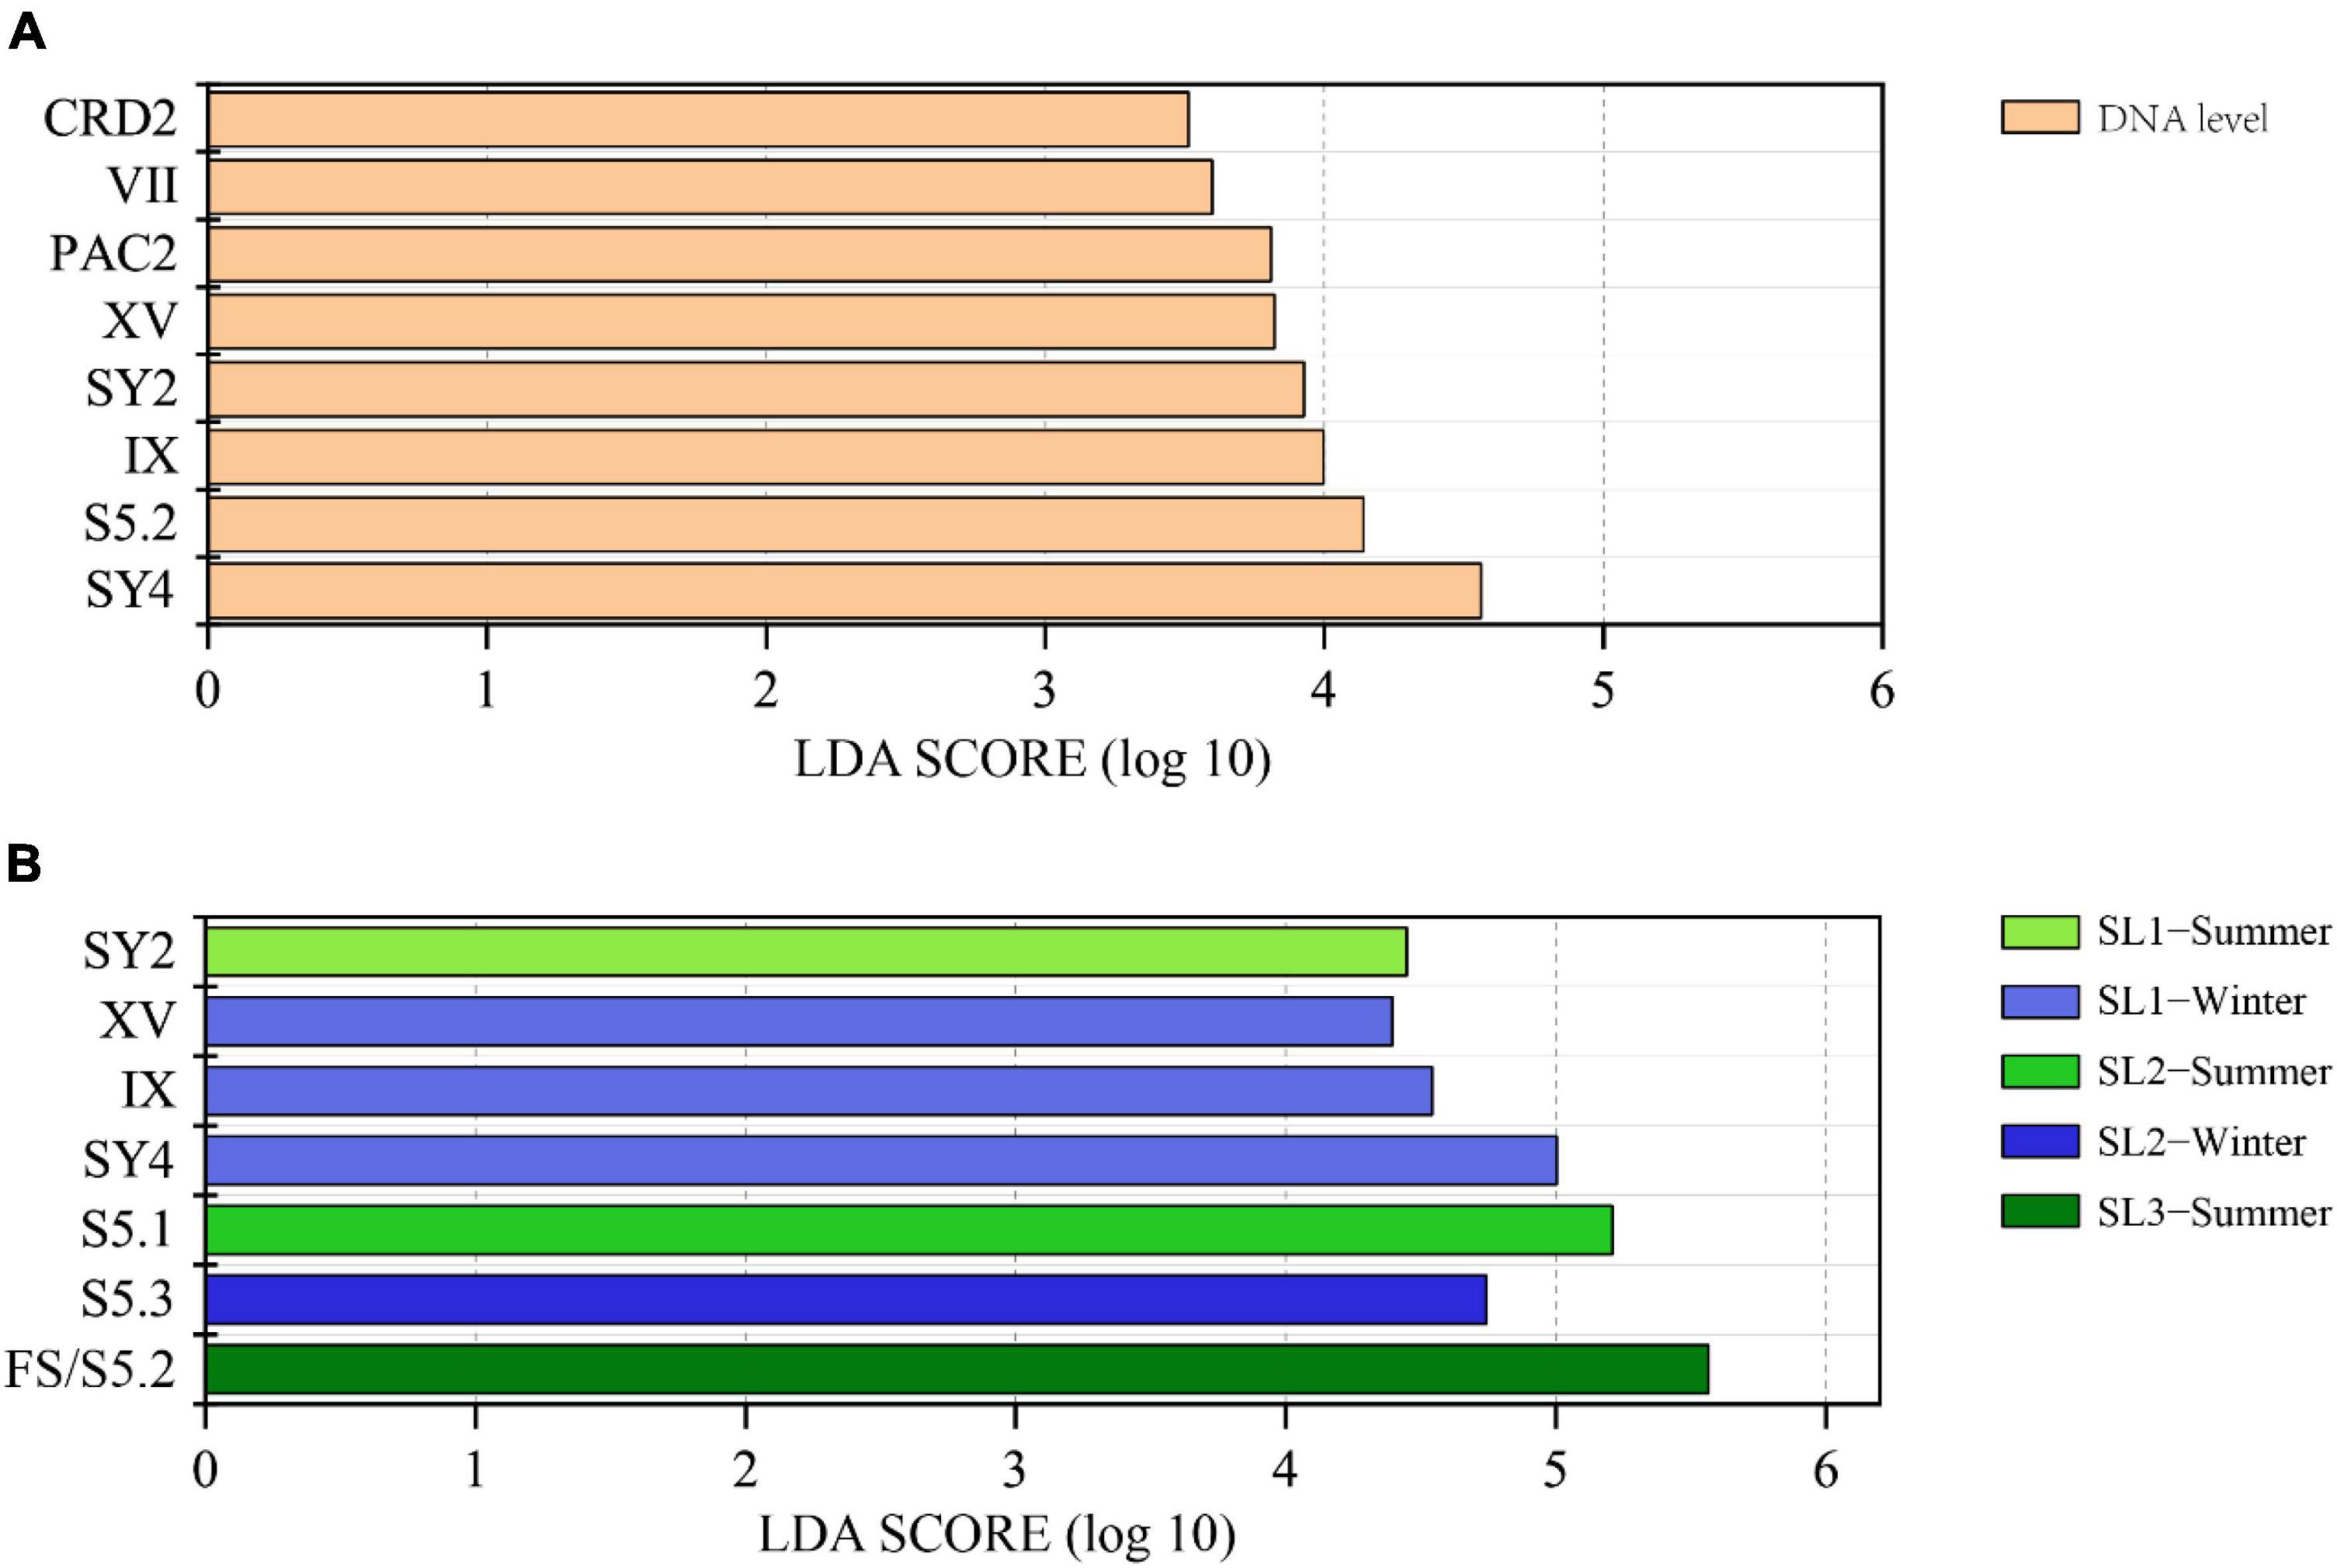
Figure 4. (A) LEfSe analysis showing the Linear Discriminant Analysis (LDA) score between DNA and cDNA levels. (B) LEfSe analysis showing the LDA score among stations and between seasons at the DNA level.
Environmental Effects
Spearman’s correlation analysis revealed that Synechococcus cell abundance was positively correlated with the concentrations of NO2–, TN, NH4+, and Chl a (p < 0.01) (Figure 5A). Gene abundances of the four Synechococcus lineages significantly correlated with most environmental variables (p < 0.05), including NO2–, TN, NH4+, temperature, and salinity. The correlations among gene abundances and salinity were always negative, but correlations among gene abundances and other environmental variables were usually positive. Only gene abundance of S5.3 was significantly correlated with SiO32–, and no gene abundance was significantly correlated with pH and Chl a. In comparison, there were less significant correlations between gene transcription abundances and environmental variables (Figure 5B). It was only found that gene transcript abundance of clade VIII was correlated with the concentrations of NO2–, TN, NH4+, temperature, and salinity, and that of clade III was correlated with pH.
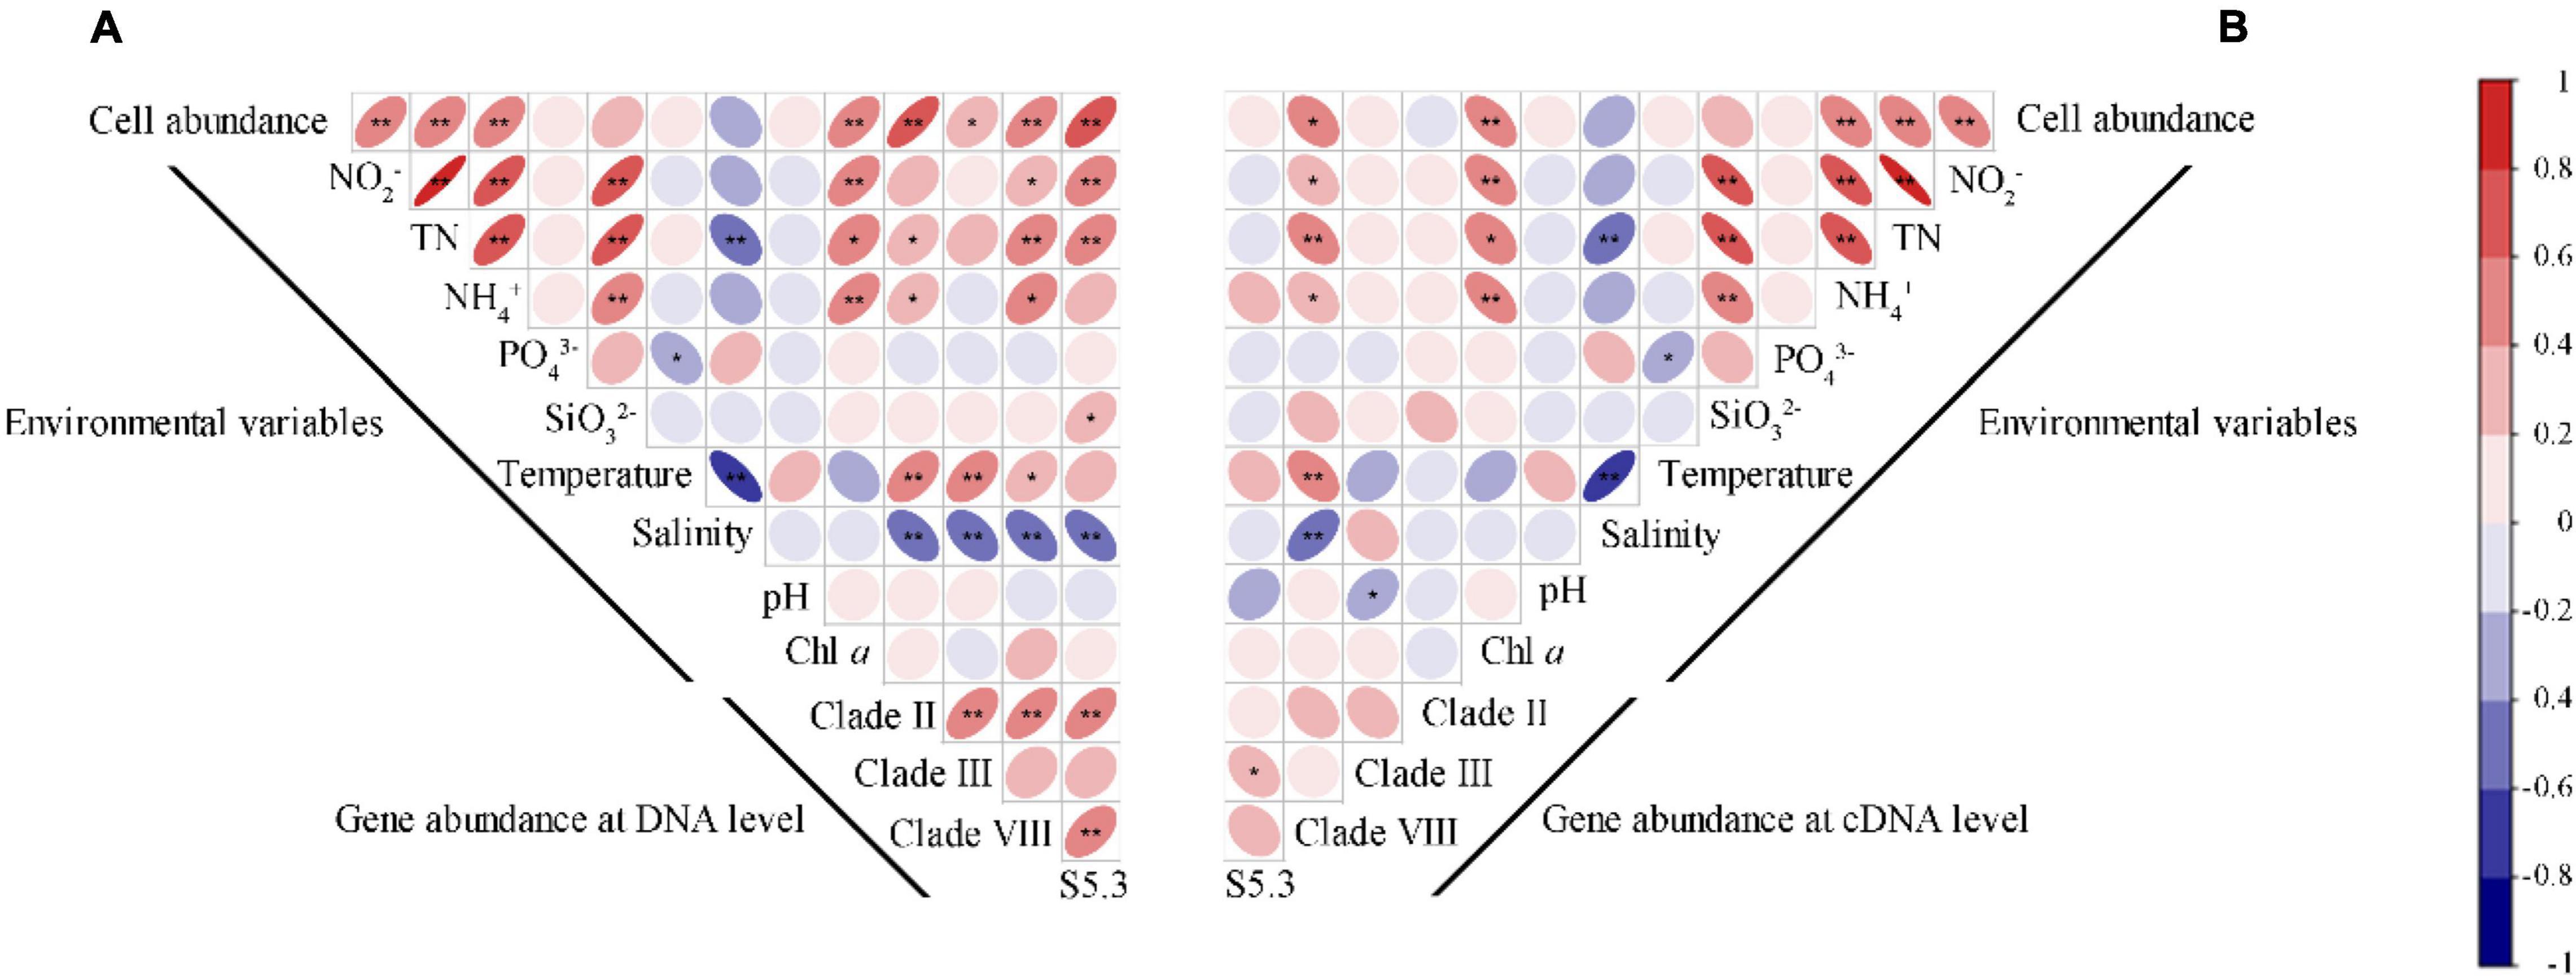
Figure 5. Spearman correlations between the gene (A) and gene transcript (B) abundance of Synechococcus lineages with Synechococcus cell abundance and environmental variables. * – p < 0.05; ** – p < 0.01.
At the DNA level, the first two axes of RDA on the basis of relative abundances of Synechococcus lineages with associated environmental parameters together explained 60.05% of the total variance (Figure 6A). It demonstrated that salinity (p < 0.01), cell abundance (p < 0.01), Chl a (p < 0.01), as well as concentrations of TN (p < 0.05) and NH4+ (p < 0.01) were the key environmental parameters that significantly influence the community structure of Synechococcus assemblage at the DNA level. Samples at coastal Stns. SL1 and SL2 were clustered on the left side, separated from those at estuarine Stn. SL3. Seasonally, the samples in summer were separated from those in winter, no matter at estuarine or coastal stations. Comparatively, the first two axes of RDA together only explained 35.67% of the total variance at the cDNA level (Figure 6B). It demonstrated that cell abundance was the only key environmental parameter that significantly influences the community structure at the cDNA level (p < 0.05). No obvious clustering was observed at the cDNA level.
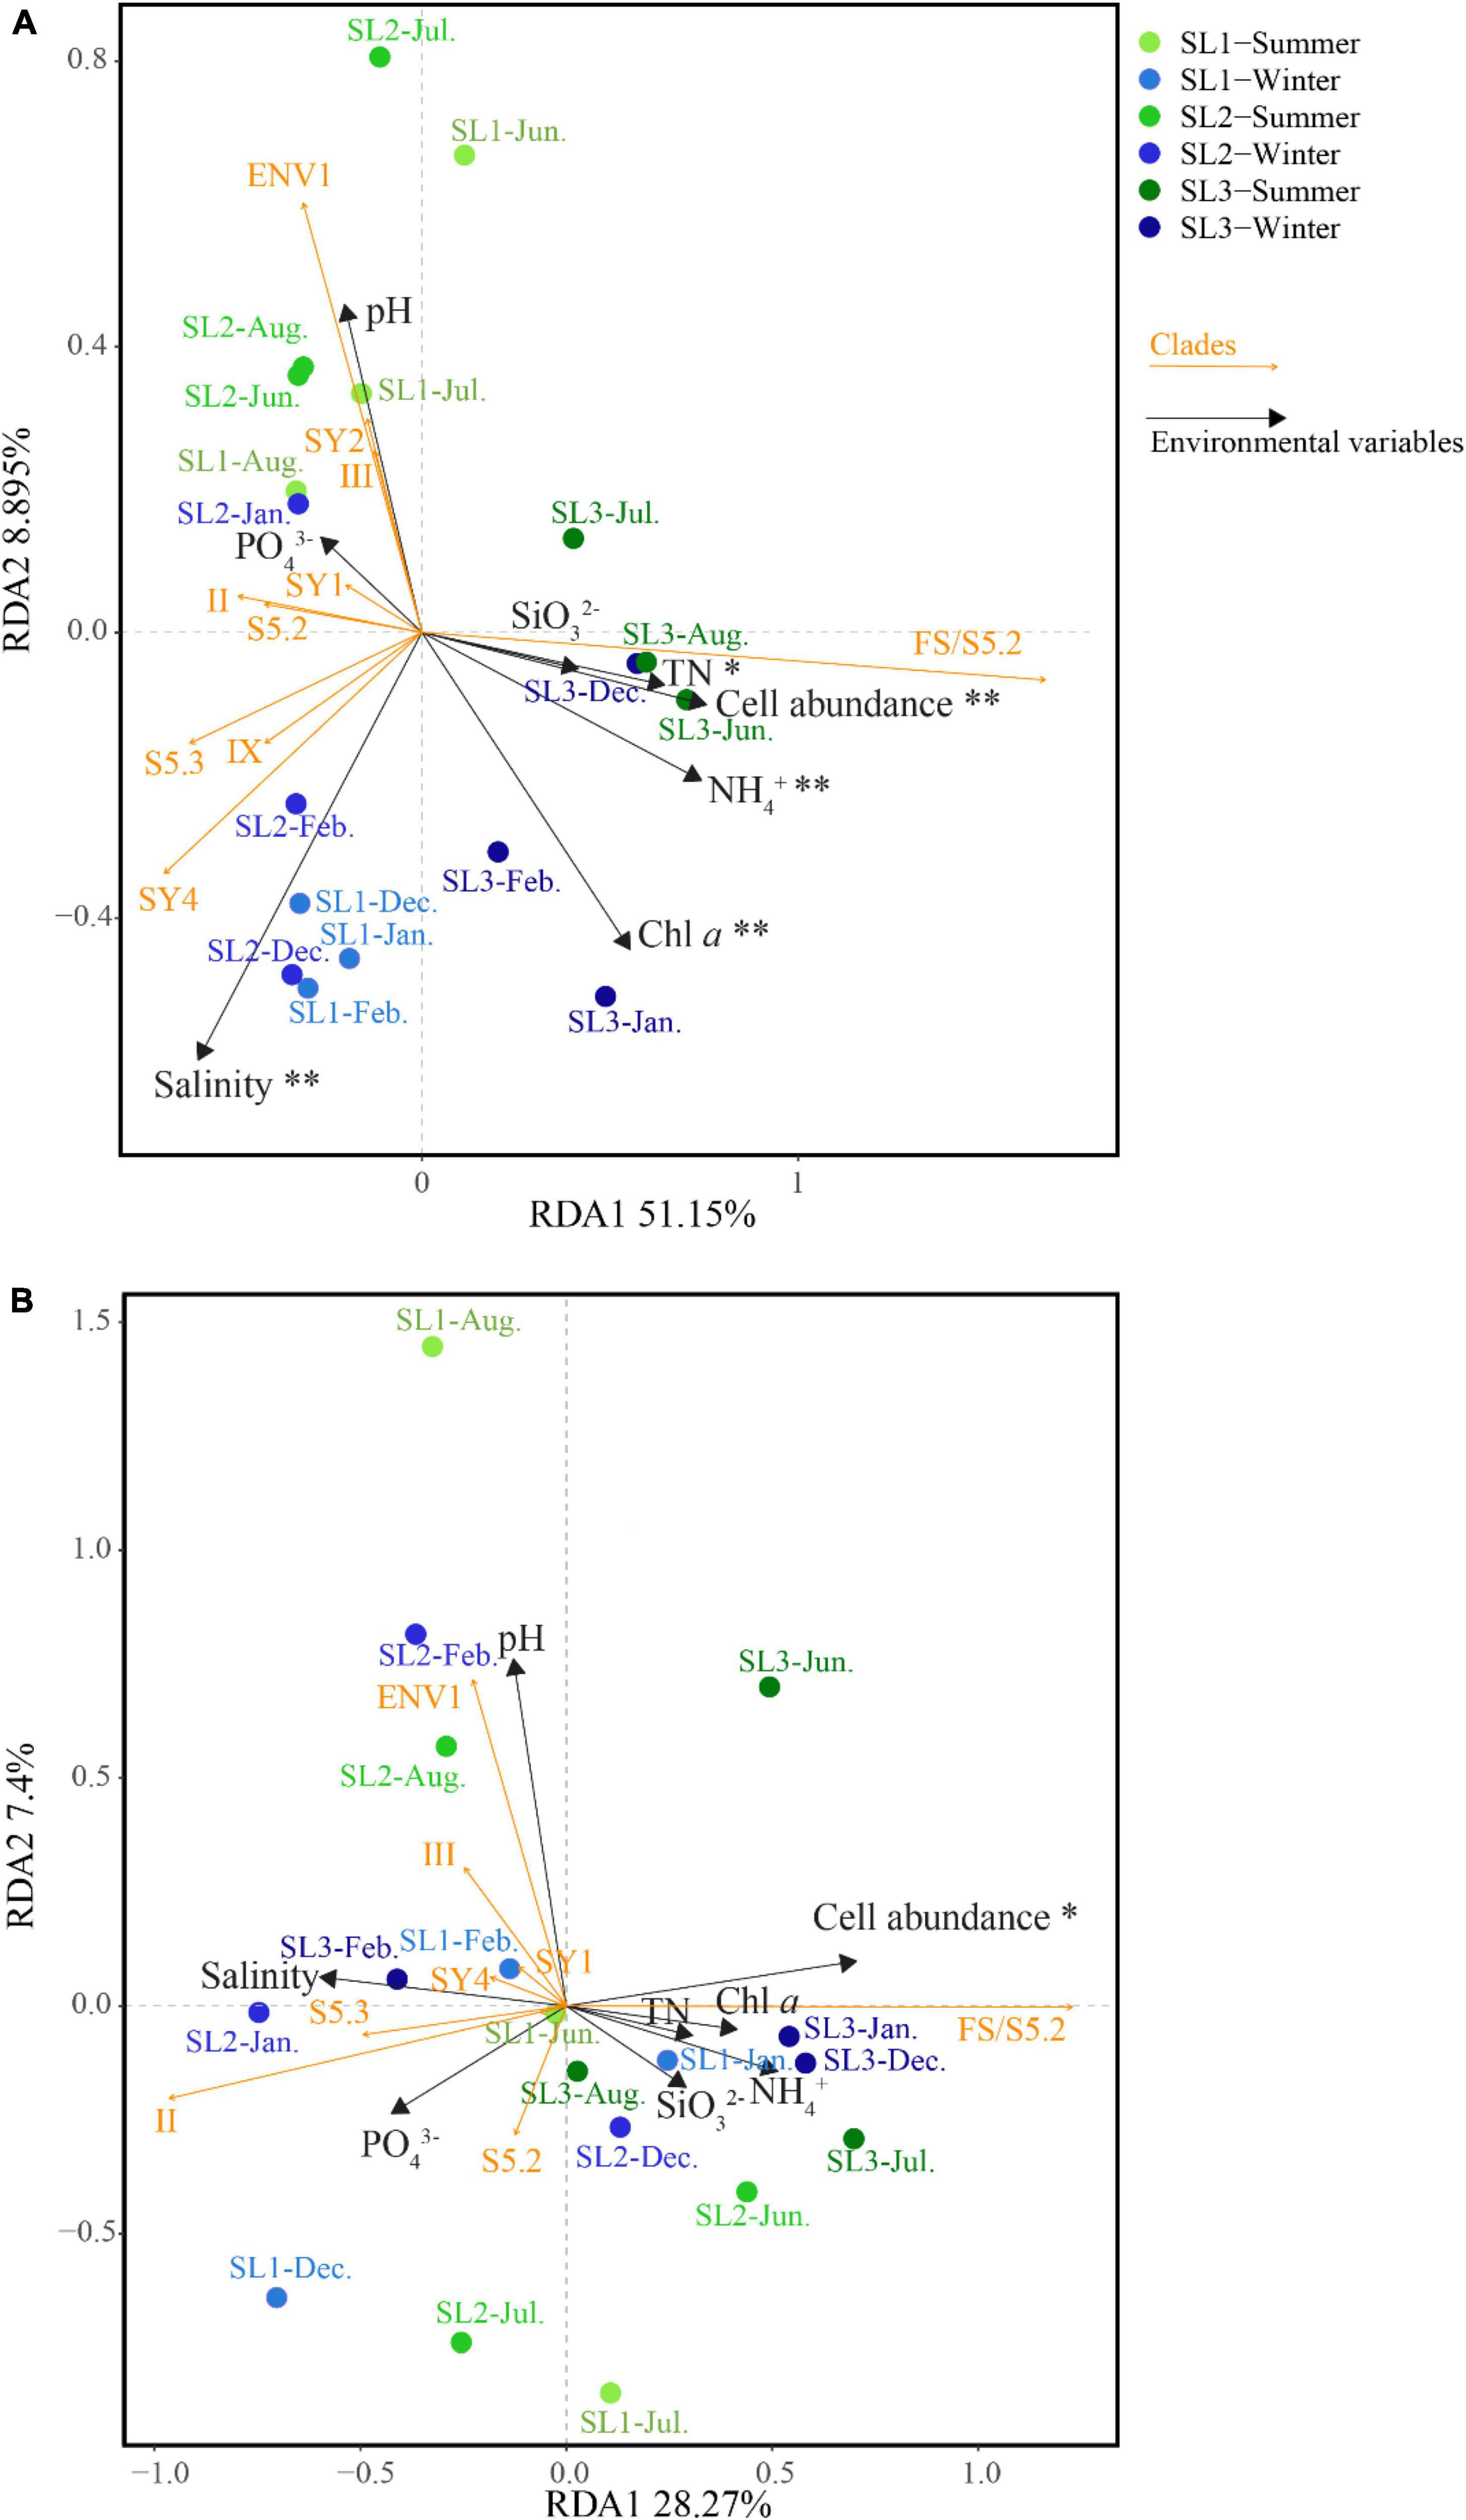
Figure 6. Correlation plots based on the RDA revealing the relationship among stations, environmental variables, and Synechococcus lineages at DNA (A) and cDNA (B) levels. * – p < 0.05; ** – p < 0.01.
Network Analyses
Co-occurrence networks were constructed to reveal the ecological interactions among ASVs in Synechococcus communities at both DNA (Figure 7A) and cDNA (Figure 7B) levels. There were 523 nodes and 14,995 edges (average degree of 59.34) and 440 nodes and 26,555 edges (average degree of 122.71) in networks of Synechococcus communities at DNA and cDNA levels, respectively (Supplementary Table 1). Positive correlations occupied 89.28% and 86.91% of total correlations in Synechococcus communities at DNA and cDNA levels, respectively. Topological indices, including average path length, modularity, and the number of sub-communities, were higher in the network at the DNA level than those at the cDNA level. However, Synechococcus community at the cDNA level has a higher clustering coefficient than that at the DNA level. Depending on closeness centrality scores, keystone ASVs in networks were identified. The top three keystone ASVs were all affiliated in Synechococcus FS/S5.2 (values ranged from 0.53 to 0.54) at the DNA level, whereas those were affiliated in Synechococcus lineages of S5.3, clade SY3, and WPC1, at the cDNA level (values were all 0.65).
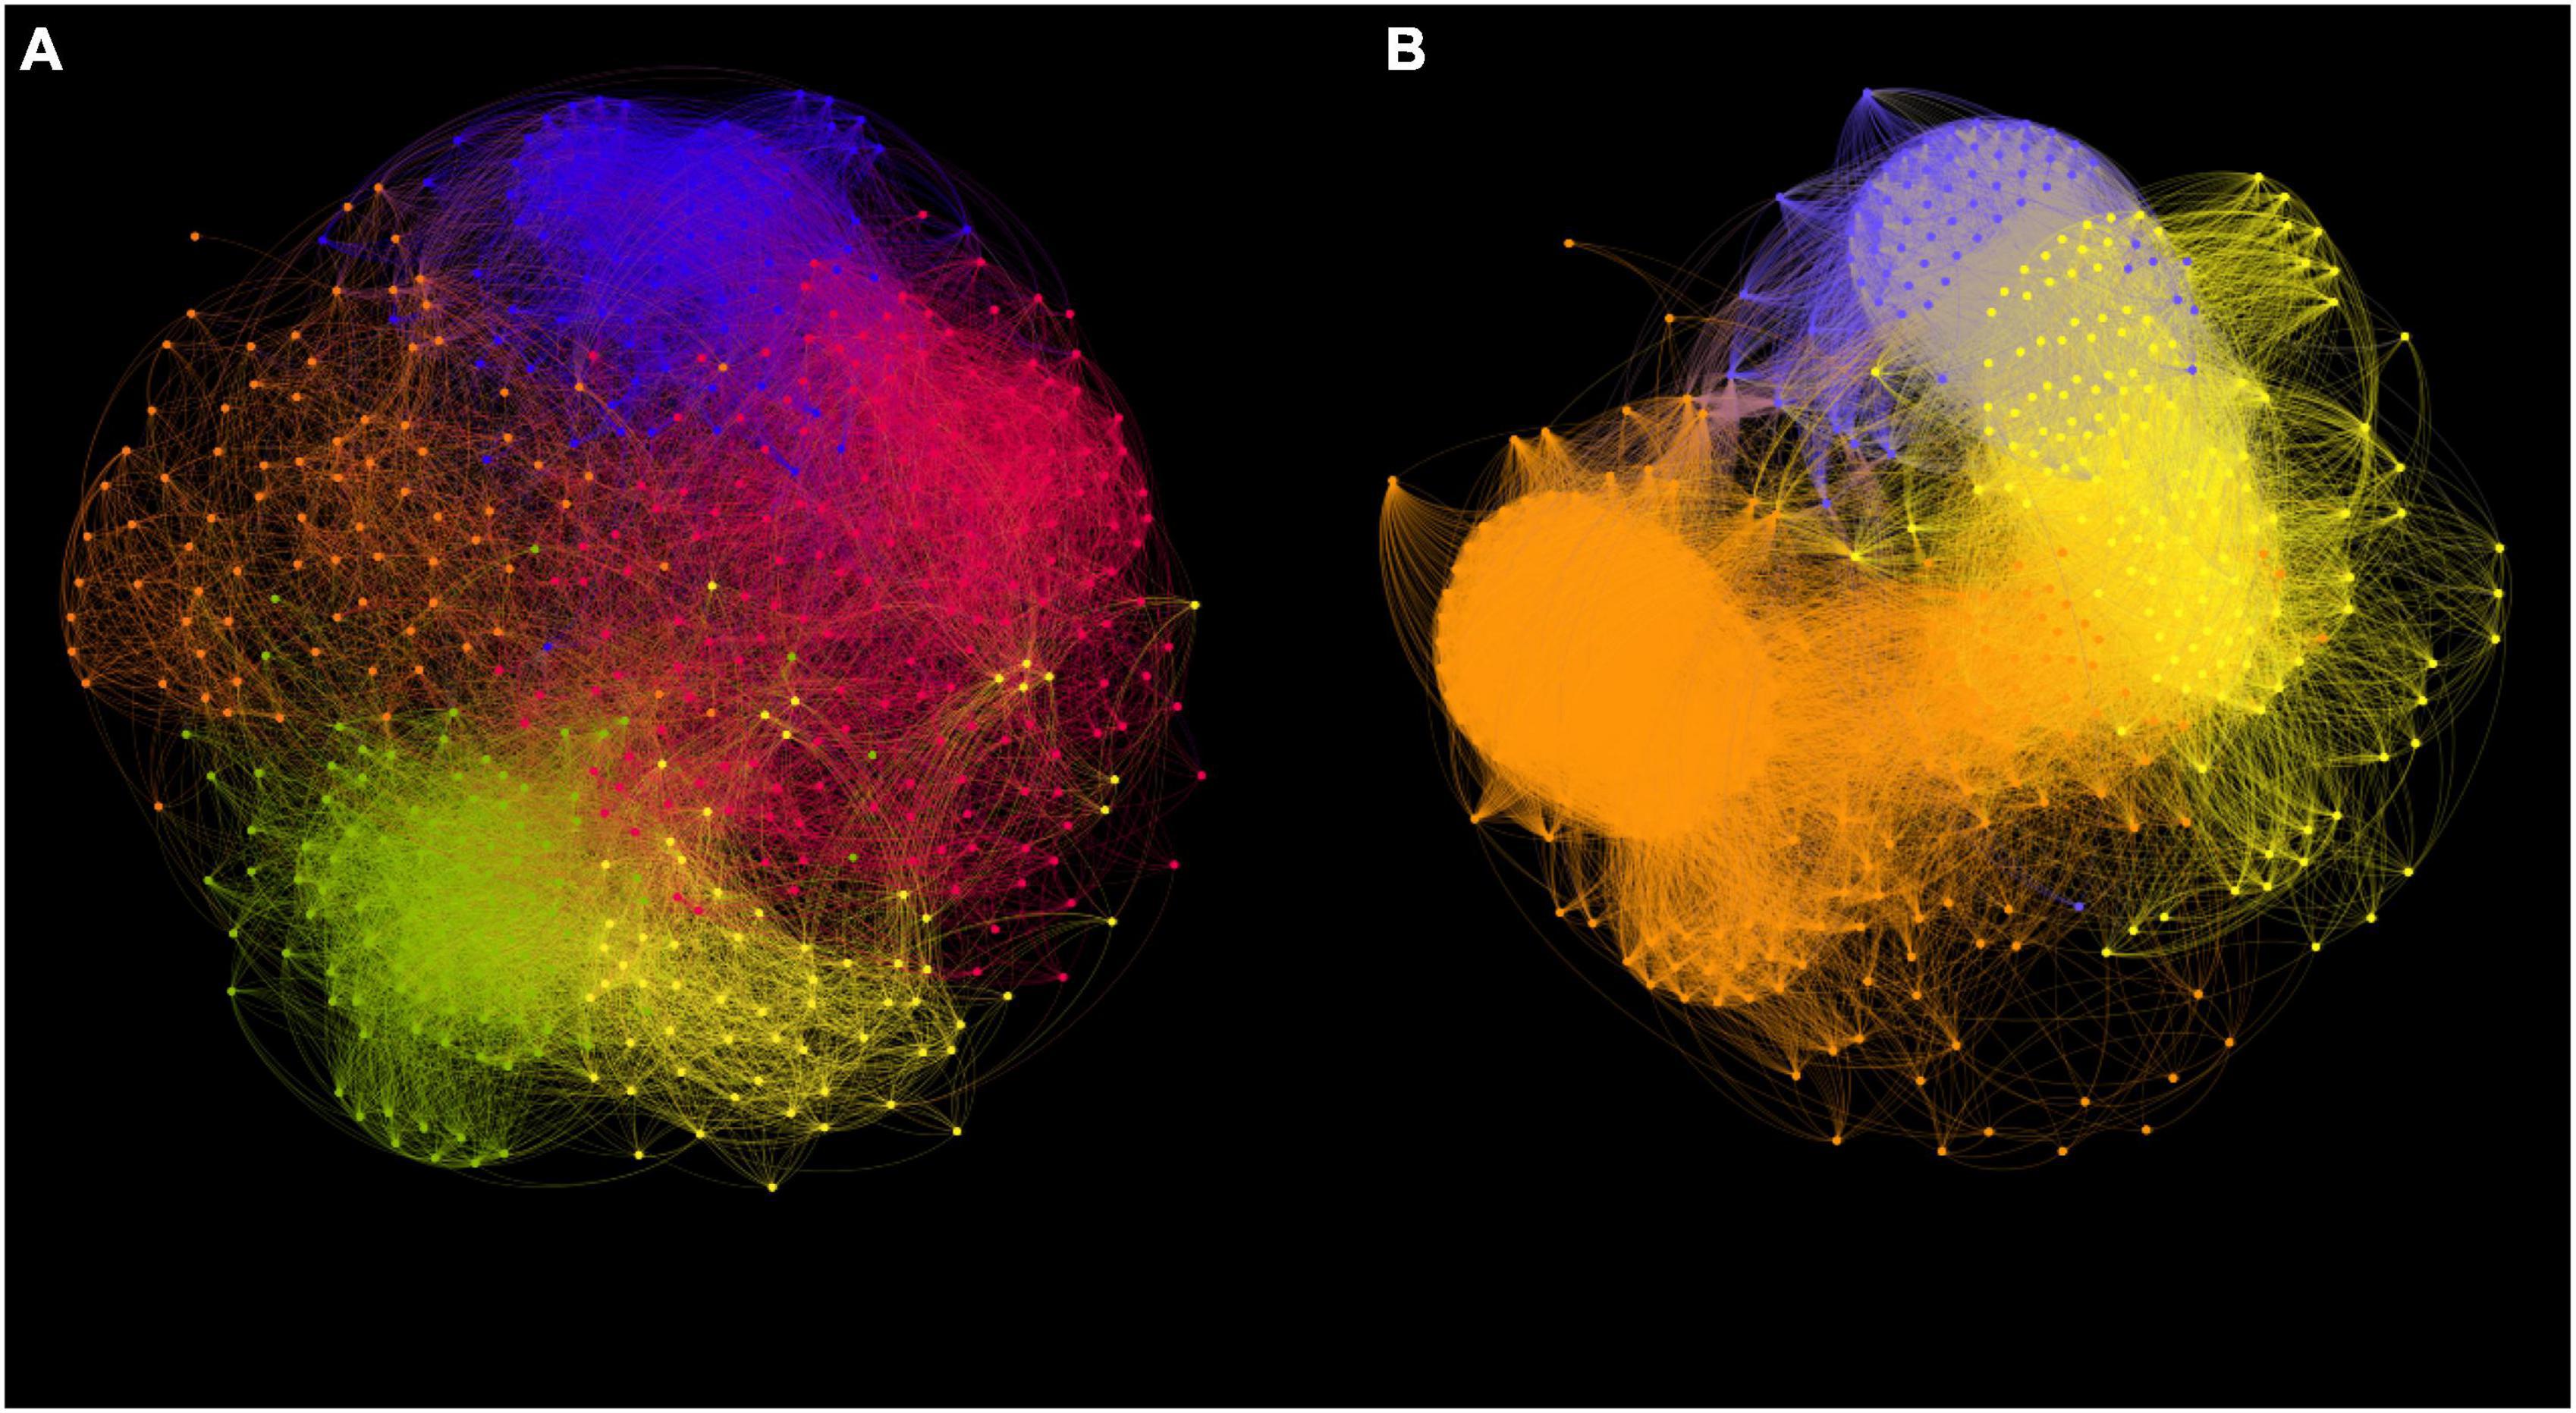
Figure 7. Co-occurrence network analysis of Synechococcus communities based on ASVs at DNA (A) and cDNA (B) levels. Nodes in networks represent ASVs. The modules are represented by different colors. The connections represent Spearman’s significant (p < 0.05) correlations.
Discussion
Variation of Synechococcus Cell Abundance Between Coastal and Estuarine Stations and Controlling Factors
Synechococcus cell abundance ranged from 103 to 104 cells/ml at the coastal stations (Figure 2A). It is lower than those in temperate or subtropic coastal waters, such as Bohai coastal marine ranch (Li et al., 2021), Hong Kong coastal waters (Liu et al., 2014), coastal western subtropical Pacific (Tsai et al., 2006), and Southern California coast (Nagarkar et al., 2021). However, it is consistent with those in other tropical coastal waters, such as the equatorial eastern Indian Ocean (Wei et al., 2019) and coastal waters of the Philippines (Southeast China Sea) (Agawin et al., 2003). This phenomenon may be attributed to changes in latitude. Previous studies also unveiled strong variations of Synechococcus abundance with latitude, which found the peak abundance located around 45°N in the world ocean (Flombaum et al., 2013) and around 33.5°N in the marginal seas of northwestern Pacific Ocean (Xia et al., 2017b). In comparison, we found highly abundant Synechococcus at the estuarine station, especially more than 105 cells/ml in April and July, which is probably due to the eutrophic environment in estuarine waters caused by the discharge of freshwater and sanitary sewage. Many previous studies have shown that Synechococcus cell abundance is the highest in summer and the lowest in winter because the temperature changes the relationship between Synechococcus growth and its grazing mortality (Paerl et al., 2012; Chen et al., 2020; Wang et al., 2021b). However, our result showed that Synechococcus cell abundance reached the highest in autumn in tropical waters. The possible reason is that, in summer, the growth of Synechococcus was suppressed by high temperature (> 30°C) and low-nutrient concentrations, whereas, in winter, the growth was limited by low temperature.
Correlation analyses showed that Synechococcus abundance was positively influenced by concentrations of Chl a and nitrogen sources, including TN, NO2–, and NH4+ (Figure 5). In comparison, previous studies suggested that the cell abundance of Synechococcus was mainly controlled by temperature and nutrients in many sea areas (Moisan et al., 2010; Wang et al., 2011; Xia et al., 2017b). Considering the fact that the study area is geographically located in the tropics with high temperatures, the non-significant correlation between temperature and cell abundance is reasonable. A positive correlation with Chl a concentration indicated the high biomass contribution of Synechococcus in the tropical waters (Agawin et al., 2003). Nitrogen sources have also been considered as an important factor affecting the Synechococcus distribution in other subtropical (Qiu et al., 2010; Zhang X. et al., 2013) and tropical (Rajaneesh and Mitbavkar, 2013) estuarine waters. It may be attributed to the nitrogen demand of phycobilisome-based light-harvesting system and siderophore transport systems of Synechococcus (Agirbas et al., 2015; Schmidt et al., 2020).
High Synechococcus Diversity and Novel Lineages in Tropical Waters
According to high-throughput sequencing of the rpoC1 gene and gene transcript, we detected 25 and 22 lineages representing Synechococcus S5.1, S5.2, S5.3, FS/S5.2, and Cyanobium at DNA and cDNA levels, respectively (Figure 3). In comparison, previous studies found about 6 to 14 lineages in most world’s sea areas, such as Sargasso Sea (Ahlgren and Rocap, 2006), Chesapeake Bay (Chen et al., 2006), the East China Sea and the East Sea (Choi et al., 2013b), Gulf of Aqaba (Post et al., 2011), and Yellow Sea (Wang et al., 2021a). More lineages were identified in subtropical estuarine waters but are still less than those found in this study. For example, a total of 17 Synechococcus lineages were reported in the estuarine waters of Hong Kong by sequencing the same gene (rpoC1) used in this study (Xia et al., 2015). The extraordinary high Synechococcus diversity of our results is in part from the difference in detection method but also suggests that tropical waters are one of the regions with the highest Synechococcus diversity in the world.
We defined four novel clades of Synechococcus in the studied area (Supplementary Figure 3). Lineages restricted in narrow regions are considered as an indicator of specific marine environmental conditions, so these four clades are more indicative of typical environmental features in tropical estuaries and coasts (Sohm et al., 2016). Phylogenetically, clade SY4 was close to clade XVI that occurred in ecotone sea areas with intermediate conditions (Sohm et al., 2016; Xia et al., 2019), such as East China Sea (Choi and Noh, 2009), Red Sea (Fuller et al., 2003), and Mediterranean (Mella-Flores et al., 2011) (Supplementary Figure 3). Strains from clade XVI are capable of chromatic adaptation and are not deficient in the utilization of NO3– or NO2– (Ahlgren and Rocap, 2006). Consistently, clade XVI was a minor group, rarely found in our samples (only occupied 0.67% on average of total samples). However, clade SY4 was one of the most abundant clades in the studied tropical waters (Figure 3). It has significantly higher proportions at Stn. SL1 in winter than other samples at the DNA level and was mostly affected by salinity (p < 0.05) (Figures 4, 6). The difference of relative abundance and ecophysiology between clades SY4 and XVI verified that phylogenetic proximity in Synechococcus lineages does not mean their similarity in geographical preference and niche adaptation (Dufresne et al., 2008).
Variations in Community Structure of Synechococcus Assemblages in Tropical Waters
Spatio-temporal variation of Synechococcus assemblages in studied tropical waters was observed at the DNA level (Figures 3, 4). Spatially, Synechococcus assemblage at estuarine Stn. SL3 differed greatly from that at coastal stations (Figure 6). Affected by the discharge of eutrophic freshwater, the tropical estuary of Sanya River was predominated by FS/S5.2. Similarly, the dominance of freshwater Synechococcus in estuarine waters of other regions was revealed (Xia et al., 2017a). Other studies reported the prevalence of S5.2 in estuarine waters, such as Hong Kong water (Xia et al., 2015), Pearl River estuary (Xia et al., 2017a), and Baltic Sea brackish waters (Celepli et al., 2017). However, we found that euryhaline S5.2 occupied a lower proportion at Stn. SL3 (4.37% on average) than at coastal stations (14.20% on average). Considering that the method of high-throughput sequencing only provides information of relative abundance, this phenomenon may be because S5.2 was overwhelmed by the high abundance of other lineages at Stn. SL3. Besides, it may also be caused by the ambiguity of FS/S5.2. In addition, higher gene abundances of clade VIII were detected at estuarine Stn. SL3 (Figure 2B). Although some studies considered clade VIII was specifically adapted to hypersaline waters (Dufresne et al., 2008; Huang et al., 2012), our correlation analysis showed its negative relations with salinity. Other studies supported our result, which found phycocyanobilin-only clade VIII were distributed in estuarine waters with high nutrient levels, high turbidity, and low salinity (Six et al., 2007; Xia et al., 2015). Seasonal variation of community structure was mainly detected at coastal Stns. SL1 and SL2, which was greatly affected by salinity (Figure 6). This may be attributed to the appearance of low salinity in the surface layers of sea waters due to a large amount of rainfall that occurs during the summer monsoon (Dong et al., 2010). Similar seasonal variation of Synechococcus assemblages caused by monsoon was also observed in the subtropical coastal waters of Hong Kong (Jing et al., 2009). In comparison, high seasonal and inter-station dissimilarities at the cDNA level resulted to imperceptible spatio-temporal variation pattern. At the cDNA level, Synechococcus lineage FS/S5.2 was found to be dominant in some samples at the coastal stations. Especially, its relative abundance reached 86.13% in June at Stn. SL2 at the cDNA level (Figure 3B). The sampling area has a typical tropical monsoon climate, which is wet from May to October. According to the weather record, we found that strong rainfall occurred before and even on the sampling day from June to August. Consequently, besides the imprecision in separating FS/S5.2, this unusual phenomenon may be attributed to the active freshwater Synechococcus, which could be temporarily brought from adjacent estuarine areas due to the increase of precipitation.
Discrepancies in Synechococcus Assemblages Between DNA and cDNA Levels
Disparities between DNA- and cDNA-based communities have been reported by many studies (Steven et al., 2017; Barreto et al., 2021). The reason may be that the DNA-based analysis only represents the presence of microbial organisms in the environmental samples, but it does not imply that the corresponding species are metabolically active (Gill et al., 2017). DNA can be retained in the environment after cell death, whereas cDNA is short-lived and usually related to active growth and cell activity (Ramos et al., 2000). Consequently, simultaneous study and comparison of both components can unveil abundant and inactive, as well as rare but highly active populations (Steven et al., 2017; Barreto et al., 2021). In this study, discrepancies in gene abundance, diversity, and composition of Synechococcus assemblages between DNA and cDNA levels were observed as well. The diversity index of Synechococcus community at the cDNA level was much lower than that at the DNA level (Table 1), indicating that the metabolically active Synechococcus lineages constitute only a fraction of the total assemblages. This phenomenon is also found in microbial communities from different environments, reflecting that DNA-based libraries can recover a broader range of active, dormant, and even dead populations, whereas cDNA-based libraries can only detect active cells (Salgar-Chaparro and Machuca, 2019; Barreto et al., 2021). Meanwhile, there were at least three lineages that only appeared in samples at the DNA level (Figure 3A) and five lineages that had higher relative abundance in samples at the DNA level (Figure 4A). This decoupling could be explained by a response to changes in environmental conditions. Synechococcus have the ability to enter the dormant stage in adverse environments (Fucich and Chen, 2020). In addition, highly abundant but inactive Synechococcus could be brought by runoff or ocean currents from other areas or upwelled from deeper waters and might have low ecological relevance (Paerl et al., 2011; van den Engh et al., 2017).
The co-occurrence network analysis was selected to determine the discrepancies in interactions within Synechococcus communities at DNA and cDNA levels (Figure 7). Synechococcus does not exist in isolation in various ecological environments but forms complex ecological interactions with each other or other taxa (Christie-Oleza et al., 2015). The high modularity values of the two networks suggested that a modular structure existed in Synechococcus communities at both DNA and cDNA levels (Supplementary Table 1) (Newman, 2006). The network at the cDNA level had more edges but fewer nodes than that at the DNA level, and the average degree of the network at the cDNA level was more than twice as high as that of the network at the DNA level, indicating that there were more intricate connections among the ASVs in Synechococcus community at the cDNA level. Furthermore, the network at the cDNA level had a higher clustering coefficient but lower average path length than that at the DNA level, consequently exhibiting more “small-world” properties (more intense information dissemination and exchange ability) (Watts and Strogatz, 1998). The highly connected nodes in co-occurrence networks are considered as “keystone nodes” (Steele et al., 2011). Although FS/S5.2 had high relative abundance in some samples at the DNA level, they were not identified as keystone lineages in our network analysis. This is because the networks were constructed on the basis of all collected samples and FS/S5.2 was rare in some coastal samples. Besides, at the cDNA level, minor Synechococcus lineages, S5.3, clade SY3, and WPC1, played a critical role in maintaining the structure steady of a Synechococcus community and has a greater impact on its community than that expected regardless of its relative abundance or total biomass at the cDNA level (Cottee-Jones and Whittaker, 2012).
This is the first study to compare the Synechococcus composition between cDNA and DNA levels. The results illustrate differences between total (DNA) and active (cDNA) Synechococcus communities in the tropical sea areas. A single method cannot fully reveal the phylogenetic diversity and actively functioning Synechococcus communities. Synechococcus lineages with low abundance at DNA level but relatively high proportion at cDNA level represent those numerically less abundant but are more active in playing ecological functions, e.g., carbon fixation. It is important to reveal which Synechococcus lineages play a key ecological role in different ecosystems, and study at the cDNA level may better reflect their real conditions.
Conclusion
Spatio-temporal distribution patterns of Synechococcus in the tropical waters were investigated using qPCR and high-throughput sequencing at both DNA and cDNA levels. We found that nitrogen nutrients discharged from the Sanya River were the main factors causing the increase of Synechococcus cell and gene abundance in estuarine waters relative to coastal waters. Unprecedentedly, high diversity and four novel clades of Synechococcus were revealed in studied tropical waters. However, it is difficult to determine their physiological characters due to the lack of representative isolates. In addition, discrepancies in the diversity, composition, and interaction of Synechococcus assemblages between DNA and cDNA levels were illustrated. Synechococcus assemblage exhibited apparent spatio-temporal composition patterns and was strongly influenced by environmental variables at the DNA level. In comparison, at the cDNA level, high dissimilation among samples in the same season was detected. Furthermore, Synechococcus assemblage at the cDNA level was rarely correlated with environmental variables but had closer and more complex internal interactions in the co-occurrence network, which may imply the importance of biological effects on the spatio-temporal variation of active Synechococcus assemblages. Our result suggested that Synechococcus communities at both DNA and cDNA levels should be taken into account to better understand the dynamics of community structure and ecological functions of Synechococcus in future studies.
Data Availability Statement
The datasets presented in this study can be found in online repositories. The names of the repository/repositories and accession number(s) can be found below: https://www.ncbi.nlm.nih.gov/, PRJNA753587.
Author Contributions
HL and HJ conceived and designed the experiments, contributed reagents, materials, and analysis tools. HJ and XX performed the experiments. TW, XX, and JC analyzed the data. TW wrote the manuscript. XX, JC, HL, and HJ contributed writing and analysis guidance. JC contributed database. All authors contributed to the article and approved the submitted version.
Funding
This work was supported by the National Natural Science Foundation of China (41776147), the Training Program of the Major Research Plan of the National Natural Science Foundation of China (91751116), the Hainan Province Science and Technology special fund (ZDKJ2021036), and the National Key Research and Development Program of China (2018YFC0309800 and 2016YFC0304905).
Conflict of Interest
The authors declare that the research was conducted in the absence of any commercial or financial relationships that could be construed as a potential conflict of interest.
Publisher’s Note
All claims expressed in this article are solely those of the authors and do not necessarily represent those of their affiliated organizations, or those of the publisher, the editors and the reviewers. Any product that may be evaluated in this article, or claim that may be made by its manufacturer, is not guaranteed or endorsed by the publisher.
Supplementary Material
The Supplementary Material for this article can be found online at: https://www.frontiersin.org/articles/10.3389/fmicb.2022.837037/full#supplementary-material
References
Agawin, N. S., Duarte, C. M., Agustı, S., and McManus, L. (2003). Abundance, biomass and growth rates of Synechococcus sp. in a tropical coastal ecosystem (Philippines, South China Sea). Estuar. Coast. Shelf Sci. 56, 493–502. doi: 10.1016/s0272-7714(02)00200-7
Agirbas, E., Martinez-Vicente, V., Brewin, R. J., Racault, M. F., Airs, R. L., and Llewellyn, C. A. (2015). Temporal changes in total and size-fractioned chlorophyll-a in surface waters of three provinces in the Atlantic Ocean (September to November) between 2003 and 2010. J. Mar. Syst. 150, 56–65.
Ahlgren, N. A., and Rocap, G. (2006). Culture isolation and culture-independent clone libraries reveal new marine Synechococcus ecotypes with distinctive light and N physiologies. Appl. Environ. Microbiol. 72, 7193–7204. doi: 10.1128/AEM.00358-06
Ahlgren, N. A., and Rocap, G. (2012). Diversity and distribution of marine Synechococcus: multiple gene phylogenies for consensus classification and development of qPCR assays for sensitive measurement of clades in the ocean. Front. Microbiol. 3:213. doi: 10.3389/fmicb.2012.00213
Ahlgren, N. A., Belisle, B. S., and Lee, M. D. (2020). Genomic mosaicism underlies the adaptation of marine Synechococcus ecotypes to distinct oceanic iron niches. Environ. Microbiol. 22, 1801–1815. doi: 10.1111/1462-2920.14893
Ahlgren, N. A., Noble, A., Patton, A. P., Roache-Johnson, K., Jackson, L., Robinson, D., et al. (2014). The unique trace metal and mixed layer conditions of the Costa Rica upwelling dome support a distinct and dense community of Synechococcus. Limnol. Oceanogr. 59, 2166–2184. doi: 10.4319/lo.2014.59.6.2166
Barreto, M. M., Ziegler, M., Venn, A., Tambutté, E., Zoccola, D., Tambutté, S., et al. (2021). Effects of ocean acidification on resident and active microbial communities of Stylophora pistillata. Front. Microbiol. 12:707674. doi: 10.3389/fmicb.2021.707674
Bastian, M., Heymann, S., and Jacomy, M. (2009). “Gephi: an open source software for exploring and manipulating networks,” in Proceedings of the International AAAI Conference on weblogs and social media: San Jose, California. Available online at: https://gephi.org/publications/gephi-bastian-feb09.pdf (December 6, 2021).
Bokulich, N. A., Kaehler, B. D., Rideout, J. R., Dillon, M., Bolyen, E., Knight, R., et al. (2018). Optimizing taxonomic classification of marker-gene amplicon sequences with QIIME 2’s q2-feature-classifier plugin. Microbiome 6:90. doi: 10.1186/s40168-018-0470-z
Bolyen, E., Rideout, J. R., Dillon, M. R., Bokulich, N. A., Abnet, C. C., Al-Ghalith, G. A., et al. (2019). Reproducible, interactive, scalable and extensible microbiome data science using QIIME 2. Nat. Biotechnol. 37, 852–857.
Buitenhuis, E. T., Li, W. K., Vaulot, D., Lomas, M. W., Landry, M., Partensky, F., et al. (2012). Picophytoplankton biomass distribution in the global ocean. Earth Syst. Sci. Data 4, 37–46. doi: 10.5194/essd-4-37-2012
Callahan, B. J., McMurdie, P. J., Rosen, M. J., Han, A. W., Johnson, A. J. A., and Holmes, S. P. (2016). DADA2: high-resolution sample inference from Illumina amplicon data. Nat. Methods 13, 581–583. doi: 10.1038/nmeth.3869
Celepli, N., Sundh, J., Ekman, M., Dupont, C. L., Yooseph, S., Bergman, B., et al. (2017). Meta−omic analyses of Baltic Sea cyanobacteria: diversity, community structure and salt acclimation. Environ. Microbiol. 19, 673–686. doi: 10.1111/1462-2920.13592
Chen, B., Liu, H., Landry, M. R., DaI, M., Huang, B., and Sune, J. (2009). Close coupling between phytoplankton growth and microzooplankton grazing in the western South China Sea. Limnol. Oceanogr. 54, 1084–1097. doi: 10.4319/lo.2009.54.4.1084
Chen, B., Liu, H., Xiao, W., Wang, L., and Huang, B. (2020). A machine-learning approach to modeling picophytoplankton abundances in the South China Sea. Prog. Oceanogr. 189:102456. doi: 10.1016/j.pocean.2020.102456
Chen, F., Wang, K., Kan, J., Suzuki, M. T., and Wommack, K. E. (2006). Diverse and unique picocyanobacteria in Chesapeake Bay, revealed by 16S-23S rRNA internal transcribed spacer sequences. Appl. Environ. Microbiol. 72, 2239–2243. doi: 10.1128/AEM.72.3.2239-2243.2006
Choi, D. H., and Noh, J. H. (2009). Phylogenetic diversity of Synechococcus strains isolated from the East China Sea and the East Sea. FEMS Microbiol. Ecol. 69, 439–448.
Choi, D. H., Noh, J. H., and Shim, J. (2013b). Seasonal changes in picocyanobacterial diversity as revealed by pyrosequencing in temperate waters of the East China Sea and the East Sea. Aquat. Microb. Ecol. 71, 75–90.
Choi, D. H., Noh, J. H., and Lee, J.-H. (2013a). Application of pyrosequencing method for investigating the diversity of Synechococcus subcluster 5.1 in open ocean. Microbes Environ. 29, 17–22. doi: 10.1264/jsme2.me13063
Christie-Oleza, J. A., Scanlan, D. J., and Armengaud, J. (2015). “You produce while I clean up”, a strategy revealed by exoproteomics during Synechococcus–Roseobacter interactions. Proteomics 15, 3454–3462. doi: 10.1002/pmic.201400562
Chung, C. C., Chang, J., Gong, G. C., Hsu, S. C., Chiang, K. P., and Liao, C. W. (2011). Effects of Asian Dust Storms on Synechococcus populations in the subtropical Kuroshio Current. Mar. Biotechnol. 13, 751–763. doi: 10.1007/s10126-010-9336-5
Cottee-Jones, H. E. W., and Whittaker, R. J. (2012). Perspective: the keystone species concept: a critical appraisal. Front. Biogeogr. 4:117–127.
Dong, J. D., Zhang, Y. Y., Zhang, S., Wang, Y. S., Yang, Z. H., and Wu, M. L. (2010). Identification of temporal and spatial variations of water quality in Sanya Bay, China by three-way principal component analysis. Environ. Earth Sci. 60, 1673–1682.
Dufresne, A., Ostrowski, M., Scanlan, D. J., Garczarek, L., Mazard, S., Palenik, B. P., et al. (2008). Unraveling the genomic mosaic of a ubiquitous genus of marine cyanobacteria. Genome Biol. 9:R90. doi: 10.1186/gb-2008-9-5-r90
Farrant, G. K., Doré, H., Cornejo-Castillo, F. M., Partensky, F., Ratin, M., Ostrowski, M., et al. (2016). Delineating ecologically significant taxonomic units from global patterns of marine picocyanobacteria. Proc. Natl. Acad. Sci. U.S.A. 113, E3365–E3374. doi: 10.1073/pnas.1524865113
Flombaum, P., Gallegos, J. L., Gordillo, R. A., Rincón, J., and Martiny, A. C. (2013). Present and future global distributions of the marine Cyanobacteria Prochlorococcus and Synechococcus. Proc. Natl. Acad. Sci. U.S.A. 110, 9824–9829. doi: 10.1073/pnas.1307701110
Fucich, D., and Chen, F. (2020). Presence of toxin-antitoxin systems in picocyanobacteria and their ecological implications. ISME J. 14, 2843–2850. doi: 10.1038/s41396-020-00746-4
Fuller, N. J., Marie, D., Partensky, F., Vaulot, D., Post, A. F., and Scanlan, D. J. (2003). Clade-specific 16S ribosomal DNA oligonucleotides reveal the predominance of a single marine Synechococcus clade throughout a stratified water column in the Red Sea. Appl. Environ. Microbiol. 69, 2430–2443. doi: 10.1128/AEM.69.5.2430-2443.2003
Gill, A. S., Lee, A., and McGuire, K. L. (2017). Phylogenetic and functional diversity of total (DNA) and expressed (RNA) bacterial communities in urban green infrastructure bioswale soils. Appl. Environ. Microbiol. 83:e00287-17. doi: 10.1128/AEM.00287-17
Huang, S., Wilhelm, S. W., Harvey, H. R., Taylor, K., Jiao, N., and Chen, F. (2012). Novel lineages of Prochlorococcus and Synechococcus in the global oceans. ISME J. 6:285. doi: 10.1038/ismej.2011.106
Iturriaga, R., and Mitchell, B. (1986). Chroococcoid cyanobacteria: a significant component in the food web dynamics of the open ocean. Mar. Ecol. Prog. Ser. 28, 291–297.
Jing, H., Zhang, R., Pointing, S. B., Liu, H., and Qian, P. (2009). Genetic diversity and temporal variation of the marine Synechococcus community in the subtropical coastal waters of Hong Kong. Can. J. Microbiol. 55, 311–318. doi: 10.1139/w08-138
Kent, A. G., Baer, S. E., Mouginot, C., Huang, J. S., Larkin, A. A., Lomas, M. W., et al. (2019). Parallel phylogeography of Prochlorococcus and Synechococcus. ISME J. 13, 430–441.
Li, G., Song, Q., Zheng, P., Zhang, X., Zou, S., Li, Y., et al. (2021). Dynamics and distribution of marine Synechococcus abundance and genotypes during seasonal hypoxia in a coastal marine ranch. J. Mar. Sci. Eng. 9:549.
Ling, J., Zhang, Y., Dong, J., Wang, Y., Huang, H., Chen, L., et al. (2013). Spatial variability of cyanobacterial community composition in Sanya Bay as determined by DGGE fingerprinting and multivariate analysis. Chin. Sci. Bull. 58, 1019–1027.
Liu, H., Jing, H., Wong, T. H., and Chen, B. (2014). Co−occurrence of phycocyanin−and phycoerythrin−rich Synechococcus in subtropical estuarine and coastal waters of Hong Kong. Environ. Microbiol. Rep. 6, 90–99. doi: 10.1111/1758-2229.12111
Mackey, K. R. M., Hunter-Cevera, K., Britten, G. L., Murphy, L. G., Sogin, M. L., and Huber, J. A. (2017). Seasonal succession and spatial patterns of Synechococcus microdiversity in a salt marsh estuary revealed through 16S rRNA gene oligotyping. Front. Microbiol. 8:1496. doi: 10.3389/fmicb.2017.01496
Mazard, S., Ostrowski, M., Partensky, F., and Scanlan, D. J. (2012). Multi-locus sequence analysis, taxonomic resolution and biogeography of marine Synechococcus. Environ. Microbiol. 14, 372–386. doi: 10.1111/j.1462-2920.2011.02514.x
Meixia, Z., Kefu, Y., Qiaomin, Z., and Qi, S. (2008). Spatial pattern of coral diversity in Luhuitou fringing reef, Sanya, China. Acta Ecol. Sin. 28, 1419–1428.
Mella-Flores, D., Mazard, S., Humily, F., Partensky, F., Mahé, F., Bariat, L., et al. (2011). Is the distribution of Prochlorococcus and Synechococcus ecotypes in the Mediterranean Sea affected by global warming? Biogeosciences 8, 2785–2804.
Moisan, T. A., Blattner, K. L., and Makinen, C. P. (2010). Influences of temperature and nutrients on Synechococcus abundance and biomass in the southern Mid-Atlantic Bight. Cont. Shelf Res. 30, 1275–1282.
Mühling, M., Fuller, N. J., Somerfield, P. J., Post, A. F., Wilson, W. H., Scanlan, D. J., et al. (2006). High resolution genetic diversity studies of marine Synechococcus isolates using rpoC1-based restriction fragment length polymorphism. Aquat. Microb. Ecol. 45, 263–275.
Nagarkar, M., Wang, M., Valencia, B., and Palenik, B. (2021). Spatial and temporal variations in Synechococcus microdiversity in the Southern California coastal ecosystem. Environ. Microbiol. 23, 252–266. doi: 10.1111/1462-2920.15307
Newman, M. E. J. (2006). Modularity and community structure in networks. Proc. Natl. Acad. Sci. U.S.A. 103, 8577–8582.
Nguyen, L. T., Schmidt, H. A., Von Haeseler, A., and Minh, B. Q. (2015). IQ-TREE: a fast and effective stochastic algorithm for estimating maximum-likelihood phylogenies. Mol. Biol. Evol. 32, 268–274. doi: 10.1093/molbev/msu300
Paerl, R. W., Turk, K. A., Beinart, R. A., Chavez, F. P., and Zehr, J. P. (2012). Seasonal change in the abundance of Synechococcus and multiple distinct phylotypes in Monterey Bay determined by rbcL and narB quantitative PCR. Environ. Microbiol. 14, 580–593. doi: 10.1111/j.1462-2920.2011.02594.x
Paerl, R., Johnson, K., Welsh, R., Worden, A., Chavez, F., and Zehr, J. (2011). Differential distributions of Synechococcus subgroups across the California current system. Front. Microbiol. 2:59. doi: 10.3389/fmicb.2011.00059
Palenik, B., Ren, Q., Dupont, C. L., Myers, G. S., Heidelberg, J. F., Badger, J. H., et al. (2006). Genome sequence of Synechococcus CC9311: insights into adaptation to a coastal environment. Proc. Natl. Acad. Sci. U.S.A. 103, 13555–13559. doi: 10.1073/pnas.0602963103
Post, A. F., Penno, S., Zandbank, K., Paytan, A., Huse, S., and Mark Welch, D. (2011). Long term seasonal dynamics of Synechococcus population structure in the Gulf of Aqaba, Northern Red Sea. Front. Microbiol. 2:131. doi: 10.3389/fmicb.2011.00131
Qiu, D., Huang, L., Zhang, J., and Lin, S. (2010). Phytoplankton dynamics in and near the highly eutrophic Pearl River Estuary, South China Sea. Cont. Shelf Res. 30, 177–186. doi: 10.1016/j.marpolbul.2011.01.018
Qiu, W. (2013). The Sanya coral reef national marine nature reserve, China: a governance analysis. Mar. Policy 41, 50–56.
Rajaneesh, K., and Mitbavkar, S. (2013). Factors controlling the temporal and spatial variations in Synechococcus abundance in a monsoonal estuary. Mar. Environ. Res. 92, 133–143. doi: 10.1016/j.marenvres.2013.09.010
Ramos, C., Mølbak, L., and Molin, S. (2000). Bacterial activity in the rhizosphere analyzed at the single-cell level by monitoring ribosome contents and synthesis rates. Appl. Environ. Microbiol. 66, 801–809. doi: 10.1128/AEM.66.2.801-809.2000
Robidart, J. C., Preston, C. M., Paerl, R. W., Turk, K. A., Mosier, A. C., Francis, C. A., et al. (2012). Seasonal Synechococcus and Thaumarchaeal population dynamics examined with high resolution with remote in situ instrumentation. ISME J. 6, 513–523. doi: 10.1038/ismej.2011.127
Salgar-Chaparro, S. J., and Machuca, L. L. (2019). Complementary DNA/RNA-based profiling: characterization of corrosive microbial communities and their functional profiles in an oil production facility. Front. Microbiol. 10:2587. doi: 10.3389/fmicb.2019.02587
Schmidt, K., Birchill, A. J., Atkinson, A., Brewin, R. J., Clark, J. R., Hickman, A. E., et al. (2020). Increasing picocyanobacteria success in shelf waters contributes to long−term food web degradation. Glob. Change Biol. 26, 5574–5587. doi: 10.1111/gcb.15161
Segata, N., Izard, J., Waldron, L., Gevers, D., Miropolsky, L., Garrett, W. S., et al. (2011). Metagenomic biomarker discovery and explanation. Genome Biol. 12:R60. doi: 10.1186/gb-2011-12-6-r60
Six, C., Thomas, J.-C., Garczarek, L., Ostrowski, M., Dufresne, A., Blot, N., et al. (2007). Diversity and evolution of phycobilisomes in marine Synechococcus spp.: a comparative genomics study. Genome Biol. 8:R259. doi: 10.1186/gb-2007-8-12-r259
Sohm, J. A., Ahlgren, N. A., Thomson, Z. J., Williams, C., Moffett, J. W., Saito, M. A., et al. (2016). Co-occurring Synechococcus ecotypes occupy four major oceanic regimes defined by temperature, macronutrients and iron. ISME J. 10:333. doi: 10.1038/ismej.2015.115
Steele, J. A., Countway, P. D., Xia, L., Vigil, P. D., Beman, J. M., Kim, D. Y., et al. (2011). Marine bacterial, archaeal and protistan association networks reveal ecological linkages. ISME J. 5, 1414–1425. doi: 10.1038/ismej.2011.24
Steven, B., Hesse, C., Soghigian, J., Gallegos-Graves, L. V., and Dunbar, J. (2017). Simulated rRNA/DNA ratios show potential to misclassify active populations as dormant. Appl. Environ. Microbiol. 83:e0696-17. doi: 10.1128/AEM.00696-17
Tai, V., and Palenik, B. (2009). Temporal variation of Synechococcus clades at a coastal Pacific Ocean monitoring site. ISME J. 3, 903–915. doi: 10.1038/ismej.2009.35
Titlyanov, E. A., Titlyanova, T. V., Scriptsova, A. V., Ren, Y., Li, X., and Huang, H. (2019). Interannual and seasonal changes in the benthic algae flora of coral reef in Xiaodong Hai (Hainan Island, China). J. Mar. Sci. Eng. 7:243.
Tsai, A. Y., Chiang, K. P., Chan, Y. F., Lin, Y. C., and Chang, J. (2006). Pigmented nanoflagellates in the coastal western subtropical Pacific are important grazers on Synechococcus populations. J. Plankton Res. 29, 71–77.
van den Engh, G. J., Doggett, J. K., Thompson, A. W., Doblin, M. A., Gimpel, C. N. G., and Karl, D. M. (2017). Dynamics of Prochlorococcus and Synechococcus at sation ALOHA revealed through flow cytometry and high-resolution vertical sampling. Front. Mar. Sci. 4:359. doi: 10.3389/fmars.2017.00359
Wang, K., Wommack, K. E., and Chen, F. (2011). Abundance and distribution of Synechococcus spp. and cyanophages in the Chesapeake Bay. Appl. Environ. Microbiol. 77, 7459–7468. doi: 10.1128/AEM.00267-11
Wang, T., Chen, X., Qin, S., and Li, J. (2021a). Phylogenetic and phenogenetic diversity of Synechococcus along a Yellow Sea section reveal its environmental dependent distribution and co-occurrence microbial pattern. J. Mar. Sci. Eng. 9:1018.
Wang, T., Chen, X., Li, J., and Qin, S. (2021b). Distribution and phenogenetic diversity of Synechococcus in the Bohai Sea, China. J. Oceanol. Limnol. 39, 1–13.
Watts, D. J., and Strogatz, S. H. (1998). Collective dynamics of ‘small-world’networks. Nature 393, 440–442.
Wei, Y., Sun, J., Zhang, X., Wang, J., and Huang, K. (2019). Picophytoplankton size and biomass around equatorial eastern Indian Ocean. Microbiologyopen 8:e00629. doi: 10.1002/mbo3.629
Xia, X., Cheung, S., Endo, H., Suzuki, K., and Liu, H. (2019). Latitudinal and vertical variation of Synechococcus assemblage composition along 170° w transect from the South Pacific to the Arctic Ocean. Microb. Ecol. 77, 333–342. doi: 10.1007/s00248-018-1308-8
Xia, X., Guo, W., Tan, S., and Liu, H. (2017a). Synechococcus assemblages across the salinity gradient in a salt wedge estuary. Front. Microbiol. 8:1254. doi: 10.3389/fmicb.2017.01254
Xia, X., Partensky, F., Garczarek, L., Suzuki, K., Guo, C., Yan Cheung, S., et al. (2017b). Phylogeography and pigment type diversity of Synechococcus cyanobacteria in surface waters of the northwestern Pacific Ocean. Environ. Microbiol. 19, 142–158. doi: 10.1111/1462-2920.13541
Xia, X., Vidyarathna, N. K., Palenik, B., Lee, P., and Liu, H. (2015). Comparison of the seasonal variations of Synechococcus assemblage structures in estuarine waters and coastal waters of Hong Kong. Appl. Environ. Microbiol. 81, 7644–7655. doi: 10.1128/AEM.01895-15
Zhang, C., Huang, H., Ye, C., Huang, L., Li, X., Lian, J., et al. (2013). Diurnal and seasonal variations of carbonate system parameters on Luhuitou fringing reef, Sanya Bay, Hainan Island, South China Sea. Deep Sea Res. Part II Top. Stud. Oceanogr. 96, 65–74. doi: 10.1016/j.dsr2.2013.02.013
Zhang, X., Shi, Z., Ye, F., Zeng, Y., and Huang, X. (2013). Picophytoplankton abundance and distribution in three contrasting periods in the Pearl River Estuary, South China. Mar. Freshw. Res. 64, 692–705. doi: 10.1071/mf12303
Zwirglmaier, K., Heywood, J. L., Chamberlain, K., Woodward, E. M. S., Zubkov, M. V., and Scanlan, D. J. (2007). Basin−scale distribution patterns of picocyanobacterial lineages in the Atlantic Ocean. Environ. Microbiol. 9, 1278–1290. doi: 10.1111/j.1462-2920.2007.01246.x
Zwirglmaier, K., Jardillier, L., Ostrowski, M., Mazard, S., Garczarek, L., Vaulot, D., et al. (2008). Global phylogeography of marine Synechococcus and Prochlorococcus reveals a distinct partitioning of lineages among oceanic biomes. Environ. Microbiol. 10, 147–161. doi: 10.1111/j.1462-2920.2007.01440.x
Keywords: Synechococcus, spatio-temporal variation, genetic diversity, gene and gene transcript, tropical marine waters
Citation: Wang T, Xia X, Chen J, Liu H and Jing H (2022) Spatio-Temporal Variation of Synechococcus Assemblages at DNA and cDNA Levels in the Tropical Estuarine and Coastal Waters. Front. Microbiol. 13:837037. doi: 10.3389/fmicb.2022.837037
Received: 16 December 2021; Accepted: 24 January 2022;
Published: 03 March 2022.
Edited by:
Jin Zhou, Tsinghua Shenzhen International Graduate School, ChinaReviewed by:
Yiguo Hong, Guangzhou University, ChinaShengwei Hou, Southern University of Science and Technology, China
Copyright © 2022 Wang, Xia, Chen, Liu and Jing. This is an open-access article distributed under the terms of the Creative Commons Attribution License (CC BY). The use, distribution or reproduction in other forums is permitted, provided the original author(s) and the copyright owner(s) are credited and that the original publication in this journal is cited, in accordance with accepted academic practice. No use, distribution or reproduction is permitted which does not comply with these terms.
*Correspondence: Hongbin Liu, bGl1aGJAdXN0Lmhr; Hongmei Jing, aG1qaW5nQGlkc3NlLmFjLmNu
†These authors have contributed equally to this work