 Qi Zhang
 Ya-Wei Luo
- State Key Laboratory of Marine Environmental Science, College of Ocean and Earth Sciences, Xiamen University, Xiamen, China
Diatoms, one of the most important phytoplankton groups, fulfill their carbon demand from seawater mainly by obtaining passively diffused carbon dioxide (CO2) and/or actively consuming intracellular energy to acquire bicarbonate (HCO3–). An anthropogenically induced increase in seawater CO2 reduces the HCO3– requirement of diatoms, potentially saving intracellular energy and benefitting their growth. This effect is commonly speculated to be most remarkable in larger diatoms that are subject to a stronger limitation of CO2 supply because of their smaller surface-to-volume ratios. However, we constructed a theoretical model for diatoms and revealed a unimodal relationship between the simulated growth rate response (GRR, the ratio of growth rates under elevated and ambient CO2) and cell size, with the GRR peaking at a cell diameter of ∼7 μm. The simulated GRR of the smallest diatoms was low because the CO2 supply was nearly sufficient at the ambient level, while the decline of GRR from a cell diameter of 7 μm was simulated because the contribution of seawater CO2 to the total carbon demand greatly decreased and diatoms became less sensitive to CO2 increase. A collection of historical data in CO2 enrichment experiments of diatoms also showed a roughly unimodal relationship between maximal GRR and cell size. Our model further revealed that the “optimal” cell size corresponding to peak GRR enlarged with the magnitude of CO2 increase but diminished with elevating cellular carbon demand, leading to projection of the smallest optimal cell size in the equatorial Pacific upwelling zone. Last, we need to emphasize that the size-dependent effects of increasing CO2 on diatoms are multifaceted, while our model only considers the inorganic carbon supply from seawater and optimal allocation of intracellular energy. Our study proposes a competitive advantage of middle-sized diatoms and can be useful in projecting changes in the diatom community in the future acidified high-CO2 ocean.
Introduction
Diatoms are one of the most important marine phytoplankton groups. They contribute 40% of primary production (e.g., Nelson et al., 1995; Tréguer and De La Rocha, 2013) and are one of the major contributors to organic carbon export in the global ocean (Buesseler, 1998; Jin et al., 2006). Marine diatoms fix carbon dioxide (CO2) into organic carbon through photosynthesis, which is catalyzed by ribulose-1,5-bisphosphate carboxylase/oxygenase (RuBisCO) in the Calvin cycle. However, RuBisCO has a low affinity for CO2, and its carboxylation is inefficient in fixing CO2 due to photorespiration unless its surrounding CO2 concentration is sufficiently high (Reiskind et al., 1989; Badger et al., 1998; Reinfelder, 2011). Meanwhile, due to the slow diffusion of CO2 in aqueous environments (10,000 times slower than that in air) and sluggish dehydration of bicarbonate (HCO3–) to CO2 (Wolf-Gladrow and Riebesell, 1997; Reinfelder, 2011), the CO2 concentration in contemporary surface oceans (∼10–30 μM) often limits the growth of diatoms (Reinfelder, 2011; Wu et al., 2014). Diatoms therefore use a series of processes termed the CO2-concentrating mechanism (CCM) to achieve high CO2 concentrations near RuBisCO at the cost of metabolic energy that is otherwise available for growth (Giordano et al., 2005; Raven et al., 2008; Hopkinson et al., 2011). As one of the key processes of CCM, many diatoms evolve to consume energy to acquire HCO3–, which is then catalyzed by carbonic anhydrase (CA) and converted to CO2 to maintain a high CO2 concentration near RuBisCO, leading to a high leakage of CO2 into seawater (Burkhardt et al., 2001; Cassar et al., 2002; Reinfelder, 2011). Some diatoms can also actively release extracellular CA (eCA) to catalyze the conversion of HCO3– to CO2 in seawater (Martin and Tortell, 2008; Tortell et al., 2008; Chrachri et al., 2018).
The ocean absorbs approximately 26% of anthropogenic CO2 emissions (Friedlingstein et al., 2019), causing a significant increase in CO2 concentrations and a decrease in pH in seawater, collectively termed ocean acidification (Orr et al., 2005). It influences marine ecosystems with wide-ranging impacts, such as community structure, diversity, and carbon export (Sabine et al., 2004; Doney, 2009; Feng et al., 2009; Finkel et al., 2009; Endo et al., 2013; Mouw et al., 2016; Deppeler et al., 2018; Doney et al., 2020). The increasing CO2 concentration in surface seawater, predicted to double within this century under business-as-usual scenarios (Lerman et al., 2011), will mitigate CO2 limitation on phytoplankton and downregulate CCM to save intracellular energy and potentially enhance cell growth (Taylor et al., 2012; McMinn et al., 2014; Cyronak et al., 2016; Biswas et al., 2017; Gafar et al., 2018). This stimulation has been observed in CO2 enrichment experiments of diatoms when they were cultured under favorable nutrient and light conditions (e.g., Kroeker et al., 2013; Wu et al., 2014).
Diatoms vary greatly in cell size, from a minimal reported dimension < 1 μm to a maximal reported dimension of >5,000 μm in a global marine diatom database (Leblanc et al., 2012a,b). However, large diatoms are usually less abundant in the community, mainly because of their decreasing growth rates with cell size (Mizuno, 1991; Sarthou et al., 2005). For example, in 515 diatom species sampled along the Swedish coast and the Gulf of Finland, those with a cell volume larger than 1,000 μm3, an equivalent spherical diameter equivalent (ESD) of 12 μm, accounted for only approximately half (57%) of the total species (Snoeijs et al., 2002). In this study, we followed that study and define the “large” diatoms by ESD of larger than 12 μm. We further defined the “small” and “middle-sized” diatoms by ESD of < 5 μm and 5–12 μm, respectively.
The relationship between diatom cell size and the degree of their growth rate response (GRR), defined here as the ratio of the growth rates under elevated and ambient CO2 concentrations, remains unclear. If CO2 was the only carbon source for diatoms, their GRR would increase with cell size because larger cells have smaller surface-to-volume ratios and are limited more severely by CO2 supply (Wirtz, 2011). However, HCO3– is the secondary carbon source of diatoms, and its concentration in seawater (∼103 μM) is 2 orders of magnitude higher than that of CO2. It is worth further evaluating how diatoms respond differently to increasing CO2 when they also acquire substantial amounts of HCO3–.
Although the increase in GRR with cell size has been shown in a CO2 enrichment experiment of diatoms (Wu et al., 2014), the interpretation of the results can be complex, such as the high light intensity of 350 μmol photons/m2/s used in that experiment. Indeed, high light can inhibit the photosynthesis of diatoms, which can be exacerbated when cells grow in acidified, high-CO2 environments. For example, the effect of increasing CO2 on the growth of three diatom species shifted from positive to negative when the incubation light increased from 150 to 250 μmol photons/m2/s (Gao et al., 2012). It is therefore possible that the higher GRR seen in larger diatoms in Wu et al. (2014) can be partly a result that larger cells were less susceptible to the inhibition of high light (Key et al., 2010) instead of a sole effect of mitigated CO2 limitation.
In this study, we constructed a theoretical model to simulate the GRR as a function of cell size and magnitude of seawater CO2 increase. The model calculated the CO2 supply rate to diatom cells as a result of physical diffusion and carbonate equilibrium in seawater, represented CO2 leakage from cells, and solved an optimal energy allocation between HCO3– acquisition and biomass synthesis. The model results were compared to historical data from diatom CO2 enrichment experiments. We also evaluated the robustness of our model and further explored the underlying mechanisms by performing a series of model sensitivity experiments. We finally applied our model to the global ocean under a CO2 release scenario (Representative Concentration Pathway RCP 8.5), illuminating possible spatial variations in the cell size–dependent responses of diatom growth.
Materials and Methods
Model Overview
We constructed a model of a spherical diatom cell to quantify its acquisition rates of CO2 and/or HCO3– and to solve for the optimal allocation of metabolic energy between HCO3– uptake and biomass synthesis (i.e., growth) over a day (Figure 1). Given cell radius R (μm) and CO2 concentration in bulk water [CO2]bulk (μM), the model simulates a daily growth rate g /day:
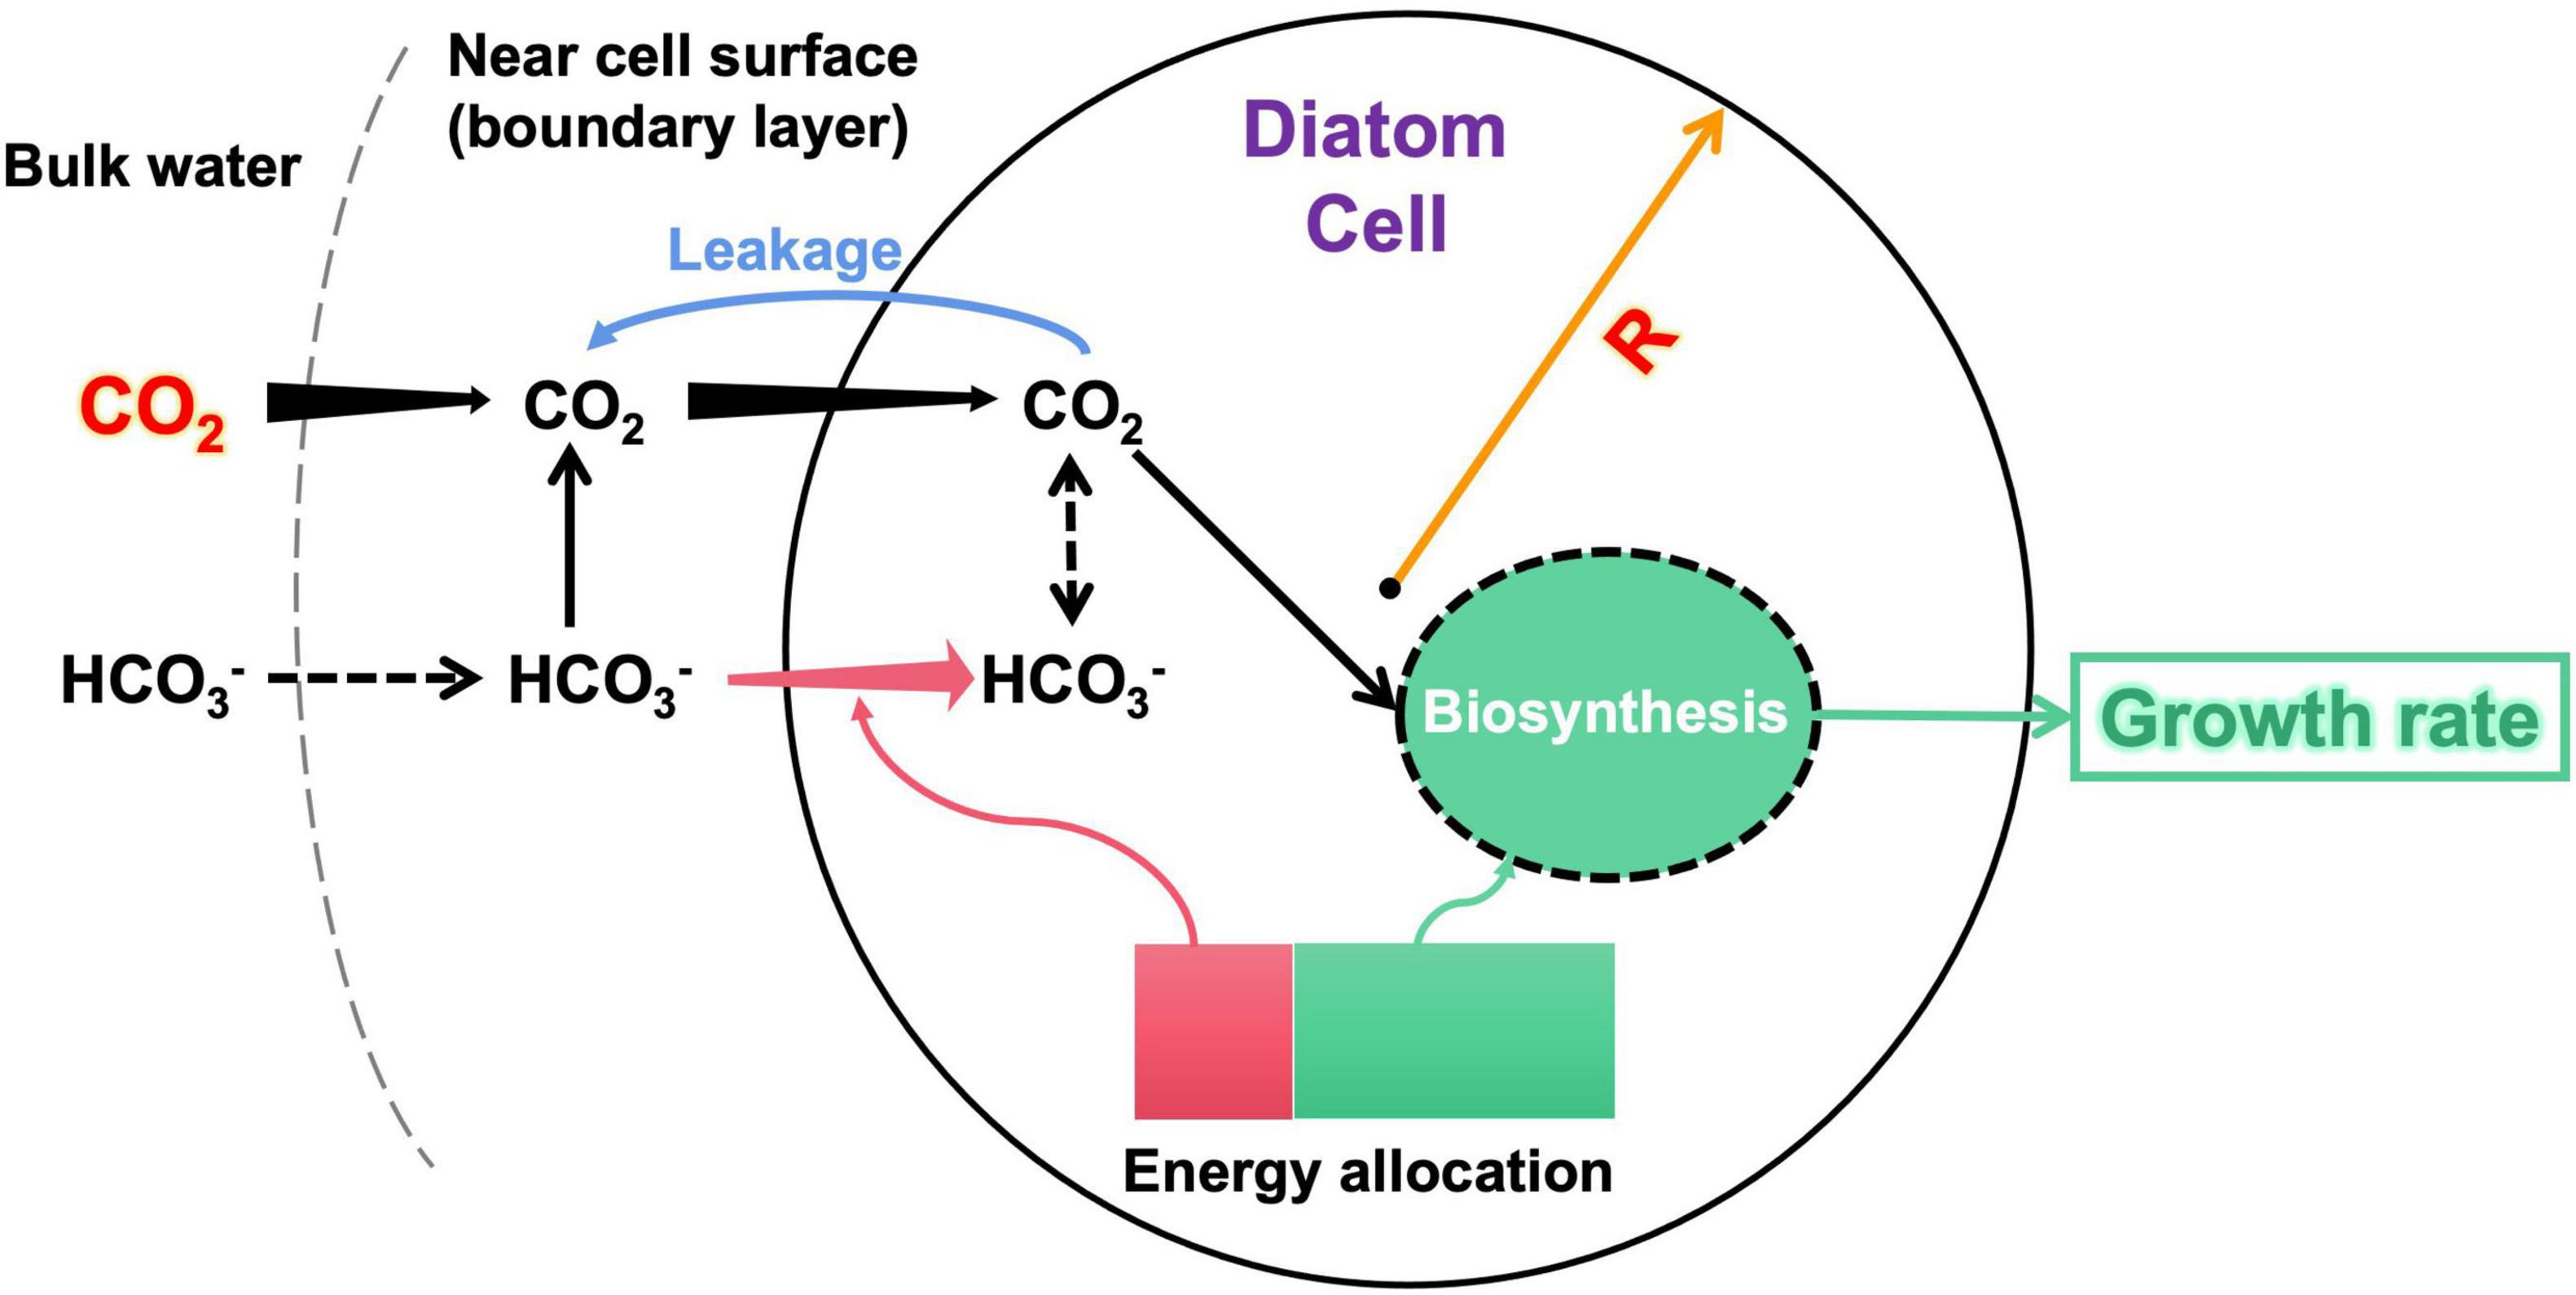
Figure 1. Illumination of the model structure. The input variables of the model are diatom cell radius R and bulk-water CO2 concentration. The model estimates the CO2 supply (black arrows) to the cell considering both CO2 diffusion and HCO3– dehydration near the cell surface, energy-consuming HCO3– transport (pink arrows), and CO2 leakage (blue arrow) across cell membranes. The model finally calculates an optimal allocation of metabolic energy between HCO3– acquisition and biomass synthesis, which derives the growth rate as the model output. An arrow with increasing (decreasing) width along the direction represents that the flux increases (decreases) with the cell radius. The dashed arrows are not explicitly simulated by the model. More details of the model are described in the text.
Note that although the model uses the cell radius to simplify calculations, the results are conventionally reported using the cell diameter.
The model first calculates the cell-specific acquisition rate of CO2 under given R and [CO2]bulk. The model then counted the CO2 leakage from the cell. The model reaches a maximal growth rate if the net acquisition of CO2 is sufficient; otherwise, it lowers the growth rate to save metabolic energy for actively acquiring HCO3– as a carbon complement. The lowered growth also reduces the total carbon demand, partly relieving the requirement for HCO3–. Note that we set a minimum HCO3– acquisition at 20% of the total carbon demand even if the CO2 supply is sufficient, reflecting findings that even very small diatoms also take HCO3– (e.g., Burkhardt et al., 2001; Shi et al., 2019). Therefore, there exists a solution for the modeled growth rate at which cellular energy is optimally allocated between HCO3– acquisition and growth.
The parameter values of the model (Supplementary Table 1) were set up based on the literature as described below. Our model only represents fundamental metabolic processes of cell growth and focuses on the responses of diatom growth to increasing CO2, particularly the dynamics of HCO3– acquisition as the secondary inorganic carbon source, while ignoring other complex physiological processes.
Model Scheme of the CO2 Supply
Our model scheme of the CO2 supply rate to the cell (FT, μmol/cell/day) is established by improving those of previous studies (Gavis and Ferguson, 1975; Wolf-Gladrow and Riebesell, 1997; Reinfelder, 2011) in which both CO2 diffusion and CO2 dehydrated from HCO3– near the cell surface are included
where 3.456 × 10–10 = 4 × 10–15 L ⋅μm–3 × 86,400 s/day, in which the constant of 4 is from the original equation (Gavis and Ferguson, 1975), 10–15 is the factor to convert μm3 to L for consistency with the unit used in CO2 concentrations, and 86,400 is the factor to convert day to second; D (μm2/s) is the diffusivity of CO2 in water k′ (s–1) is a combined rate constant for the hydration of CO2 with H2O and OH–, with its value estimated at 15°C, pH of 8.1 and salinity of 35 PSU (Supplementary Table 1; Wolf-Gladrow and Riebesell, 1997; Reinfelder, 2011), and [CO2]sfc (μM = μmol L–1) is the seawater CO2 concentration near the cell surface. Although [CO2]sfc can be effectively eliminated from the equation by assuming that it was 1/3 of [CO2]bulk, as done in a previous study (Reinfelder, 2011), [CO2]sfc is likely to decline with increasing cell size (Flynn et al., 2012). In this study, we further solve [CO2]sfc by assuming a balance between CO2 supply to the cell surface (FT) and CO2 permeation across the cell membrane (FP, μmol/cell/day):
where P (μm/s) is the CO2 permeability coefficient of the cell membrane, ΔCO2 = 10% is the relative reduction in CO2 concentration from near the cell surface to the cytoplasm (Hopkinson et al., 2016), that is, ΔCO2[CO2]sfc is the difference in CO2 concentration between the two sides of the cell membrane, and 3.456 × 10–10 = 4 × 10–15 L ⋅μm–3 × 86,400 s/day. From Eqs. 2 and 3, [CO2]sfc can be solved as a function of input variables R and[CO2]bulk:
where . This equation generates a declining [CO2]sfc with increasing cell size, as expected (Supplementary Figure 1). FT can then be obtained by substituting Eq. 2 into either Eq. 3 or Eq. 4.
This scheme introduces a new parameter P, for which the maximal value of 560 μm/s found in experiments of several diatom species (Hopkinson et al., 2011) is used in the model (Supplementary Table 1). The assumption of FT=FP used in the scheme (Eq. 3) implies that CO2 supplied to the cell surface is completely acquired by the cell, and the CO2 supply rate is solved at its maximal potential, which we annotate as FT,max.
Model Scheme of Energy Constraint
The energetic cost of growth is estimated by adding the theoretical requirements of ATP when synthesizing particulate organic carbon (POC) from CO2 [3 mol ATP (mol C) –1] (Raven, 1991) and synthesizing particulate organic nitrogen (PON) from nitrate [2 mol ATP (mol N) –1] (Eichner et al., 2014), which is equivalent to ∼ 0.30 ATP (mol C) –1 by using a Redfieldian molar C:N ratio of 106:16. By further assuming small additional energy of 0.2 mol ATP (mol C) –1 used in other cellular processes, the energy cost rate for growth, eg, is set at 3.5 ATP (mol C) –1 (Supplementary Table 1).
The intracellular energy production rate E0 [ATP/mol C/day] is set at:
where the maximal daily average growth rate g0 = 3.0/day represents those maximal rates found in previous experiments culturing diatoms under saturating light and nutrients (Sarthou et al., 2005). The instantaneous maximal growth rate (and consequently, E0) is further set to vary in a 12:12 h light–dark cycle in which the rate peaks for 6 h around noon to represent light saturation, while its daily average is kept at g0 (Supplementary Figure 2). This setup can improve the model performance to mimic the diel variation of inorganic carbon demand. For example, a model cell that would have sufficient CO2 supply, should its maximal growth rate be set constant at g0, may become, after implementing the diel cycle, CO2-limiting and have to acquire HCO3– around noon when the instantaneous maximal growth rate is 8/3 times higher than g0 (Supplementary Figure 2).
ATP expenditure by CCM is generally high in diatoms (Raven, 1991), which may be partially satisfied by the Mehler reaction (Behrenfeld et al., 2008). The energy cost for diatoms to transport 1 HCO3– molecule has been estimated at 0.5 ATP to cross the cytoplasmic membrane (Liu et al., 2017) and 1 ATP to cross the chloroplast membrane to reach pyrenoids (Raven et al., 2000). Therefore, we set the energy cost rate for HCO3– acquisition, ebc, at 1.5 ATP (mol C) –1 (Supplementary Table 1).
Model Scheme of Growth Rate
The net inorganic carbon acquisition rate F (μmol/cell/day) is
where Fbc (μmol/cell/day) is the HCO3– acquisition rate, and lk = 30% is the fraction of acquired carbon leaking from the cell based on a previously reported CO2 efflux for diatoms (Burkhardt et al., 2001). Note that the leakage in the model does not count the exudation, which, however, could be small (∼5% of primary production) in exponentially growing phytoplankton (Nagata, 2000). The model sensitivity to lk was also tested (see below).
If both FT and Fbc are determined (discussed below), F can be solved (Eq. 6), and the growth rate is then
where qc is the cell carbon quota (μmol cell–1) estimated by adopting an empirical relationship with the cell volume of diatoms (Menden-Deuer and Lessard, 2000):
FT and Fbc are optimally solved under the constraint of intracellular energy production E0. The intracellular energy requirement is:
in which
A trial rate of HCO3– acquisition (Fbc) is first set to be the minimal fraction () of total carbon uptake (FT,max + Fbc) so that:
Then, a trial energy requirement E is calculated using Eqs. 10–12 and setting FT = FT,max (see section “Model Scheme of the CO2 Supply”). When E > E0, energy production limits growth and the total carbon supply is more than sufficient. Therefore, the effective FT and Fbc must be smaller than their trial rates while their ratio holds. Therefore, a factor of E0/E is multiplied by FT,max and the trial Fbc to obtain the effective FT and Fbc, which ensures E = E0.
However, a trial rate of E larger than E0 indicates that the inorganic carbon supply is insufficient, additional acquisition of HCO3– is needed, and the effective FT is at its maximal allowed rate FT,max. The effective Fbc is calculated from Eqs. 9–11 by setting E = E0 (Eq. 9) and FT = FT,max (Eq. 10).
Once the effective FT and Fbc are determined in either case, the growth rate g can be calculated from Eqs. 6, 7. Noting that the intracellular energy produced is fully used, the scheme described here solves an optimal allocation of intracellular energy to estimate g at its maximal potential.
Model Simulation
The cell growth rate was simulated at two levels of bulk-water CO2 concentrations of 10 μM (low carbon condition, LC) and 20 μM (high carbon condition, HC) over a diameter range of 2–200 μm. LC was selected at 10 μM to represent the typical condition of subtropical surface ocean waters. GRR is calculated as the ratio of the simulated growth rates under HC and LC. We also calculated two key indicators, the value of the peak GRR over the simulated diameter range and the corresponding cell diameter at the peak GRR (namely, the optimal cell diameter).
Sensitivity Tests
Our model does not represent other factors, such as light and nutrient concentrations, that can limit the diatom growth rate. Instead, the model parameter g0 can be considered to represent collective effects from multiple limiting factors. We then conducted model experiments by setting g0 at 0.1, 0.5, 1.0, and 2.0/day.
We also compared the model sensitivity, in terms of the peak GRR and the optimal cell diameter, to 6 model parameters, including P, lk, ebc, g0, △CO2, and . These parameters were tested in a range of ± 50% of their default values. The model was also tested over 12–30 μM of the input variable [CO2]bulk in HC.
Analysis of Historical Data of Diatom CO2 Enrichment Experiments
We collected 85 pairs of growth rate data from published CO2 enrichment experiments culturing diatoms, among which 5 pairs of data were removed due to extremely high culturing CO2 concentrations (Supplementary Table 2). Due to different magnitudes of CO2 enrichment, we linearly adjusted the originally reported GRR (GRRorig) cultured under high ([CO2]H) and low ([CO2]L) CO2 concentrations to GRRadj at a CO2-enrichment factor (fCO2) of 200%:
The cell diameters of the diatoms were either reported in the experiments or estimated using the average diameters of the same species collected in a global diatom database (Leblanc et al., 2012a). Considering the purpose of this study, for nonspherical diatom species, we simply used the length of their shortest dimension as the cell diameter because it was the shortest distance that inorganic carbon was transported to the cell center, admitting that this simplification slightly overestimated the CO2 supply rate.
Global Prediction
We projected the peak GRR and optimal cell size of diatoms to CO2 increase in global surface seawater over the 21st century. We first obtained projected results from the Community Earth System Model (CESM) 1.0-BGC module under the RCP8.5 scenario, including the annual climatology of CO2 partial pressure, pH, temperature, diatom carbon fixation rate, and diatom carbon biomass during the historical (1990–2000) and future (2090–2100) periods1. The CO2 partial pressure, pH, and temperature were used to calculate the CO2 concentration using CO2SYS (Lewis and Wallace, 1998). The diatom growth rates were calculated as the ratio of the diatom carbon fixation rate to the diatom carbon biomass.
The cellular model ran using historical and future CO2 concentrations to estimate monthly peak GRR and optimal cell size at a resolution of 1°× 1° in the global ocean, in which historical diatom growth rates were used to set location specificity g0. Because CESM did not simulate diatom sizes, our results can only be regarded as a demonstration of the spatial variations in the responses of diatoms impacted by the magnitude of CO2 increase and environmental favorability (such as nutrients, temperature, and light), with the latter collectively represented here by the CESM-projected diatom growth rate.
The scientific color map batlow was used in the plot of the global prediction to prevent visual distortion of the data and exclusion of readers with color-vision deficiencies (Crameri et al., 2020).
Results
Model Results
The modeled cell growth rate declines with increasing cell diameter under LC, while the modeled growth under HC remains at a maximal rate of 2.67/day before it starts to decline when its diameter is larger than 7 μm (Figure 2A). As the ratio of the modeled growth rate under HC to that under LC, the GRR increases with cell diameter, reaches a peak value of 1.14 at an optimal cell diameter of 7 μm, and then gradually decreases to 1.02 at the modeled maximal cell diameter (Figure 2B).
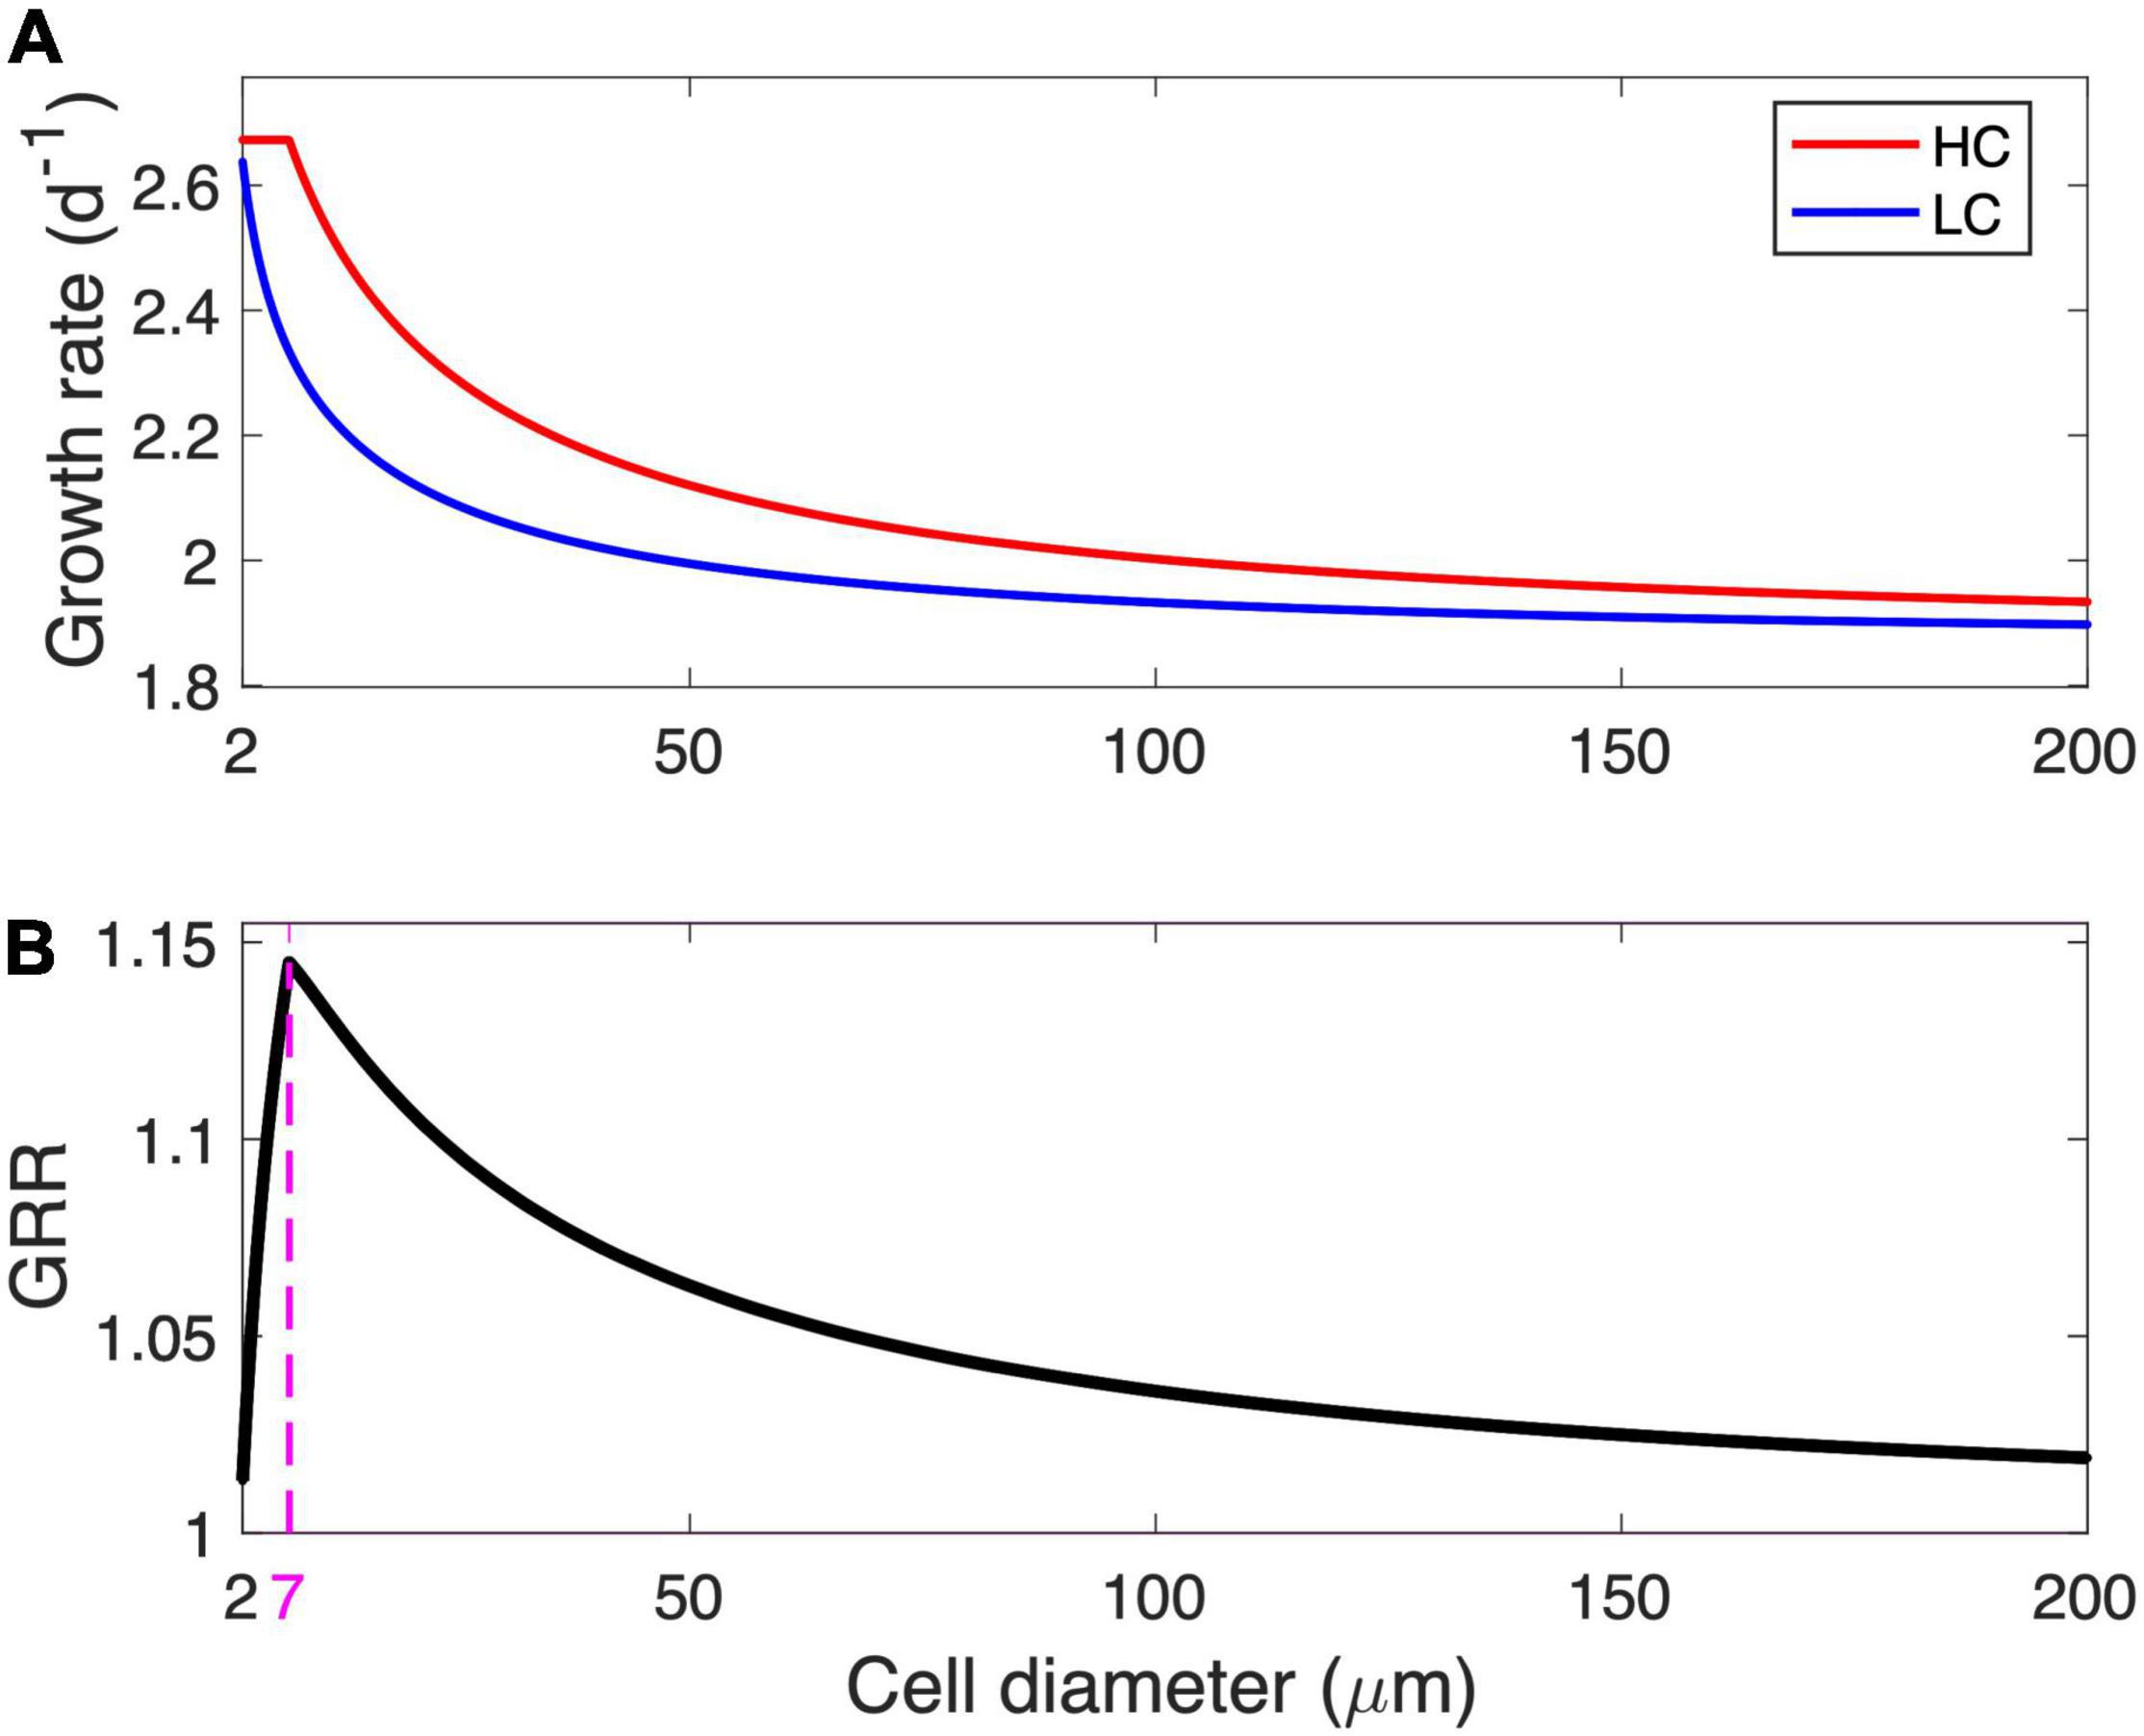
Figure 2. Modeled growth rate and growth rate response (GRR). (A) Modeled growth rate under low-CO2 (LC, 10 μM) and high-CO2 (HC, 20 μM) conditions and (B) the corresponding GRR from LC to HC as a function of cell diameter. The magenta dashed line and number in (B) represent the optimal cell diameter at peak GRR.
We then analyze the inorganic carbon (Ci) budget of the model cell in two cell diameter ranges. As expected, the model simulates a decreasing CO2 supply rate with increasing cell diameter (Figure 3). First, for cells with a diameter < 7 μm, CO2 and minimum HCO3– supply under LC are insufficient to meet the requirements of both growth and leakage, causing HCO3– acquisition to increase with cell size (Figure 3A). However, under HC, CO2 and minimum HCO3– supply are sufficient, and cells do not acquire additional HCO3– (Figure 3B). Second, for cells with a diameter > 7 μm, CO2 and minimum HCO3– supply become insufficient even under HC (Figure 3B), and the modeled HCO3– acquisition increases with cell size under both HC and LC (Figure 3).
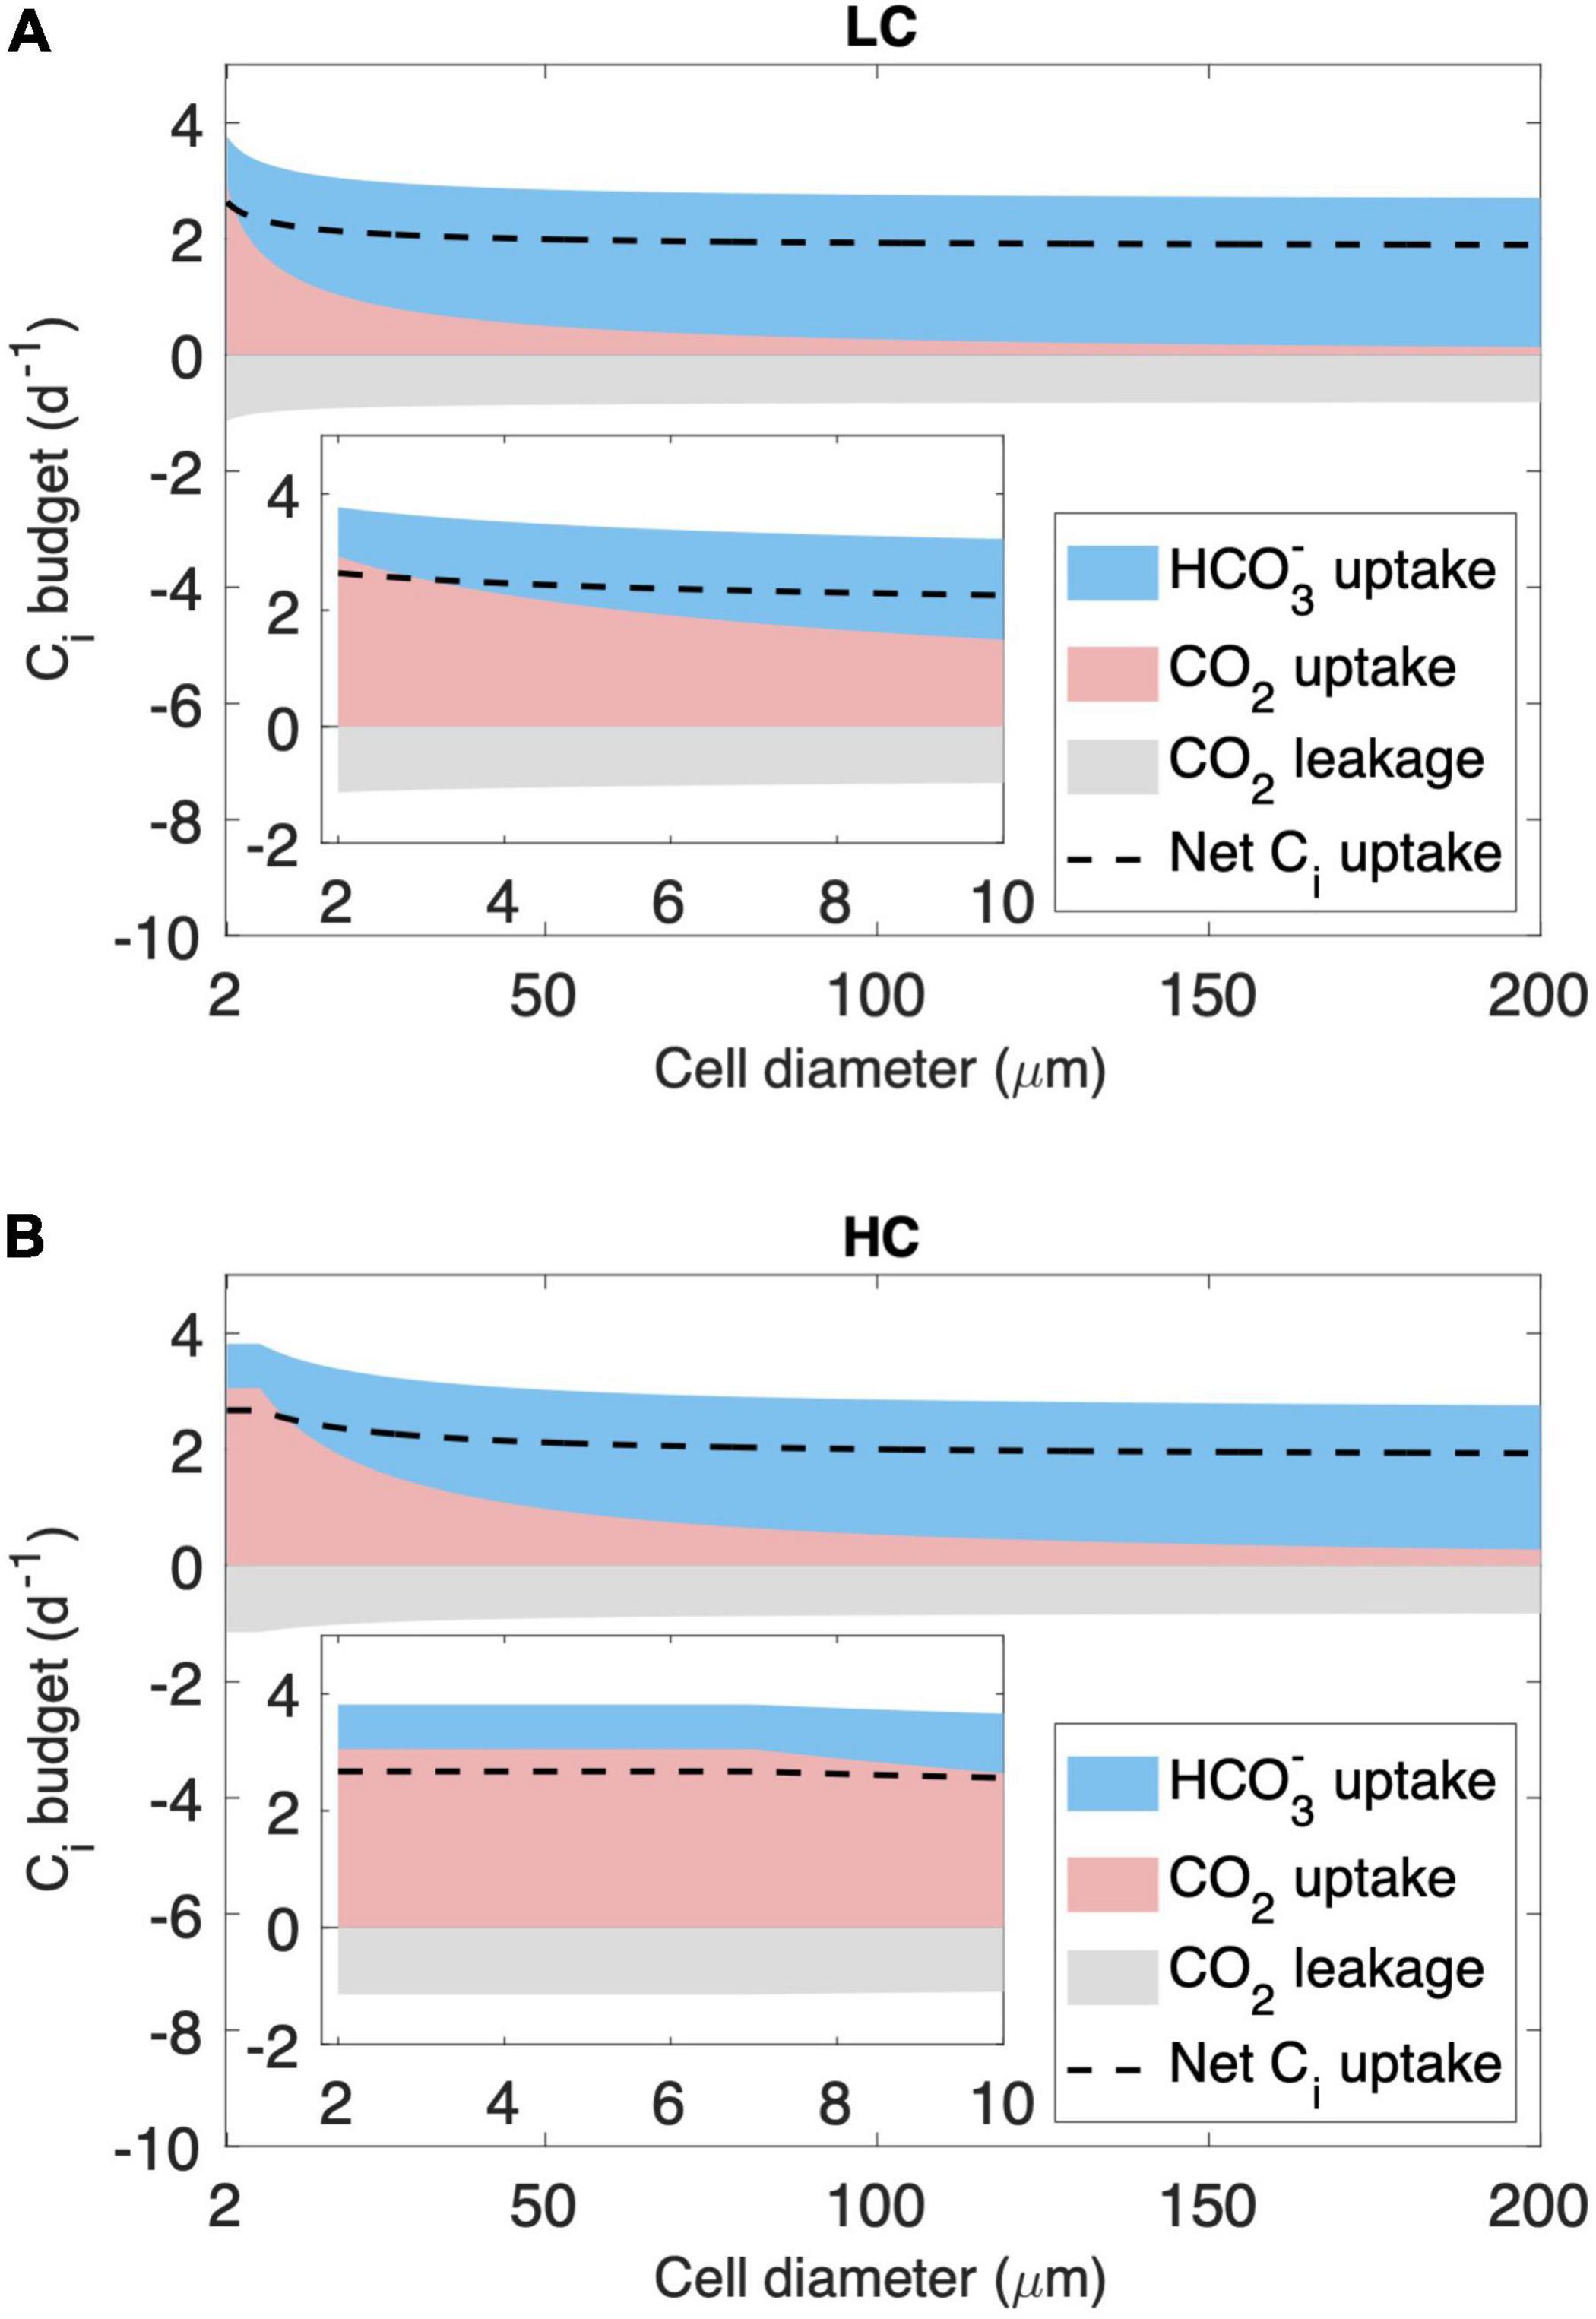
Figure 3. Modeled inorganic carbon (Ci) budget (normalized to cell carbon biomass) across the cytoplasmic membrane. The results shown include those under (A) the low-CO2 (LC, 10 μM) and (B) high-CO2 (HC, 20 μM) conditions in the cell diameter of the full modeled range and zoomed in to 2–10 μm. Ci is acquired in the form of HCO3– (blue area) and CO2 (pink area), and part of the CO2 leaks out of the cell (gray area), resulting in a net Ci uptake used for cell growth (dashed line).
The modeled pattern between GRR and cell size (Figure 2B) is mainly determined by the magnitude of energy savings on HCO3– acquisition from LC to HC (Figure 4). In the cell diameter range < 7 μm, the energy expenditure on HCO3– increases greatly with increasing cell size under LC but is unchanged under HC, resulting in substantial energy savings that increase with cell size (Figure 4). In the cell diameter range > 7 μm, however, the energy used in HCO3– acquisition increases with cell size under both HC and LC, leading to a narrowed difference between the two (Figure 4). This can be explained by the decrease in the relative contribution of CO2 to the total Ci acquisition with increasing cell size (Figure 3): The fraction of HCO3– acquisition that can be substituted by the same magnitude of the elevated CO2 supply decreases in larger diatoms. In other words, larger cells become less sensitive to the CO2 increase.
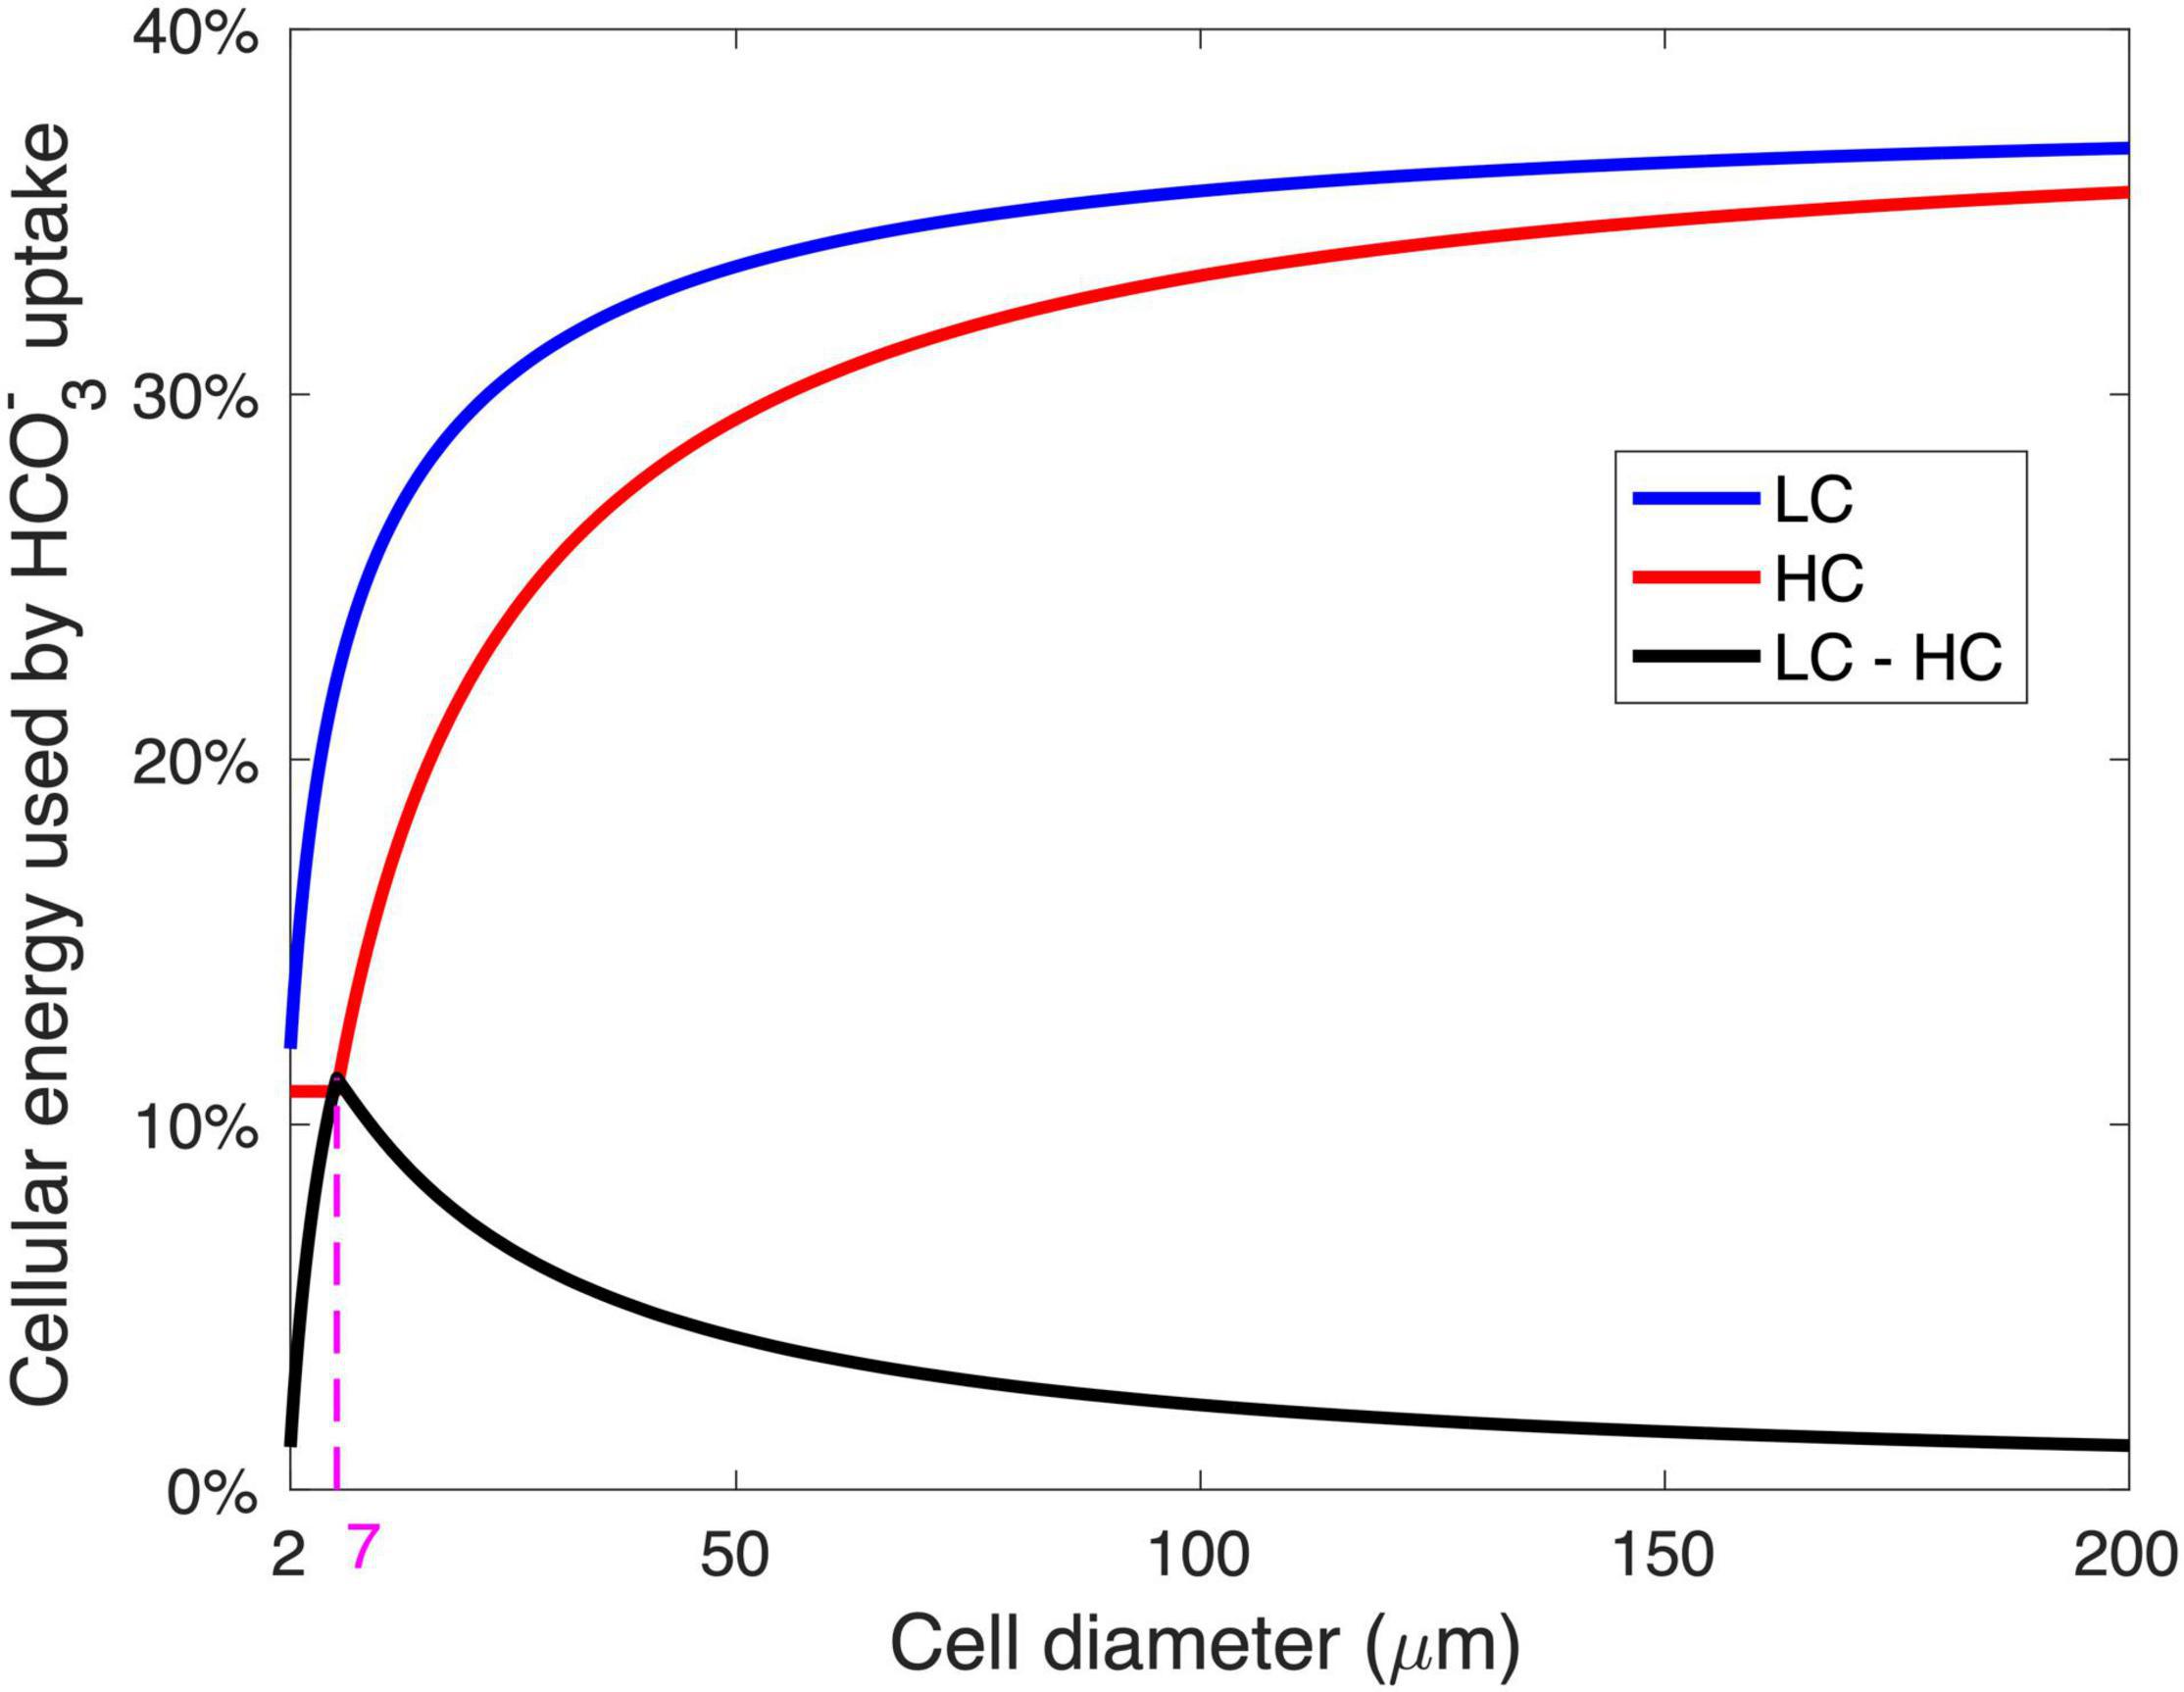
Figure 4. The relationship between the modeled energy consumption for HCO3– acquisition and the cell diameter. The energy for HCO3– acquisition is shown as the fraction of total cellular metabolic energy under the low-CO2 (LC, 10 μM) (blue) and high-CO2 (HC, 20 μM) (red) conditions, as well as the saved energy in HCO3– acquisition when the condition changed from LC to HC (black). The magenta dashed line and number represent the optimal cell diameter at maximal energy savings from LC and HC.
The model reveals a general pattern in which (1) the smallest diatoms respond weakly to the increase in seawater CO2 because CO2 supply fulfills most of the cell demand even without that increase, (2) the response intensifies with a moderate enlargement in cell size, while (3) large cells are insensitive to the CO2 increase because CO2 supply is a small contribution to total Ci acquisition. There exists an optimal, intermediate cell size in which the modeled cell growth rate is enhanced the most by the same magnitude of CO2 increase. Our model shows that the optimal cell size corresponds to a point where the model cell under HC just starts to use HCO3–.
Sensitivity Tests
The maximal growth rate (g0) has been set at a high level assuming that the modeled diatom grows at optimal conditions. We then conduct the model experiments with lowered g0, representing that the growth of the modeled diatom is limited by other factors. The results show that the modeled diatom starts to benefit from the CO2 increase at larger cell sizes when g0 decreases, so that the optimal cell size also increases (Figure 5A). This result is expected because the modeled diatom needs less inorganic carbon at a lowered g0, and the CO2 supply alone becomes sufficient for larger diatoms. At very low g0 values, such as 0.1/day, the CO2 supply is even sufficient at the maximal cell diameter simulated in our model (200 μm), and diatoms do not respond to the CO2 increase in the whole model domain (Figure 5A). Additionally, g0 does not impact the modeled peak GRR (Figure 5A), the reason for which is discussed below. These results indicate that the optimal cell size of diatoms in response to the CO2 increase tends to be small when the environmental conditions favor their growth but can be larger when other factors are also limiting.
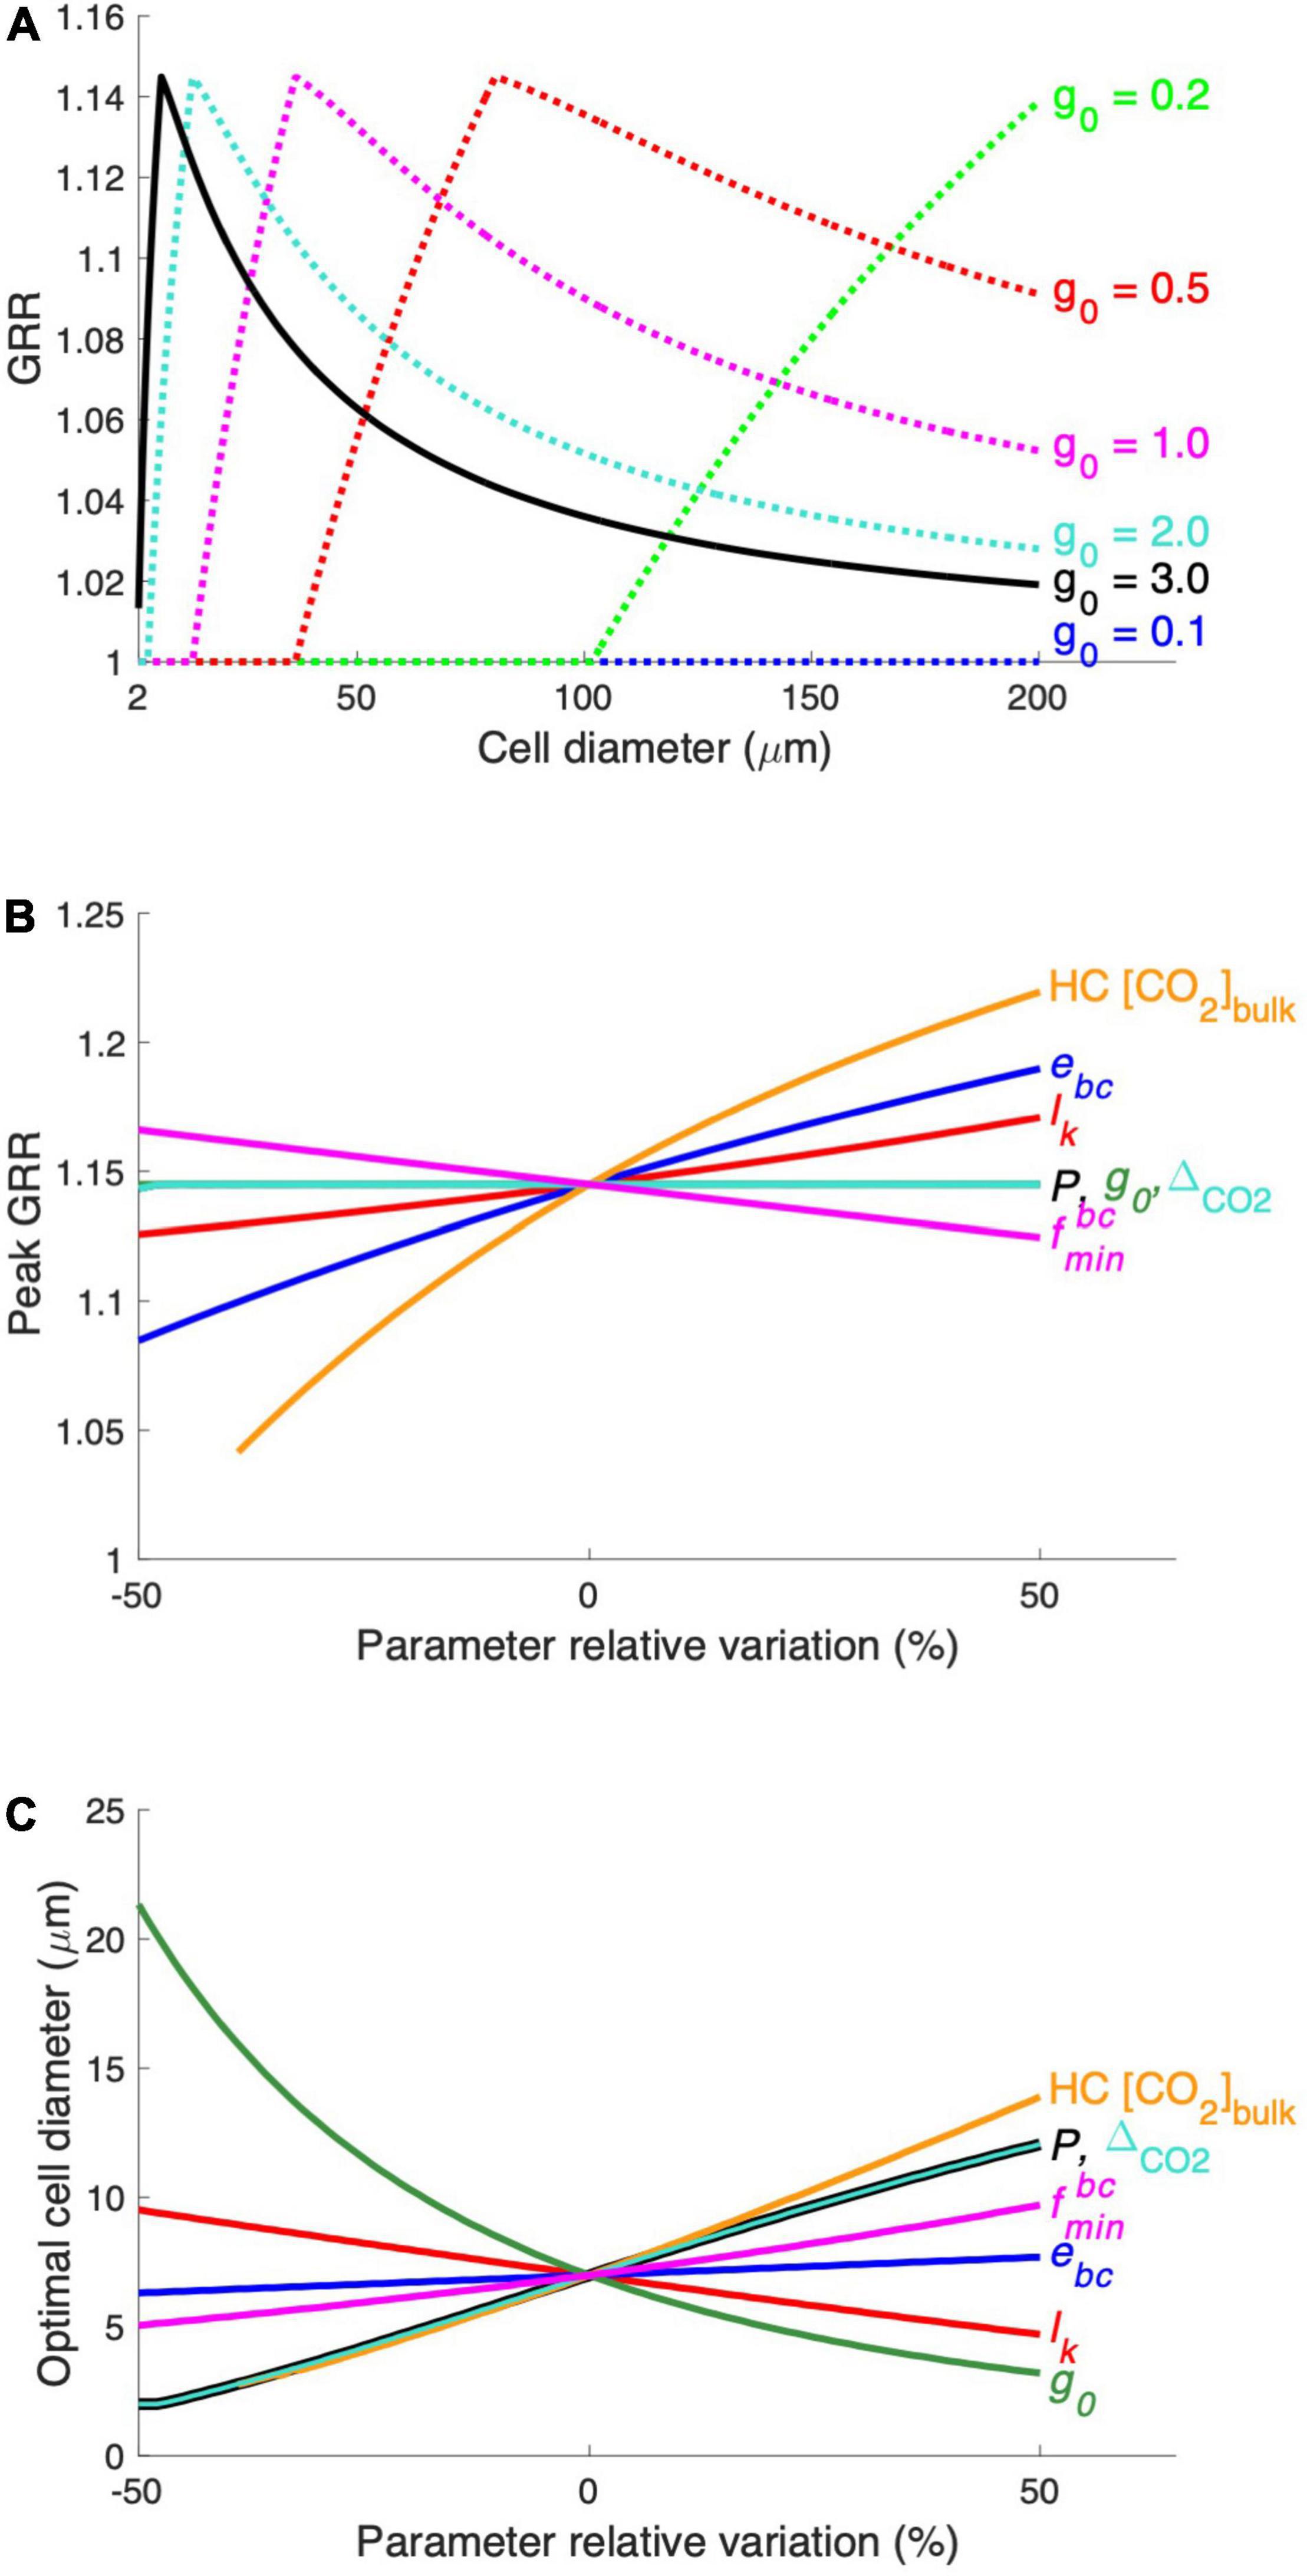
Figure 5. Results of the parameter sensitivity experiment. (A) The modeled relationship between GRR and cell diameter is tested at different levels of the model parameter g0 (maximal growth rate). The modeled peak GRR (B) and the optimal cell diameter (C) were tested against ± 50% of the default values of the parameters. See Supplementary Table 1 for parameter symbols and their default values. The range of HC CO2 concentrations (HC [CO2]bulk) tested in this experiment was 12–30 μM.
We also compared the sensitivity of the modeled peak GRR (Figure 5B) and optimal cell size (Figure 5C) to various model parameters. The CO2 supply rate, mainly determined by the production of the CO2 permeability (P) and CO2 gradient across the cytoplasmic membrane (△CO2) (Eqs. 3, 4), has a positive relationship with the optimal cell size but does not impact the GRR. This can be more clearly understood from a model experiment with a 50% higher P (Supplementary Figure 3A): The cell needs to use additional HCO3– at large cell sizes with increased CO2 supply. Hence, the curves of HCO3– acquisition energy under both HC and LC move toward larger cell sizes without noticeable changes in the magnitude of the energy cost, leading to a moderately elevated optimal cell size but unchanged peak GRR (Figures 5B,C; Supplementary Figure 3A). Similarly, a smaller maximal daily growth rate (g0) also leads to a larger optimal cell size but no effect on peak GRR (Figure 5 and Supplementary Figure 3B) because the lowered carbon demand also allows larger cells to only use CO2. In contrast, reduced CO2 leakage (lk) lowers the requirement of HCO3– acquisition and shrinks the difference in energy cost between HC and LC, causing a decreased GRR and enlarged optimal cell size (Figure 5 and Supplementary Figure 3C).
The elevated energy cost rate of HCO3– acquisition (ebc) substantially increases the peak GRR but has little effect on the optimal cell size (Figures 5B,C) because it mainly determines the energy allocation and not the cell size at which HCO3– acquisition is needed. The high bulk-water CO2 concentration of HC (HC[CO2]bulk) greatly increases both the peak GRR and the optimal cell size (Figures 5B,C), which is expected because the cell under HC benefits more from higher CO2 while starting to use HCO3– at a larger size. The minimum HCO3– uptake proportion () slightly impacts both the peak GRR and the optimal cell size: a higher leads to a reduced model sensitivity to the change in CO2 and results in a lower peak GRR and a larger optimal cell size.
Our model sensitivity tests reveal that the peak GRR is largely determined by the magnitude of the seawater CO2 increase and the energy consumption rate in HCO3– acquisition. Meanwhile, the optimal cell diameter increases with increasing CO2 supply (higher membrane permeability to CO2 and larger increase in seawater CO2) but decreases with cellular carbon demand, such as higher growth and leakage rates.
Discussion
Unimodal Relationship Between Growth Rate Response and Cell Size
Our theoretical model reveals a unimodal relationship between the GRR and diatom cell size. Although the increased CO2 concentration and acidified seawater can have multiple physiological effects on diatoms, our model considers the most direct effect: the variations in species and rates of inorganic carbon acquired by diatoms. The absolute rates of growth do not solely determine the competition among phytoplankton because they can also be controlled by other factors, such as zooplankton grazing and viral lysis, which is also suggested by the fact that phytoplankton with different growth rates coexist in the ocean. A phytoplankton species with a stronger enhancement in the growth rate from the CO2 increase, can have a better advantage and reach higher biomass when competing with other phytoplankton, which is also confirmed by a modeling study (Dutkiewicz et al., 2015). Therefore, the unimodal relationship between GRR and diatom cell size shown by our model suggests a competitive advantage for middle-sized diatoms of ∼7 μm in the future high-CO2 ocean.
It is generally true that organisms limited more strongly by a resource should benefit more from its repletion, but only if there are no substitute resources. CO2, for example, is not the only carbon resource for phytoplankton and can be complemented by, although not preferentially, HCO3– when CO2 is insufficient. This is the important reason why our model reveals that middle-sized diatoms can have a competitive advantage over larger diatoms from elevated CO2, even though the latter is limited more strongly by CO2.
We also explored the GRR–cell size relationship using historical data from CO2 manipulation experiments of diatoms. The originally reported GRR in those experiments was first interpolated to the same degree of CO2 enrichment (Supplementary Figure 4 and Supplementary Table 2, see section “Materials and Methods”). The adjusted GRRs varied greatly (0.7–1.4) and did not support the previous speculation that the GRR should increase with cell size (Spearman’s correlation, p = 0.59) (Figure 6). The GRRs also did not directly show the same pattern as that proposed by our model. However, all GRRs higher than 1.2 were only found in cell diameters of 3–7 μm, while the GRRs at other cell diameters were mostly lower than 1.1 (Figure 6). This may indicate that the growth rate of diatoms in this middle cell size range had the greatest potential to respond to increasing seawater CO2. Additionally, the GRRs in the same size range also varied the most (Figure 6), suggesting that the GRR of middle-sized diatoms can be impacted by different factors and mechanisms and/or be species specific. Interestingly, considering the species in the genus Thalassiosira that had the largest cell diameter range (3.9–47 μm) in our dataset, their GRRs decreased with cell diameter (Spearman’s correlation = −0.45, p < 0.05), with GRRs in cell diameter ≤ 7 μm (1.14 ± 0.13, mean ± s.d.; n = 11) significantly higher than those in cells > 7 μm in diameter (1.00 ± 0.06, mean ± s.d.; n = 10) (t-test, p < 0.01). Nevertheless, these historical data showed some consistency with our model, while the GRR can be a synergistic result impacted not only by cell size but also by other physiological and ecological characteristics and culturing conditions. More studies are needed to reveal complex mechanisms controlling the GRR.
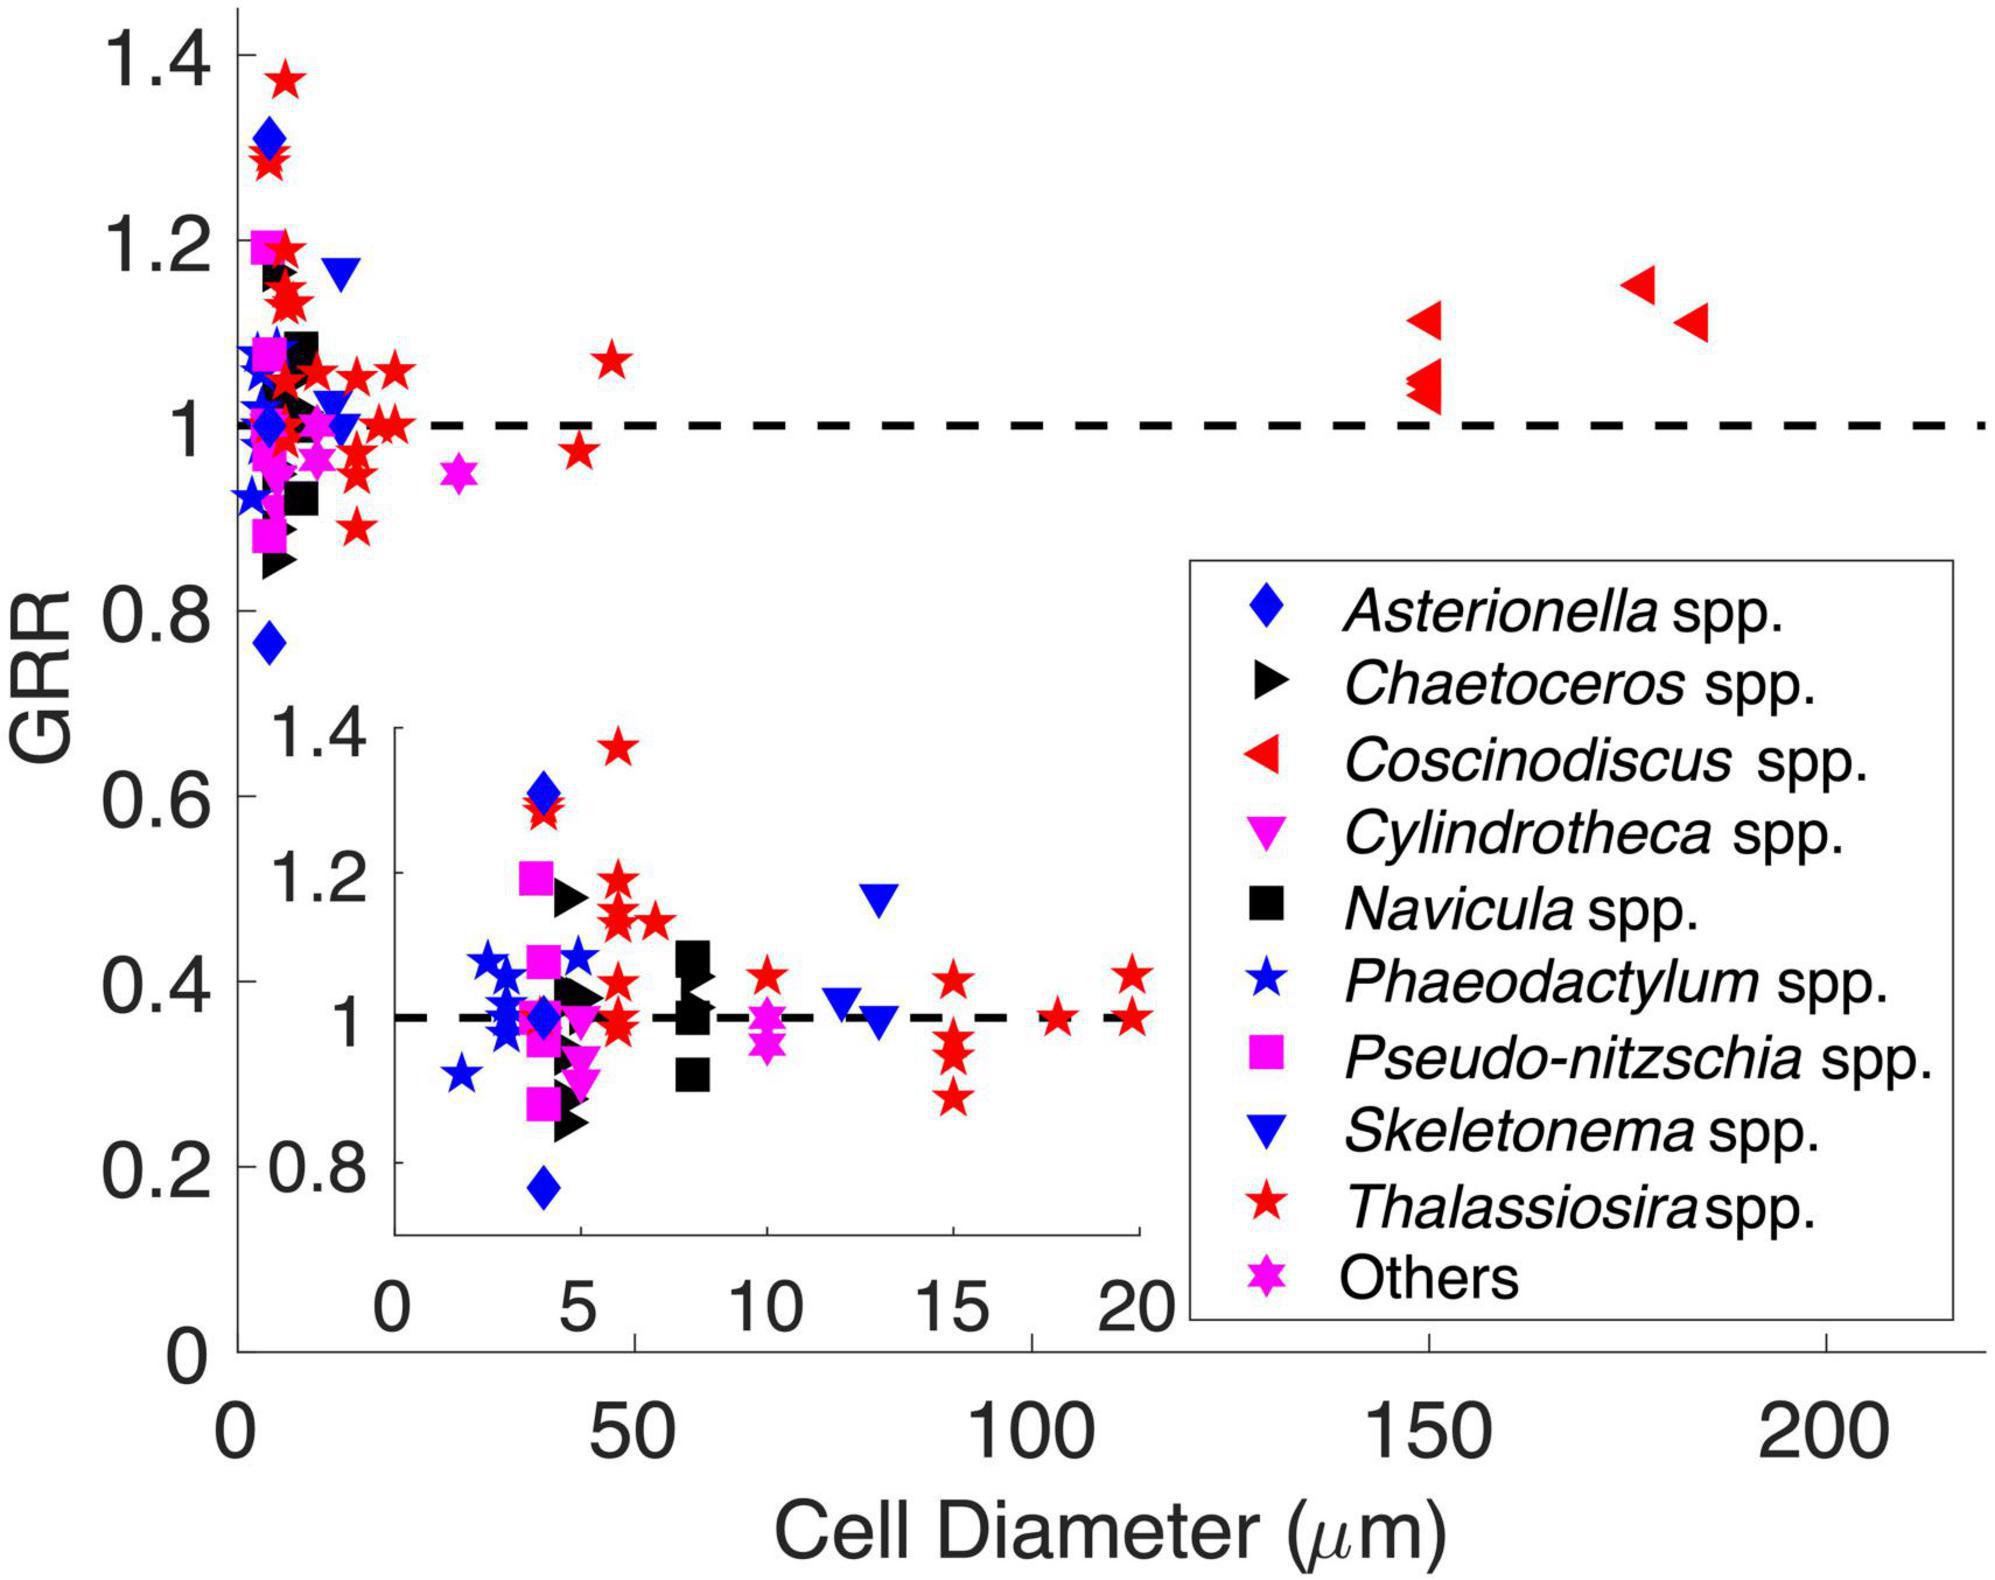
Figure 6. Historical data of diatom CO2 enrichment experiments showing the growth rate response (GRR) over cell diameter. The dashed line represents no response (GRR = 1). The inset is magnified to a cell range of 1–20 μm.
Other studies may directly or indirectly support our model. Hancock et al. (2018) cultured a near-shore Antarctic community over a gradient of CO2 levels, showing that the abundance of nanosized diatoms (2–20 μm in diameter) increased with CO2, while larger microplanktonic diatoms (>20 μm in diameter) and smaller discoid centric diatoms of 1–2 μm in diameter had no significant response to CO2. Other studies also showed that middle-sized diatom species (∼8 μm) had an increased contribution to the community under increased CO2 (Hoppe et al., 2013; Eggers et al., 2014).
We also constructed a new scheme of the maximal seawater CO2 supply rate to diatom cells as a function of cell size. Compared to other studies (Milligan et al., 2009; Reinfelder, 2011), the new scheme solves a cell size–dependent CO2 concentration near the cell surface (Supplementary Figure 1). Our scheme introduces a new constant parameter, the CO2 permeability of the cell membrane. Although elevated seawater CO2 can lead to a saturated CO2 supply and reduce the effective CO2 permeability (e.g., Sultemeyer and Rinast, 1996), our scheme is constructed to study the maximal effect of seawater CO2 increase and therefore uses the maximal potential of CO2 permeability, which theoretically is determined by the number of channels such as pores and aquaporins (Matsui et al., 2018; Blanco-Ameijeiras et al., 2020) allowed per unit area of the cell membrane and should be independent of cell size. Limited data on diatom CO2 permeability (Hopkinson et al., 2011) also do not show a clear relationship to cell size. Our model scheme therefore can be more suitable to quantify the relationship between phytoplankton cell size and their maximal potential for CO2 uptake.
Model Experiments of Additional Processes
The growth rates of diatoms are generally inversely related to cell sizes (Cosper, 1982; Sarthou et al., 2005; Marañón, 2015), which could result from a lower CO2 supply rate to larger diatoms, as observed in this study, and/or other size-dependent physiological characteristics of diatoms. This implies that the constant model parameter of maximal growth rate g0 can in reality decline with increasing cell size. We then conducted a model experiment by using an empirical function for diatoms (Sarthou et al., 2005):
where V was the cell volume (μm3). In the results, the unimodal pattern between GRR and cell size remained (Supplementary Figure 5), although the optimal cell size increased to 45 μm, which was expected because of the negative relationship between the optimal cell size and g0 (Figure 5B).
As eCA can be potentially important in particularly large phytoplankton in converting HCO3– to CO2 extracellularly (Martin and Tortell, 2008; Tortell et al., 2008; Chrachri et al., 2018) and therefore saving energy on HCO3– acquisition, we tested its role by increasing the conversion rate of HCO3– to CO2 in the model by an enhancement factor (feCA) of 2–10 (Tortell et al., 2008). As the ratio of the chemical conversion between HCO3– and CO2 to the CO2 diffusivity is (Eq. 2) (Reinfelder, 2011), the CO2 supply (FT) was then enhanced to a new rate:
In the model experiments, although the GRR was elevated in the large cells, the unimodal pattern between the GRR and cell size, the optimal cell diameter, and the magnitude of peak GRR were barely changed (Supplementary Figure 6A). We also conducted another model experiment by linearly increasing feCA from 1 (i.e., no enhancement) at the smallest cell diameter (2 μm) to 10 at a cell diameter of 200 μm to mimic a hypothetical scenario of stronger eCA of larger cells, and still obtained a similar pattern between the GRR and cell size, except that the GRR remained at a constant low level when the cell diameter was >100 μm (Supplementary Figure 6B).
The two parameters D and k′ used in the CO2 reaction–diffusion kinetics (Eq. 2) are fixed in our model, while in reality, they change with temperature (Wolf-Gladrow and Riebesell, 1997). A sensitivity test of temperature-dependent D and k′, however, showed no obvious effect on the model results (Supplementary Figure 7).
The above experiments can partly support the robustness of our model results, suggesting that the negative correlation between diatom growth rates and cell size, the extracellular conversion of HCO3– to CO2, and temperature do not change the unimodal relationship between the GRR and the cell size of diatoms.
Global Prediction
Our model sensitivity experiments reveal that the modeled optimal cell size enlarges with stronger seawater CO2 supplies associated with its higher concentration and permeability across the cell membrane, but diminishes with elevating cellular carbon demand determined by higher rates of cell growth potential (Figure 5). Among these factors, the magnitude of future CO2 increase and the maximal growth rate of diatoms can vary substantially in the global ocean. Particularly, as already discussed, our model does not represent the effects of other factors that can limit diatom growth. We then ran our model in the global ocean using the projected levels of these two variables in this century under the RCP8.5 scenario from an Earth system model (see section “Materials and Methods”), in which multiple limiting factors on diatom growth were simulated. The spatial variation in the modeled peak GRR was generally small in the global ocean, with the lowest value in the tropical Pacific upwelling zone (Figure 7A) associated with its smallest magnitude of CO2 increase (Figure 7C). The modeled optimal cell size, however, varied greatly from < 20 μm in tropical oceans to the highest modeled cell diameter (i.e., GRR increases monotonically with cell size) in the subpolar regions (Figure 7B). The modeled optimal cell size was systematically smaller than what was predicted in our theoretical model (Figures 2, 5B) because the CESM-simulated diatom growth rates incorporated other limiting factors and were mostly below 1.0/day (Figure 7D), much lower than those found in laboratories with ideal culturing conditions (Sarthou et al., 2005). The lowest optimal cell size was also in the tropical Pacific upwelling zone (Figure 7B), contributed synergistically by the high growth rates of diatoms and low magnitude of CO2 increase (Figures 7C,D).
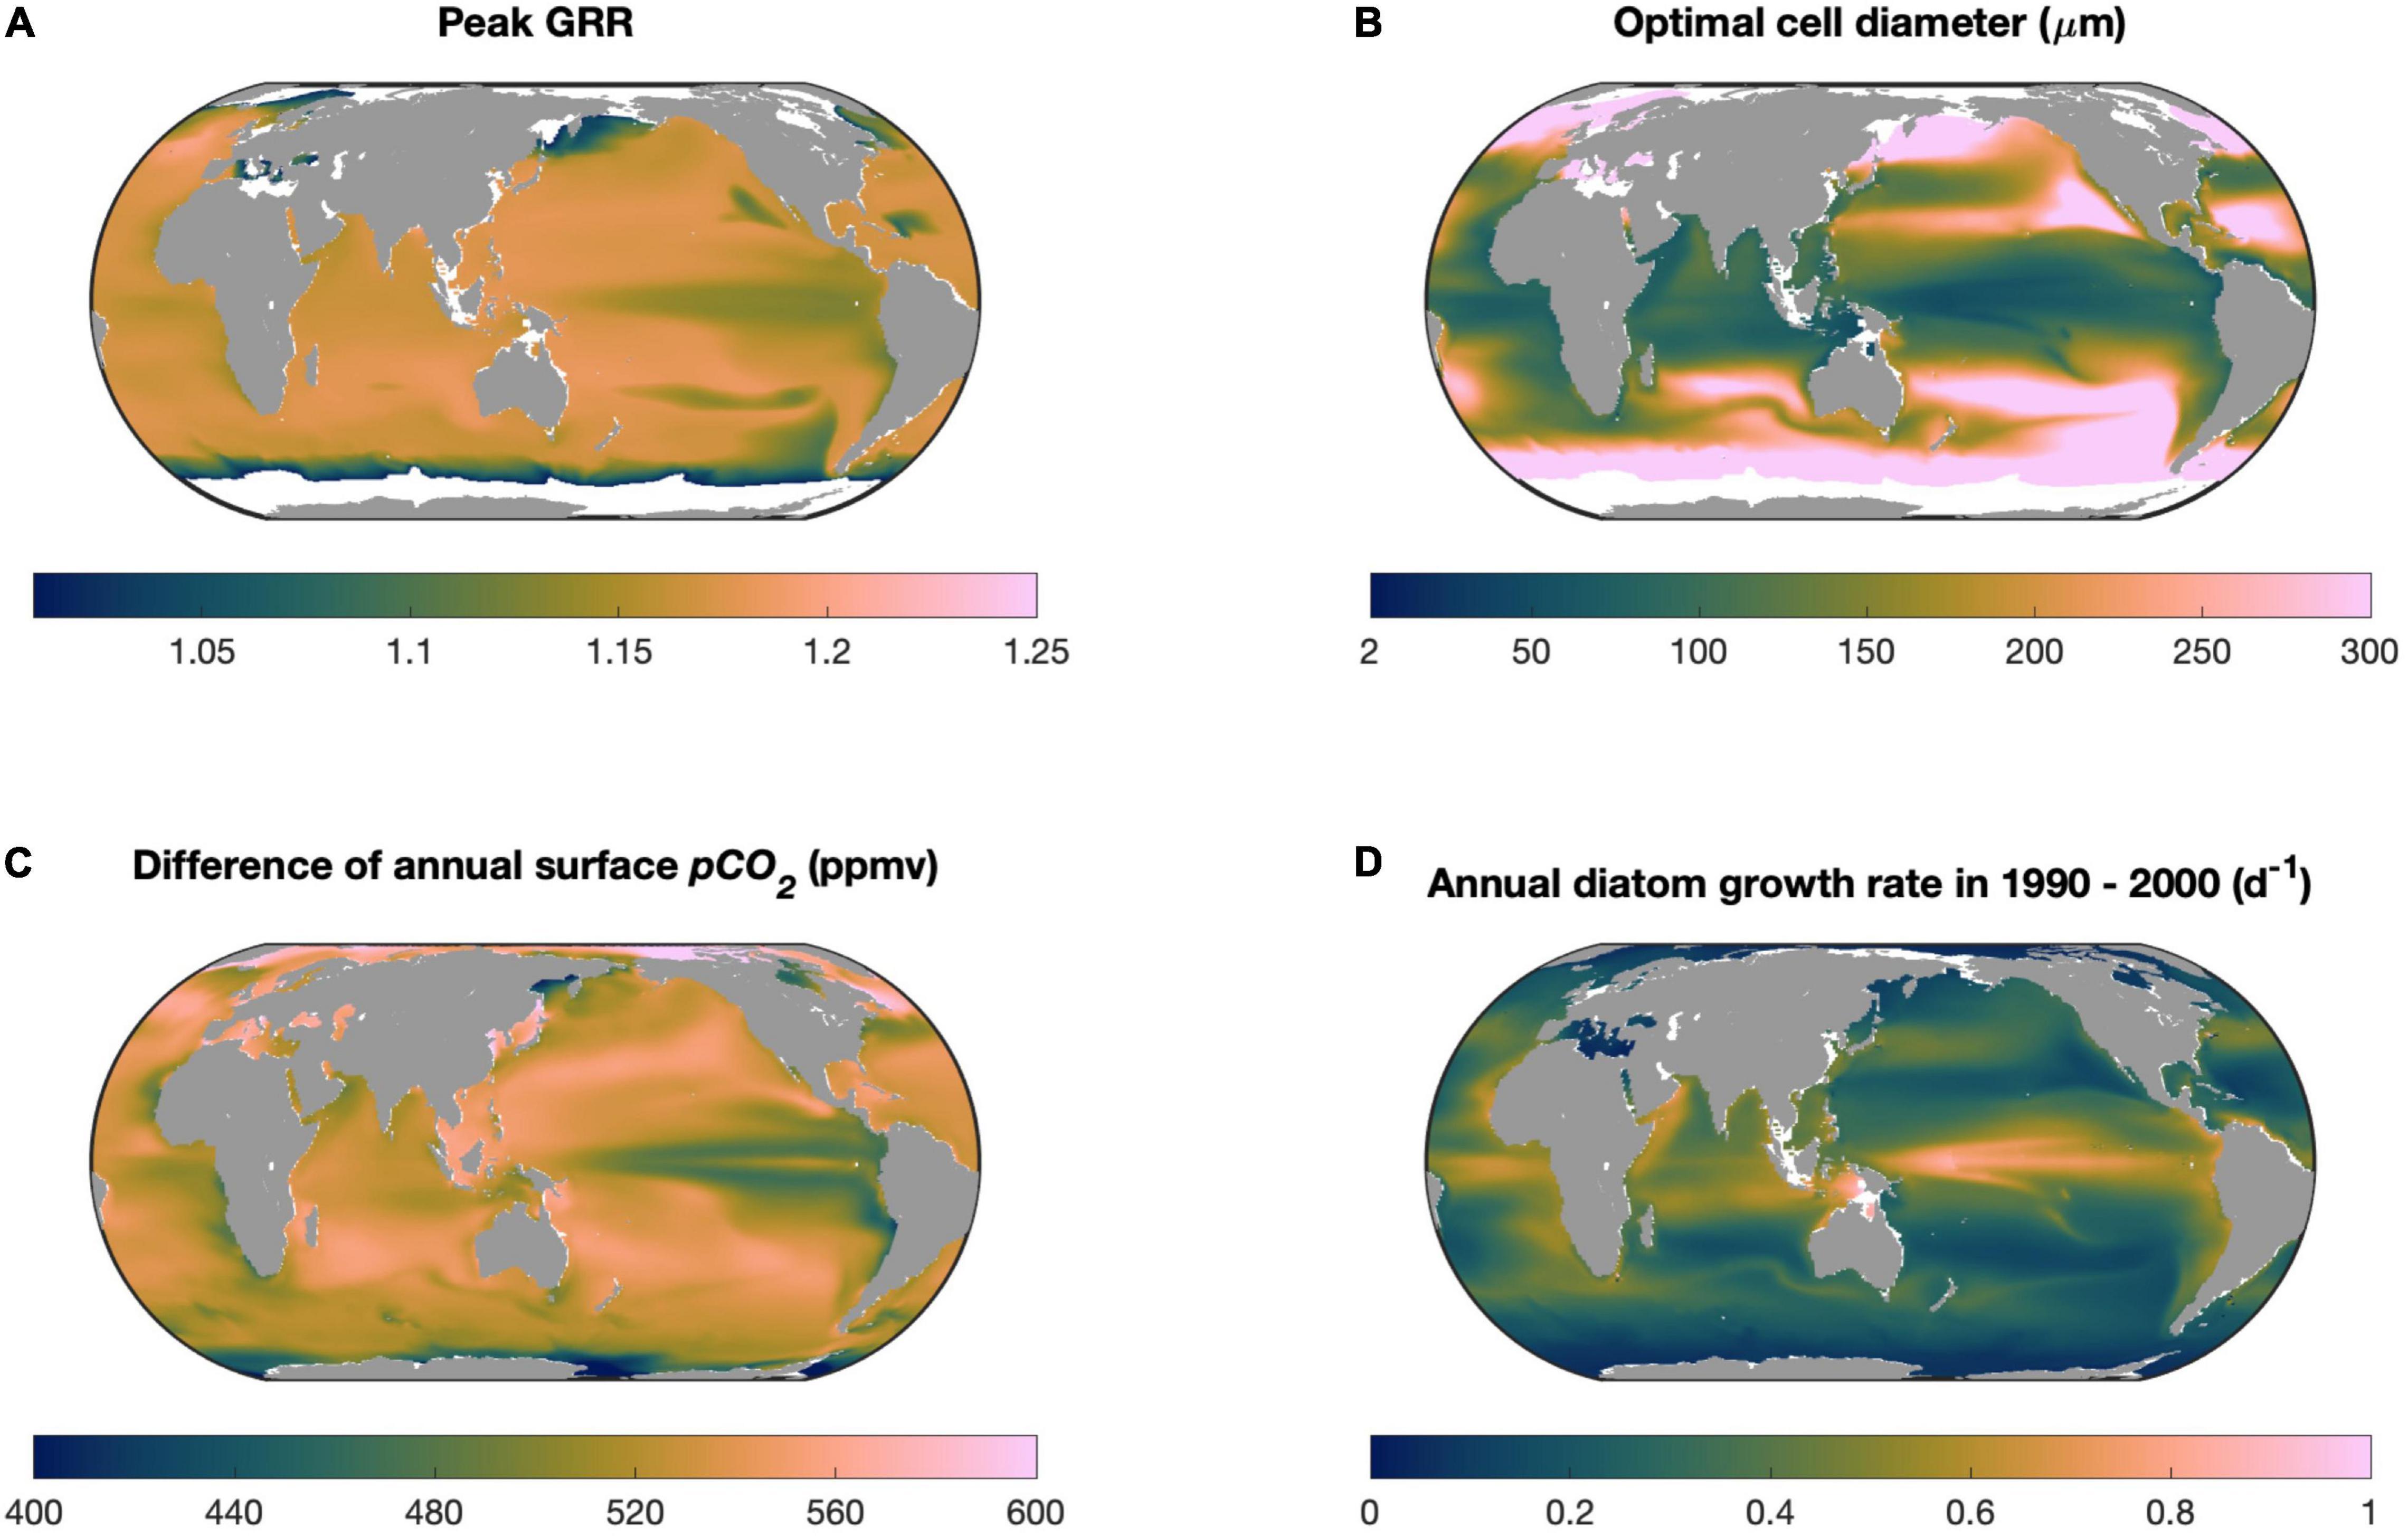
Figure 7. Model projections in the global ocean. (A) Modeled peak growth rate response (GRR) and (B) optimal cell size within this century under the CESM-predicted RCP8.5 scenario, including (C) the increase in partial pressure of CO2 and (D) annual average diatom growth rate. White areas in (A,B) represent the locations where the modeled GRR is very weak (<1.01).
Our projection for diatoms in the global ocean should be regarded at most as the first-order estimation. However, some interesting implications emerged from the projection. Diatoms are one of the important contributors to carbon export to the deep ocean (Falkowski et al., 2004), particularly in tropical oceans (Siegel et al., 2014, 2016). The relatively small optimal cell size projected in these regions (Figure 7B) implies that, without considering other effects, the size structure of the diatom community would not shift to larger species in the future high-CO2 ocean, which consequently would not lead to an increase in the sinking speed of organic particles and carbon export.
Model Limitations
Carbonic anhydrase in diatoms can convert CO2 to HCO3– in the cytoplasm and result in much-increased HCO3– transport further into chloroplasts, as found for diatom Phaeodactylum tricornutum (Hopkinson et al., 2011; Hopkinson, 2014). Additionally, a high leakage of CO2 from the chloroplast to the cytoplasm has been suggested (Hopkinson et al., 2011), although it is unclear how much of the leaked CO2 further leaks to the environment or is converted to HCO3– in the cytoplasm and transported back to the chloroplast. The CO2 leakage from the cell to the environment was already counted in the model. However, if there is substantial recycling of the leaked CO2 to HCO3– in the cytoplasm, the rate of HCO3– transfer across the chloroplast membrane can be further elevated. In other words, ebc can possibly be higher for at least some diatoms, leading to higher GRRs (Figure 5A) but small changes in the optimal cell size (Figure 5B).
There are some limitations in our model that can be investigated in future studies. First, our model does not include the negative effects of the lower pH concomitant with elevated CO2, which can be important to some species or functional groups of phytoplankton (e.g., Taylor et al., 2012; McMinn et al., 2014; Cyronak et al., 2016; Hong et al., 2017; Gafar et al., 2018; Luo et al., 2019; Shi et al., 2019). If there is no relationship between the negative effects of lower pH and diatom cell sizes, which, however, is unclear, our modeled pattern between GRR and diatom cell sizes can still hold.
Second, RuBisCO in different diatoms shows greater variation in the Michaelis constant for CO2 (23–68 μM) (Young et al., 2016), indicating diverse patterns of CCM, RuBisCO kinetics, and catalytic features in diatoms. Our model does not separate diatom species but focuses on the general response of diatoms of different sizes to seawater CO2 increases. Nevertheless, the variation of these factors can change model parameters of the cell membrane permeability to CO2 (P) and the energy cost rate in HCO3– uptake (ebc), among which a ± 50% change in the former can vary the optimal cell size in a range of 2–13 μm while that in the latter has no substantial effect (Figure 5C). That is, if the CO2 permeability is substantially lower than that used in our model, the GRR can be highest in the smallest diatoms and then decreases with increasing cell size.
Third, light appears to interact with elevated CO2 in determining the collective effect in cell size–dependent responses of diatoms, such as that we already discussed for the stronger response of larger diatoms to CO2 increase under very high light. Another study also proposed a light-based maximal benefit of CCM in middle-sized phytoplankton: The depletion of light near the center of large cells depresses photosynthesis and reduces the energy available for CCM, making CCM economically less efficient in large cells (Wirtz, 2011). This effect and our proposed mechanism, if valid, can synergistically intensify the competitive advantage of middle-sized diatoms under the CO2 increase.
Last, cultured diatoms also often respond differently to CO2 increases depending on the availability of nutrients such as nitrogen (Li et al., 2012), phosphorus (Sun et al., 2011), and silicon (Tatters et al., 2012), while these nutrients are not simulated in our model. Instead, our model experiments implicitly represent the limitation of these nutrients by applying a lower model parameter g0, showing that middle-sized diatoms are more likely to have better competition from the CO2 increase when these nutrients are not severely limiting (Figures 5, 7). Nevertheless, our model does not simulate the cell size–dependent limitation of nutrients on diatoms. In the future warmer and more stratified oceans, nutrients can become more limiting, and smaller diatoms may gain another competitive advantage because of their lower surface-to-volume ratios. Considering this effect, the increasing trend of GRR from small to middle-sized diatoms can be weakened or even reversed. However, the decreasing trend of GRR from middle-sized to large-sized diatoms may be even stronger.
Overall, despite the limitations of our model, the discussions above suggest that the GRR in the future high-CO2 ocean, in general, likely decreases from middle-sized to large-sized diatoms, except in the regions where the light is substantially high or nutrients are substantially limiting on diatoms. The GRR may also increase from small to middle-sized diatoms unless the cell membrane permeability to CO2 is low or nutrients become severely limiting, particularly on middle-sized diatoms.
In summary, this study constructed a theoretical model and revealed a competitive advantage of middle-sized diatoms of ∼7 μm over both small and large diatoms when seawater CO2 increases. Although the model is mostly based only on the basic principles of the carbonate equilibrium system and inorganic carbon diffusion with constraints on cellular energy allocations, it appears to be a robust pattern, although the exact cell size of which diatoms benefit most from the CO2 increase can change substantially. If the mechanism proposed in this study dominates, the diatom community in the future high-CO2 ocean may not shift toward larger cells, and carbon export by sinking diatoms may not be substantially stimulated, while we admit that other known and unknown factors can also influence the cell size–dependent responses of marine diatoms to the CO2 increase. Our simplified physiological model processes, or even more simply the size-dependent pattern revealed by our model, can be integrated into marine ecosystem models to improve the predictions of the size composition of diatoms, phytoplankton community structure, and productivity for future high-CO2 oceans.
Data Availability Statement
The original contributions presented in the study are included in the article/Supplementary Material, further inquiries can be directed to the corresponding author.
Author Contributions
Y-WL originated the concept for the study. Y-WL and QZ designed the numerical model, analyzed the results, and improved the numerical model. QZ coded the initial version of the model and performed numerical modeling. Both authors contributed to writing the manuscript.
Funding
This study was funded by the National Natural Science Foundation of China (41890802 and 42076153) and the National Key R&D Program of China (2016YFA0601404).
Conflict of Interest
The authors declare that the research was conducted in the absence of any commercial or financial relationships that could be construed as a potential conflict of interest.
Publisher’s Note
All claims expressed in this article are solely those of the authors and do not necessarily represent those of their affiliated organizations, or those of the publisher, the editors and the reviewers. Any product that may be evaluated in this article, or claim that may be made by its manufacturer, is not guaranteed or endorsed by the publisher.
Acknowledgments
We thank Ruiping Huang, Xin Lin, Chris Bowler, Richard Dorrell, and Xia Gao for very useful discussions.
Supplementary Material
The Supplementary Material for this article can be found online at: https://www.frontiersin.org/articles/10.3389/fmicb.2022.838629/full#supplementary-material
Footnotes
References
Badger, M. R., Andrews, T. J., Whitney, S. M., Ludwig, M., Yellowlees, D. C., Leggat, W., et al. (1998). The diversity and coevolution of Rubisco, plastids, pyrenoids, and chloroplast-based CO2-concentrating mechanisms in algae. Can. J. Bot. 76, 1052–1071. doi: 10.1139/b98-074
Behrenfeld, M. J., Halsey, K. H., and Milligan, A. J. (2008). Evolved physiological responses of phytoplankton to their integrated growth environment. Philos. Trans. R. Soc. B 363, 2687–2703. doi: 10.1098/rstb.2008.0019
Biswas, H., Shaik, A. U. R., Bandyopadhyay, D., and Chowdhury, N. (2017). CO2 induced growth response in a diatom dominated phytoplankton community from SW Bay of Bengal coastal water. Estuar. Coast. Shelf Sci. 198, 29–42. doi: 10.1016/j.ecss.2017.07.022
Blanco-Ameijeiras, S., Stoll, H. M., Zhang, H., and Hopkinson, B. M. (2020). Influence of temperature and CO2 on plasma-membrane permeability to CO2 and HCO3– in the marine haptophytes Emiliania huxleyi and Calcidiscus leptoporus (Prymnesiophyceae). J. Phycol. 56, 1283–1294. doi: 10.1111/jpy.13017
Buesseler, K. O. (1998). The decoupling of production and particulate export in the surface ocean. Glob. Biogeochem. Cycles 12, 297–310. doi: 10.1029/97GB03366
Burkhardt, S., Amoroso, G., Riebesell, U., and Sueltemeyer, D. (2001). CO2 and HCO3– uptake in marine diatoms acclimated to different CO2 concentrations. Limnol. Oceanogr. 46, 1378–1391. doi: 10.4319/lo.2001.46.6.1378
Cassar, N., Laws, E. A., Popp, B. N., and Bidigare, R. R. (2002). Sources of inorganic carbon for photosynthesis in a strain of Phaeodactylum tricornutum. Limnol. Oceanogr. 47, 1192–1197. doi: 10.4319/lo.2002.47.4.1192
Chrachri, A., Hopkinson, B. M., Flynn, K., Brownlee, C., and Wheeler, G. L. (2018). Dynamic changes in carbonate chemistry in the microenvironment around single marine phytoplankton cells. Nat. Commun. 9:74. doi: 10.1038/s41467-017-02426-y
Cosper, E. (1982). Influence of light intensity on diel variations in rates of growth, respiration and organic release of a marine diatom: comparison of diurnally constant and fluctuating light. J. Plankton. Res. 4, 705–724. doi: 10.1093/plankt/4.3.705
Crameri, F., Shephard, G. E., and Heron, P. J. (2020). The misuse of colour in science communication. Nat. Commun. 11:5444. doi: 10.1038/s41467-020-19160-7
Cyronak, T., Schulz, K. G., and Jokiel, P. L. (2016). The Omega myth: what really drives lower calcification rates in an acidifying ocean. ICES J. Mar. Sci. 73, 558–562. doi: 10.1093/icesjms/fsv075
Deppeler, S., Petrou, K., Schulz, K. G., Westwood, K., Pearce, I., McKinlay, J., et al. (2018). Ocean acidification of a coastal Antarctic marine microbial community reveals a critical threshold for CO2 tolerance in phytoplankton productivity. Biogeosciences 15, 209–231. doi: 10.5194/bg-15-209-2018
Doney, S. (2009). The consequences of human-driven ocean acidification for marine life. F1000 Biol. Rep. 1:36. doi: 10.3410/B1-36
Doney, S. C., Busch, D. S., Cooley, S. R., and Kroeker, K. J. (2020). The impacts of ocean acidification on marine ecosystems and reliant human communities. Annu. Rev. Environ. Resour. 45, 83–112. doi: 10.1146/annurev-environ-012320-083019
Dutkiewicz, S., Morris, J. J., Follows, M. J., Scott, J., Levitan, O., Dyhrman, S. T., et al. (2015). Impact of ocean acidification on the structure of future phytoplankton communities. Nat. Clim. Change 5, 1002–1006. doi: 10.1038/nclimate2722
Eggers, S. L., Lewandowska, A. M., Barcelos e Ramos, J., Blanco-Ameijeiras, S., Gallo, F., and Matthiessen, B. (2014). Community composition has greater impact on the functioning of marine phytoplankton communities than ocean acidification. Glob. Chang. Biol. 20, 713–723. doi: 10.1111/gcb.12421
Eichner, M., Kranz, S. A., and Rost, B. (2014). Combined effects of different CO2 levels and N sources on the diazotrophic cyanobacterium Trichodesmium. Physiol. Plant. 152, 316–330. doi: 10.1111/ppl.12172
Endo, H., Yoshimura, T., Kataoka, T., and Suzuki, K. (2013). Effects of CO2 and iron availability on phytoplankton and eubacterial community compositions in the northwest subarctic Pacific. J. Exp. Mar. Bio. Ecol. 439, 160–175. doi: 10.1016/j.jembe.2012.11.003
Falkowski, P. G., Koblfzek, M., Gorbunov, M., and Kolber, Z. (2004). “Development and application of variable chlorophyll fluorescence techniques in marine ecosystems,” in Chlorophyll a Fluorescence: A Signature of Photosynthesis, eds G. C. Papageorgiou and Govindjee (Dordrecht: Springer), 757–778. doi: 10.1007/978-1-4020-3218-9_30
Feng, Y., Hare, C. E., Leblanc, K., Rose, J. M., Zhang, Y., DiTullio, G. R., et al. (2009). Effects of increased pCO2 and temperature on the North Atlantic spring bloom. I. The phytoplankton community and biogeochemical response. Mar. Ecol. Prog. Ser. 388, 13–25. doi: 10.3354/meps08133
Finkel, Z. V., Beardall, J., Flynn, K. J., Quigg, A., Rees, T. A. V., and Raven, J. A. (2009). Phytoplankton in a changing world: cell size and elemental stoichiometry. J. Plankton Res. 32, 119–137. doi: 10.1093/plankt/fbp098
Flynn, K. J., Blackford, J. C., Baird, M. E., Raven, J. A., Clark, D. R., Beardall, J., et al. (2012). Changes in pH at the exterior surface of plankton with ocean acidification. Nat. Clim. Change 2, 510–513. doi: 10.1038/nclimate1489
Friedlingstein, P., Jones, M. W., O’Sullivan, M., Andrew, R. M., Hauck, J., Peters, G. P., et al. (2019). Global carbon budget 2019. Earth Syst. Sci. Data 11, 1783–1838. doi: 10.5194/essd-11-1783-2019
Gafar, N. A., Eyre, B. D., and Schulz, K. G. (2018). A conceptual model for projecting coccolithophorid growth, calcification and photosynthetic carbon fixation rates in response to global ocean change. Front. Mar. Sci. 4:433. doi: 10.3389/fmars.2017.00433
Gao, K., Xu, J., Gao, G., Li, Y., Hutchins, D. A., Huang, B., et al. (2012). Rising CO2 and increased light exposure synergistically reduce marine primary productivity. Nat. Clim. Change 2, 519–523. doi: 10.1038/nclimate1507
Gavis, J., and Ferguson, J. F. (1975). Kinetics of carbon dioxide uptake by phytoplankton at high pH. Limnol. Oceanogr. 20, 211–221. doi: 10.4319/lo.1975.20.2.0211
Giordano, M., Beardall, J., and Raven, J. A. (2005). CO2 concentrating mechanisms in algae: mechanisms, environmental modulation, and evolution. Annu. Rev. Plant Biol. 56, 99–131. doi: 10.1146/annurev.arplant.56.032604.144052
Hancock, A. M., Davidson, A. T., McKinlay, J., McMinn, A., Schulz, K. G., and van den Enden, R. L. (2018). Ocean acidification changes the structure of an Antarctic coastal protistan community. Biogeosciences 15, 2393–2410. doi: 10.5194/bg-15-2393-2018
Hong, H., Shen, R., Zhang, F., Wen, Z., Chang, S., Lin, W., et al. (2017). The complex effects of ocean acidification on the prominent N2-fixing cyanobacterium Trichodesmium. Science 356, 527–531. doi: 10.1126/science.aal2981
Hopkinson, B. M. (2014). A chloroplast pump model for the CO2 concentrating mechanism in the diatom Phaeodactylum tricornutum. Photosynth. Res. 121, 223–233. doi: 10.1007/s11120-013-9954-7
Hopkinson, B. M., Dupont, C. L., Allen, A. E., and Morel, F. M. M. (2011). Efficiency of the CO2-concentrating mechanism of diatoms. Proc. Natl. Acad. Sci. U. S. A. 108, 3830–3837. doi: 10.1073/pnas.1018062108
Hopkinson, B. M., Dupont, C. L., and Matsuda, Y. (2016). The physiology and genetics of CO2 concentrating mechanisms in model diatoms. Curr. Opin. Plant Biol. 31, 51–57. doi: 10.1016/j.pbi.2016.03.013
Hoppe, C. J. M., Hassler, C. S., Payne, C. D., Tortell, P. D., and Rost, B. (2013). Iron limitation modulates ocean acidification effects on Southern Ocean phytoplankton communities. PLoS One 8:e79890. doi: 10.1371/journal.pone.0079890
Jin, X., Gruber, N., Dunne, J. P., Sarmiento, J. L., and Armstrong, R. A. (2006). Diagnosing the contribution of phytoplankton functional groups to the production and export of particulate organic carbon, CaCO3, and opal from global nutrient and alkalinity distributions. Glob. Biogeochem. Cycles 20:GB2015. doi: 10.1029/2005GB002532
Key, T., McCarthy, A., Campbell, D. A., Six, C., Roy, S., and Finkel, Z. V. (2010). Cell size trade-offs govern light exploitation strategies in marine phytoplankton. Environ. Microbiol. 12, 95–104. doi: 10.1111/j.1462-2920.2009.02046.x
Kroeker, K. J., Kordas, R. L., Crim, R., Hendriks, I. E., Ramajo, L., Singh, G. S., et al. (2013). Impacts of ocean acidification on marine organisms: quantifying sensitivities and interaction with warming. Glob. Chang. Biol. 19, 1884–1896. doi: 10.1111/gcb.12179
Leblanc, K., Arístegui, J., Armand, L., Assmy, P., Beker, B., Bode, A., et al. (2012a). A global diatom database – abundance, biovolume and biomass in the world ocean. Earth Syst. Sci. Data 4, 149–165. doi: 10.5194/essd-4-149-2012
Leblanc, K., Arístegui Ruiz, J., Armand, L. K., Assmy, P., Beker, B., Bode, A., et al. (2012b). Global Distributions of Diatoms Abundance, Biovolume and Biomass -Gridded Data Product (NetCDF) - Contribution to the MAREDAT World Ocean Atlas of Plankton Functional Types. Pangaea. doi: 10.1594/PANGAEA.777384
Lerman, A., Guidry, M., Andersson, A. J., and Mackenzie, F. T. (2011). Coastal ocean last glacial maximum to 2100 CO2-carbonic acid-carbonate system: a modeling approach. Aquat. Geochem. 17, 749–773. doi: 10.1007/s10498-011-9146-z
Lewis, E., and Wallace, D. W. (1998). Program Developed for CO2 System Calculations. Oak Ridge, Ten: Oak Ridge National Laboratory.
Li, W., Gao, K., and Beardall, J. (2012). Interactive effects of ocean acidification and nitrogen-limitation on the diatom Phaeodactylum tricornutum. PLoS One 7:e51590. doi: 10.1371/journal.pone.0051590
Liu, N., Beardall, J., and Gao, K. (2017). Elevated CO2 and associated seawater chemistry do not benefit a model diatom grown with increased availability of light. Aquat. Microb. Ecol. 79, 137–147. doi: 10.3354/ame01820
Luo, Y.-W., Shi, D., Kranz, S. A., Hopkinson, B. M., Hong, H., Shen, R., et al. (2019). Reduced nitrogenase efficiency dominates response of the globally important nitrogen fixer Trichodesmium to ocean acidification. Nat. Commun. 10:1521. doi: 10.1038/s41467-019-09554-7
Marañón, E. (2015). Cell size as a key determinant of phytoplankton metabolism and community structure. Ann. Rev. Mar. Sci. 7, 241–264. doi: 10.1146/annurev-marine-010814-015955
Martin, C. L., and Tortell, P. D. (2008). Bicarbonate transport and extracellular carbonic anhydrase in marine diatoms. Physiol. Plant. 133, 106–116. doi: 10.1111/j.1399-3054.2008.01054.x
Matsui, H., Hopkinson, B. M., Nakajima, K., and Matsuda, Y. (2018). Plasma membrane-type aquaporins from marine diatoms function as CO2/NH3 channels and provide photoprotection. Plant Physiol. 178, 345–357. doi: 10.1104/pp.18.00453
McMinn, A., Muller, M. N., Martin, A., and Ryan, K. G. (2014). The response of Antarctic sea ice algae to changes in pH and CO2. PLoS One 9:e86984. doi: 10.1371/journal.pone.0086984
Menden-Deuer, S., and Lessard, E. J. (2000). Carbon to volume relationships for dinoflagellates, diatoms, and other protist plankton. Limnol. Oceanogr. 45, 569–579. doi: 10.4319/lo.2000.45.3.0569
Milligan, A. J., Mioni, C. E., and Morel, F. M. M. (2009). Response of cell surface pH to pCO2 and iron limitation in the marine diatom Thalassiosira weissflogii. Mar. Chem. 114, 31–36. doi: 10.1016/j.marchem.2009.03.003
Mizuno, M. (1991). Influence of cell-volume on the growth and size-reduction of marine and estuarine diatoms. J. Phycol. 27, 473–478. doi: 10.1111/j.0022-3646.1991.00473.x
Mouw, C. B., Barnett, A., McKinley, G. A., Gloege, L., and Pilcher, D. (2016). Phytoplankton size impact on export flux in the global ocean. Glob. Biogeochem. Cycles 30, 1542–1562. doi: 10.1002/2015gb005355
Nagata, T. (2000). “Production mechanisms of dissolved organic matter,” in Microbial Ecology of the Oceans, ed. D. L. Kirchman (New York: Wiley-Liss), 121–152.
Nelson, D. M., Treguer, P., Brzezinski, M. A., Leynaert, A., and Queguiner, B. (1995). Production and dissolution of biogenic silica in the ocean - revised global estimates, comparison with regional data and relationship to biogenic sedimentation. Glob. Biogeochem. Cycles 9, 359–372. doi: 10.1029/95gb01070
Orr, J. C., Fabry, V. J., Aumont, O., Bopp, L., Doney, S. C., Feely, R. A., et al. (2005). Anthropogenic ocean acidification over the twenty-first century and its impact on calcifying organisms. Nature 437, 681–686. doi: 10.1038/nature04095
Raven, J. A. (1991). Physiology of inorganic C acquisition and implications for resource use efficiency by marine phytoplankton: relation to increased CO2 and temperature. Plant Cell Environ. 14, 779–794. doi: 10.1111/j.1365-3040.1991.tb01442.x
Raven, J. A., Cockell, C. S., and De La Rocha, C. L. (2008). The evolution of inorganic carbon concentrating mechanisms in photosynthesis. Philos. Trans. R. Soc. B 363, 2641–2650. doi: 10.1098/rstb.2008.0020
Raven, J. A., Kübler, J. E., and Beardall, J. (2000). Put out the light, and then put out the light. J. Mar. Biol. Assoc. UK 80, 1–25. doi: 10.1017/S0025315499001526
Reinfelder, J. R. (2011). Carbon concentrating mechanisms in eukaryotic marine phytoplankton. Ann. Rev. Mar. Sci. 3, 291–315. doi: 10.1146/annurev-marine-120709-142720
Reiskind, J. B., Beer, S., and Bowes, G. (1989). Photosynthesis, photorespiration and ecophysiological interactions in marine macroalgae. Aquat. Bot. 34, 131–152. doi: 10.1016/0304-3770(89)90053-3
Sabine, C. L., Feely, R. A., Gruber, N., Key, R. M., Lee, K., Bullister, J. L., et al. (2004). The oceanic sink for anthropogenic CO2. Science 305, 367–371.
Sarthou, G., Timmermans, K. R., Blain, S., and Tréguer, P. (2005). Growth physiology and fate of diatoms in the ocean: a review. J. Sea Res. 53, 25–42. doi: 10.1016/j.seares.2004.01.007
Shi, D., Hong, H., Su, X., Liao, L., Chang, S., and Lin, W. (2019). The physiological response of marine diatoms to ocean acidification: differential roles of seawater pCO2 and pH. J. Phycol. 55, 521–533. doi: 10.1111/jpy.12855
Siegel, D. A., Buesseler, K. O., Behrenfeld, M. J., Benitez-Nelson, C. R., Boss, E., Brzezinski, M. A., et al. (2016). Prediction of the export and fate of global ocean net primary production: the EXPORTS science plan. Front. Mar. Sci. 3:22. doi: 10.3389/fmars.2016.00022
Siegel, D. A., Buesseler, K. O., Doney, S. C., Sailley, S. F., Behrenfeld, M. J., and Boyd, P. W. (2014). Global assessment of ocean carbon export by combining satellite observations and food-web models. Glob. Biogeochem. Cycles 28, 181–196. doi: 10.1002/2013gb004743
Snoeijs, P., Busse, S., and Potapova, M. (2002). The importance of diatom cell size in community analysis. J. Phycol. 38, 265–281. doi: 10.1046/j.1529-8817.2002.01105.x
Sultemeyer, D., and Rinast, K. A. (1996). The CO2 permeability of the plasma membrane of Chlamydomonas reinhardtii: mass-spectrometric 18O-exchange measurements from 13C18O2 in suspensions of carbonic anhydrase-loaded plasma-membrane vesicles. Planta 200, 358–368.
Sun, J., Hutchins, D. A., Feng, Y., Seubert, E. L., Caron, D. A., and Fu, F.-X. (2011). Effects of changing pCO2 and phosphate availability on domoic acid production and physiology of the marine harmful bloom diatom Pseudo-nitzschia multiseries. Limnol. Oceanogr. 56, 829–840. doi: 10.4319/lo.2011.56.3.0829
Tatters, A. O., Fu, F.-X., and Hutchins, D. A. (2012). High CO2 and silicate limitation synergistically increase the toxicity of Pseudo-nitzschia fraudulenta. PLoS One 7:e32116. doi: 10.1371/journal.pone.0032116
Taylor, A. R., Brownlee, C., and Wheeler, G. L. (2012). Proton channels in algae: reasons to be excited. Trends Plant Sci. 17, 675–684. doi: 10.1016/j.tplants.2012.06.009
Tortell, P. D., Payne, C., Gueguen, C., Strzepek, R. F., Boyd, P. W., and Rost, B. (2008). Inorganic carbon uptake by Southern Ocean phytoplankton. Limnol. Oceanogr. 53, 1266–1278. doi: 10.4319/lo.2008.53.4.1266
Tréguer, P. J., and De La Rocha, C. L. (2013). The world ocean silica cycle. Ann. Rev. Mar. Sci. 5, 477–501. doi: 10.1146/annurev-marine-121211-172346
Wirtz, K. W. (2011). Non-uniform scaling in phytoplankton growth rate due to intracellular light and CO2 decline. J. Plankton Res. 33, 1325–1341. doi: 10.1093/plankt/fbr021
Wolf-Gladrow, D., and Riebesell, U. (1997). Diffusion and reactions in the vicinity of plankton: a refined model for inorganic carbon transport. Mar. Chem. 59, 17–34. doi: 10.1016/S0304-4203(97)00069-8
Wu, Y., Campbell, D. A., Irwin, A. J., Suggett, D. J., and Finkel, Z. V. (2014). Ocean acidification enhances the growth rate of larger diatoms. Limnol. Oceanogr. 59, 1027–1034. doi: 10.4319/lo.2014.59.3.1027
Keywords: ocean acidification, diatom, CO2-concentrating mechanism, growth rate response, cell size, eco-physiological modeling
Citation: Zhang Q and Luo Y-W (2022) A Competitive Advantage of Middle-Sized Diatoms From Increasing Seawater CO2. Front. Microbiol. 13:838629. doi: 10.3389/fmicb.2022.838629
Received: 18 December 2021; Accepted: 12 April 2022;
Published: 18 May 2022.
Edited by:
Jun Sun, China University of Geosciences Wuhan, ChinaReviewed by:
Kam W. Tang, Swansea University, United KingdomJin Zhou, Tsinghua University, China
Alex J. Poulton, Heriot-Watt University, United Kingdom
Copyright © 2022 Zhang and Luo. This is an open-access article distributed under the terms of the Creative Commons Attribution License (CC BY). The use, distribution or reproduction in other forums is permitted, provided the original author(s) and the copyright owner(s) are credited and that the original publication in this journal is cited, in accordance with accepted academic practice. No use, distribution or reproduction is permitted which does not comply with these terms.
*Correspondence: Ya-Wei Luo, eXdsdW9AeG11LmVkdS5jbg==
†Present address: Qi Zhang Earth and Atmospheric Sciences, Georgia Institute of Technology, Atlanta, GA, USA