 Xingguo Han
 Karin Beck
 Helmut Bürgmann
 Beat Frey
 Beat Stierli
 Aline Frossard
- 1Forest Soils and Biogeochemistry, Swiss Federal Institute for Forest, Snow and Landscape Research (WSL), Birmensdorf, Switzerland
- 2Eawag, Swiss Federal Institute of Aquatic Science and Technology, Kastanienbaum, Switzerland
Real-time quantitative PCR (qPCR) has been widely used to quantify gene copy numbers in microbial ecology. Despite its simplicity and straightforwardness, establishing qPCR assays is often impeded by the tedious process of producing qPCR standards by cloning the target DNA into plasmids. Here, we designed double-stranded synthetic DNA fragments from consensus sequences as qPCR standards by aligning microbial gene sequences (10–20 sequences per gene). Efficiency of standards from synthetic DNA was compared with plasmid standards by qPCR assays for different phylogenetic marker and functional genes involved in carbon (C) and nitrogen (N) cycling, tested with DNA extracted from a broad range of soils. Results showed that qPCR standard curves using synthetic DNA performed equally well to those from plasmids for all the genes tested. Furthermore, gene copy numbers from DNA extracted from soils obtained by using synthetic standards or plasmid standards were comparable. Our approach therefore demonstrates that a synthetic DNA fragment as qPCR standard provides comparable sensitivity and reliability to a traditional plasmid standard, while being more time- and cost-efficient.
1. Introduction
Soil microorganisms are a critical component of the Earth system by contributing significantly to global elemental cycles through a complex network of biogeochemical reactions (Schimel and Schaeffer, 2012). In many ecosystems, microorganisms gain energy for growth and survival through degrading organic matter (OM) to carbon dioxide (CO2, under both aerobic and anaerobic conditions), methane (CH4, under anaerobic conditions), and nitrous oxide (N2O, under aerobic and low-oxygenic conditions), releasing these greenhouse gasses to the atmosphere (Canfield et al., 2005; Oertel et al., 2016; Hutchins and Capone, 2022). Therefore, quantifying microbial abundance (as a proxy for biomass) is crucial to assess the importance of the microorganisms and understand their role or functions in ecosystems.
Over the past few decades, numerous techniques have been employed to quantify the population size of specific microorganisms or groups of microorganisms in environmental samples or synthetic communities in microbial ecology. These include, but are not limited to, direct epifluorescence microscopy (EFM) (Caron, 1983; Kepner and Pratt, 1994), flow cytometry (FCM) (Frossard et al., 2012, 2016; Deng et al., 2019), fluorescence in situ hybridization (FISH) (Bouvier and del Giorgio, 2003), catalyzed reporter deposition-FISH [CARD-FISH, Schippers et al. (2005), Eickhorst and Tippkotter (2008)], phospholipid quantification (Phospholipid-derived fatty acids, PLFAs) (White et al., 1979; Frostegard et al., 1991), droplet digital polymerase chain reaction (ddPCR) (Kim et al., 2014), and real-time quantitative PCR (qPCR) (Smith and Osborn, 2009; Brankatschk et al., 2012; Hartmann et al., 2014; Han et al., 2016, 2020). Additionally, there are other techniques, e.g., quantitative reverse transcription PCR (qRT-PCR) (Freeman et al., 1999), quantitative stable isotope probing (qSIP) (Hungate et al., 2015), and quantitative bioorthogonal noncanonical amino acid tagging (QBONCAT) (Bagert et al., 2014), highly used for gene expression, taxon-specific population and protein detection, respectively.
Among these approaches, qPCR has been widely used in molecular biology, as this method has proved to be relatively cheap, straightforward, and efficient with a high sensitivity, covering a linear range over 7–8 orders of magnitude, and high throughput, although it has limitations by not targeting active community members (Fierer et al., 2005). qPCR relies on optical reporter systems, either using a double-stranded DNA-binding fluorescent dye such as SYBR® Green or DNA probes dual-labeled with reporter dyes and quenchers, such as TaqMan™ probes (Orlando et al., 1998; Arya et al., 2005; Van Guilder et al., 2008). Alongside measuring the abundance of the bacterial, archaeal and fungal communities (using general bacterial, archaeal or universal primers for the 16S rRNA gene (Takai and Horikoshi, 2000) or of the ITS region for fungi (Fierer et al., 2005), qPCR has been applied for detecting and quantifying copy numbers of microbial functional genes involved in C and N cycling. Among the functions frequently studied in diverse environments using qPCR are CH4 production (methyl coenzyme M reductase A: mcrA) and oxidation (particulate methane monooxygenase: pmoA), nitrogen fixation (nitrogenase: nifH), ammonia oxidation (archaeal and bacterial ammonia monooxygenase: amoA), nitrite reduction (nitrite reductase: nirS and nirK), nitrite oxidation (beta subunit of nitrite oxidoreductase: nxrB), N2O production (nitric oxide reductase: norB) and reduction (nitrous oxide reductase: nosZ), and organic phosphorus (P) hydrolysis (alkaline phosphatase D: phoD) (Church et al., 2005; Henry et al., 2006; Leininger et al., 2006; Steinberg and Regan, 2008; Han et al., 2016; Webster et al., 2016; Luo et al., 2017; Han et al., 2020; Perez-Mon et al., 2022).
In spite of the advantage of being a straightforward method not including too many steps, qPCR has a major drawback. To quantify a specific gene, qPCR assays require the corresponding standard for calibration under the Minimum Information for Publication of Quantitative Real-Time PCR Experiments (MIQE) guidelines (Bustin et al., 2009). Classically, standards have been produced by cloning a target sequence into a plasmid, amplifying genes via PCR, using genomic DNA directly, or acquiring commercially approved biological standards (Dhanasekaran et al., 2010; Goodwin et al., 2018). However, these approaches often incur significant costs, in terms of time and money, and potentially generate contaminations, particularly when preparing multiple plasmid standards targeting different microbial genes in parallel. For instance, both PCR amplicons and plasmids need to be purified before being used, procedure which is often causing contaminations (Cimino et al., 1991). Moreover, the quantification of plasmid copies per cell was shown to be unreliable (May et al., 2015; Conte et al., 2018). In recent years, there has been a growing interest to use artificially synthesized DNA and RNA sequences as qPCR standards. Synthesizing such sequences to produce standards is considerably faster, cleaner (low contamination risk) and also less expensive (following considerable reduction of the cost of custom DNA synthesis over the years, see Carlson, 2009) compared to traditional plasmid standards (Conte et al., 2018; Xu et al., 2019). The synthetic gene fragments can be purchased in a length of 125 to 3,000 base pair (bp) with known degenerate nucleotides of A, T, C, and G (May et al., 2015; Conte et al., 2018). Up to now, most of the artificially synthesized standards have been used for medical purpose, focusing on viral or infectious microorganisms (Tourinho et al., 2015; Fesolovich and Tobe, 2017; Lima et al., 2017; Magee et al., 2017; Bandeira et al., 2020; Bivins et al., 2021; Munoz-Calderon et al., 2021), very few in environmental samples. To the best of our knowledge, the few studies using synthesized gene fragments as qPCR standards in environmental microbiology studies assessed bacterial 16S rRNA and htrA genes in soils (Gunawardana et al., 2014; Sirois and Buckley, 2019), 16S rRNA genes and methanogenic mcrA in a biogas digester (May et al., 2015), antibiotic resistance genes in environmental water, soil and faeces samples (Xu et al., 2019), and 16S rRNA genes by adding synthetic DNA internal standard to fecal samples (Zemb et al., 2020). We propose that, given the advantages, synthetic qPCR standards can and should be widely adopted for qPCR analysis of functional genes in environmental microbiology and microbial ecology. However, this new methodological approach should be thoroughly evaluated and compared to previous practice before being adopted.
Here, we designed qPCR standards for a number of frequently studied functional genes of the C, N and P cycle, and the ITS region and the 16S rRNA gene by synthesizing double-stranded DNA fragments obtained by generation of consensus sequences from alignments of microbial gene sequences. To provide a thorough evaluation of the effectiveness and reliability of synthetic DNA fragments as qPCR standards, we compared these newly synthesized qPCR standards with standards produced via plasmids in different qPCR assays, targeting several different taxonomic, and functional genes of soil microorganisms.
2. Materials and methods
2.1. Production of qPCR standards
Synthetic standards were designed for qPCR assays targeting bacterial 16S rRNA genes, fungal ITS and a broad range of genes involved in C, N and P cycling, mcrA, pmoA, nifH, nosZ, amoA, nirS, nirK, nxrB, norB, and phoD genes (Table 1). Synthetic DNA fragments were designed by aligning between 10 and 20 gene sequences per targeted gene with the software Geneious (version 9.1.8). All gene sequences were downloaded from the National Center for Biotechnology Information (NCBI) gene database. For each targeted gene, a consensus sequence was obtained from at least 10 downloaded sequences by the “Multi Align” function in Geneious (Alignment type: Global alignment with free end gaps, Cost Matrix: 65% similarity, Gap open penalty: 12, Gap extension penalty: 3, Refinement iterations: 2). The consensus sequences were created with most frequent nucleotide for each base of the aligned sequences, containing only nucleotides of A, T, C, and G. Forward and reverse primer sequences of each targeted gene were then searched against the corresponding consensus sequence by the “Test with Saved Primers” function in Geneious (Maximum mismatches: 2), to ensure the match between primers and standard sequences of the gene of interest. For each synthetic fragment, 9 to 30 additional bases next to forward and reverse primers (flanking ends) were kept. The consensus sequences of the synthetic DNA fragments of each gene were searched and blasted against the NCBI database (Supplementary Table S1). Double-stranded synthetic DNA fragments (between 250 and 650 bp) were then ordered from gBlocks gene fragments (Integrated DNA Technologies: IDT, Inc.), with 500 ng dry DNA in a tube for each target. Upon reception, the DNA was resuspended in nuclease-free water (H2O) and stored at −20°C freezer for long-term use. The copy numbers of synthetic DNA per microliter were calculated using the formula according to Godornes et al., 2007:
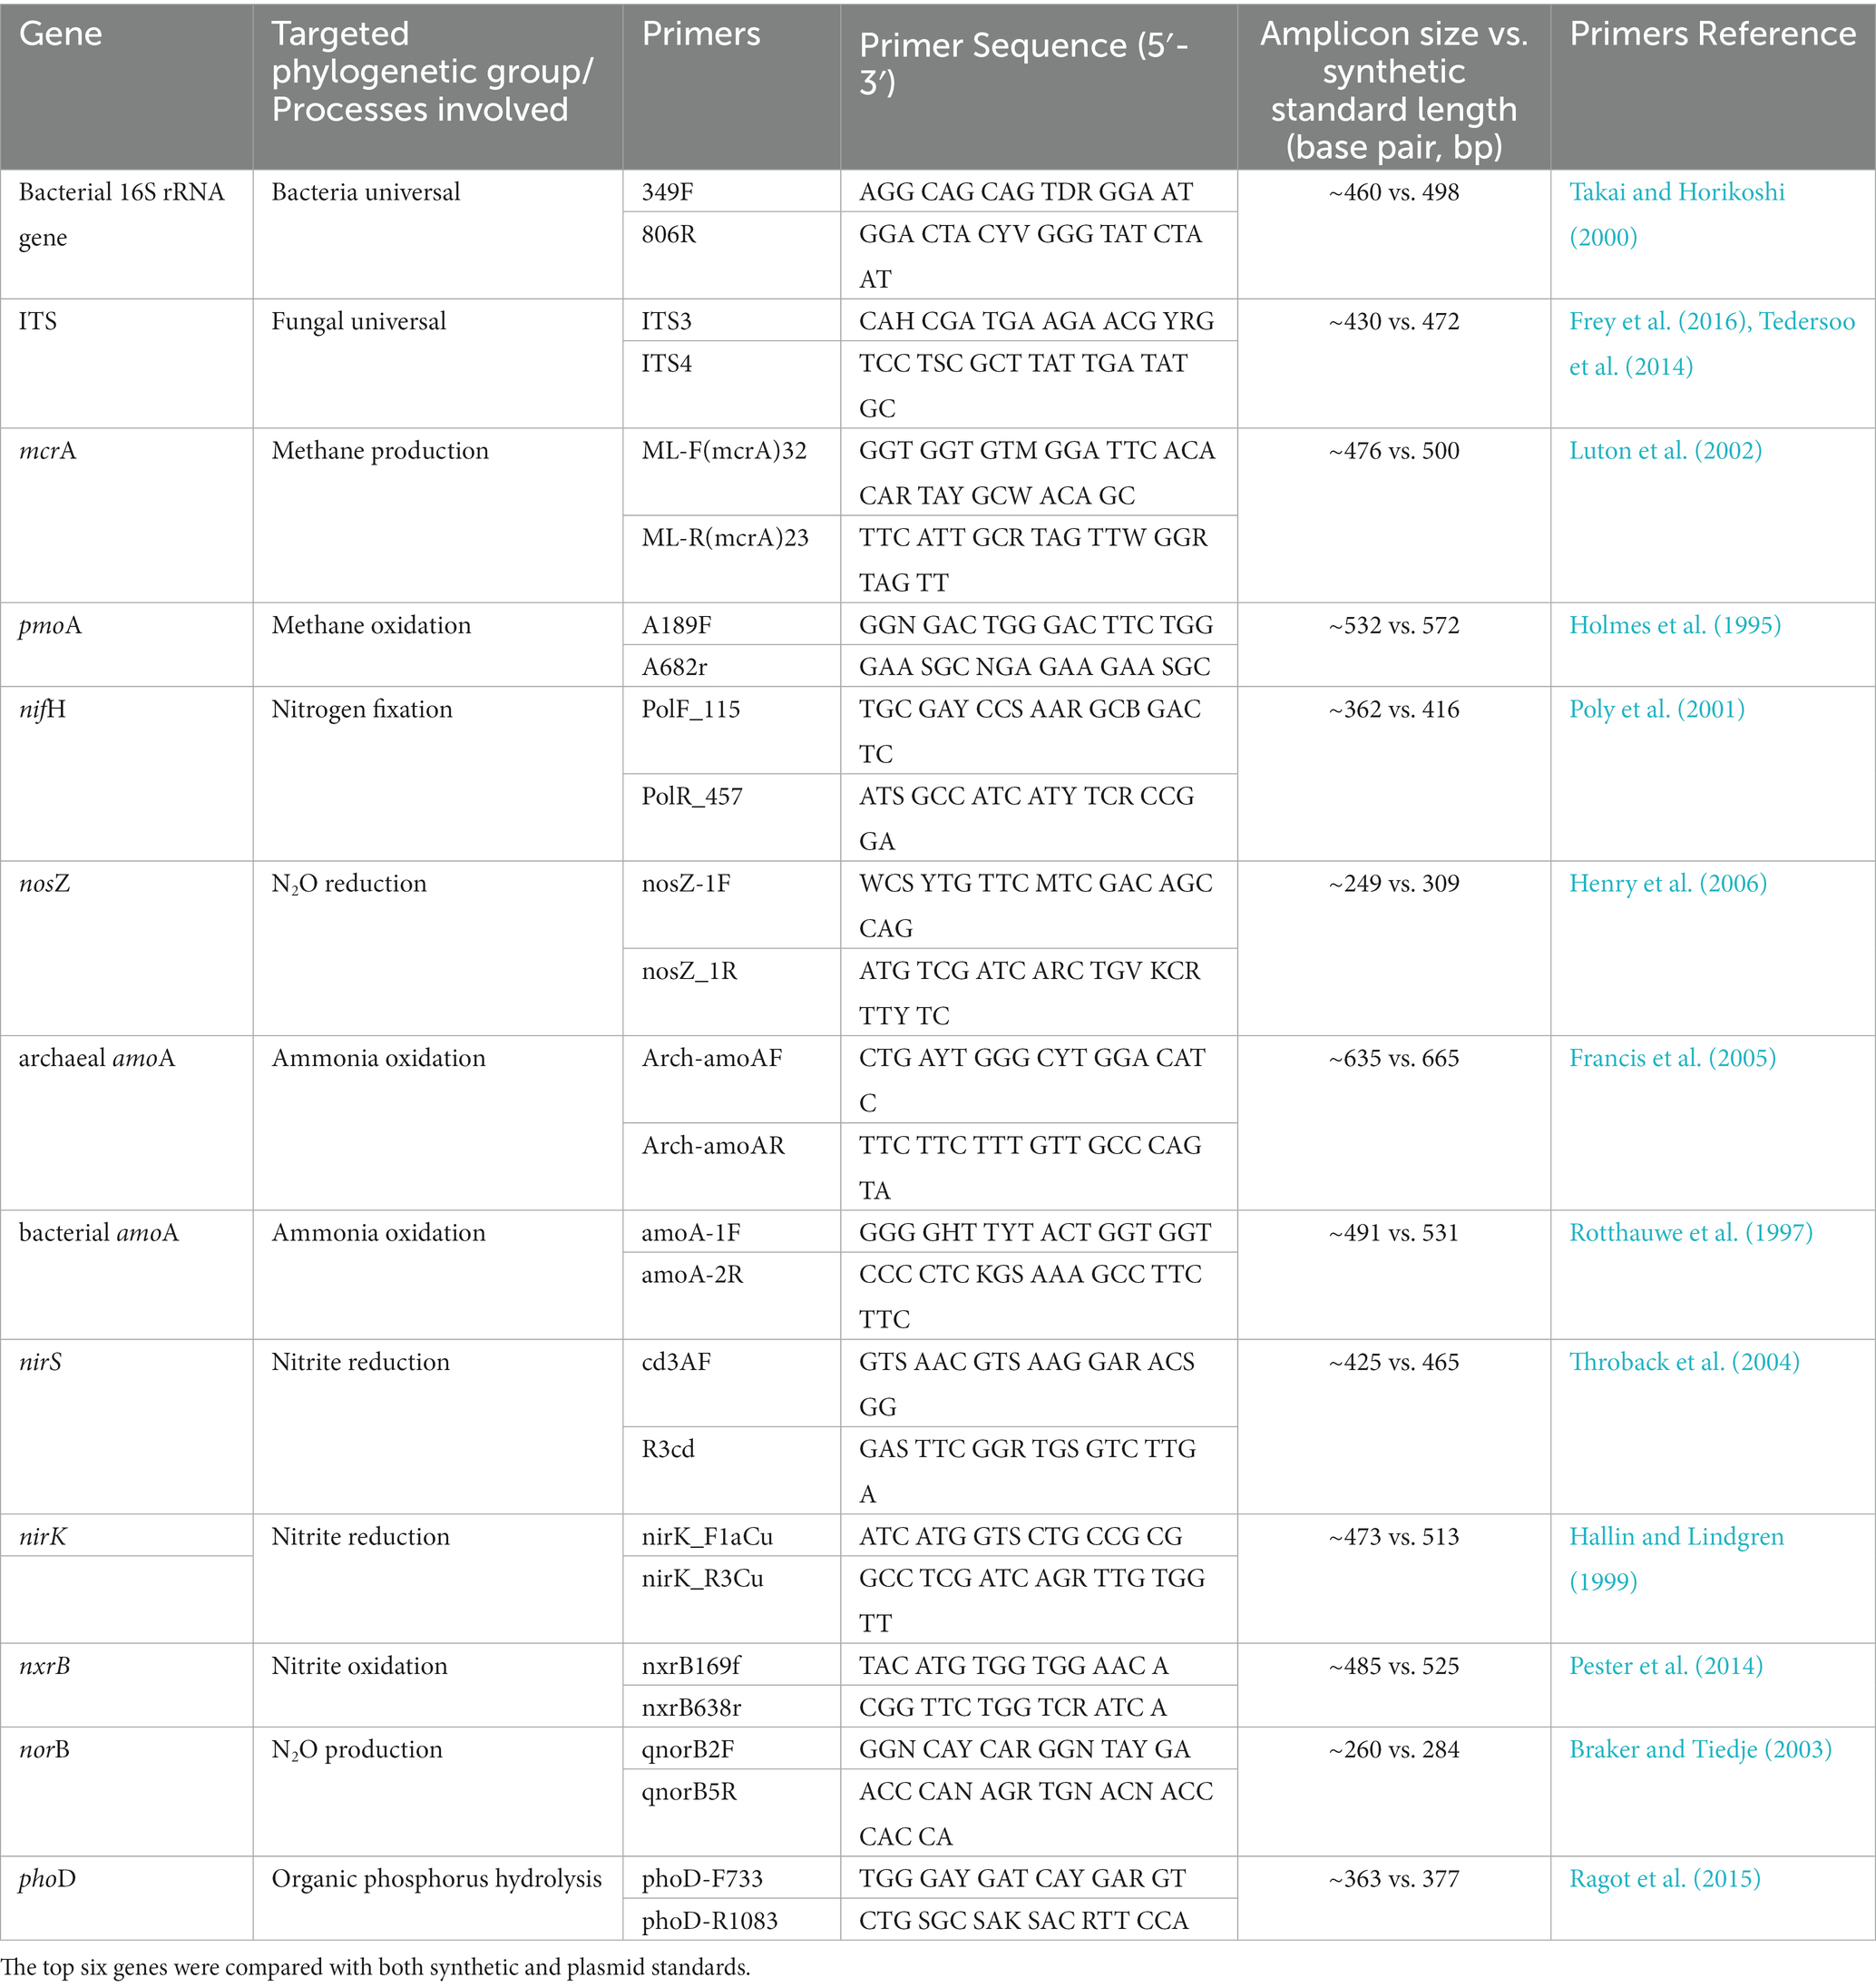
Table 1. Primers for the quantification of total abundance of bacterial 16S rRNA genes and fungal ITS2 region, mcrA (methyl coenzyme M reductase A: methanogenic Archaea), pmoA (particulate methane monooxygenase: methanotrophic Bacteria), nifH (nitrogenase: N fixers), nosZ (nitrous oxide reductase: N2O reducers), archaeal amoA and bacterial amoA (archaeal and bacterial ammonia monooxygenase: ammonia oxidizers), nirS and nirK (nitrite reductase: nitrite reducers), nxrB (beta subunit of nitrite oxidoreductase: nitrite oxidizers), norB (nitric oxide reductase: N2O producers) and phoD (alkaline phosphatase D: organic phosphorus hydrolyzers) by qPCR.
For several targeted genes, qPCR standards were also produced via plasmids. PCR products of the particular gene (bacterial 16S rRNA gene, fungal ITS region, mcrA, pmoA, nifH, and nosZ) were cloned into the vector and competent cells using the pGEM-T Easy Vector System II Systems Kit according to the manufacturer’s instructions (Promega, Madison, WI, United States) (Henry et al., 2006; Frey et al., 2011). Briefly, PCR reactions were conducted to amplify the targeted gene from DNA extracted from soils. PCR products were then inserted to the Vector (Ligation), which was added to the E. coli JM109 competent cells (Transformation). Transformed E. coli were then spread on Luria-Bertani (LB) agar plates with appropriate antibiotics. After 16–24 h of incubation at 37°C, colonies were observed on the plates, and only white colonies were picked up and incubated in liquid LB medium to grow with shaking over 24 h. The plasmids were extracted by Plasmid Miniprep Kit (Promega, Madison, WI, United States) according to the manufacturer’s instructions. The plasmids were further verified by Sanger sequencing: Colony PCR products of the selected marker genes were sequenced on both strands (up to 960 bp), according to Frey et al. (2008). Cycle sequencing was carried out using the Big Dye-Terminator Cycle Sequencing Kit, version 1.3 (PE Applied Biosystems, Foster City, CA) according to the manufacturer’s recommendations. The copy numbers of plasmid DNA per microliter were calculated using the following formula (Godornes et al. (2007):
Standards produced by synthetic DNA and plasmids were directly compared by qPCR (top six genes in Table 1). Synthetic DNA fragments for microbial functional genes amoA, nirS, nirK, nxrB, norB and phoD, were not compared with homologous standards produced via cloning, but were tested and verified by qPCR assays.
2.2. qPCR of standards and soil DNA
The effectiveness of the standard fragments produced via synthetic DNA and plasmids clones were tested and compared in qPCR assays for different genes with soil DNA on a QuantStudio5 Real-Time PCR System (Thermo Fisher Scientific, Waltham, MA, United States) by SYBR Green, which has been widely applied in soils and freshwater ecosystems (Stubner, 2002; Han et al., 2016, 2020). qPCR reactions (10 μL) were composed of 5 μL GoTaq® qPCR Master Mix (Promega, Madison, WI, United States), 0.1 μL 30 mg mL−1 bovine serum albumin (BSA), 0.5 μL 10 μM of each primer, 1.9 μL molecular-grade water and 2 μL DNA template. Soil DNA was diluted at a concentration of ~2 ng/μL to avoid potential PCR inhibition. The different primers used in the reactions are shown in Table 1 and details on qPCR thermocycling conditions are described in Table 2. Three standard dilution series per target gene (for both synthetic DNA and plasmid DNA standards) were obtained from 10-fold serial dilutions of standards with molecular-grade H2O. The standard series ranged ranging from 101 to 108 copies per μL.
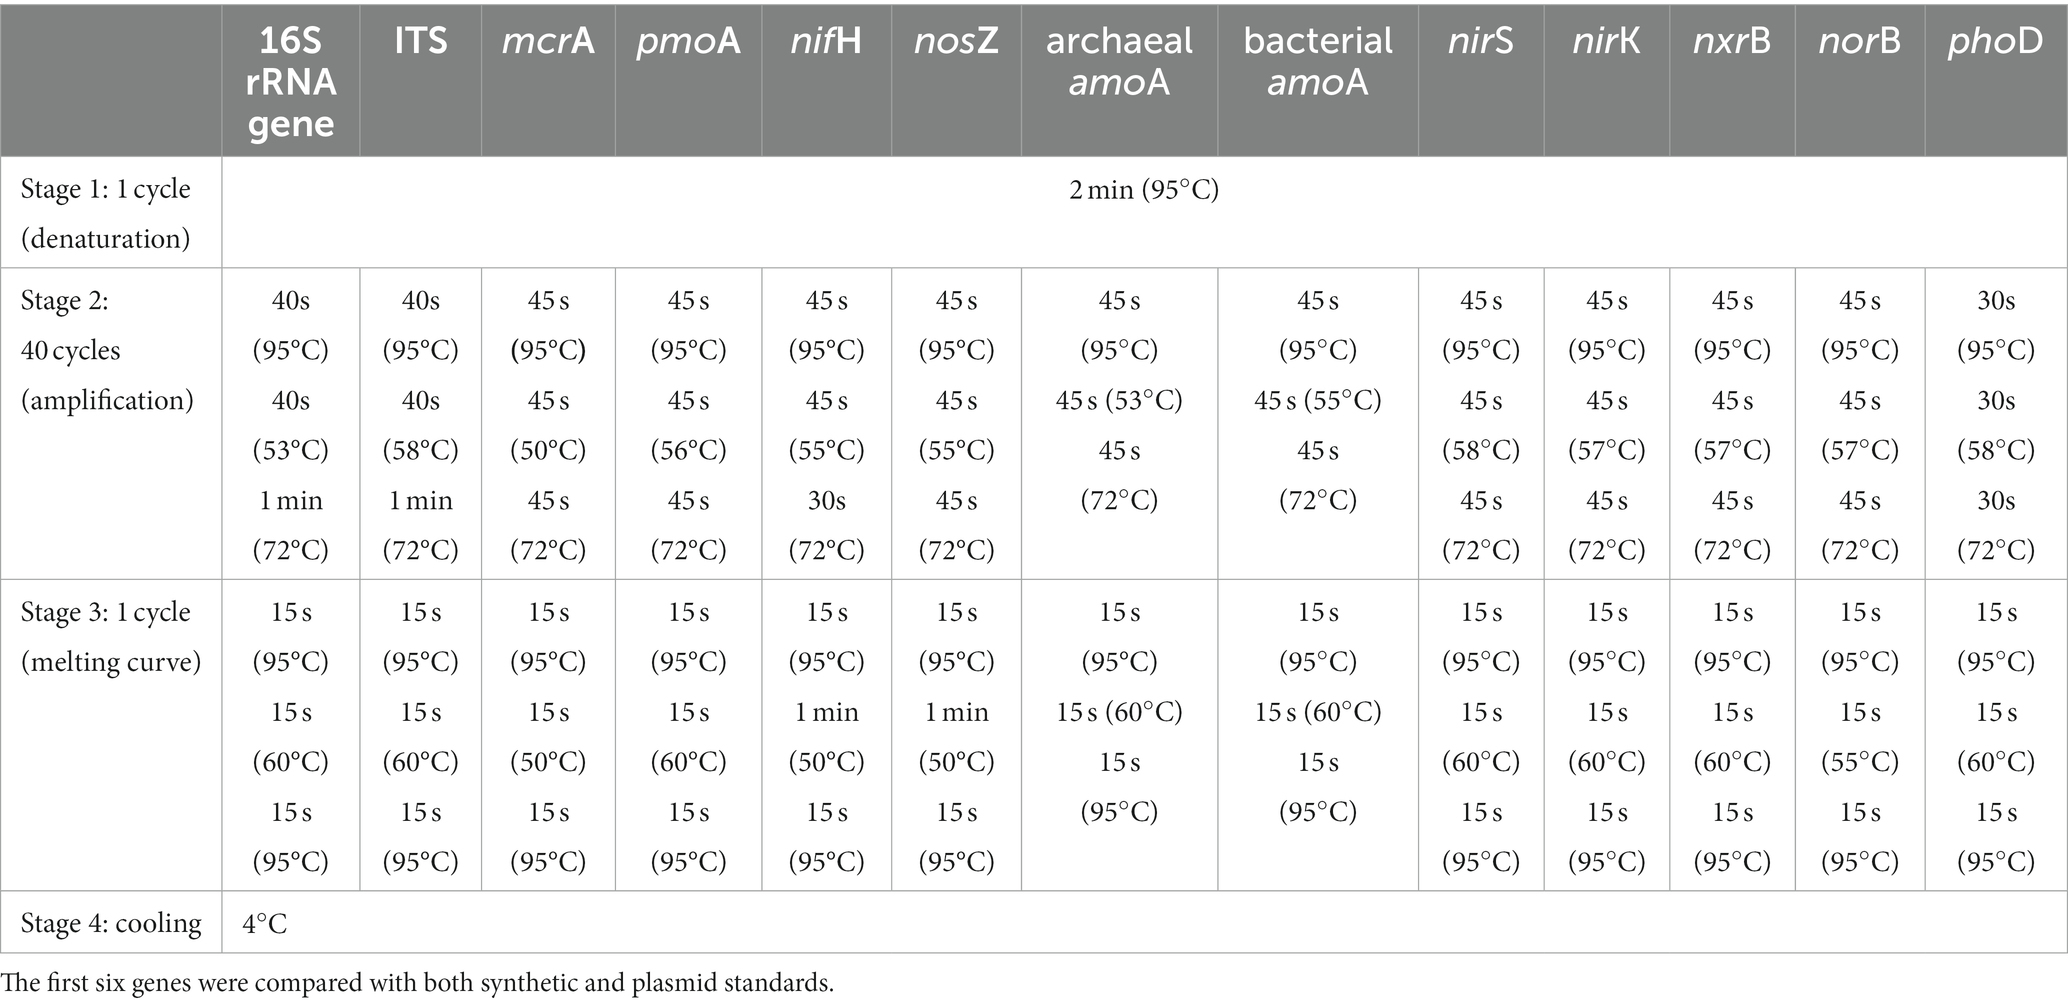
Table 2. qPCR thermocycling conditions for the quantification of each target gene.
The soils used in this study were collected in Switzerland in August 2021. The five soil samples were collected from the top 10 cm along an altitudinal gradient (Supplementary Table S2). The soils varied in DNA concentration, pH, total carbon (TC), organic C (TOC) and nitrogen (TN) content (Supplementary Table S2). Soil pH was measured in 0.01 M CaCl2 in soil-solution ratio of 1:2 (dry weight/volume) with a pH meter. TC and TN were measured on dried (60°C) and fine-grained soils by an elemental analyzer (NC-2500; CE Instruments, Wigan, United Kingdom). Soil TOC was quantified after HCl-fumigation using an elemental analyzer (Walthert et al., 2010). Total DNA was extracted from 0.25–0.30 g soil with the DNeasy Powersoil Pro Kit (Qiagen, Hilden, Germany) according to the manufacturer’s instructions. The DNA was quantified with PicoGreen (ThermoFisher Scientific, Cleveland, OH, United States), and subsequently diluted to 2.0 ng per μL by molecular-grade H2O and measured in triplicate.
A standard curve for each gene was generated by plotting cycle threshold (Ct) or quantification (Cq) of cycle values of each dilution step against the corresponding log10 transformed number of gene copies in the standard. The amplification efficiency (E) was estimated using the slope of the standard curve with the formula: E = (10−1/slope) − 1. The detection limit was 10 copies per μL according to the lowest concentration standard (101 copies per μL).
3. Results and discussion
3.1. Performance of synthetic and plasmid DNA standards
For the six targeted genes which were tested with synthetic DNA and plasmid DNA standards (Table 1), both standards for qPCR quantifications yielded significantly (p < 0.001) linear calibration curves featuring a coefficient value (R2) of >0.99 (Figure 1), together with similar high R2 derived from the genes tested with synthetic DNA standards (Supplementary Figure S1). The dilution series of both synthetic DNA and plasmid DNA standards exhibited smooth and exponential amplification curves (Figure 2). Coefficients of variation of Cq values among the replicates for the standards in the range from 101 to 108 copies per μL were between 0.03 and 4.15%, which indicated good repeatability and reproducibility. Additionally, the slopes of the synthetic standards were similar to those of the plasmid standards, with only minor differences (Figure 1). Altogether, provided compelling evidence that, similar to traditional plasmid standards, synthetic DNA standards of serial dilutions can be amplified effectively and produce high-quality and consistent standard curves. Comparable standard curves between synthetic DNA standards and traditional standards (PCR amplicons and plasmids of cloning) have been reported in previous studies targeting human mitochondrial gene (Conte et al., 2018), antibiotic resistance genes (ermB for macrolides) from water, soil and faeces (Xu et al., 2019), human T-cell leukemia virus type 1 (HTLV-1) (Bandeira et al., 2020) and Hepatitis B virus (HBV) (Portilho et al., 2018). Yet, to the best of our knowledge, this is the first study to use synthetically designed and produced DNA fragments as qPCR standards targeting a wide range of genes involved in C and N cycling employed in microbial ecology.
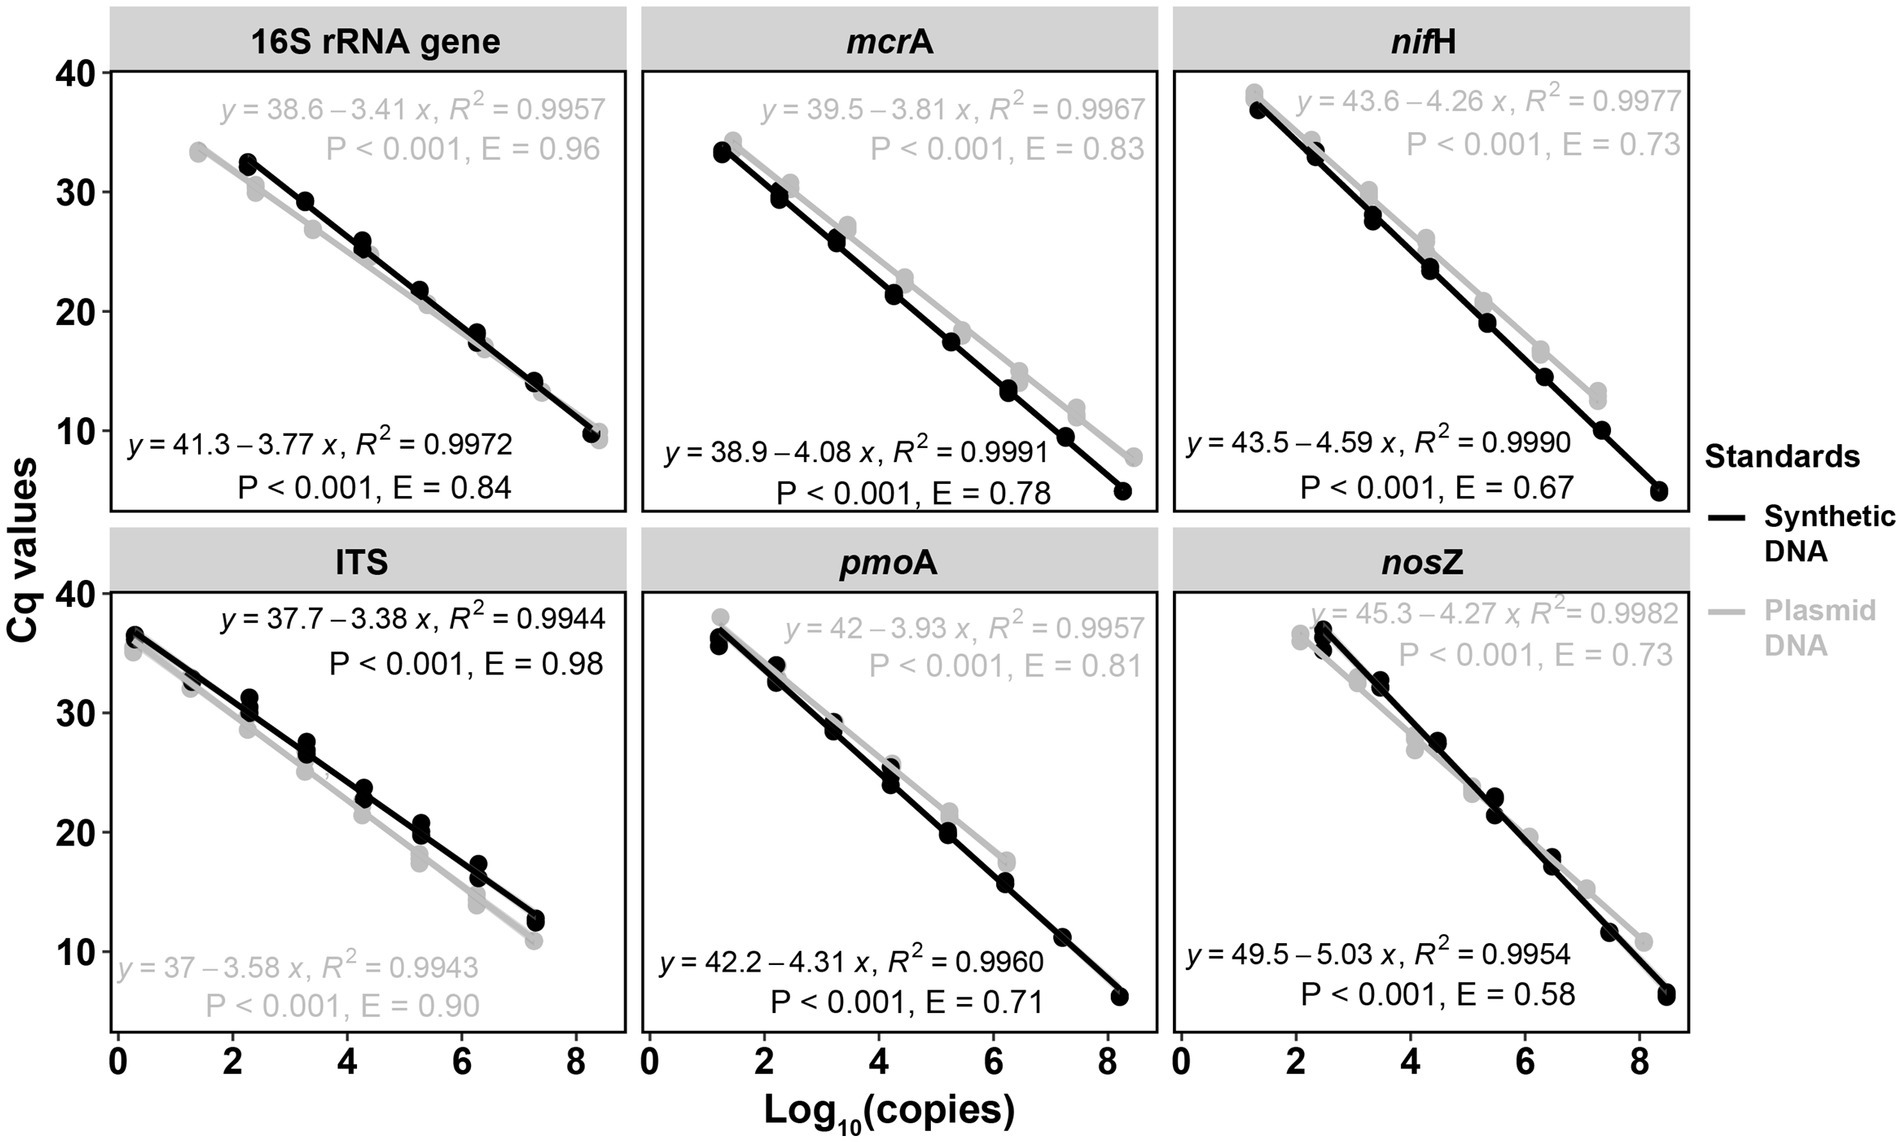
Figure 1. Comparisons of qPCR standard curves between synthetic DNA and plasmid DNA standards. Standards were diluted by 10 times for each step from 108 to 101 copies per μL. R2 is the coefficient of determination. p < 0.001 indicates the significance of the linear regression. Gene copy numbers (copies per dry gram soil) were log10-transformed. E = (10–1/slope) – 1.
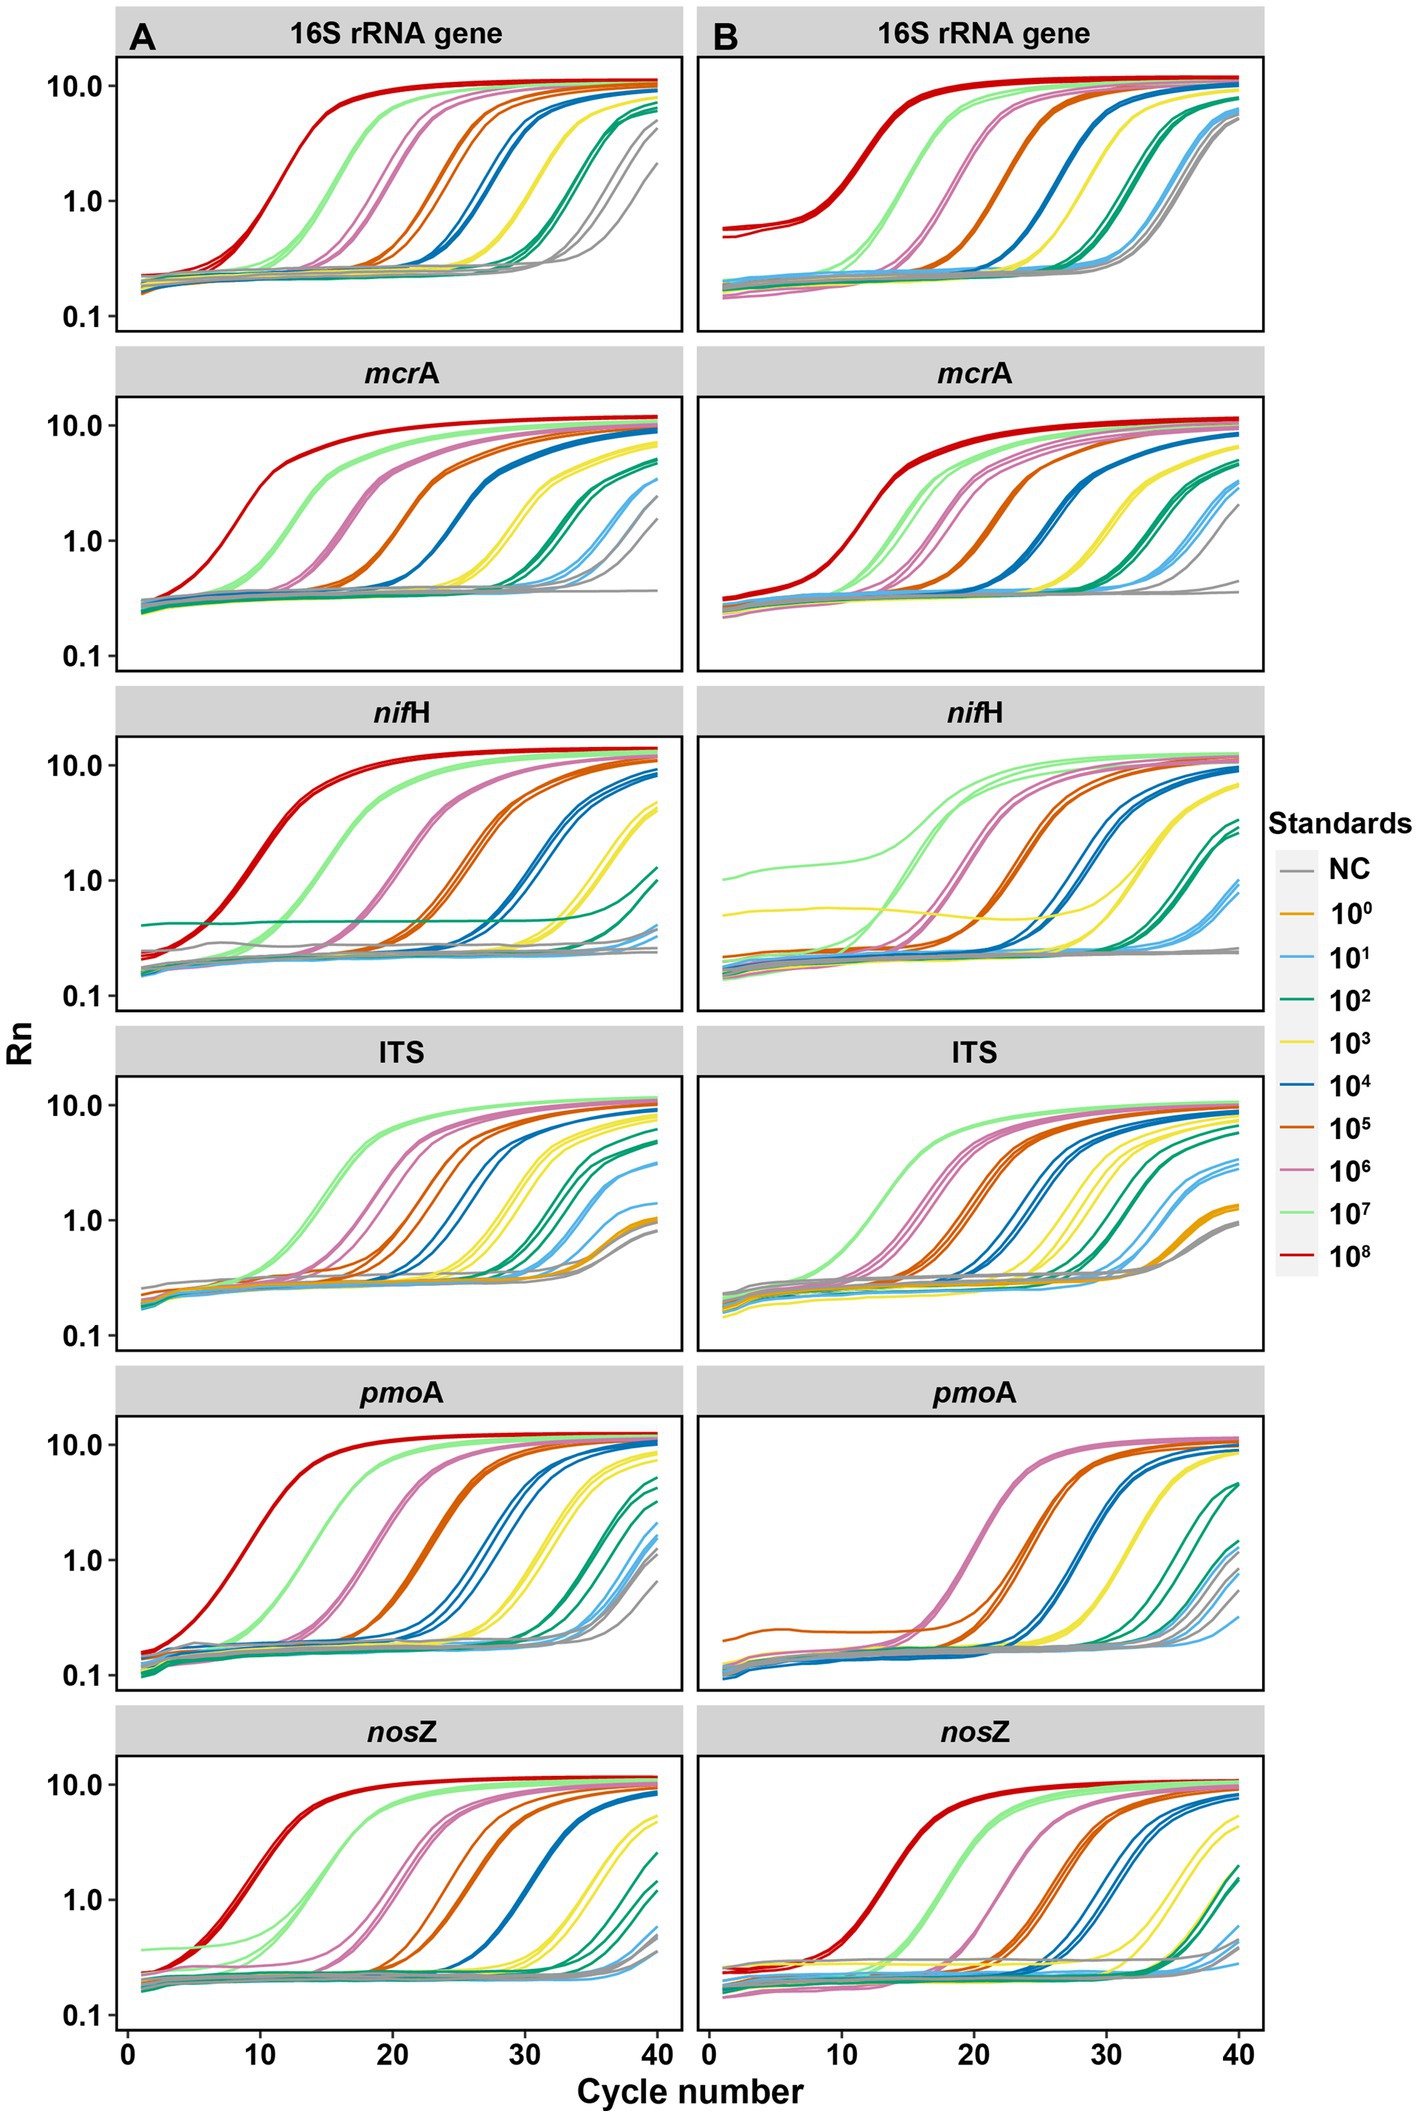
Figure 2. Amplification curves of each target gene by serial dilutions between synthetic DNA [column (A)] and plasmid DNA [column (B)] standards. Each qPCR reaction (10 μL total) contained 2 μL of DNA template (standard). Standards were diluted by 10 times for each step from 108 to 101 copies per μL. NC: negative control. Rn is the fluorescence of the reporter dye divided by the fluorescence of a passive reference dye; i.e., Rn is the reporter signal normalized to the fluorescence signal of Applied Biosystems™ ROX™ Dye.
Standard curves from both synthetic and plasmid standards showed high and similar amplification efficiency (E) values, confirming the reliability of synthetic gene fragments as qPCR standards (Figures 1, 2). PCR efficiency of the standard curves for 16S rRNA gene reached 0.84 for synthetic DNA and 0.96 for plasmid standards. It attained 0.98 and 0.90 for fungal ITS region for the synthetic and plasmid standard, respectively. Efficiency values of the remaining four genes tested (mcrA, pmoA, nifH, and nosZ), were all lower than 0.90, irrespective of plasmid or synthetic standards (Figure 1). Ideally, an efficiency value over 0.90 is considered a well amplified standard and a qualified standard curve (Svec et al., 2015). However, due to the potential PCR self-inhibition, caused by reagent limitation, accumulation of pyrophosphate molecules, self-annealing of accumulating products, polymerase and protein inhibition, or primer specificity and contamination, E values can be as low as 0.70 (Luby et al., 2016; Xu et al., 2019). The slightly lower E value for synthetic 16S rRNA gene standard during PCR might be caused by a small peak (PCR byproduct) right before the main PCR product peak of 16S rRNA gene, especially the least diluted ones, implied by the melting curves (Supplementary Figure S2A), which caused the differences in the standard curves from synthetic and plasmid standards. Lower E values of the genes mcrA, pmoA, nifH and nosZ from both synthetic and plasmid standards were likely also related to PCR inhibitions, in particular to the least diluted standards. Usually, 3.3 (a slope of – 3.3) cycles apart of the 10-fold dilutions were considered as an indicator of 100% PCR efficiency (Svec et al., 2015). However, much higher Cq value differences between the dilution series were found for these four genes from both standards (Figure 1), indicating an inhibition effect. Additionally, different instruments and volume for standard dilution also can affect PCR efficiency. A larger pipeted volume (for example 10 μl) transfered across dilutions could increase the efficiency of the qPCR (Svec et al., 2015), however only 2 μl was used in this study.
In spite of the similarity of qPCR standard curves between synthetic and plasmid standards, there were slight differences in the slopes and E values of standard curves between these two standards (Figure 1). For mcrA, pmoA, nifH, and nosZ, standard curves from synthetic standards were always steeper (higher absolute slopes) than those from plasmid standards, with Cq values of the least diluted standards from synthetic standards lower than those of the least diluted plasmid standards, even when the copy numbers of the least diluted standards from synthetic standards were lower than those from plasmid standards for mcrA and pmoA (Supplementary Table S3). This indicated an inhibition of the least diluted plasmid standards, which took more cycles (higher Cq values) to get fully amplified. For ITS region, standard curve from plasmid standard was slightly steeper than that from synthetic standard, which also indicated an effect of inhibition. In addition to PCR self-inhibition, there might be also a conformation effect of non-linear plasmid standards, which could overestimate qPCR results. Large quantification bias by plasmid DNA conformation was found with significant differences between circular and linear plasmid standards (Lin et al. (2011). Moreover, measuring the abundance of microalgal proliferating cell nuclear gene (pcna) by qPCR, Hou et al. (2010) found a high overestimation of pcna gene copies when using circular plasmid standard in comparison to a linear one. However, similar gene estimates were observed from circular and linear plasmid standards for quantifying prokaryotic 16S rRNA gene by qPCR assays (Oldham and Duncan, 2012). Therefore, the slight differences between synthetic and plasmid standards curves in this study might be partially caused by standard DNA conformation.
3.2. Microbial gene abundances in soils based on synthetic and plasmid DNA standards
In order to validate the reliability of our synthetic DNA standards, the abundances of the tested genes were quantified in DNA extracts from soils by qPCR assays and the gene copy abundance calculated using standards from synthetic and plasmid DNA (Figure 3). Little amplification was observed in negative control (NC) reactions. The amplification in the no template controls is likely an unintended byproduct driven by the overly manipulative chemistry being exerted during 40 cycles (McCall et al., 2014), probably also due to contamination of reaction preparation (preparation of replicates, dilutions, pipetting, etc.) (Svec et al., 2015). Overall, gene copies calculated with either standard curves (i.e., from synthetic or plasmid DNA) were not significantly different for all the genes studied across all soil samples except for few assays (6 of 30 samples across 6 tested genes, marked with asterisks in Figure 4). These significant differences reflect the described differences of the standards curves thus that gene copy numbers calculated from synthetic standards were on average lower than those from plasmid standards (difference of 5.1 ± 4.4% for mcrA, 15.4 ± 1.2% for pmoA, 23.8 ± 4.1% for nifH, and 6.9 ± 6.2% for nosZ) or higher for 16S rRNA gene (17.7 ± 3.2%) and ITS region (41.6 ± 16.4% higher). Gene copies varying within one log (10 times) were widely reported for qPCR quantifications of viruses with synthetic and plasmid standards, and such results have been considered good agreement of the two methods (Tourinho et al., 2015; Lima et al., 2017; Portilho et al., 2018; Bandeira et al., 2020).
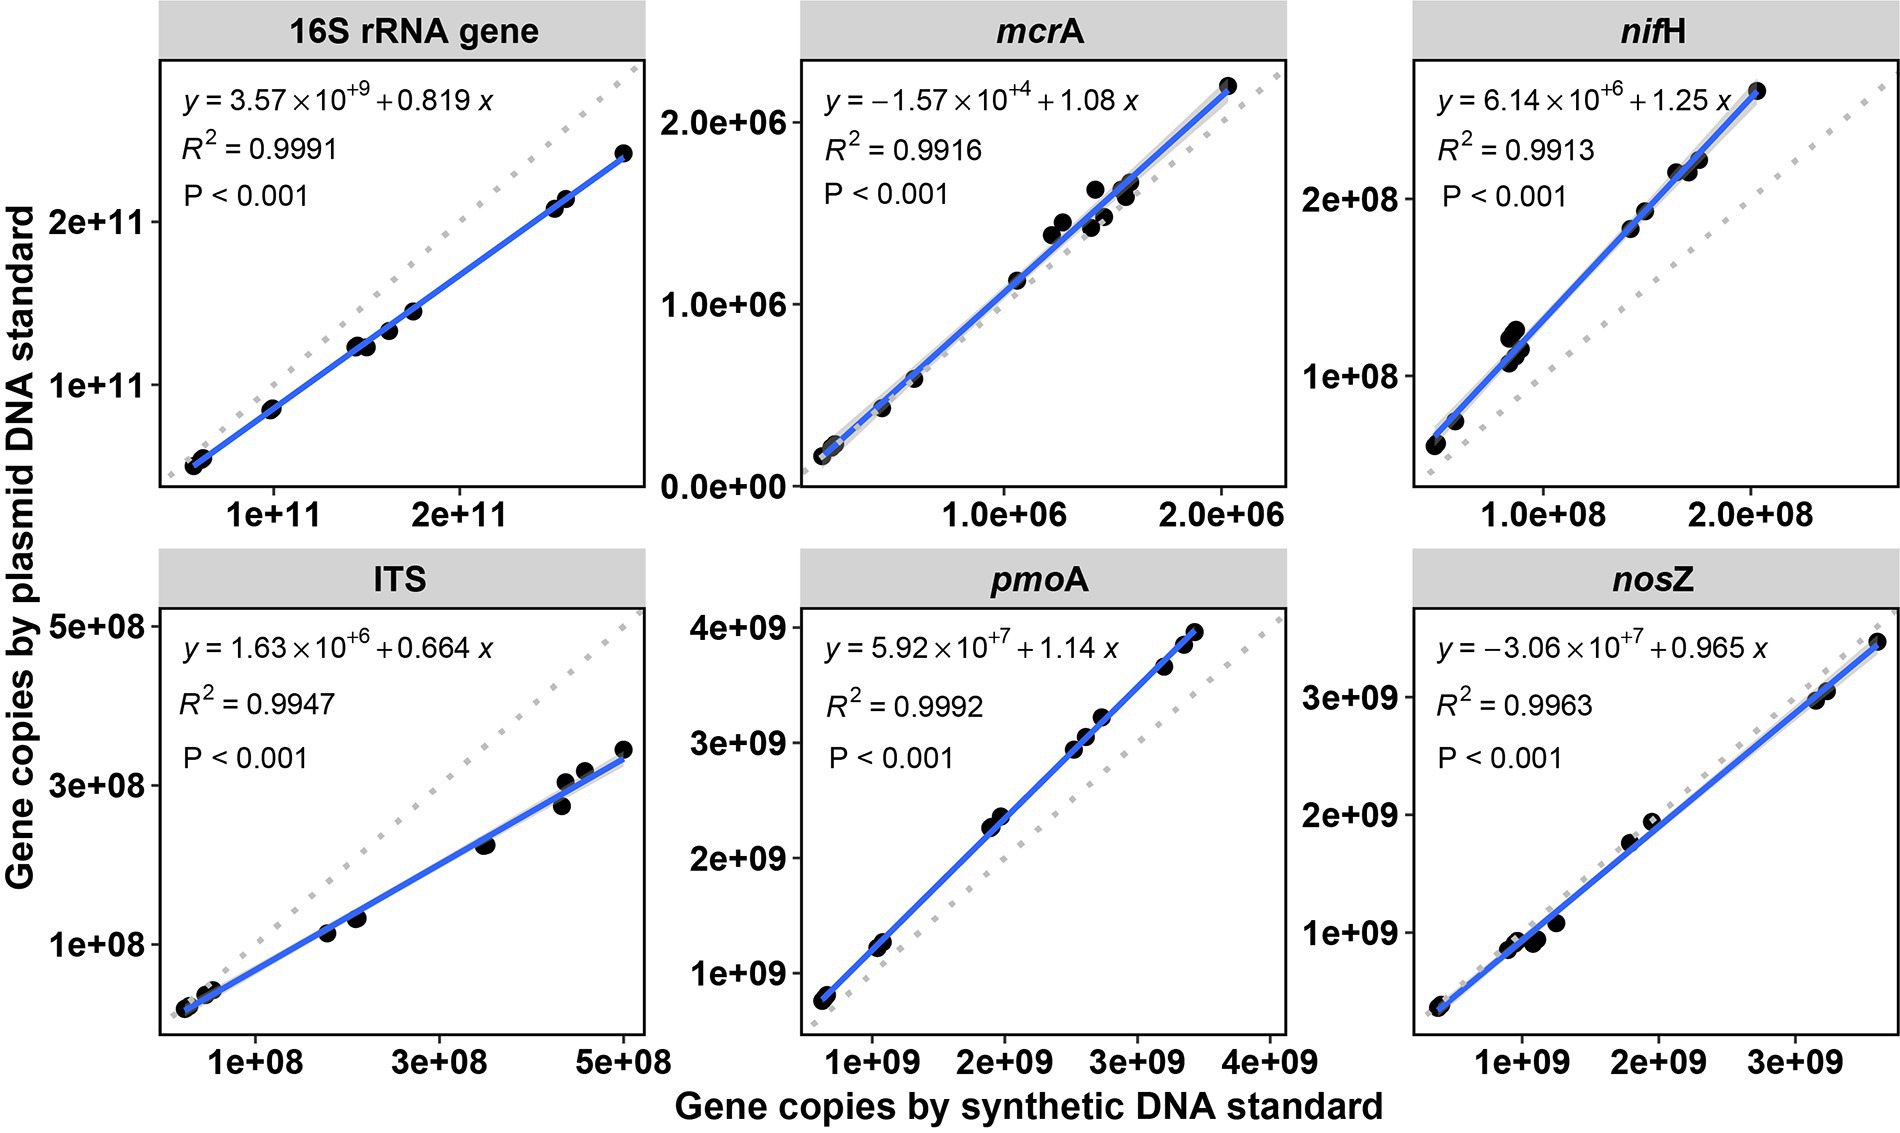
Figure 3. Linear correlations between copy numbers in soil samples (copies per dry gram soil) of the tested genes by qPCR between synthetic DNA and plasmid DNA standards. R2 is the coefficient of determination. p < 0.001 indicates the significance of the linear regression. The gray dashed lines are 1:1 reference lines.
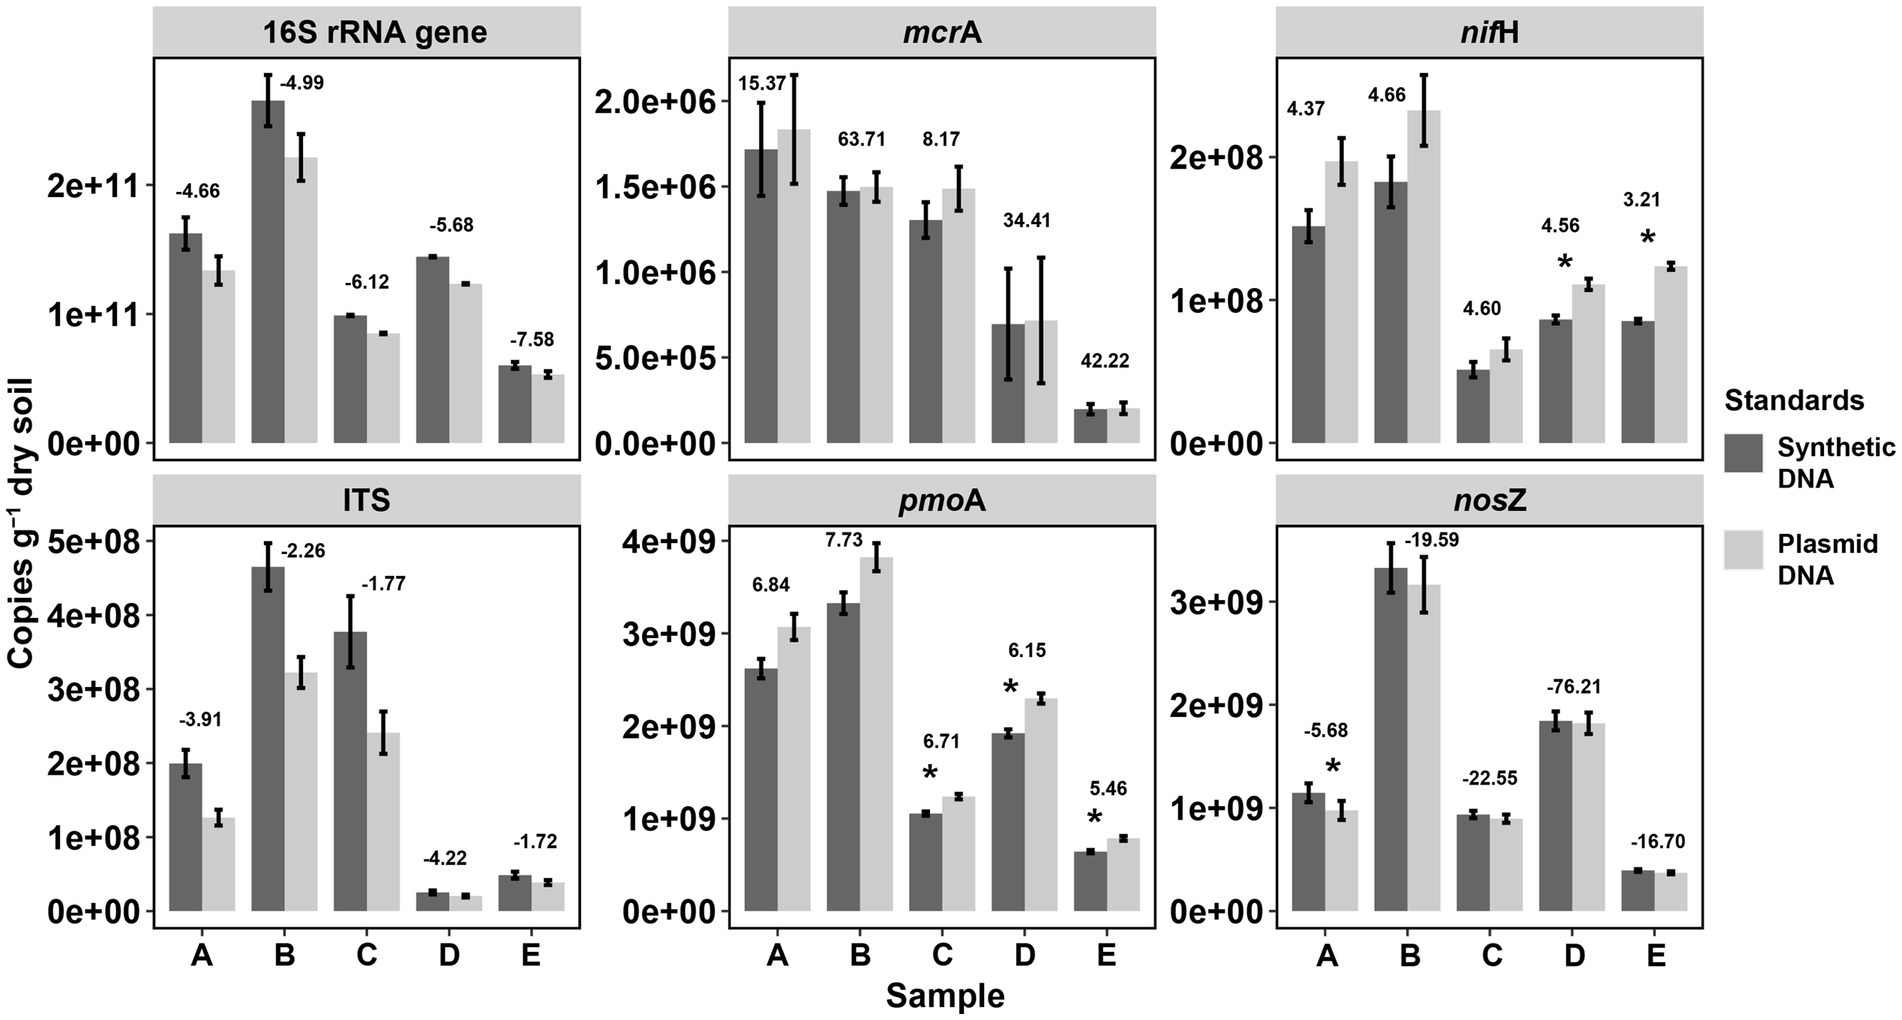
Figure 4. Comparisons of gene copy numbers in soils by qPCR between synthetic and plasmid DNA standards. Significant differences in gene copies between plasmid DNA and synthetic DNA standards are marked as asterisks (*p < 0.05) based on T-test by the function compare_means() from the R package ggpubr. p-values were adjusted by the “Bonferroni” method. Values above the two bars at each elevational site indicate the delta value of the average: mean (copies by plasmid standard)/[mean (copies by plasmid standard) – mean (copies by synthetic standard)/]. The larger the absolute delta values, the more similar copy numbers of the tested genes per soil sample from the two qPCR standards.
Despite the described deviation, correlation of gene copies in the soil samples using the synthetic standard and copies by using plasmid standard, was significant with a squared coefficient (R2) of over 0.99 (Linear correlations, all significant p < 0.001) for all the six tested genes (Figure 3), which showed highly identical results with both standards. Similarly, high R2 (0.83) based on linear correlations were also observed in a study on human virus by qPCR when comparing synthetic DNA and plasmid DNA standards (Bandeira et al., 2020). Furthermore, when comparing the variation in gene copy numbers among soils normalized to the soil with the highest copy numbers (for each gene, Supplementary Figure S3), no significant difference was observed between synthetic and plasmid DNA standards. This further showed the high identity of the two standards of qPCR in quantifying soil DNA. Therefore, considering the sensitivity and efficiency of qPCR, inhibition and human errors (i.e., pipetting errors), differences in copy numbers within 50% variation in this study are very much acceptable, especially with gene concentrations reaching up to more than 1010 copies per dry gram soil.
Taken all together, our results demonstrated that the synthetic DNA standards are reliable for qPCR quantification of various phylogenetic and functional genes in soils. Furthermore, we could validate the usage of synthetic DNA standards designed from consensus sequences of 10 to 20 aligned microbial gene sequences. We however recognized that 10 to 20 sequences may be a limited number for consensus sequence design given what is known for the specific genes studied here and their diversity. Moreover, we suggest to include at least 10 additional bases at each flanking end of the targeted gene primer consensus sequence, to assure that the target gene can be completely amplified. As a future development perspective, multiplexing multiple targeted genes on a single gBlocks fragment (i.e., designing one standard sequence that can be used in qPCR assays of several targeted genes) could be developed, under the condition that randomly nucleotides are inserted as placeholders (spacer) between the primers binding position to assure matching distances (May et al., 2015). Finally, creating a repository where all designed consensus sequences targeting a variety of phylogenetic and functional genes could be deposited, would greatly ease the dissemination and accessibility of information needed to synthesize and broaden the use of synthesized standards for qPCR assays.
4. Conclusion
In this study, we designed qPCR standards for quantifying various phylogenetic and functional genes used in microbial ecology, such as those involved in C and N cycling, by synthesizing double-stranded DNA sequences as gBlocks gene fragments. We show that synthetic DNA standards performed equally well as traditional plasmid standards in producing linear qPCR calibration curves, yielding precise and efficient results for a broad range of soils. The application of synthetic DNA standards for qPCR assays is however not limited to soils, but can be recommended for all kind of genes from a large variety of environments, such as water, air and sediments, whenever qPCR is needed for gene quantification.
Data availability statement
The datasets presented in this study can be found in online repositories. The names of the repository/repositories and accession number(s) can be found in the article/Supplementary material.
Author contributions
XH: Conceptualization, Formal analysis, Investigation, Methodology, Writing – original draft, Writing – review & editing. KB: Writing – review & editing. HB: Writing – review & editing. BF: Writing – review & editing. BS: Writing – review & editing, Methodology. AF: Writing – review & editing, Funding acquisition, Supervision, Writing – original draft.
Funding
The author(s) declare financial support was received for the research, authorship, and/or publication of this article. This study was funded by the Swiss National Science Foundation (SNF 31BD30_193667), through the Biodivclim ERA-NET COFUND programme.
Acknowledgments
The authors thank Anders Priemé and George Stoletov at the University of Copenhagen for soil DNA extracts. The authors thank Christoph Sperisen at WSL for valuable informative discussion on synthetic DNA designs.
Conflict of interest
The authors declare that the research was conducted in the absence of any commercial or financial relationships that could be construed as a potential conflict of interest.
Publisher’s note
All claims expressed in this article are solely those of the authors and do not necessarily represent those of their affiliated organizations, or those of the publisher, the editors and the reviewers. Any product that may be evaluated in this article, or claim that may be made by its manufacturer, is not guaranteed or endorsed by the publisher.
Supplementary material
The Supplementary material for this article can be found online at: https://www.frontiersin.org/articles/10.3389/fmicb.2023.1279041/full#supplementary-material
References
Arya, M., Shergill, I. S., Williamson, M., Gommersall, L., Arya, N., and Patel, H. R. H. (2005). Basic principles of real-time quantitative PCR. Expert. Rev. Mol. Diagn. 5, 209–219. doi: 10.1586/14737159.5.2.209
Bagert, J. D., Xie, Y. S. J., Sweredoski, M. J., Qi, Y. T., Hess, S., Schuman, E. M., et al. (2014). Quantitative, time-resolved proteomic analysis by combining bioorthogonal noncanonical amino acid tagging and pulsed stable isotope labeling by amino acids in cell culture. Mol. Cell. Proteomics 13, 1352–1358. doi: 10.1074/mcp.M113.031914
Bandeira, L. M., Puga, M. A. M., de Paula, V. S., Demarchi, L. H. F., Lichs, G. G. C., Domingos, J. A., et al. (2020). Use of synthetic oligonucleotides for determination of HTLV-1 proviral load by real-time PCR: a helpful alternative approach in the clinical management. J. Appl. Microbiol. 129, 768–774. doi: 10.1111/jam.14646
Bivins, A., Kaya, D., Bibby, K., Simpson, S. L., Bustin, S. A., Shanks, O. C., et al. (2021). Variability in RT-qPCR assay parameters indicates unreliable SARS-CoV-2 RNA quantification for wastewater surveillance. Water Res. 203:117516. doi: 10.1016/j.watres.2021.117516
Bouvier, T., and del Giorgio, P. A. (2003). Factors influencing the detection of bacterial cells using fluorescence in situ hybridization (FISH): a quantitative review of published reports. FEMS Microbiol. Ecol. 44, 3–15. doi: 10.1016/S0168-6496(02)00461-0
Braker, G., and Tiedje, J. M. (2003). Nitric oxide reductase (nor B) genes from pure cultures and environmental samples. Appl. Environ. Microbiol. 69, 3476–3483. doi: 10.1128/Aem.69.6.3476-3483.2003
Brankatschk, R., Bodenhausen, N., Zeyer, J., and Burgmann, H. (2012). Simple absolute quantification method correcting for quantitative PCR efficiency variations for microbial community samples. Appl. Environ. Microbiol. 78, 4481–4489. doi: 10.1128/Aem.07878-11
Bustin, S. A., Benes, V., Garson, J. A., Hellemans, J., Huggett, J., Kubista, M., et al. (2009). The MIQE guidelines: minimum information for publication of quantitative real-time PCR experiments. Clin. Chem. 55, 611–622. doi: 10.1373/clinchem.2008.112797
Canfield, D. E., Kristensen, E., and Thamdrup, B. (2005). Aquatic Geomicrobiology. Adv. Mar. Biol. 48, 1–640. doi: 10.1016/S0065-2881(05)48001-3
Carlson, R. (2009). The changing economics of DNA synthesis. Nat. Biotechnol. 27, 1091–1094. doi: 10.1038/nbt1209-1091
Caron, D. A. (1983). Technique for enumeration of heterotrophic and phototropic Nanoplankton, using epifluorescence microscopy, and comparison with other procedures. Appl. Environ. Microbiol. 46, 491–498. doi: 10.1128/Aem.46.2.491-498.1983
Church, M. J., Short, C. M., Jenkins, B. D., Karl, D. M., and Zehr, J. P. (2005). Temporal patterns of nitrogenase gene (nifH) expression in the oligotrophic North Pacific Ocean. Appl. Environ. Microbiol. 71, 5362–5370. doi: 10.1128/Aem.71.9.5362-5370.2005
Cimino, G. D., Metchette, K. C., Tessman, J. W., Hearst, J. E., and Isaacs, S. T. (1991). Post-PCR sterilization - a method to control carryover contamination for the polymerase chain-reaction. Nucleic Acids Res. 19, 99–107. doi: 10.1093/nar/19.1.99
Conte, J., Potoczniak, M. J., and Tobe, S. S. (2018). Using synthetic oligonucleotides as standards in probe-based qPCR. BioTechniques 64, 177–179. doi: 10.2144/btn-2018-2000
Deng, L. H., Fiskal, A., Han, X. G., Dubois, N., Bernasconi, S. M., and Lever, M. A. (2019). Improving the accuracy of flow cytometric quantification of microbial populations in sediments: importance of cell staining procedures. Front. Microbiol. 10:e00720. doi: 10.3389/fmicb.2019.00720
Dhanasekaran, S., Doherty, T. M., Kenneth, J., and Grp, T. T. S. (2010). Comparison of different standards for real-time PCR-based absolute quantification. J. Immunol. Methods 354, 34–39. doi: 10.1016/j.jim.2010.01.004
Eickhorst, T., and Tippkotter, R. (2008). Improved detection of soil microorganisms using fluorescence in situ hybridization (FISH) and catalyzed reporter deposition (CARD-FISH). Soil Biol. Biochem. 40, 1883–1891. doi: 10.1016/j.soilbio.2008.03.024
Fesolovich, J., and Tobe, S. (2017). The use of a synthetic oligonucleotide for creating a standard curve for Qpcr assays. Forensic Sci. Int. 277, 1–159. doi: 10.1016/j.forsciint.2017.07.019
Fierer, N., Jackson, J. A., Vilgalys, R., and Jackson, R. B. (2005). Assessment of soil microbial community structure by use of taxon-specific quantitative PCR assays. Appl. Environ. Microbiol. 71, 4117–4120. doi: 10.1128/Aem.71.7.4117-4120.2005
Francis, C. A., Roberts, K. J., Beman, J. M., Santoro, A. E., and Oakley, B. B. (2005). Ubiquity and diversity of ammonia-oxidizing archaea in water columns and sediments of the ocean. Proc. Natl. Acad. Sci. U. S. A. 102, 14683–14688. doi: 10.1073/pnas.0506625102
Freeman, W. M., Walker, S. J., and Vrana, K. E. (1999). Quantitative RT-PCR: pitfalls and potential. BioTechniques 26:112. doi: 10.2144/99261rv01
Frey, B., Niklaus, P. A., Kremer, J., Luscher, P., and Zimmermann, S. (2011). Heavy-machinery traffic impacts methane emissions as well as methanogen abundance and community structure in Oxic Forest soils. Appl. Environ. Microbiol. 77, 6060–6068. doi: 10.1128/Aem.05206-11
Frey, B., Pesaro, M., Rudt, A., and Widmer, F. (2008). Resilience of the rhizosphere Pseudomonas and ammonia-oxidizing bacterial populations during phytoextraction of heavy metal polluted soil with poplar. Environ. Microbiol. 10, 1433–1449. doi: 10.1111/j.1462-2920.2007.01556.x
Frey, B., Rime, T., Phillips, M., Stierli, B., Hajdas, I., Widmer, F., et al. (2016). Microbial diversity in European alpine permafrost and active layers. FEMS Microbiol. Ecol. 92:fiw018. doi: 10.1093/femsec/fiw018
Frossard, A., Gerull, L., Mutz, M., and Gessner, M. O. (2012). Disconnect of microbial structure and function: enzyme activities and bacterial communities in nascent stream corridors. ISME J. 6, 680–691. doi: 10.1038/ismej.2011.134
Frossard, A., Hammes, F., and Gessner, M. O. (2016). Flow cytometric assessment of bacterial abundance in soils, sediments and sludge. Front. Virol. 7:e00903. doi: 10.3389/fmicb.2016.00903
Frostegard, A., Tunlid, A., and Baath, E. (1991). Microbial biomass measured as Total lipid phosphate in soils of different organic content. J. Microbiol. Methods 14, 151–163. doi: 10.1016/0167-7012(91)90018-L
Godornes, C., Leader, B. T., Molini, B. J., Centurion-Lara, A., and Lukehart, S. A. (2007). Quantitation of rabbit cytokine mRNA by real-time RT-PCR. Cytokine 38, 1–7. doi: 10.1016/j.cyto.2007.04.002
Goodwin, C., Higgins, D., Tobe, S. S., Austin, J., Wotherspoon, A., Gahan, M. E., et al. (2018). Singleplex quantitative real-time PCR for the assessment of human mitochondrial DNA quantity and quality. Foren. Sci. Med. Pathol. 14, 70–75. doi: 10.1007/s12024-017-9944-8
Gunawardana, M., Chang, S., Jimenez, A., Holland-Moritz, D., Holland-Moritz, H., La Val, T. P., et al. (2014). Isolation of PCR quality microbial community DNA from heavily contaminated environments. J. Microbiol. Methods 102, 1–7. doi: 10.1016/j.mimet.2014.04.005
Hallin, S., and Lindgren, P. E. (1999). PCR detection of genes encoding nitrile reductase in denitrifying bacteria. Appl. Environ. Microbiol. 65, 1652–1657. doi: 10.1128/AEM.65.4.1652-1657.1999
Han, X. G., Schubert, C. J., Fiskal, A., Dubois, N., and Lever, M. A. (2020). Eutrophication as a driver of microbial community structure in lake sediments. Environ. Microbiol. 22, 3446–3462. doi: 10.1111/1462-2920.15115
Han, X. G., Sun, X., Wang, C., Wu, M. X., Dong, D., Zhong, T., et al. (2016). Mitigating methane emission from paddy soil with rice-straw biochar amendment under projected climate change. Sci. Rep. 6:24731. doi: 10.1038/srep24731
Hartmann, M., Niklaus, P. A., Zimmermann, S., Schmutz, S., Kremer, J., Abarenkov, K., et al. (2014). Resistance and resilience of the forest soil microbiome to logging-associated compaction. ISME J. 8, 226–244. doi: 10.1038/ismej.2013.141
Henry, S., Bru, D., Stres, B., Hallet, S., and Philippot, L. (2006). Quantitative detection of the nosZ gene, encoding nitrous oxide reductase, and comparison of the abundances of 16S rRNA, narG, nirK, and nosZ genes in soils. Appl. Environ. Microbiol. 72, 5181–5189. doi: 10.1128/Aem.00231-06
Holmes, A. J., Costello, A., Lidstrom, M. E., and Murrell, J. C. (1995). Evidence that particulate methane monooxygenase and Ammonia monooxygenase May be evolutionarily related. FEMS Microbiol. Lett. 132, 203–208. doi: 10.1111/j.1574-6968.1995.tb07834.x
Hou, Y. B., Zhang, H., Miranda, L., and Lin, S. J. (2010). Serious overestimation in quantitative PCR by circular (supercoiled) plasmid standard: microalgal pcna as the model gene. PLoS One 5:e9545. doi: 10.1371/journal.pone.0009545
Hungate, B. A., Mau, R. L., Schwartz, E., Caporaso, J. G., Dijkstra, P., van Gestel, N., et al. (2015). Quantitative microbial ecology through stable isotope probing. Appl. Environ. Microbiol. 81, 7570–7581. doi: 10.1128/Aem.02280-15
Hutchins, D. A., and Capone, D. C. (2022). The marine nitrogen cycle: new developments and global change. Nat. Rev. Microbiol. 20, 401–414. doi: 10.1038/s41579-022-00687-z
Kepner, R. L., and Pratt, J. R. (1994). Use of Fluorochromes for direct enumeration of Total Bacteria in environmental-samples - past and present. Microbiol. Rev. 58, 603–615. doi: 10.1128/mr.58.4.603-615.1994
Kim, T. G., Jeong, S. Y., and Cho, K. S. (2014). Comparison of droplet digital PCR and quantitative real-time PCR for examining population dynamics of bacteria in soil. Appl. Microbiol. Biotechnol. 98, 105–113. doi: 10.1007/s00253-014-5794-4
Leininger, S., Urich, T., Schloter, M., Schwark, L., Qi, J., Nicol, G. W., et al. (2006). Archaea predominate among ammonia-oxidizing prokaryotes in soils. Nature 442, 806–809. doi: 10.1038/nature04983
Lima, L. R. P., da Silva, A. P., Schmidt-Chanasit, J., and de Paula, V. S. (2017). Diagnosis of human herpes virus 1 and 2 (HHV-1 and HHV-2): use of a synthetic standard curve for absolute quantification by real time polymerase chain reaction. Memorias Do Instituto Oswaldo Cruz 112, 220–223. doi: 10.1590/0074-02760160354
Lin, C. H., Chen, Y. C., and Pan, T. M. (2011). Quantification Bias caused by plasmid DNA conformation in quantitative real-time PCR assay. PLoS One 6:e29101. doi: 10.1371/journal.pone.0029101
Luby, E., Ibekwe, A. M., Zilles, J., and Pruden, A. (2016). Molecular methods for assessment of antibiotic resistance in agricultural ecosystems: prospects and challenges. J. Environ. Qual. 45, 441–453. doi: 10.2134/jeq2015.07.0367
Luo, G. W., Ling, N., Nannipieri, P., Chen, H., Raza, W., Wang, M., et al. (2017). Long-term fertilisation regimes affect the composition of the alkaline phosphomonoesterase encoding microbial community of a vertisol and its derivative soil fractions. Biol. Fertil. Soils 53, 375–388. doi: 10.1007/s00374-017-1183-3
Luton, P. E., Wayne, J. M., Sharp, R. J., and Riley, P. W. (2002). The mcrA gene as an alternative to 16S rRNA in the phylogenetic analysis of methanogen populations in landfill. Microbiol. Sgm 148, 3521–3530. doi: 10.1099/00221287-148-11-3521
Magee, R., Telonis, A. G., Cherlin, T., Rigoutsos, I., and Londin, E. (2017). Assessment of isomiR discrimination using commercial qPCR methods. Non-coding RNA 3:18. doi: 10.3390/ncrna3020018
May, T., Koch-Singenstreu, M., Ebling, J., Stantscheff, R., Muller, L., Jacobi, F., et al. (2015). Design and application of a synthetic DNA standard for real-time PCR analysis of microbial communities in a biogas digester. Appl. Microbiol. Biotechnol. 99, 6855–6863. doi: 10.1007/s00253-015-6721-z
McCall, M. N., McMurray, H. R., Land, H., and Almudevar, A. (2014). On non-detects in qPCR data. Bioinformatics 30, 2310–2316. doi: 10.1093/bioinformatics/btu239
Munoz-Calderon, A., Silva-Gomes, N. L., Apodaca, S., de Noya, B. A., Diaz-Bello, Z., Souza, L. R. Q., et al. (2021). Toward the establishment of a single standard curve for quantification of Trypanosoma cruzi natural populations using a synthetic satellite unit DNA sequence. J. Mol. Diagn. 23, 521–531. doi: 10.1016/j.jmoldx.2021.01.007
Oertel, C., Matschullat, J., Zurba, K., Zimmermann, F., and Erasmi, S. (2016). Greenhouse gas emissions from soils a review. Chem. Erde-Geochem. 76, 327–352. doi: 10.1016/j.chemer.2016.04.002
Oldham, A. L., and Duncan, K. E. (2012). Similar gene estimates from circular and linear standards in quantitative PCR analyses using the prokaryotic 16S rRNA gene as a model. PLoS One 7:e51931. doi: 10.1371/journal.pone.0051931
Orlando, C., Pinzani, P., and Pazzagli, M. (1998). Developments in quantitative PCR. Clin. Chem. Lab. Med. 36, 255–269. doi: 10.1515/Cclm.1998.045
Perez-Mon, C., Stierli, B., Plotze, M., and Frey, B. (2022). Fast and persistent responses of alpine permafrost microbial communities to in situ warming. Sci. Total Environ. 807:150720. doi: 10.1016/j.scitotenv.2021.150720
Pester, M., Maixner, F., Berry, D., Rattei, T., Koch, H., Lucker, S., et al. (2014). NxrB encoding the beta subunit of nitrite oxidoreductase as functional and phylogenetic marker for nitrite-oxidizing Nitrospira. Environ. Microbiol. 16, 3055–3071. doi: 10.1111/1462-2920.12300
Poly, F., Monrozier, L. J., and Bally, R. (2001). Improvement in the RFLP procedure for studying the diversity of nifH genes in communities of nitrogen fixers in soil. Res. Microbiol. 152, 95–103. doi: 10.1016/S0923-2508(00)01172-4
Portilho, M. M., Mendonca, A. C. D., Bezerra, C. S., Do Espirito-Santos, M. P., de Paula, V. S., Nabuco, L. C., et al. (2018). Usefulness of in-house real time PCR for HBV DNA quantification in serum and oral fluid samples. J. Virol. Methods 256, 100–106. doi: 10.1016/j.jviromet.2018.03.001
Ragot, S. A., Kertesz, M. A., and Bunemann, E. K. (2015). phoD alkaline phosphatase gene diversity in soil. Appl. Environ. Microbiol. 81, 7281–7289. doi: 10.1128/Aem.01823-15
Rotthauwe, J. H., Witzel, K. P., and Liesack, W. (1997). The ammonia monooxygenase structural gene amoA as a functional marker: molecular fine-scale analysis of natural ammonia-oxidizing populations. Appl. Environ. Microbiol. 63, 4704–4712. doi: 10.1128/Aem.63.12.4704-4712.1997
Schimel, J. P., and Schaeffer, S. M. (2012). Microbial control over carbon cycling in soil. Front. Microbiol. 3:348. doi: 10.3389/fmicb.2012.00348
Schippers, A., Neretin, L. N., Kallmeyer, J., Ferdelman, T. G., Cragg, B. A., Parkes, R. J., et al. (2005). Prokaryotic cells of the deep sub-seafloor biosphere identified as living bacteria. Nature 433, 861–864. doi: 10.1038/nature03302
Sirois, S. H., and Buckley, D. H. (2019). Factors governing extracellular DNA degradation dynamics in soil. Environ. Microbiol. Rep. 11, 173–184. doi: 10.1111/1758-2229.12725
Smith, C. J., and Osborn, A. M. (2009). Advantages and limitations of quantitative PCR (Q-PCR)-based approaches in microbial ecology. FEMS Microbiol. Ecol. 67, 6–20. doi: 10.1111/j.1574-6941.2008.00629.x
Steinberg, L. M., and Regan, J. M. (2008). Phylogenetic comparison of the methanogenic communities from an acidic, oligotrophic fen and an anaerobic digester treating municipal wastewater sludge. Appl. Environ. Microbiol. 74, 6663–6671. doi: 10.1128/Aem.00553-08
Stubner, S. (2002). Enumeration of 16S rDNA of Desulfotomaculum lineage 1 in rice field soil by real-time PCR with SybrGreen (TM) detection. J. Microbiol. Methods 50, 155–164. doi: 10.1016/S0167-7012(02)00024-6
Svec, D., Tichopad, A., Novosadova, V., Pfaffl, M. W., and Kubista, M. (2015). How good is a PCR efficiency estimate: recommendations for precise and robust qPCR efficiency assessments. Biomol. Detect. Quantif. 3, 9–16. doi: 10.1016/j.bdq.2015.01.005
Takai, K., and Horikoshi, K. (2000). Rapid detection and quantification of members of the archaeal community by quantitative PCR using fluorogenic probes. Appl. Environ. Microbiol. 66, 5066–5072. doi: 10.1128/Aem.66.11.5066-5072.2000
Tedersoo, L., Bahram, M., Polme, S., Koljalg, U., Yorou, N. S., Wijesundera, R., et al. (2014). Global diversity and geography of soil fungi. Science 346:1078. doi: 10.1126/science.1256688
Throback, I. N., Enwall, K., Jarvis, A., and Hallin, S. (2004). Reassessing PCR primers targeting nirS, nirK and nosZ genes for community surveys of denitrifying bacteria with DGGE. FEMS Microbiol. Ecol. 49, 401–417. doi: 10.1016/j.femsec.2004.04.011
Tourinho, R. S., de Almeida, C., Lemos, A., Gardinali, N. R., Vieira, Y. R., Schmidt-Chanasit, J., et al. (2015). Application of synthetic standard curves for absolute quantification of hepatitis a and E by real-time PCR. Genet Genome Res 2, 1–3. doi: 10.23937/2378-3648/1410013
Van Guilder, H. D., Vrana, K. E., and Freeman, W. M. (2008). Twenty-five years of quantitative PCR for gene expression analysis. BioTechniques 44, 619–626. doi: 10.2144/000112776
Walthert, L., Graf, U., Kammer, A., Luster, J., Pezzotta, D., Zimmermann, S., et al. (2010). Determination of organic and inorganic carbon, delta C-13, and nitrogen in soils containing carbonates after acid fumigation with HCI. J. Plant Nutr. Soil Sci. 173, 207–216. doi: 10.1002/jpln.200900158
Webster, T. M., Smith, A. L., Reddy, R. R., Pinto, A. J., Hayes, K. F., and Raskin, L. (2016). Anaerobic microbial community response to methanogenic inhibitors 2-bromoethanesulfonate and propynoic acid. Microbiology 5, 537–550. doi: 10.1002/mbo3.349
White, D. C., Davis, W. M., Nickels, J. S., King, J. D., and Bobbie, R. J. (1979). Determination of the sedimentary microbial biomass by extractible lipid phosphate. Oecologia 40, 51–62. doi: 10.1007/BF00388810
Xu, L. K., Chen, H., Canales, M., and Ciric, L. (2019). Use of synthesized double-stranded gene fragments as qPCR standards for the quantification of antibiotic resistance genes. J. Microbiol. Methods 164:105670. doi: 10.1016/j.mimet.2019.105670
Zemb, O., Achard, C. S., Hamelin, J., De Almeida, M. L., Gabinaud, B., Cauquil, L., et al. (2020). Absolute quantitation of microbes using 16S rRNA gene metabarcoding: a rapid normalization of relative abundances by quantitative PCR targeting a 16S rRNA gene spike-in standard. Microbiology 9:e977. doi: 10.1002/mbo3.977
Keywords: synthetic DNA, plasmid, real-time quantitative PCR, qPCR standards, qPCR methodology, microbial and functional gene abundances, C and N cycling
Citation: Han X, Beck K, Bürgmann H, Frey B, Stierli B and Frossard A (2023) Synthetic oligonucleotides as quantitative PCR standards for quantifying microbial genes. Front. Microbiol. 14:1279041. doi: 10.3389/fmicb.2023.1279041
Edited by:
Hinsby Cadillo-Quiroz, Arizona State University, United StatesReviewed by:
Mark Reynolds, Marine Biological Laboratory (MBL), United StatesPaul Greenfield, Commonwealth Scientific and Industrial Research Organisation (CSIRO), Australia
Copyright © 2023 Han, Beck, Bürgmann, Frey, Stierli and Frossard. This is an open-access article distributed under the terms of the Creative Commons Attribution License (CC BY). The use, distribution or reproduction in other forums is permitted, provided the original author(s) and the copyright owner(s) are credited and that the original publication in this journal is cited, in accordance with accepted academic practice. No use, distribution or reproduction is permitted which does not comply with these terms.
*Correspondence: Xingguo Han, eGluZ2d1by5oYW5Ad3NsLmNo; Aline Frossard, YWxpbmUuZnJvc3NhcmRAd3NsLmNo
†ORCID: Xingguo Han, https://orcid.org/0000-0002-5753-5255
Helmut Bürgmann, https://orcid.org/0000-0002-5651-5906
Beat Frey, https://orcid.org/0000-0002-6391-3574
Aline Frossard, https://orcid.org/0000-0003-1699-6220