 Ruijuan Zheng1
 Silu Huang1
 Pengya Feng1
 Simeng Liu2
 Miaomiao Jiang1
 Huijuan Li1
 Pengyuan Zheng2,3*
 Yang Mi2,3*
 Enyao Li1*
- 1Department of Child Rehabilitation, The Fifth Affiliated Hospital of Zhengzhou University, Zhengzhou, China
- 2Henan Key Laboratory of Helicobacter Pylori and Microbiota and Gastrointestinal Cancer, Marshall B. J. Medical Research Center of Zhengzhou University, The Fifth Affiliated Hospital of Zhengzhou University, Zhengzhou, China
- 3Department of Gastroenterology, The Fifth Affiliated Hospital of Zhengzhou University, Zhengzhou, China
Introduction: Autism spectrum disorder (ASD) is a neurodevelopmental disorder characterized by deficits in social communication and the presence of restricted, repetitive behaviors or interests. Studies have revealed that gut microbiota and their metabolism play important roles in ASD, and become the underlying mechanisms of ASD.
Methods: In this study, we performed long-read 16S rRNA sequencing and untargeted metabolomics to comprehensively characterize the profiles of gut microbiota and fecal metabolites in 34 ASD patients and 18 healthy controls. The associations between gut microbiota, fecal metabolites and clinical symptoms were analyzed to screen related biomarkers for ASD.
Results: The results showed the similarity of the overall microbial richness and diversity between ASD patients and controls, however, some specific bacterial taxa exhibited significant differences, including Klebsiella and Escherichia-Shigella at genera level, and Clostridium-sporogenes, Escherichia-coli-O157H7 and Bacteroides-ovatus at species level. The fecal metabolomics validated that a lot of metabolites had significantly differential levels, including a series of organic acids, amino acids and dopamine.
Discussion: The associations of gut microbiota and fecal metabolites might shed new light on the pathogenesis of ASD and help us to understand the importance of gut microbiota as potential biomarkers and therapeutic targets in the development of ASD.
Introduction
Autism spectrum disorder (ASD) is a group of neurodevelopmental disorders characterized by impairment in social communication, narrow range of interests or activities, and repetitive stereotyped behavior (Valentino et al., 2021). Patients typically exhibit symptom onset between 6 and 24 months, with some individuals initially displaying normal development followed by degenerative changes occurring at 24–36 months, characterized by a decline in language and social skills. The prevalence rate of ASD has been increasing in recent years (Okada and Ozaki, 2015; Shaw et al., 2021), however, the specific pathogenesis of ASD is still unclear.
The presence of gastrointestinal symptoms, including constipation, abdominal pain, and diarrhea, is frequently observed in individuals with ASD (Bauman, 2010; Bresnahan et al., 2015; Cermak et al., 2010; Leader et al., 2022). Therefore, it can be inferred that gut microbiota plays a crucial role in maintaining human health. In fact, the genome of gut microbiota also influences the expression of human proteins and metabolic genes, and any disruption to the homeostasis of gut microbiota could have detrimental effects on human health (Srivastava et al., 2021). For instance, an imbalance in the microbiota is one of the contributing factors to Alzheimer’s disease, leading to increased blood-brain barrier permeability and intestinal permeability (Jiang et al., 2017). Su et al. (2024) reported that the potential application of multi-kingdom and functional gut microbiota markers as non-invasive diagnostic tools in ASD. In the comprehensive analysis of ASD pathogenesis, studies also have revealed notable disparities in the composition of gut microbiota when compared to typically developing individuals (Sharon et al., 2019). Lou et al. (2022) also demonstrated that a signature of the combination of Veillonella and Enterobacteriaceae, and 17 microbial metabolic functions efficiently discriminated ASD from neurotypical subjects. In a study conducted on patients with ASD, gut microbiota dysbiosis was observed to impact the normal functioning of intestinal epithelial cells, toxin metabolism, food metabolism and nutrient absorption, as well as the immune system (Tonacci et al., 2019). These findings suggested important roles of human gut microbiota in ASD patients, therefore, the investigation about the gut microbiota might provide valuable insights for revealing the underlying pathogenesis of ASD.
The gut microbiota establishes a metabolic axis, connecting the gut, liver, brain, and other organs through the host-microbiota co-metabolic structure (Yadav et al., 2022). This intricate network actively participates in regulating the host’s systemic metabolism. Previous research has demonstrated that ASD children with gastrointestinal symptoms exhibited distinct differences in their gut microbiota composition compared to healthy individuals, and showed reduced levels of short-chain fatty acids (SCFAs) (Zhao et al., 2023). Furthermore, some studies have suggested that SCFAs might have a beneficial or detrimental effect on the gut and neurological development of ASD patients (Lagod and Naser, 2023; Taniya et al., 2022). Abnormal connectivity of neural circuits can arise from an imbalance in brain serotonin (5-HT) levels (Chandana et al., 2005). The synthesis and secretion of 5-HT could be regulated by gut microbiota, and native Bacillus promoted gut chromaffin cells to synthesize 5-HT (Gershon, 1999), in addition, Streptococcus and Enterobacter could also synthesize 5-HT (Bai et al., 2022; Hata et al., 2017; Yano et al., 2015). Therefore, the metabolism of gut microbiota plays a pivotal role in human health, and investigating the interaction of microbiota and fecal metabolism holds promise for unraveling the mechanisms of ASD.
In this study, we have observed significant alterations in the gut microbiota and metabolites of between 34 ASD patients and 18 healthy controls (HC) by 16S ribosomal RNA (rRNA) sequencing and fecal metabolomics. Specifically, the microbial richness and diversity was similar between ASD and HC, accompanied by differences in some specific bacterial taxa, including Klebsiella and Escherichia-Shigella at genera level. Importantly, metabolomics revealed some metabolites were significantly different, including multiple organic acids, amino acids and dopamine. We also investigated the association between gut microbiota and fecal metabolites to gain further insights into the pathogenesis of ASD. This study highlighted potential roles of gut microbiota and fecal metabolites for differentiating ASD and HC as non-invasive diagnostic biomarkers, and provided important information for revealing the pathogenesis of ASD.
Materials and methods
ASD patients and sample collection
We recruited 34 autistic subjects between 2020 and 2022, at the time of the Autism Diagnostic Observation Schedule (ADOS, 2nd Edition) test and language of at least one word were included from the Fifth Affiliated Hospital of Zhengzhou University. Eighteen age- and sex-matched healthy volunteers were accepted as neurotypical controls (NT). The diagnosis of autism was established according to DSM-V (Diagnostic and Statistical Manual of Mental Disorders, 5th Edition) (First, 2013) and ICD-10 (International Statistics Classification of Diseases and Related Health Problems, 10th Revision) (Bramer, 1988) by two experienced child neuropsychiatrists. Neurotypical controls were typically developing children, without an autism diagnosis and not directly related to an autistic individual. The exclusion criteria included a history of nutritional supplements and special diets, presence of significant physical abnormalities, and neurological disorders of known etiology. Participants in this study were not treated with antibiotics, antifungals, probiotics, or prebiotics for at least 3 months before sampling. All methods were carried out in accordance with the relevant guidelines and regulations. All experimental protocols were approved by the Ethical Committee of the Fifth Affiliated Hospital of Zhengzhou University (No.2016-1001). Informed written consent was obtained from the parents and/or legal guardians of the enrolled participants. Fresh fecal samples were collected from 34 ASD patients and 18 HC at the Fifth Affiliated Hospital of Zhengzhou University. The fecal samples were stored at −80°C until following use.
IgG food intolerance testing
Food-specific IgG antibodies were detected using Enzyme-linked immunosorbent test that measures IgG levels against 14 food substances using a single blood sample. This testing procedure involved incubation of the patient serum sample for 30 min at room temperature on a glass microscope slide containing a microarray of 14 food extracts. After this primary incubation, the slide was washed to remove unbound proteins. Following this anti-human IgG conjugated to horseradish peroxidase was added to the slide and incubated for another 30 min at room temperature. The slide was washed again to remove the unbound conjugate. After washing 3, 3’, 5’, 5’-tetramethybenzidine substrate was added to detect specific antibody binding. A third incubation was performed for 10 min and then the slide was washed with distilled water. Finally, the slides were centrifuged and scanned by a high-resolution flatbed scanner associated with computer software that interprets the optical densities of the samples. IgG levels less than 50 U/mL were considered negative, whereas levels either equal to or more than 50 U/mL were considered positive. Values of food specific IgG antibodies either equal to or more than 50 U/mL were included in the study.
Event-related potentials recordings
ERP recordings were made using a 2-channel Electrical Geodesics Incorporated (EGI) system, Nippon Optronics. Only data from the relevant electrodes (where maximum amplitude was reached) were analyzed for the present study, i.e., midline electrode FCz for mismatch negative (MMN) and P3A amplitude, and midline electrode Pz for P3B amplitude, with average reference. A standard method of data processing was used: Neuro Workbench software was used for processing the EEG signals. To allow easier file handling, the data was first down-sampled from the original 500 to 250 Hz. Second, data were corrected for eye-artifacts using the adaptive method of BESA. Third, the data were epoched (from 100 ms pre-stimulus to 900 ms post-stimulus) and corrected for movement and other paradigm unrelated artifacts, by removing those epochs that contained amplitude differences that exceeded 75 μV between the maximum and minimum in the for MMN assessment relevant time window. Last, data were band-pass filtered (0.5–40 Hz). MMN was expressed as a subject’s average ERP to each of the three deviant stimuli from which the average ERP to the standard stimuli was subtracted. MMN was scored as an individual’s maximum negative voltage appearing in the EEG within a time window between 130 and 230 ms for the beep stimulus, and between 140 and 260 ms for the other two deviant types. Similarly, an individual’s P3a amplitude was scored as the maximum positive amplitude in a time window between 200 and 370 ms (all three types of deviants) while the P3B amplitude was assessed as the maximum positive amplitude between 330 and 600 ms.
Long-read 16S rRNA sequencing
Total bacterial DNA was extracted from each fecal samples using the QIAamp DNA stool minikit (Qiagen, Germany). The 16S rRNA amplicon sequencing was performed on MinION nanopore sequencer (Oxford Nanopore Technologies, UK). The amplicon library was prepared using the 16S Barcoding Kit 1–24 (SQK-16S024, Oxford Nanopore Technologies, UK) according to the instructions. For the PCR amplification and barcoding, 15 ng of template DNA were added to the LongAmp Hot Start Taq 2X Master Mix (New England Biolabs, UK) as the manufacturer’s instructions. Then, the barcoded amplicons were purified using the AMPure XP beads (Beckman Coulter, USA) as the Nanopore’s instructions. Samples were then quantified by Qubit fluorometer (Life Technologies, USA) and pooled in an equimolar ratio to a total of 50–100 ng in 10 μL. The pooled library was then loaded into an R9.4.1 flow cell and run according to the Nanopore’s instructions. MINKNOW software 19.12.5 was used for data acquisition.
16S rRNA sequencing data analysis
Raw fastq sequences were base called by using Guppy. Sequencing adapters were then removed from sequences with Porechop v0.2.4. The resulting reads were classified taxonomically with Kraken v1.1.1 (Wood et al., 2019). The Pavian web application1 was utilized to transform Kraken outputs into spreadsheets of taxa counts and relative abundances per sample at phylum, family, genus, and species levels as described previously (Soriano et al., 2022).
Alpha diversity, including the observed species, Chao1, ACE, Shannon, Simpson, and coverage indices, were calculated using Mothur software. The beta diversity analysis was analyzed for the differences of species diversity in different samples, consisted of principal component analysis (PCA), principal-coordinate analysis (PCoA), and nonmetric multidimensional scaling (NMDS). Linear Discriminant Analysis Effect Size (LEfSe) analysis was employed to identify species marker with differential abundances among these two groups.
Fecal metabolomics
The fecal samples stored at −80°C were thawed on ice. A 400 μL solution (methanol: water = 7:3) containing internal standard was added into 20 mg sample, and then vortexed for 3 min. The samples were sonicated in ice bath for 10 min and vortexed for 1 min, and then placed in −20°C for 30 min. The samples were further centrifuged at 12,000 rpm for 10 min at 4°C. And the sediment was removed, then the supernatant was centrifuged at 12,000 rpm for 3 min at 4°C. A 200 μL aliquot of supernatant was transferred for following liquid chromatography-mass spectrometry (LC-MS) analysis.
The fecal metabolites were quantitated in an ultra-performance liquid chromatography (UPLC) system (ExionLC, SCIEX, United States) coupled to a tandem mass spectrometry system (TripleTOF 6600, SCIEX, United States). The analytical conditions were as follows, UPLC: column, Waters ACQUITY UPLC HSS T3 C18 (1.8 μm, 2.1 mm × 100 mm); column temperature, 40°C; flow rate, 0.4 mL/min; injection volume, 2 μL or 5 μL; solvent system, water (0.1% formic acid): acetonitrile (0.1% formic acid); gradient program, 95:5 V/V at 0 min, 10:90 V/V at 10.0 min, 10:90 V/V at 11.0 min, 95:5 V/V at 11.1 min, 95:5 V/V at 14.0 min.
The Triple TOF mass spectrometer was used for its ability to acquire MS/MS spectra on an information-dependent basis during an LC/MS experiment. In this mode, the acquisition software (TripleTOF 6600, SCIEX, United States) continuously evaluates the full scan survey MS data as it collects and triggers the acquisition of MS/MS spectra depending on preselected criteria. The electrospray ionization (ESI) source conditions were set as following: Ion source gas 1 as 50 Psi, Ion source gas 2 as 50 Psi, Curtain gas as 25 Psi, source temperature 500°C, Ion Spray Voltage Floating (ISVF) 5,500 V or −4,500 V in positive or negative modes, respectively.
Metabolomics data analysis
MS raw data files were converted to the ABF format using AbfConverter.4.0.0 and processed using MS-DIAL, generating a data matrix. Structural identification of metabolites was performed based on comparison of the molecular ion mass and MS/MS segments with Human Metabolome Database.2
The population distribution of all fecal samples was evaluated by unsupervised PCA using scaled data. The differential metabolites between these two groups were analyzed by orthogonal partial least-squares discriminant analysis (OPLS-DA). Identification of differential metabolites was based on variable importance for the projection (VIP) score (VIP > 1), absolute Log2FC (|Log2FC| > 1.0) and p value < 0.05. The identified metabolites were annotated using KEGG Compound database,3 and annotated metabolites were then mapped to KEGG Pathway database4 for further pathway enrichment analysis.
Statistical analysis
All statistical analysis was conducted with R-4.3.1.5 Wilcoxon rank sum test was used for the comparison of alpha diversity index between the two groups. The Kruskal-Wallis (KW) rank sum test was performed to identify abundance differences in specific bacterial taxa in LEfSe analysis. The Spearman correlation coefficient was analyzed between the gut microbiota and fecal metabolites. A p-value < 0.05 was considered to be statistically significant.
Results
Alpha diversity of gut microbiota in ASD and healthy controls
In order to assess the changes in microbial community structure between 34 ASD patients and 18 healthy controls (HC), fecal microbial DNA was extracted for next-generation 16S rRNA sequencing by using the Nanopore MinION platform. The Nanopore sequencing reads the entire length of DNA fragment included in the libraries from short to ultralong (longest > 4 Mb), therefore, it has shown a more accurate taxonomic classification at the species level than the regular 16S rRNA sequencing by Illumina MiSeq or Hiseq platform (Nygaard et al., 2020). We firstly performed the microbial alpha diversity analysis based on the sequencing data. The rarefaction curve demonstrated that all samples achieved high coverage, indicating sufficient sequencing depth covered all species within the samples (Figure 1A). Moreover, the flatness of each group’s rarefaction curve suggested that additional sampling would yield only a marginal number of new operational taxonomic units (OTUs), implying an appropriate number of extracted samples (Figure 1A). The curve of most ASD samples exhibited a relatively low slope compared with that of HC, suggested a significantly lower quantity of OTUs in ASD than HC (Figure 1A). The rank-abundance curve served as a representation of species abundance and evenness in the samples. Compared to HC, the decline in the curve for ASD was more pronounced, and also exhibited a narrower range on the horizontal axis. These findings suggested lower species richness in ASD (Figure 1B).
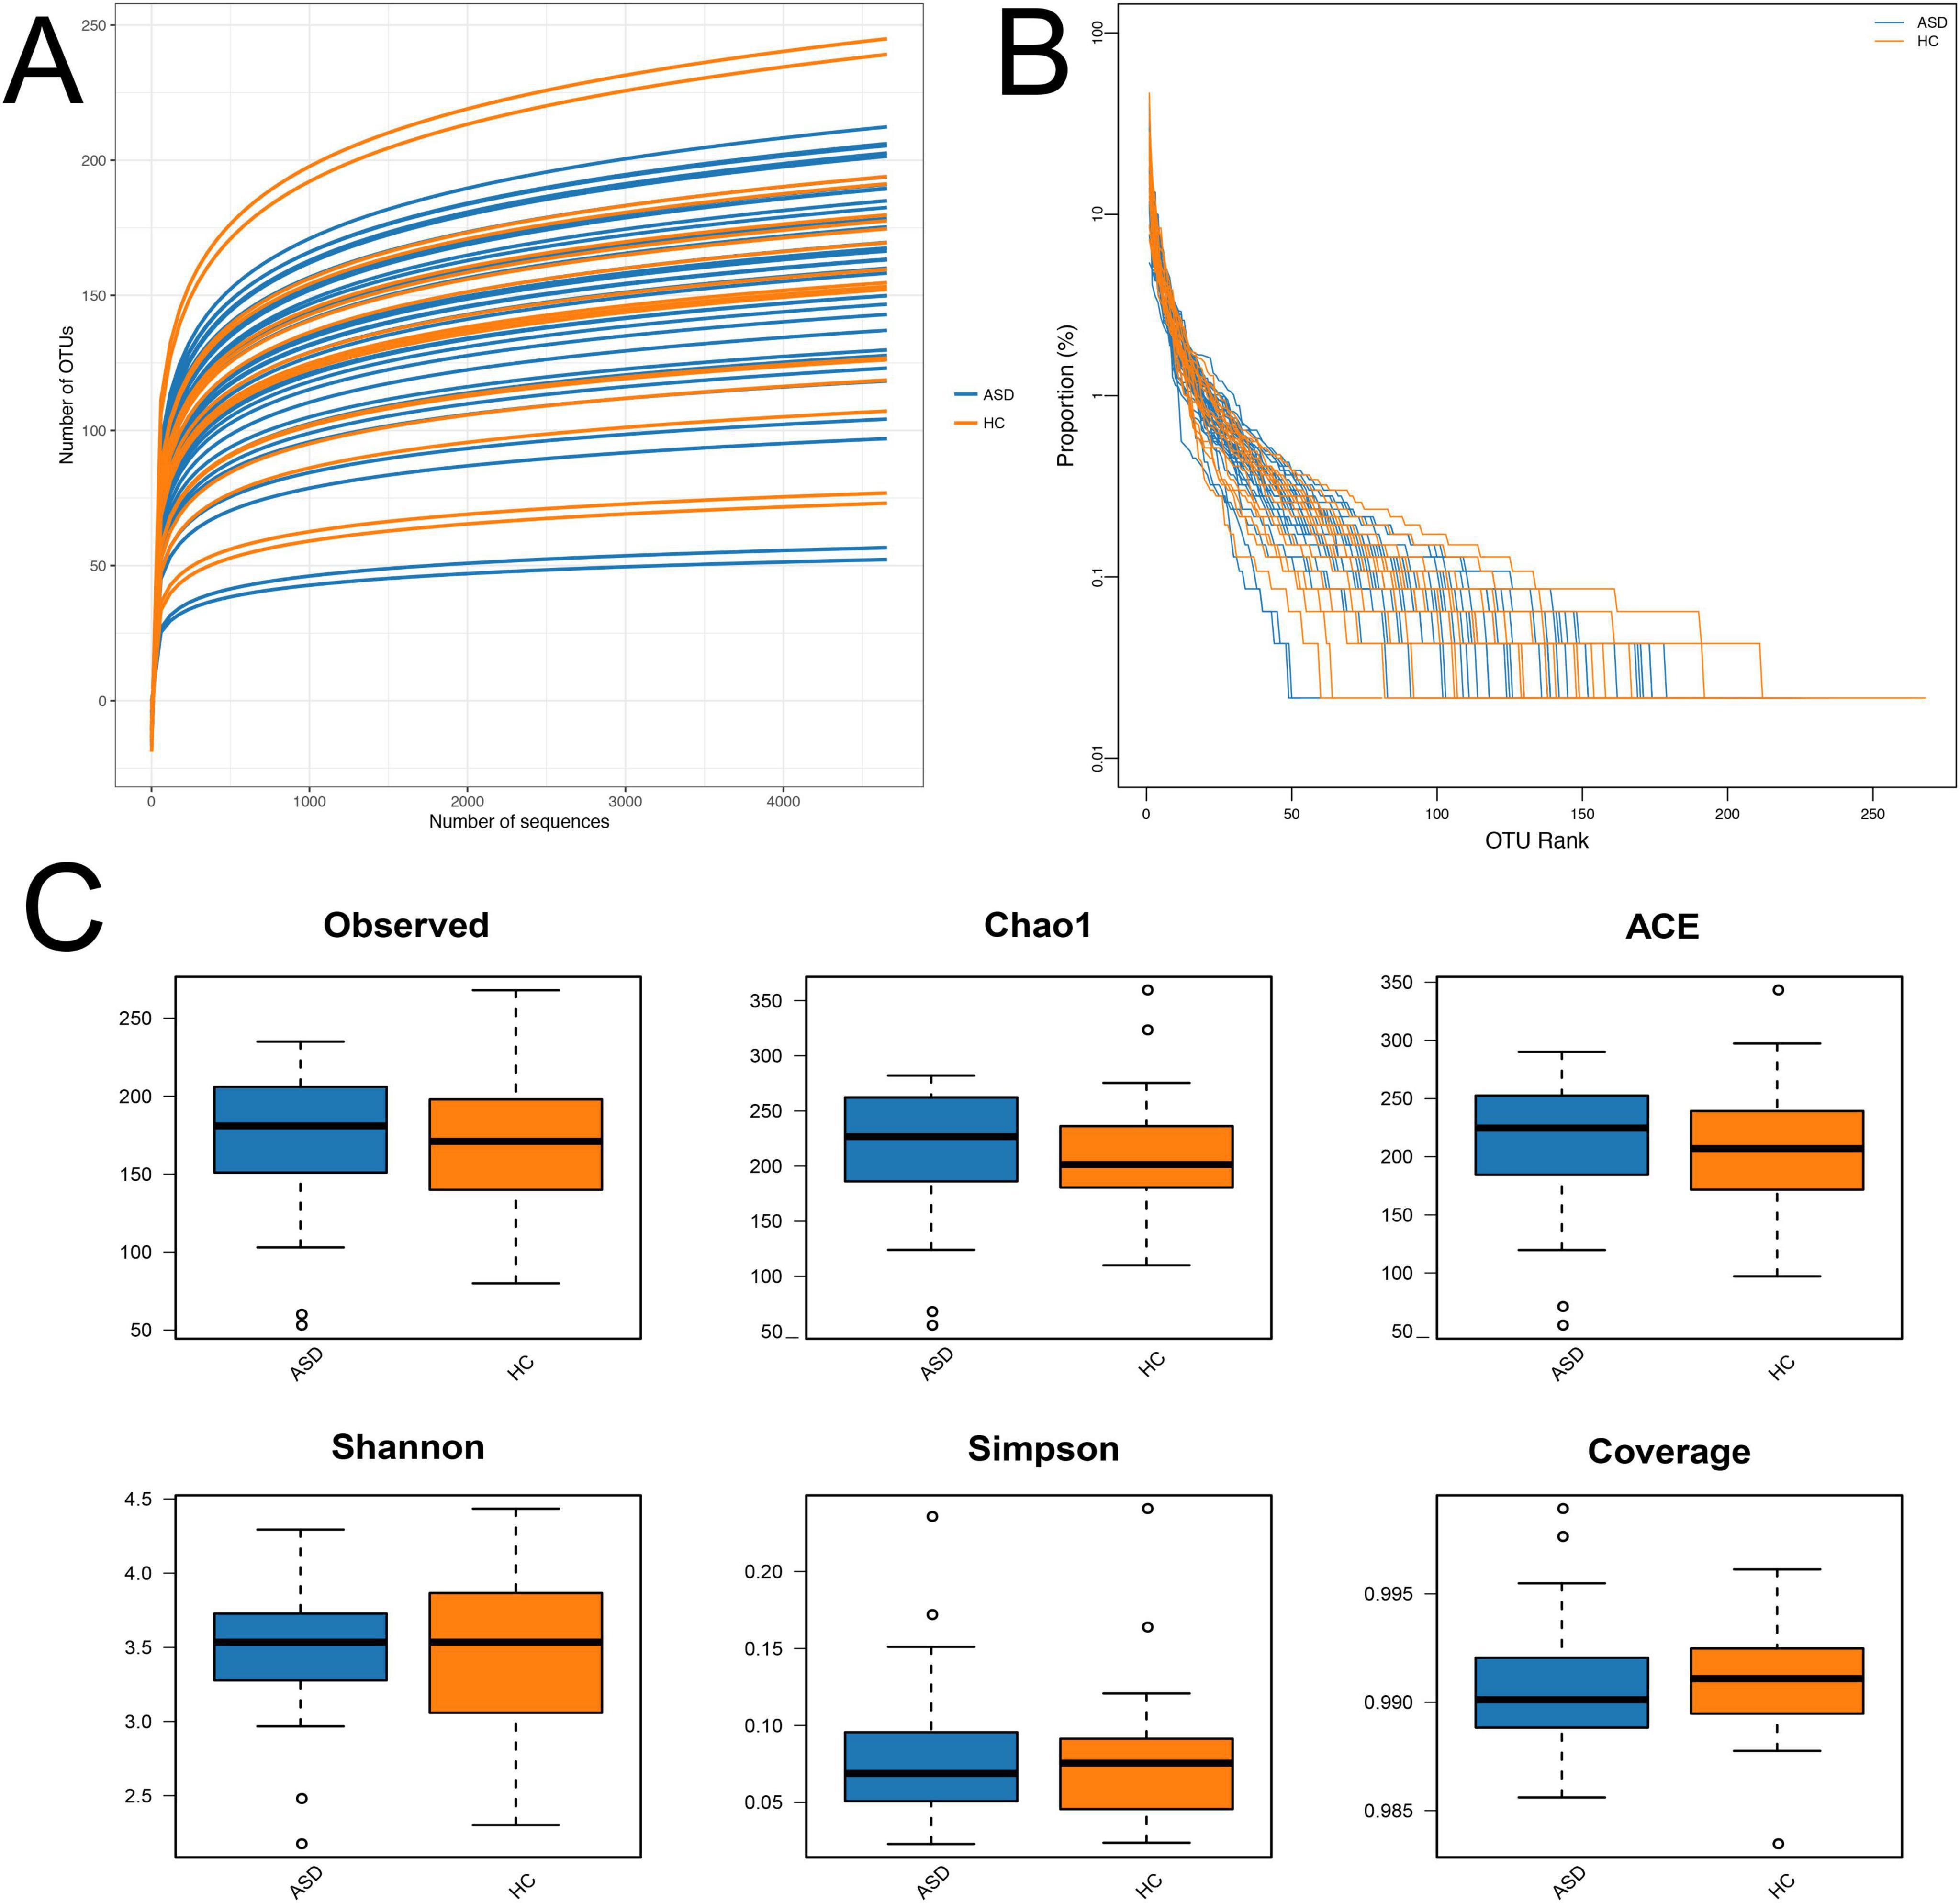
Figure 1. Alpha diversity analysis. (A) Rarefaction curves; (B) rank-abundance distribution curve; (C) diversity and richness of gut microbiota in ASD and HC, including observed species, Chao1, ACE, Shannon, Simpson, and Coverage. There were no significant differences in the microbial richness and diversity between ASD and HC. ASD, autism spectrum disorder; HC, healthy control.
The analysis indexes of alpha diversity commonly contain observed species, Chao1, abundance-based coverage estimator (ACE), Shannon, Simpson, and Coverage. The microbial richness was evaluated by analyzing the observed OTUs, Chao1, and ACE indices, while microbial diversity was evaluated by Shannon, Simpson, and Coverage indices. The results showed comparable microbial richness and diversity between ASD group and HC group, which did not have significant differences (Figure 1C).
Beta diversity of gut microbiota in ASD and healthy controls
Beta diversity analysis consisted of principal component analysis (PCA), principal-coordinate analysis (PCoA), and nonmetric multidimensional scaling (NMDS), the latter two were based on Bray-Curtis (Figures 2A–C). These results revealed the similarities and differences between these two groups based on the overall OTUs (Figures 2A–C).
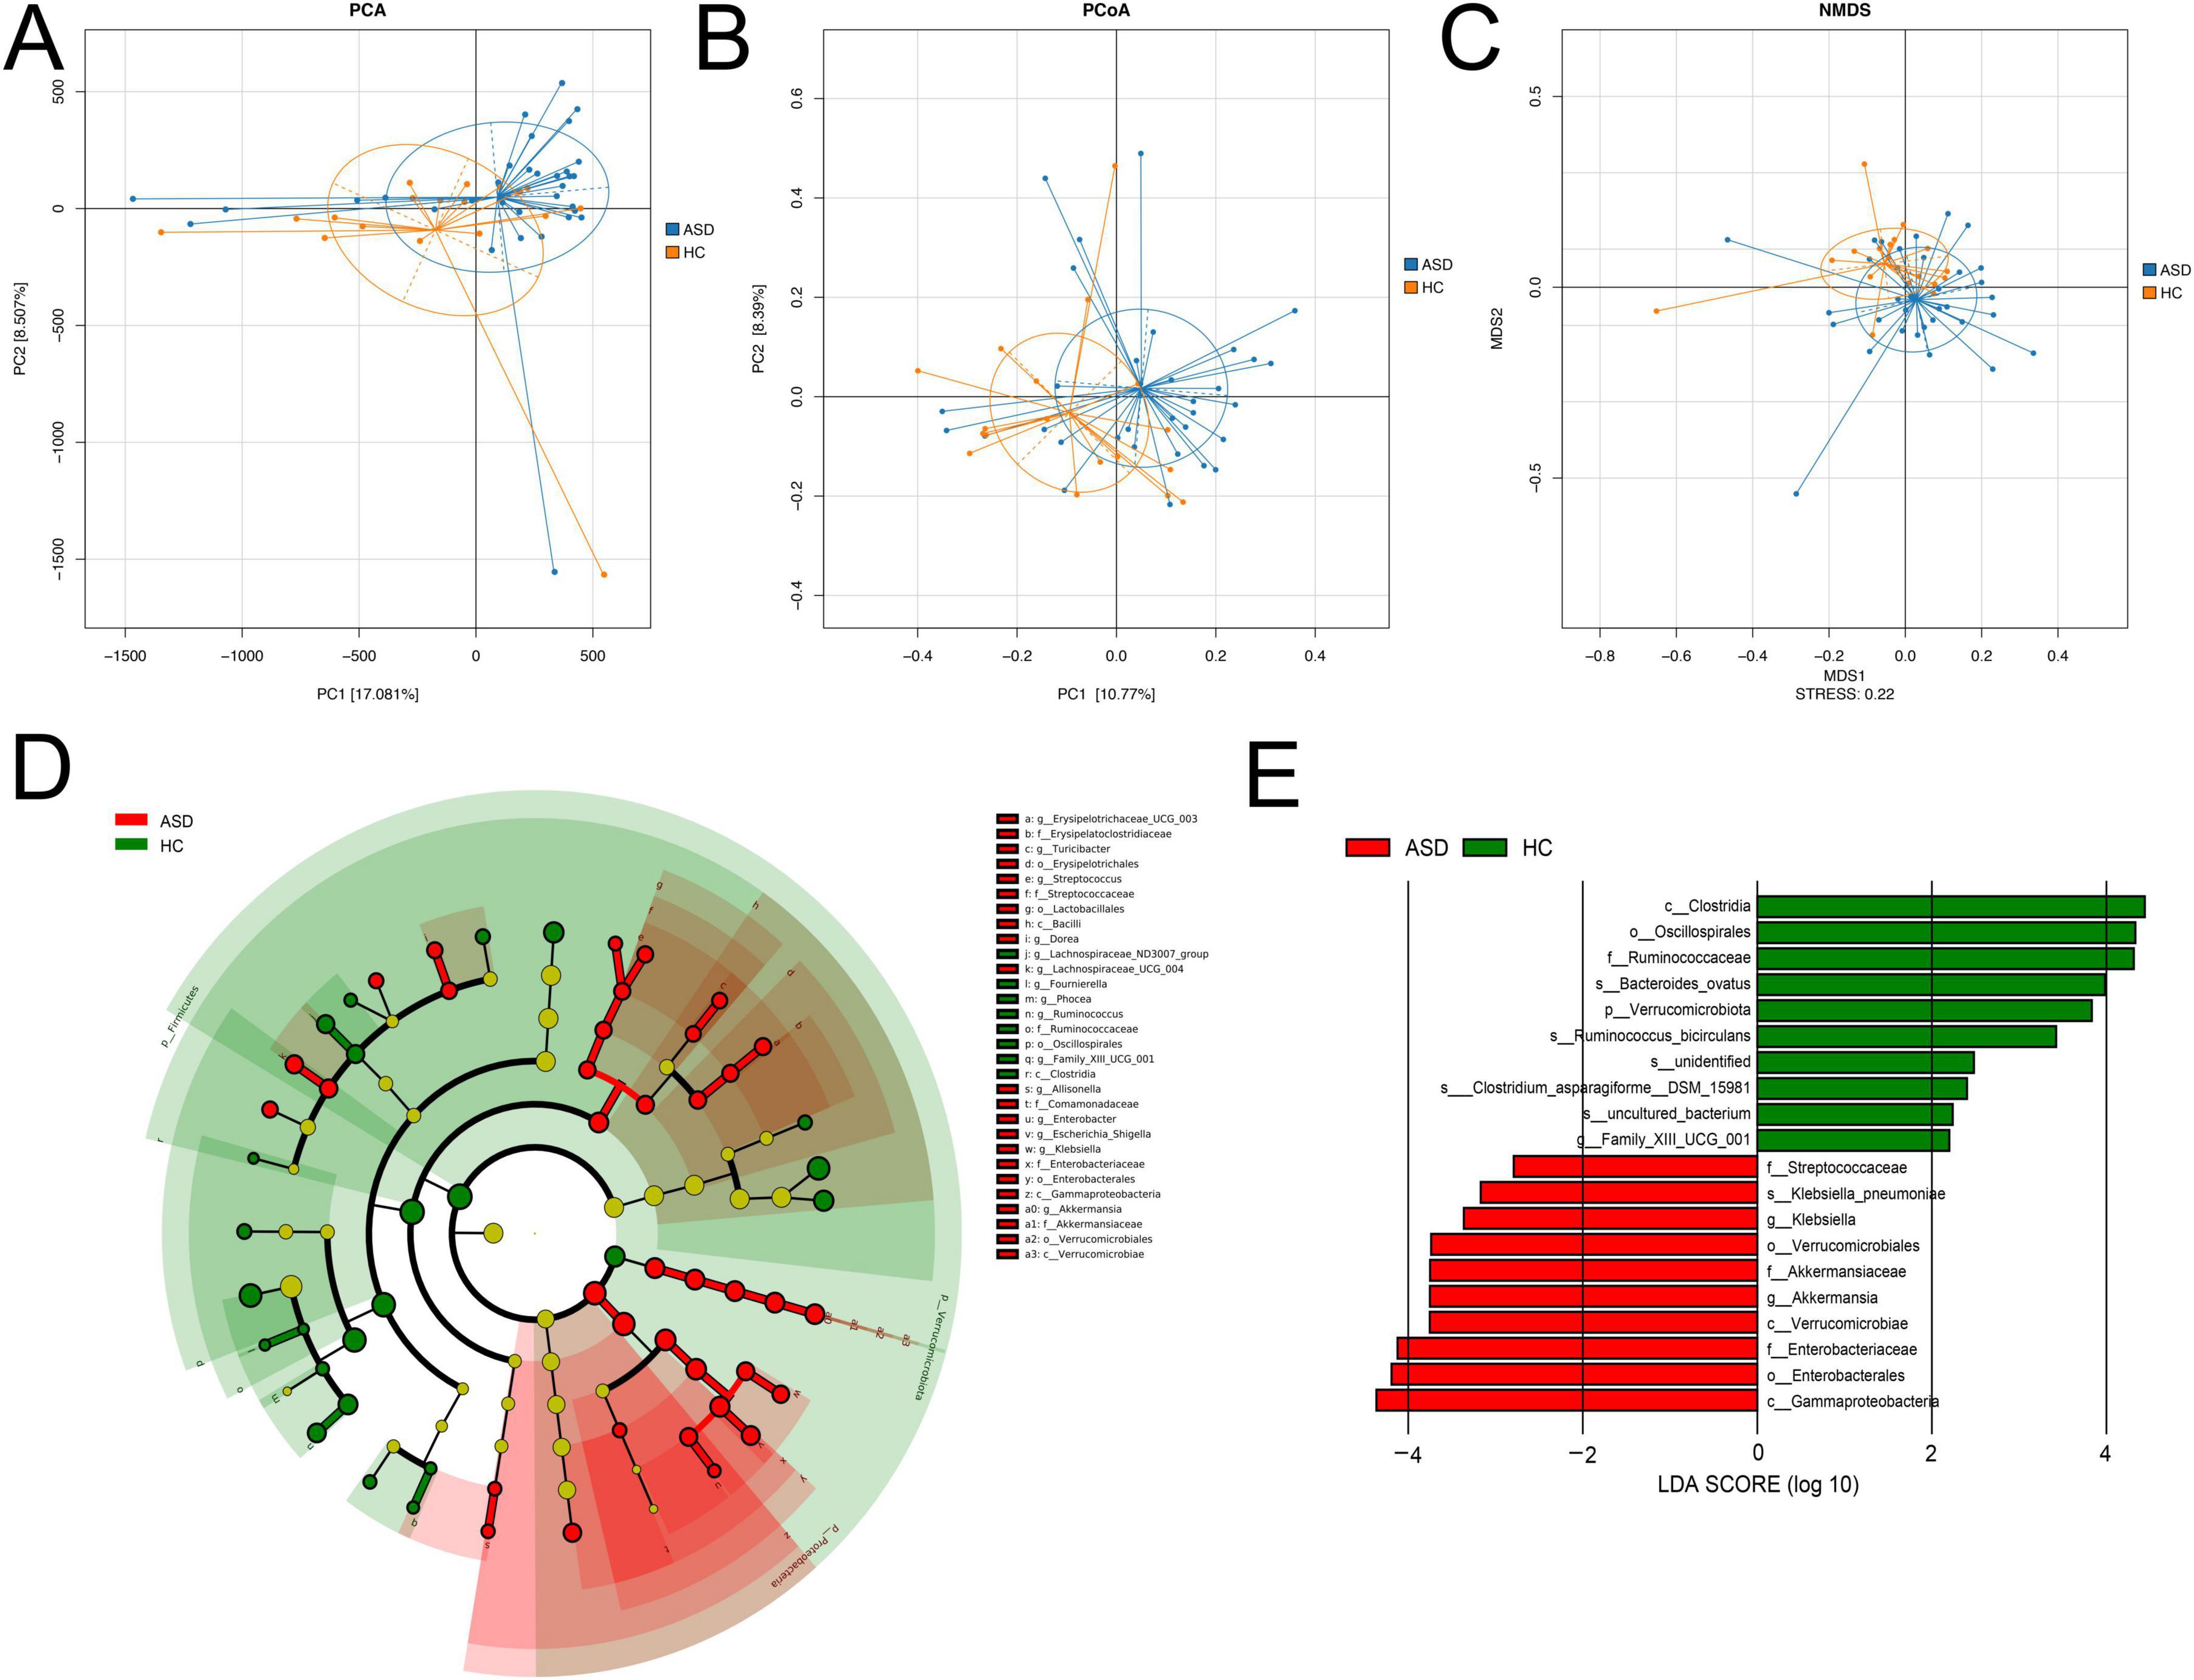
Figure 2. Beta diversity analysis. (A) PCA, (B) PCoA, (C) NMDS analysis results based on the OTU matrix of ASD patients and healthy controls. (D) The cladogram from LEfSe analysis revealed differential microbial taxonomy in ASD and HC group. (E) Histograms of LDA scores in ASD and HC, with a cutoff value of LDA score (log10) above 2.0.
In order to identify the specific bacterial taxa between ASD and control, the microbial community composition was compared by using LEfSe analysis (Figure 2D), which provided taxonomic information and abundance differences among species in each group. The cladogram represented phylum, class, order, family, genus, and species from the center to the outside in taxonomy, respectively. At each classification level, the size of a node representing a species was positively correlated with the abundance of the species, while yellow nodes indicated the species with no significant differences (Figure 2D). The cladogram analysis revealed 30 taxonomies of gut bacterial species had significant variations between ASD and HC, with 22 taxonomies in ASD and eight in HC. For ASD, five key families were identified, including Erysipelatoclostridiaceae, Streptococcaceae, Comamonadaceae, Enterobacteriaceae, and Akkermansiaceae (Figure 2D). Additionally, the main taxonomies with statistically significant differences between these two groups were determined by using LDA (LDA score > 2, p < 0.05). In ASD, the top biomarkers contained Klebsiella, Akkermansia, and Streptococcaceae (Figure 2E).
Changes of microbial community at the OTU level
To better reveal the changes of the gut microbial community in ASD compared with HC, further analysis showed that Bacteroidota, Firmicutes, and Proteobacteria dominated the gut microbiota at the phylum level (Figure 3A), only Firmicutes had significantly lower relative abundance in ASD (39.17% in ASD and 43.43% in HC, Figure 3D). At the class level, Bacteroidaceae, Clostridia, and Gammaproteobacteria were the major classes in both groups (Supplementary Figure S1A). Among them, Gammaproteobacteria, Clostridia and Bacilli had significant differences between ASD and HC (Supplementary Figure S1D). At the order level, Bacteroidales, Oscillospirales, and Lachnospirales had higher abundance in two groups (Supplementary Figure S1B), Enterobacterales and Erysipelotrichales were enriched in ASD, while Oscillospirales and Christensenellales were higher in HC (Supplementary Figure S1E). At the family level, Bacteroidaceae, Ruminococcaceae and Lachnospiraceae were major families (Supplementary Figure S1C), Enterobacteriaceae and Prevotellaceae had higher abundance in ASD, Christensenellaceae and Ruminococcaceae were higher in HC (Supplementary Figure S1F). In addition, Bacteroides, Faecalibacterium and Prevotella_9 were the major genera in two groups (Figure 3B), multiple genera showed obvious changes in ASD compared with HC, including Klebsiella, Escherichia-Shigella and Prevotella_9 (Figure 3E). Importantly, we also found some species had relative differences between ASD and HC, including Clostridium-sporogenes, Escherichia-coli-O157H7 and Bacteroides-ovatus (Figures 3C,F).
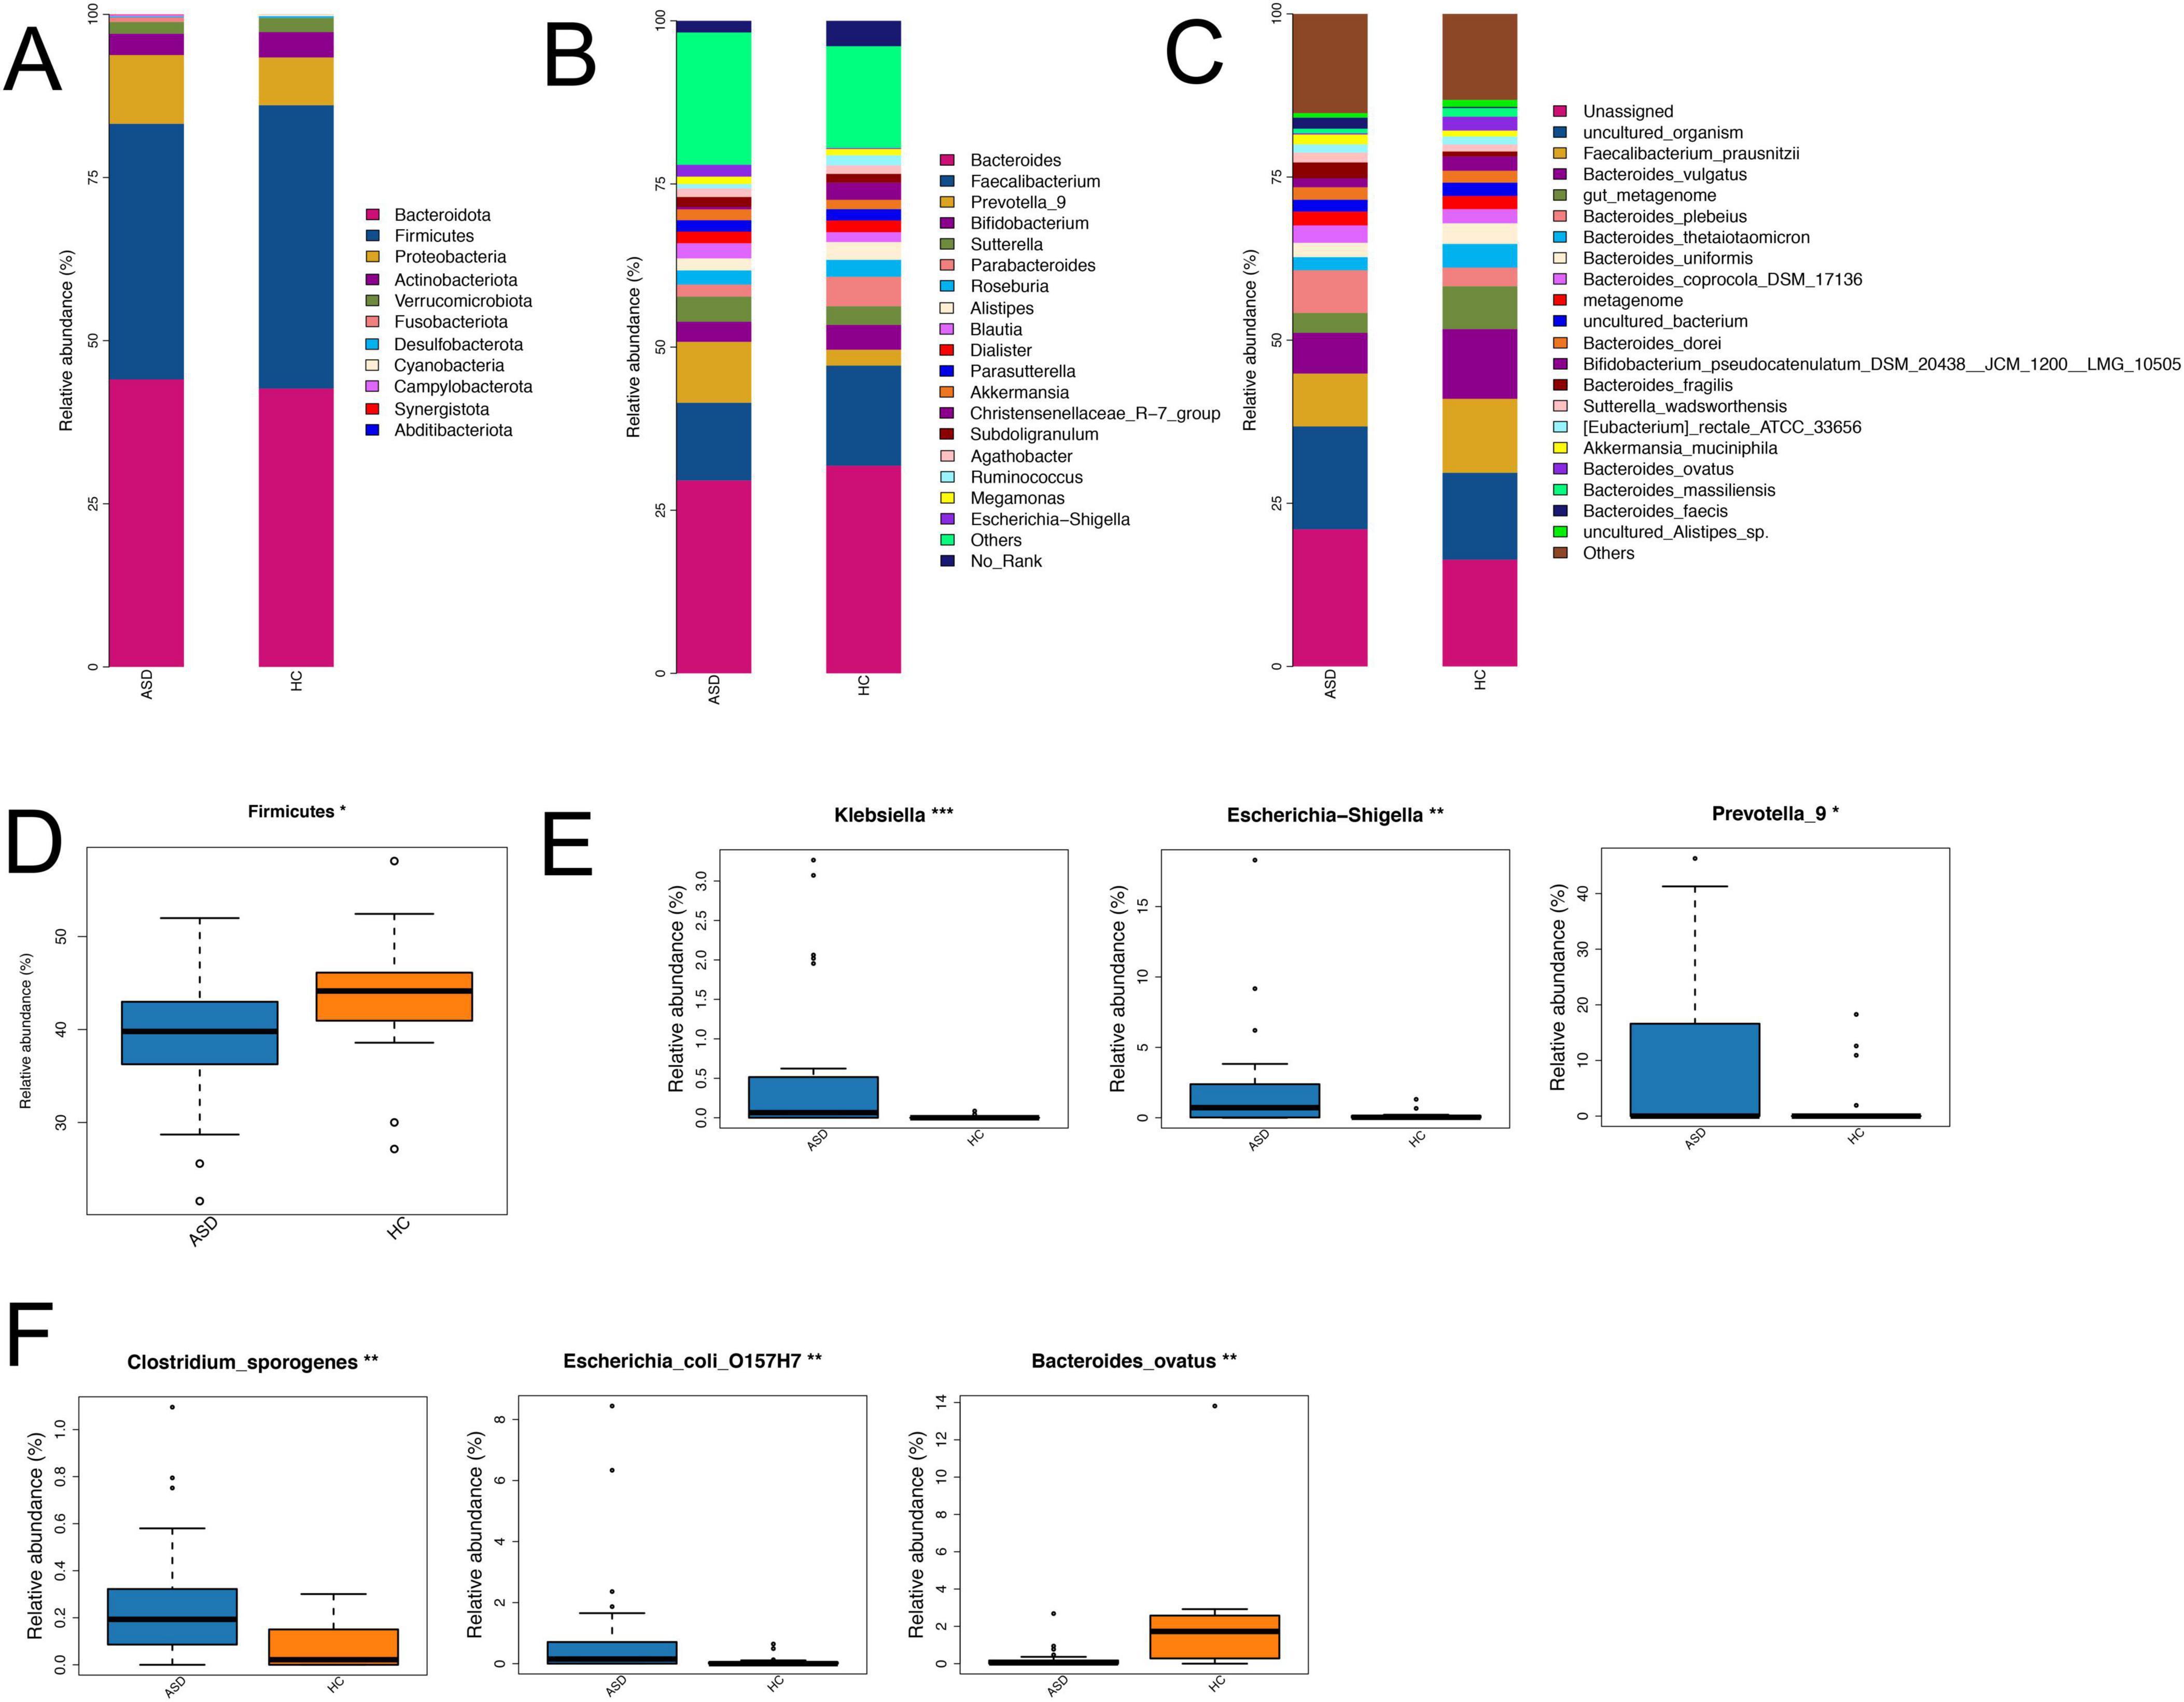
Figure 3. Differences in the composition of gut microbiota between ASD and HC across various taxonomic levels. Bar plots showed the composition differences of gut microbiota at the phylum (A), genus (B) and species (C) levels in two groups. Boxplots revealed the relative abundance of several differential gut microbiota at the phylum (D), genus (E) and species (F) levels between ASD and HC. *p < 0.05, **p < 0.01; ***p < 0.001.
Fecal metabolic profiles in ASD patients and healthy controls
To further investigate the fecal metabolic changes between ASD patients and HC, we performed untargeted metabolome profiling in collected feces samples by UPLC-QTOF-MS/MS. The PCA result revealed some differences in the overall fecal metabolite profiles between these two groups (Figure 4A). The supervised OPLS-DA method demonstrated significant alterations in the composition of fecal metabolites in ASD patients (Figure 4B).
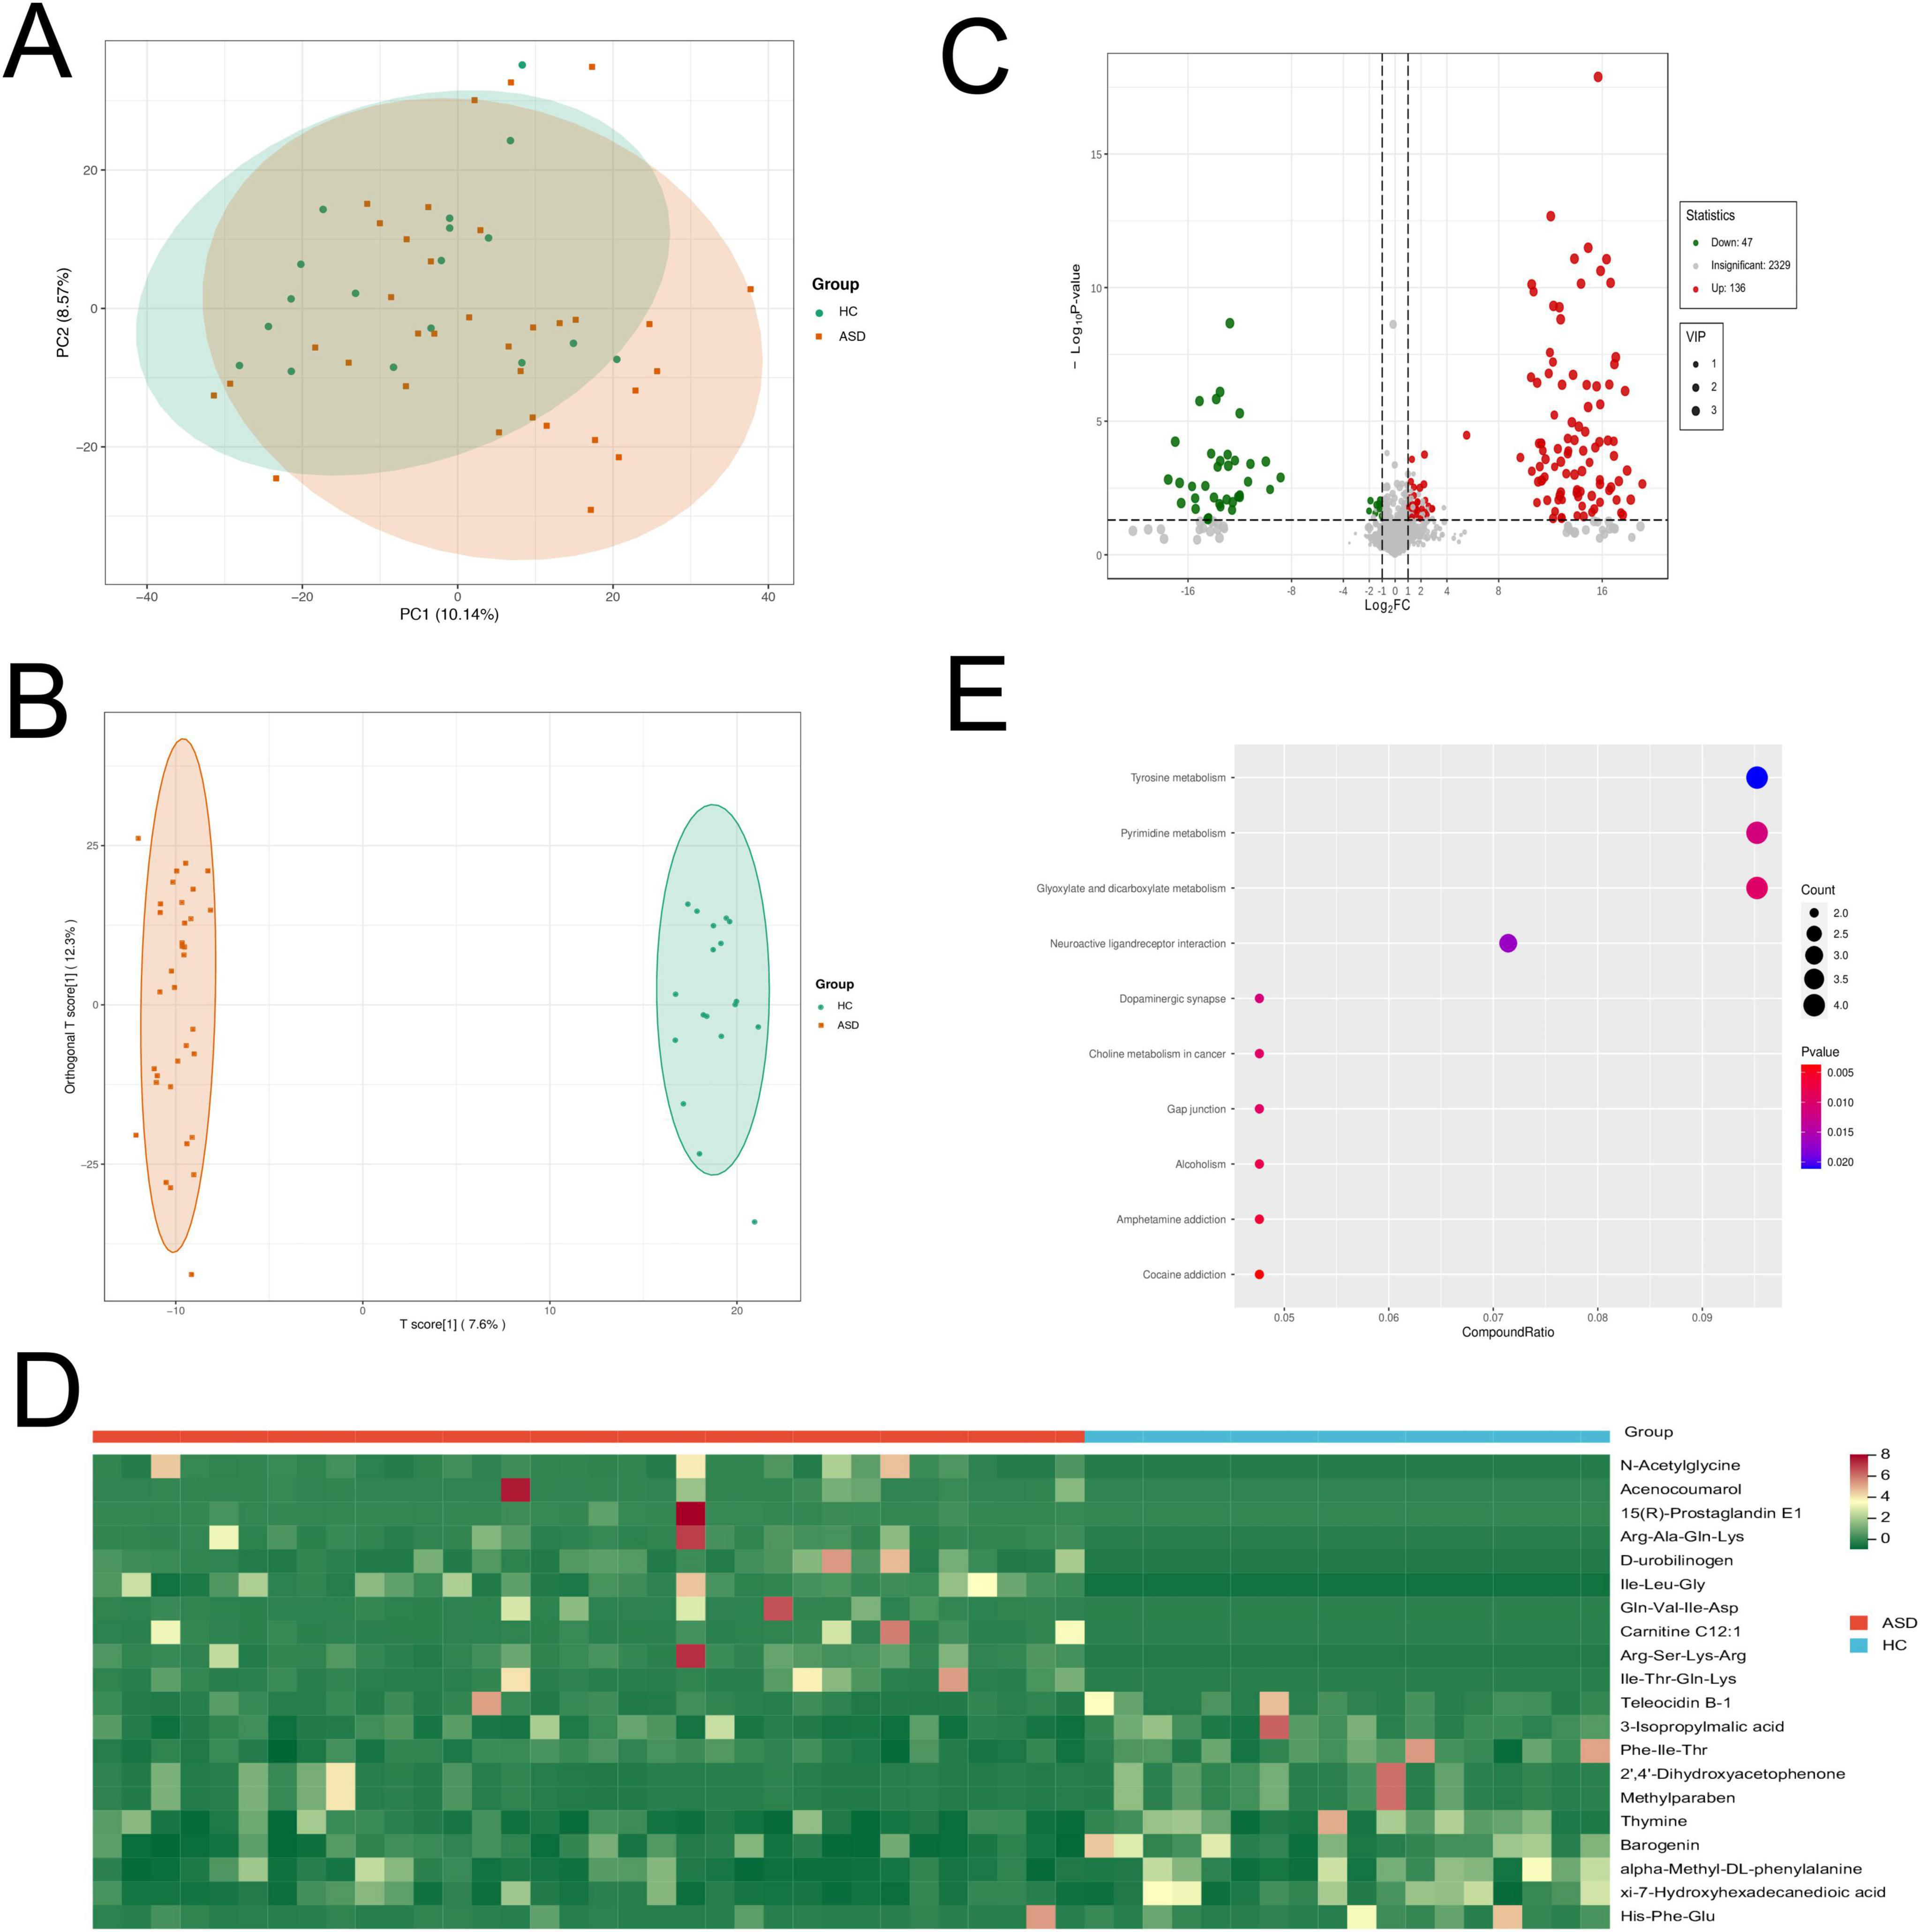
Figure 4. Fecal metabolomics profiles of ASD patients and HC by metabolomics analysis. (A) PCA plot of fecal metabolites in ASD and HC. (B) Score plot of OPLS-DA revealed that the composition of fecal metabolites were significantly different in ASD and HC. (C) Volcano plot showed the number of significantly differential fecal metabolites in ASD compared with HC. (D) Heatmap showed the top 10 up-regulated and 10 down-regulated metabolites in ASD compared to HC. (E) Pathway analysis showed that differential fecal metabolites were enriched in the related pathways.
The analysis of the OPLS-DA model revealed 183 annotated differential metabolites between ASD and HC, with VIP > 1, and p < 0.05. Among these metabolites, there were 136 up-regulated and 47 down-regulated metabolites (absolute |log2FC| > 1, Figure 4C). The differential metabolites mainly contained multiple organic acids, amino acids, hormones and their related metabolites or derivatives (Supplementary Figures S2A,B). The top up-regulated metabolites were N-acetylglycine, acenocoumarol, 15(R)-prostaglandin E1, Arg-Ala-Gln-Lys and D-urobilinogen in ASD patients (Figure 4D). Interestingly, we also found that dopamine was significantly up-regulated in ASD patients compared to HC.
The metabolic pathway enrichment analysis was performed using the KEGG database. The results revealed differential metabolites were significantly enriched in some neural pathways, including neuroactive ligand-receptor interaction and dopaminergic synapse. Other related pathways contained tyrosine metabolism, pyrimidine metabolism and glyoxylate and dicarboxylate metabolism (Figure 4E). These findings suggested a notable transformation in fecal metabolites among individuals with ASD compared to HC, highlighting the potential of metabolic profiling as an effective tool for distinguishing between these two groups.
The correlation analysis between fecal metabolomics changes and gut microbiota composition in ASD patients and healthy controls
In order to explore the possible sources of the fecal metabolites, we analyzed the correlations between fecal metabolites and gut microbiota at the genus level in the comparison of ASD and HC (Figure 5). We found that there was a strong positive correlation between Subdoligranulum, Sutterella, Prevotella_9 and some significantly differential metabolites, including Ile−Leu−Gly, biopterin and 3−hydroxykynurenine. In addition, Akkermansia, Parabacteroides, Bifidobacterium and multiple differential metabolites had significantly negative correlation, including salicylaldehyde, propylparaben, biopterin, 2−amino−4−methylphenol, Met−Ala−Asn, and His−Ser (Figure 5).
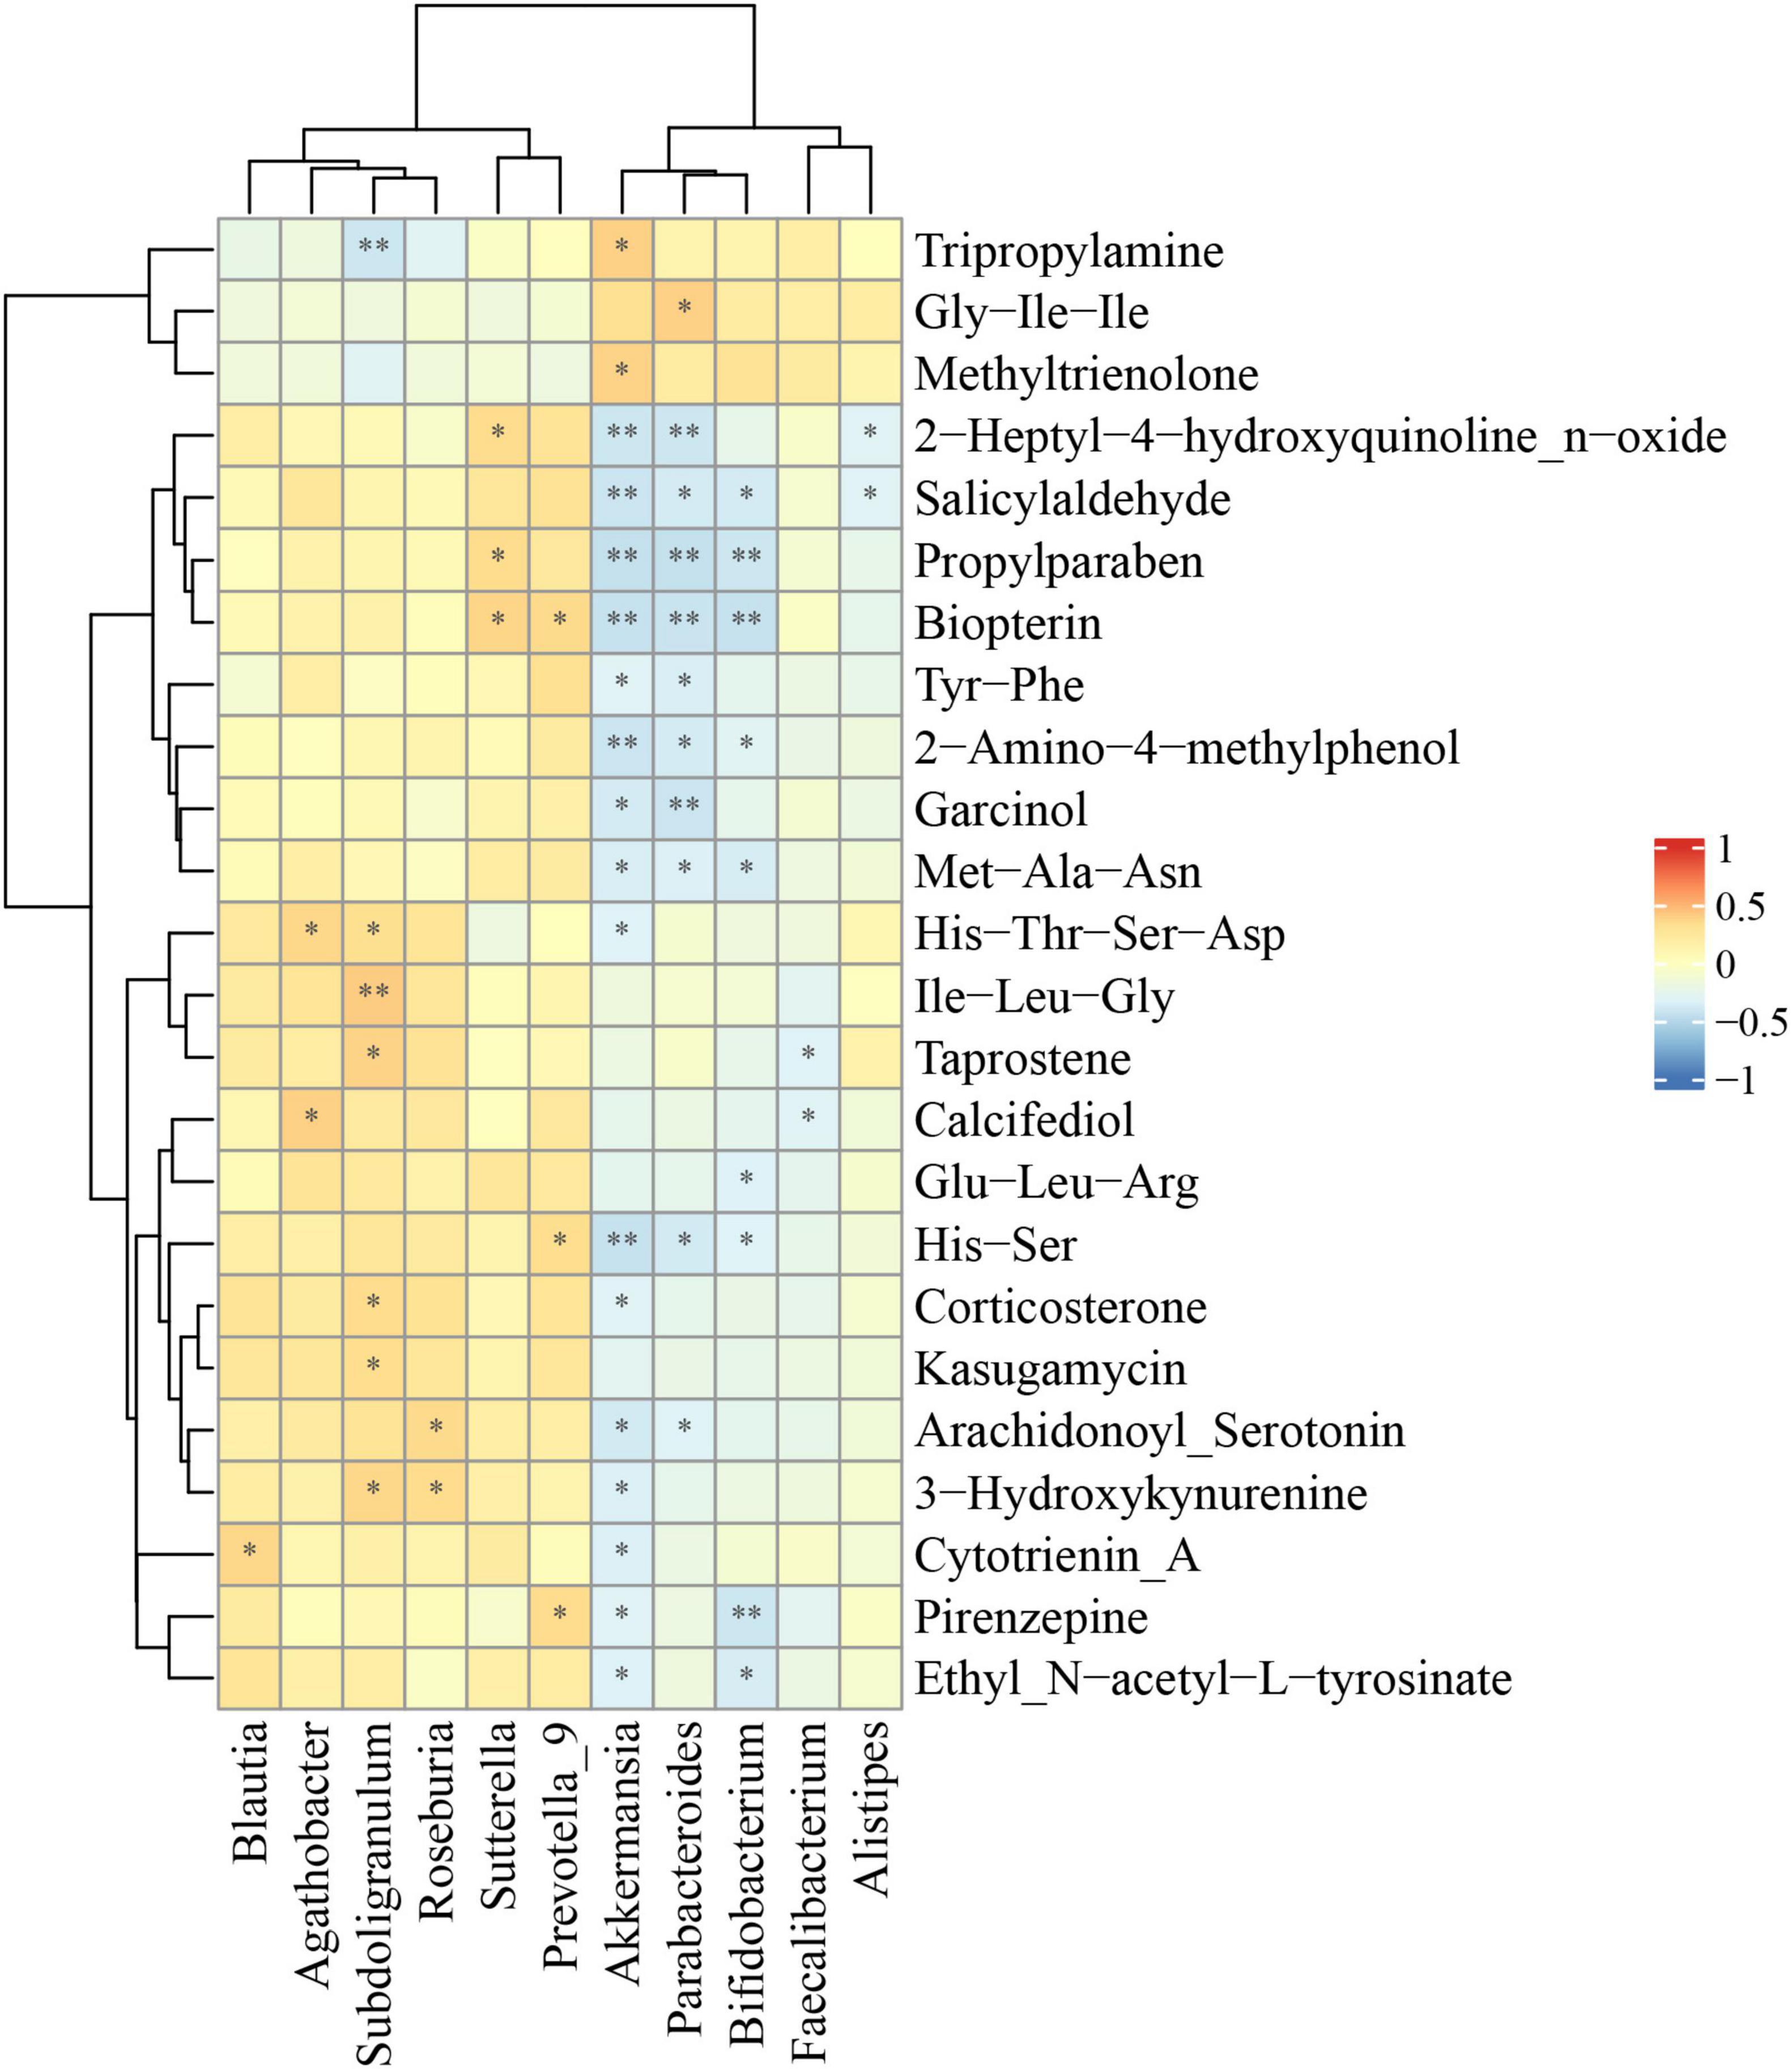
Figure 5. Correlations between relative abundance of gut microbiota and differential fecal metabolites. The Spearman correlation coefficient was analyzed between the gut microbiota at the genus level and differential fecal metabolites in ASD compared to HC. The data was shown via heatmap, red and blue represented positive and negative correlations with different correlated degrees, respectively. *p < 0.05, **p < 0.01.
The correlation analysis between clinical symptoms and gut microbiota composition or fecal metabolomics in ASD patients
Next, we intended to analyze the correlations between the composition of gut microbiota or metabolic products and the severity of clinical symptoms, including ADOS test, ERP recordings, Autism Behavior Checklist (ABC) score and food intolerance in ASD patients (Figure 6). The results showed that there were significant negative correlations between Blautia and delicacy, motion, socializing, adaptability, and speaking (Figure 6A). In metabolic products, pirenzepine was significantly correlated with MMN_Fz and MMN_Cz, while methylamine was significantly correlated with ADOS-imagine and ADOS-communication (Figure 6B).
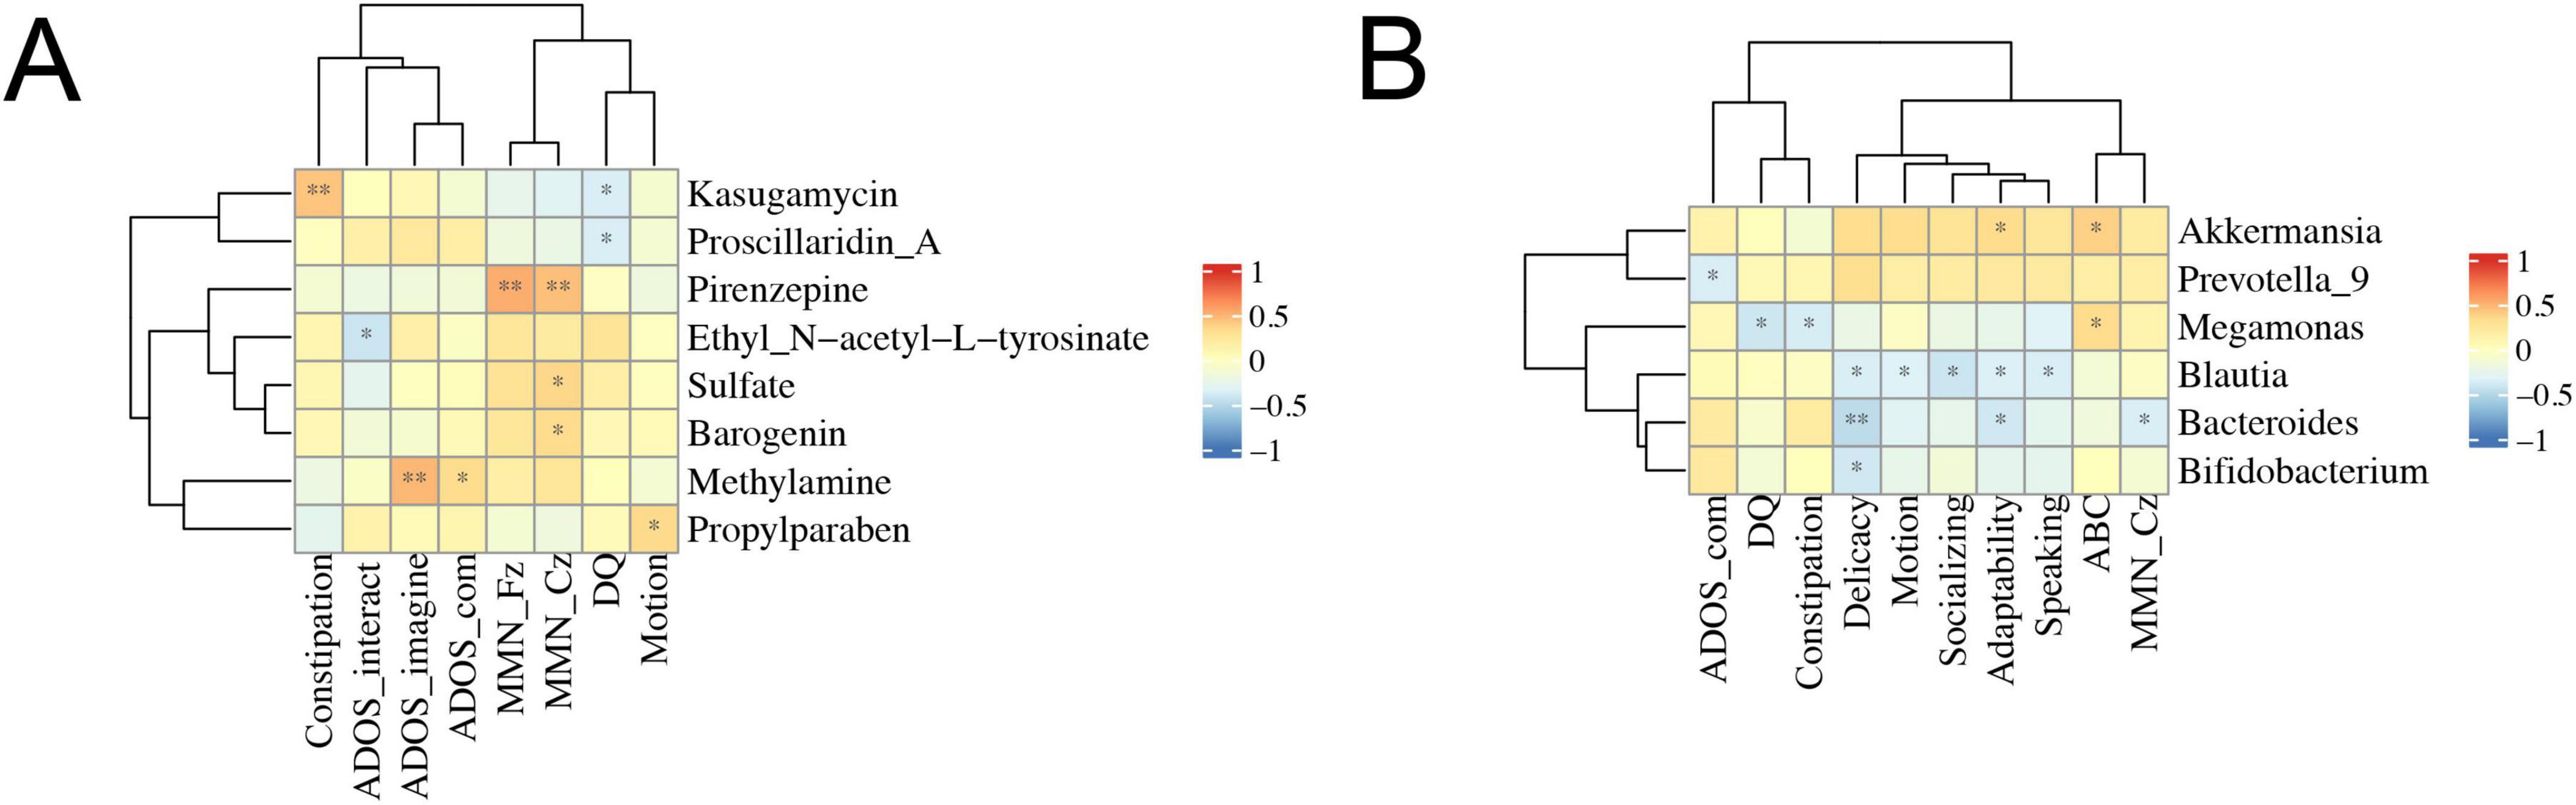
Figure 6. Correlations between clinical symptoms and gut microbiota composition or fecal metabolomics. The Spearman correlation coefficient was analyzed between clinical symptoms and gut microbiota composition (A) or fecal metabolomics (B) in ASD patients. The data was shown via heatmap, red and blue represented positive and negative correlations with different correlated degrees, respectively. *p < 0.05, **p < 0.01; ADOS_com, ADOS_communication; DQ, development quotient.
Discussion
Gut microbiota exerts a significant effect on various human diseases, such as cancer (Chen et al., 2017; Wong and Yu, 2019; Zeng et al., 2017), autoimmune disorders (Aarts et al., 2017; Almonacid et al., 2017), and ASD (Coretti et al., 2018). Notably, emerging research has elucidated the bidirectional communication system known as the “microbiota-gut-brain axis,” which serves as a vital conduit between gut and brain (Cooper, 2018; Mayer et al., 2022; Tache and Saavedra, 2022). More importantly, it has been revealed that gut microbiota possess the ability to modulate metabolite levels, it is advantageous to elucidate the mechanism of gut microbiota affecting ASD through the combined analysis of gut microbiota and their characteristic metabolites. Our investigation revealed discernible disparities in gut microbiota composition between ASD patients and healthy individuals, encompassing distinctive microbiota such as Klebsiella, Escherichia-Shigella, Bacteroides-ovatus, and Clostridium-sporogenes. Klebsiella, a facultative anaerobe, is among the prevalent pathogenic bacteria in the intestinal microbiota and has developed resistance. It is closely associated with intestinal diseases, as studies have detected Klebsiella in the feces of patients with diarrhea, exhibiting a high resistance rate of 97.67% to azithromycin and sulfamethoxazole (Zhang et al., 2018). Furthermore, terizocin induced a rapid proliferation of Klebsiella in the intestine, disrupting the stability of the intestinal microbiota (Kienesberger et al., 2022). Klebsiella could act as a persistent reservoir bacterium by integrating its genes into other bacterial strains to prevent secondary infections and reduce transmission of highly resistant pathogens between and within patients (Osbelt et al., 2021; Sun et al., 2019). Additionally, research indicated that Klebsiella species are linked to primary sclerosing cholangitis (Osbelt et al., 2021). Disruptions in the intestinal microbiota were correlated with an increased proportion of Escherichia-Shigella and elevated levels of tumor necrosis factor alpha (TNF-α) and interleukin 6 (IL-6) in blood (Li et al., 2022). The dysbiosis of the intestinal tract was characterized by a significant expansion of Escherichia-Shigella species, serving as a marker for IgAN patients and potentially offering a promising diagnostic biomarker and therapeutic target for IgAN (Zhao et al., 2022). Bacteroides-ovatus, a Gram-positive bacterium capable of producing spores and causing food poisoning, exhibited growth affected by environmental pH and NaCl (Valero et al., 2020), closely linked to diseases such as colitis in the human intestine (Randazzo et al., 2015). Research indicated that the metabolic products of Bacillus cereus are associated with its ATP-producing oxidation-reduction process, thereby influencing the host’s physiological processes (Liu et al., 2022). Furthermore, studies have demonstrated that introducing the noxA gene can enhance Clostridium-sporogenes oxygen tolerance for potential cancer treatment (Sadr et al., 2024). Considered the next-generation dominant probiotic, Clostridium-sporogenes has the ability to express tumor-specific Thomsen-Friedenreich antigens to prevent cancer occurrence and can be genetically modified for treating intestinal diseases (Hamady et al., 2010; Ulsemer et al., 2013). The growth of Clostridium-sporogenes was influenced by changes in host conditions and dietary sources within the intestinal environment (Fultz et al., 2021), it aided in breaking down cellulose into usable glucose while preferring unsubstituted pectin utilization (Centanni et al., 2020; Li et al., 2023).
More importantly, it has been revealed that gut microbiota possess the ability to modulate metabolite levels, it is advantageous to elucidate the mechanism of gut microbiota affecting ASD through the combined analysis of gut microbiota and their characteristic metabolites. Research also suggested that Clostridium-sporogenes could alter short-chain fatty acid abundance and neurotransmitter levels in the intestine (Horvath et al., 2022). Furthermore, we identified some metabolite markers associated with these divergent microbial taxa in ASD, thereby facilitating a comprehensive understanding of the pathogenesis underlying ASD and its gastrointestinal manifestations. In current study, we found multiple organic acid and its derivatives had differential levels in feces samples of ASD compared to that of HC. Some studies have shown that urine organic acids could be potential biomarkers for ASD in children (Chen et al., 2019), and urinary organic acids could be used as biomarkers for alterations of gut microbiota in children with ASD (Daneberga et al., 2022; Khan et al., 2022). In a urine metabolite analysis of individuals with ASD in South Africa, it was observed that the concentrations of 3-hydroxy-3-methylglutaric acid, 3-methyglutaconic acid, and ethylmalonic acid were elevated in the ASD cohort (Stathopoulos et al., 2020). In addition, a lot of amino acids and its metabolites showed significant differences between ASD and HC. Similarly, several studies have found that fecal amino acids were abnormally metabolized in ASD compared with corresponding controls (Needham et al., 2021; Zhu et al., 2022). Moreover, amino acids played a crucial role in ASD, and several studies have indicated that the amino acid expression profile in individuals with ASD differed from that of neurotypical individuals (Anastasescu et al., 2024; Liu et al., 2019; van Sadelhoff et al., 2019). Recent study has proposed that fecal amino acids could be potential targets for designing personalized diets to prevent or minimize cognitive impairments associated with ASD (Chamtouri et al., 2023). Research has indicated that individuals with ASD exhibited decreased levels of tryptophan, phenylalanine, and tyrosine in their physiological composition (Randazzo et al., 2023). Furthermore, the interplay between amino acids and urinary organic acids might impact the occurrence of electroencephalographic spike abnormalities in the brains of individuals with ASD (Marcotul Li et al., 2022). Interestingly, we also found the level of dopamine was significantly different in ASD and HC. As we all known, the alterations of dopamine signal have been implied in ASD, and they could be associated with the risk of developing a psychotic disorder in ASD patients (Schalbroeck et al., 2021). Dysregulation of dopamine was prevalent in individuals with ASD, and research indicated an association between the dopamine-3 receptor gene (DRD3) and specific repetitive behaviors observed in individuals with ASD (Kosillo and Bateup, 2021; Staal et al., 2012). More importantly, blocking postsynaptic dopamine and serotonin receptors might be beneficial in children with ASD (McCracken et al., 2002).
In conclusion, the investigation into the disparities in gut microbiota between ASD and HC highlights the prominent microbiota and their metabolites, further elucidates the mechanisms underlying the impact of gut microbiota on ASD, and presents potential targets for therapeutic interventions in ASD patients.
Data availability statement
The genomic data of microbiota presented in the study are deposited in the SRA repository, accession number PRJNA1222609 and the metabolomics data are deposited in MetaboLights repository, accession number MTBLS12220.
Ethics statement
The studies involving humans were approved by Ethical Committee of the Fifth Affiliated Hospital of Zhengzhou University (No.2016-1001). The studies were conducted in accordance with the local legislation and institutional requirements. The participants provided their written informed consent to participate in this study.
Author contributions
RZ: Writing – original draft, Conceptualization, Data curation, Methodology. SH: Writing – original draft, Software, Visualization. PF: Writing – review & editing, Formal Analysis. SL: Writing – review & editing, Investigation. MJ: Writing – review & editing, Validation. HL: Writing – review & editing, Resources. PZ: Writing – review & editing, Supervision. YM: Writing – review & editing, Supervision. EL: Writing – review & editing, Funding acquisition, Project administration, Supervision.
Funding
The author(s) declare that financial support was received for the research and/or publication of this article. This work was financially supported by the Tianjian Advanced Biomedical Laboratory Key Research and Development Project, the Natural Science Foundation of Henan Province (Nos. 242300421283 and 232300420235), the Key Research and Development and Promotion Special Projects of Henan Province (Nos. 232102311068 and 242102311189), and the Henan Provincial Medical Science and Technology Research Joint Venture Project (No. SBGJ202403038).
Conflict of interest
The authors declare that the research was conducted in the absence of any commercial or financial relationships that could be construed as a potential conflict of interest.
Generative AI statement
The authors declare that no Generative AI was used in the creation of this manuscript.
Publisher’s note
All claims expressed in this article are solely those of the authors and do not necessarily represent those of their affiliated organizations, or those of the publisher, the editors and the reviewers. Any product that may be evaluated in this article, or claim that may be made by its manufacturer, is not guaranteed or endorsed by the publisher.
Supplementary material
The Supplementary Material for this article can be found online at: https://www.frontiersin.org/articles/10.3389/fmicb.2025.1557174/full#supplementary-material
Footnotes
- ^ https://fbreitwieser.shinyapps.io/pavian/
- ^ http://www.hmdb.ca/
- ^ http://www.kegg.jp/kegg/compound/
- ^ http://www.kegg.jp/kegg/pathway.html
- ^ www.r-project.org
References
Aarts, E., Ederveen, T. H. A., Naaijen, J., Zwiers, M. P., Boekhorst, J., Timmerman, H. M., et al. (2017). Gut microbiome in ADHD and its relation to neural reward anticipation. PLoS One 12:e0183509. doi: 10.1371/journal.pone.0183509
Almonacid, D. E., Kraal, L., Ossandon, F. J., Budovskaya, Y. V., Cardenas, J. P., Bik, E. M., et al. (2017). 16S rRNA gene sequencing and healthy reference ranges for 28 clinically relevant microbial taxa from the human gut microbiome. PLoS One 12:e0176555. doi: 10.1371/journal.pone.0176555
Anastasescu, C. M., Gheorman, V., Popescu, F., Stepan, M. D., Stoicănescu, E. C., Gheorman, V., et al. (2024). A clinical study of urine amino acids in children with autism spectrum disorder. Life (Basel) 14:629. doi: 10.3390/life14050629
Bai, J., Cai, Y., Huang, Z., Gu, Y., Huang, N., Sun, R., et al. (2022). Shouhui Tongbian Capsule ameliorates constipation via gut microbiota-5-HT-intestinal motility axis. Biomed. Pharmacother. 154:113627. doi: 10.1016/j.biopha.2022.113627
Bauman, M. L. (2010). Medical comorbidities in autism: Challenges to diagnosis and treatment. Neurotherapeutics 7, 320–327. doi: 10.1016/j.nurt.2010.06.001
Bramer, G. R. (1988). International statistical classification of diseases and related health problems. Tenth revision. World Health Stat. Q. 41, 32–36.
Bresnahan, M., Hornig, M., Schultz, A. F., Gunnes, N., Hirtz, D., Lie, K. K., et al. (2015). Association of maternal report of infant and toddler gastrointestinal symptoms with autism: Evidence from a prospective birth cohort. JAMA Psychiatry 72, 466–474. doi: 10.1001/jamapsychiatry.2014.3034
Centanni, M., Bell, T. J., Sims, I. M., and Tannock, G. W. (2020). Preferential use of plant glycans for growth by Bacteroides ovatus. Anaerobe 66:102276. doi: 10.1016/j.anaerobe.2020.102276
Cermak, S. A., Curtin, C., and Bandini, L. G. (2010). Food selectivity and sensory sensitivity in children with autism spectrum disorders. J. Am. Diet. Assoc. 110, 238–246. doi: 10.1016/j.jada.2009.10.032
Chamtouri, M., Merghni, A., Salazar, N., Redruello, B., Gaddour, N., Mastouri, M., et al. (2023). An overview on fecal profiles of amino acids and related amino-derived compounds in children with autism spectrum disorder in Tunisia. Molecules 28:3269. doi: 10.3390/molecules28073269
Chandana, S. R., Behen, M. E., Juhasz, C., Muzik, O., Rothermel, R. D., Mangner, T. J., et al. (2005). Significance of abnormalities in developmental trajectory and asymmetry of cortical serotonin synthesis in autism. Int. J. Dev. Neurosci. 23, 171–182. doi: 10.1016/j.ijdevneu.2004.08.002
Chen, J., Pitmon, E., and Wang, K. (2017). Microbiome, inflammation and colorectal cancer. Semin. Immunol. 32, 43–53. doi: 10.1016/j.smim.2017.09.006
Chen, Q., Qiao, Y., Xu, X. J., You, X., and Tao, Y. (2019). Urine organic acids as potential biomarkers for autism-spectrum disorder in Chinese children. Front. Cell. Neurosci. 13:150. doi: 10.3389/fncel.2019.00150
Cooper, A. (2018). Understanding the gut–brain axis. Lancet Gastroenterol. Hepatol. 3, 824. doi: 10.1016/s2468-1253(18)30348-0
Coretti, L., Paparo, L., Riccio, M. P., Amato, F., Cuomo, M., Natale, A., et al. (2018). Gut microbiota features in young children with autism spectrum disorders. Front. Microbiol. 9:3146. doi: 10.3389/fmicb.2018.03146
Daneberga, Z., Nakazawa-Miklasevica, M., Berga-Svitina, E., Murmane, D., Isarova, D., Cupane, L., et al. (2022). Urinary organic acids spectra in children with altered gut microbiota composition and autistic spectrum disorder. Nordic J. Psychiatry 76, 523–529. doi: 10.1080/08039488.2021.2014954
First, M. B. (2013). Diagnostic and statistical manual of mental disorders, 5th edition, and clinical utility. J. Nerv. Ment. Dis. 201, 727–729. doi: 10.1097/NMD.0b013e3182a2168a
Fultz, R., Ticer, T., Ihekweazu, F. D., Horvath, T. D., Haidacher, S. J., Hoch, K. M., et al. (2021). Unraveling the Metabolic requirements of the gut commensal Bacteroides ovatus. Front. Microbiol. 12:745469. doi: 10.3389/fmicb.2021.745469
Gershon, M. D. (1999). Review article: roles played by 5-hydroxytryptamine in the physiology of the bowel. Alimentary Pharmacol. Therapeutics 13, 15–30.
Hamady, Z. Z., Scott, N., Farrar, M. D., Lodge, J. P., Holland, K. T., Whitehead, T., et al. (2010). Xylan-regulated delivery of human keratinocyte growth factor-2 to the inflamed colon by the human anaerobic commensal bacterium Bacteroides ovatus. Gut 59, 461–469. doi: 10.1136/gut.2008.176131
Hata, T., Asano, Y., Yoshihara, K., Kimura-Todani, T., Miyata, N., Zhang, X. T., et al. (2017). Regulation of gut luminal serotonin by commensal microbiota in mice. PLoS One 12:e0180745. doi: 10.1371/journal.pone.0180745
Horvath, T. D., Ihekweazu, F. D., Haidacher, S. J., Ruan, W., Engevik, K. A., Fultz, R., et al. (2022). Bacteroides ovatus colonization influences the abundance of intestinal short chain fatty acids and neurotransmitters. iScience 25:104158. doi: 10.1016/j.isci.2022.104158
Jiang, C., Li, G., Huang, P., Liu, Z., and Zhao, B. (2017). The gut microbiota and Alzheimer’s disease. J. Alzheimers Dis 58, 1–15. doi: 10.3233/JAD-161141
Khan, Z. U. N., Chand, P., Majid, H., Ahmed, S., Khan, A. H., Jamil, A., et al. (2022). Urinary metabolomics using gas chromatography-mass spectrometry: Potential biomarkers for autism spectrum disorder. BMC Neurol. 22:101. doi: 10.1186/s12883-022-02630-4
Kienesberger, S., Cosic, A., Kitsera, M., Raffl, S., Hiesinger, M., Leitner, E., et al. (2022). Enterotoxin tilimycin from gut-resident Klebsiella promotes mutational evolution and antibiotic resistance in mice. Nat. Microbiol. 7, 1834–1848. doi: 10.1038/s41564-022-01260-3
Kosillo, P., and Bateup, H. S. (2021). Dopaminergic dysregulation in syndromic autism spectrum disorders: Insights from genetic mouse models. Front. Neural Circuits 15:700968. doi: 10.3389/fncir.2021.700968
Lagod, P. P., and Naser, S. A. (2023). The role of short-chain fatty acids and altered microbiota composition in autism spectrum disorder: A comprehensive literature review. Int. J. Mol. Sci. 24:17432. doi: 10.3390/ijms242417432
Leader, G., Abberton, C., Cunningham, S., Gilmartin, K., Grudzien, M., Higgins, E., et al. (2022). Gastrointestinal symptoms in autism spectrum disorder: A systematic review. Nutrients 14:1471. doi: 10.3390/nu14071471
Li, M., Wang, Y., Guo, C., Wang, S., Zheng, L., Bu, Y., et al. (2023). The claim of primacy of human gut Bacteroides ovatus in dietary cellobiose degradation. Gut Microbes 15:2227434. doi: 10.1080/19490976.2023.2227434
Li, S., Guo, J., Liu, R., Zhang, F., Wen, S., Liu, Y., et al. (2022). Predominance of Escherichia-Shigella in gut microbiome and its potential correlation with elevated level of plasma tumor necrosis factor alpha in patients with tuberculous meningitis. Microbiol. Spectr. 10:e0192622. doi: 10.1128/spectrum.01926-22
Liu, A., Zhou, W., Qu, L., He, F., Wang, H., Wang, Y., et al. (2019). Altered urinary amino acids in children with autism spectrum disorders. Front. Cell. Neurosci. 13:7. doi: 10.3389/fncel.2019.00007
Liu, Y., Chen, H., Van Treuren, W., Hou, B. H., Higginbottom, S. K., and Dodd, D. (2022). Clostridium sporogenes uses reductive Stickland metabolism in the gut to generate ATP and produce circulating metabolites. Nat. Microbiol. 7, 695–706. doi: 10.1038/s41564-022-01109-9
Lou, M., Cao, A., Jin, C., Mi, K., Xiong, X., Zeng, Z., et al. (2022). Deviated and early unsustainable stunted development of gut microbiota in children with autism spectrum disorder. Gut 71, 1588–1599. doi: 10.1136/gutjnl-2021-325115
Marcotulli, D., Davico, C., Somà, A., Teghille, G., Ravaglia, G., Amianto, F., et al. (2022). Association between EEG paroxysmal abnormalities and levels of plasma amino acids and urinary organic acids in children with autism spectrum disorder. Children (Basel) 9:540. doi: 10.3390/children9040540
Mayer, E. A., Nance, K., and Chen, S. (2022). The gut-brain axis. Annu. Rev. Med. 73, 439–453. doi: 10.1146/annurev-med-042320-014032
McCracken, J. T., McGough, J., Shah, B., Cronin, P., Hong, D., Aman, M. G., et al. (2002). Risperidone in children with autism and serious behavioral problems. N. Engl. J. Med. 347, 314–321. doi: 10.1056/NEJMoa013171
Needham, B. D., Adame, M. D., Serena, G., Rose, D. R., Preston, G. M., Conrad, M. C., et al. (2021). Plasma and fecal metabolite profiles in autism spectrum disorder. Biol. Psychiatry 89, 451–462. doi: 10.1016/j.biopsych.2020.09.025
Nygaard, A. B., Tunsjo, H. S., Meisal, R., and Charnock, C. (2020). A preliminary study on the potential of Nanopore MinION and Illumina MiSeq 16S rRNA gene sequencing to characterize building-dust microbiomes. Sci. Rep. 10:3209. doi: 10.1038/s41598-020-59771-0
Okada, T., and Ozaki, N. (2015). What is the nature of the autism ‘spectrum’? Psychiatry Clin. Neurosci. 69, 129–130. doi: 10.1111/pcn.12276
Osbelt, L., Wende, M., Almási, É, Derksen, E., Muthukumarasamy, U., Lesker, T. R., et al. (2021). Klebsiella oxytoca causes colonization resistance against multidrug-resistant K. pneumoniae in the gut via cooperative carbohydrate competition. Cell. Host. Microbe 29, 1663–1679.e1667. doi: 10.1016/j.chom.2021.09.003
Randazzo, A., Kornreich, A., and Lissoir, B. A. (2015). Clostridium hathewayi isolate in blood culture of a patient with an acute appendicitis. Anaerobe 35, 44–47. doi: 10.1016/j.anaerobe.2015.07.003
Randazzo, M., Prato, A., Messina, M., Meli, C., Casabona, A., Rizzo, R., et al. (2023). Neuroactive amino acid profile in autism spectrum disorder: Results from a clinical sample. Children (Basel) 10:412. doi: 10.3390/children10020412
Sadr, S., Zargar, B., Perez, J., Aucoin, M. G., and Ingalls, B. (2024). Heterologous expression of NoxA confers aerotolerance in Clostridium sporogenes. Biotechnol. J. 19:e2300161. doi: 10.1002/biot.202300161
Schalbroeck, R., van Velden, F. H. P., de Geus-Oei, L. F., Yaqub, M., van Amelsvoort, T., Booij, J., et al. (2021). Striatal dopamine synthesis capacity in autism spectrum disorder and its relation with social defeat: an [(18)F]-FDOPA PET/CT study. Transl. Psychiatry 11:47. doi: 10.1038/s41398-020-01174-w
Sharon, G., Cruz, N. J., Kang, D. W., Gandal, M. J., Wang, B., Kim, Y. M., et al. (2019). Human gut microbiota from autism spectrum disorder promote behavioral symptoms in mice. Cell 177, 1600–1618 e1617. doi: 10.1016/j.cell.2019.05.004
Shaw, K., Maenner, M., Bakian, A., Bilder, D., Durkin, M., and Furnier, S. (2021). Early identification of autism spectrum disorder among children aged 4 years - autism and developmental disabilities monitoring network, 11 Sites, United States, 2018. MMWR Survelli Summ. 70, 1–14. doi: 10.15585/mmwr.ss7010a1
Soriano, S., Curry, K., Sadrameli, S. S., Wang, Q., Nute, M., Reeves, E., et al. (2022). Alterations to the gut microbiome after sport-related concussion in a collegiate football players cohort: A pilot study. Brain Behav. Immun. Health 21:100438. doi: 10.1016/j.bbih.2022.100438
Srivastava, S., Singh, A., Sandeep, K., and Yadav, D. (2021). Epigenetic regulation of gut microbial dysbiosis. Indian J. Microbiol. 61, 125–129. doi: 10.1007/s12088-021-00920-y
Staal, W. G., de Krom, M., and de Jonge, M. V. (2012). Brief report: The dopamine-3-receptor gene (DRD3) is associated with specific repetitive behavior in autism spectrum disorder (ASD). J. Autism. Dev. Disord. 42, 885–888. doi: 10.1007/s10803-011-1312-z
Stathopoulos, S., Gaujoux, R., Lindeque, Z., Mahony, C., Van Der Colff, R., Van Der Westhuizen, F., et al. (2020). DNA methylation associated with mitochondrial dysfunction in a South African autism spectrum disorder cohort. Autism Res. 13, 1079–1093. doi: 10.1002/aur.2310
Su, Q., Wong, O. W. H., Lu, W., Wan, Y., Zhang, L., Xu, W., et al. (2024). Multikingdom and functional gut microbiota markers for autism spectrum disorder. Nat. Microbiol. 9, 2344–2355. doi: 10.1038/s41564-024-01739-1
Sun, Q. L., Gu, D., Wang, Q., Hu, Y., Shu, L., Hu, J., et al. (2019). Dynamic colonization of Klebsiella pneumoniae isolates in gastrointestinal tract of intensive care patients. Front. Microbiol. 10:230. doi: 10.3389/fmicb.2019.00230
Tache, Y., and Saavedra, J. M. (2022). Introduction to the special issue “the brain-gut axis”. Cell Mol. Neurobiol. 42, 311–313. doi: 10.1007/s10571-021-01155-7
Taniya, M. A., Chung, H. J., Al Mamun, A., Alam, S., Aziz, M. A., Emon, N. U., et al. (2022). Role of gut microbiome in autism spectrum disorder and its therapeutic regulation. Front. Cell. Infect. Microbiol. 12:915701. doi: 10.3389/fcimb.2022.915701
Tonacci, A., Bagnato, G., Pandolfo, G., Billeci, L., Sansone, F., Conte, R., et al. (2019). MicroRNA cross-involvement in autism spectrum disorders and atopic dermatitis: A literature review. J. Clin. Med. 8:88. doi: 10.3390/jcm8010088
Ulsemer, P., Henderson, G., Toutounian, K., Löffler, A., Schmidt, J., Karsten, U., et al. (2013). Specific humoral immune response to the Thomsen-Friedenreich tumor antigen (CD176) in mice after vaccination with the commensal bacterium Bacteroides ovatus D-6. Cancer Immunol. Immunother. 62, 875–887. doi: 10.1007/s00262-013-1394-x
Valentino, F., Bruno, L. P., Doddato, G., Giliberti, A., Tita, R., Resciniti, S., et al. (2021). Exome sequencing in 200 intellectual disability/autistic patients: New candidates and atypical presentations. Brain Sci. 11:936. doi: 10.3390/brainsci11070936
Valero, A., Olague, E., Medina-Pradas, E., Garrido-Fernández, A., Romero-Gil, V., Cantalejo, M. J., et al. (2020). Influence of acid adaptation on the probability of germination of clostridium sporogenes spores against pH, NaCl and time. Foods 9:127. doi: 10.3390/foods9020127
van Sadelhoff, J. H. J., Perez Pardo, P., Wu, J., Garssen, J., van Bergenhenegouwen, J., Hogenkamp, A., et al. (2019). The gut-immune-brain axis in autism spectrum disorders; A focus on amino acids. Front. Endocrinol. 10:247. doi: 10.3389/fendo.2019.00247
Wong, S. H., and Yu, J. (2019). Gut microbiota in colorectal cancer: Mechanisms of action and clinical applications. Nat. Rev. Gastroenterol. Hepatol. 16, 690–704. doi: 10.1038/s41575-019-0209-8
Wood, D. E., Lu, J., and Langmead, B. (2019). Improved metagenomic analysis with Kraken 2. Genome Biol. 20:257. doi: 10.1186/s13059-019-1891-0
Yadav, S., Dwivedi, A., Tripathi, A., and Tripathi, A. K. (2022). Therapeutic potential of short-chain fatty acid production by gut microbiota in neurodegenerative disorders. Nutr. Res. 106, 72–84. doi: 10.1016/j.nutres.2022.07.007
Yano, J. M., Yu, K., Donaldson, G. P., Shastri, G. G., Ann, P., Ma, L., et al. (2015). Indigenous bacteria from the gut microbiota regulate host serotonin biosynthesis. Cell 161, 264–276. doi: 10.1016/j.cell.2015.02.047
Zeng, M. Y., Inohara, N., and Nunez, G. (2017). Mechanisms of inflammation-driven bacterial dysbiosis in the gut. Mucosal Immunol. 10, 18–26. doi: 10.1038/mi.2016.75
Zhang, X., Wang, L., Li, R., Hou, P., Zhang, Y., Fang, M., et al. (2018). Presence and characterization of Klebsiella pneumoniae from the intestinal tract of diarrhoea patients. Lett. Appl. Microbiol. 66, 514–522. doi: 10.1111/lam.12877
Zhao, J., Bai, M., Ning, X., Qin, Y., Wang, Y., Yu, Z., et al. (2022). Expansion of Escherichia-Shigella in gut is associated with the onset and response to immunosuppressive therapy of IGA nephropathy. J. Am. Soc. Nephrol. 33, 2276–2292. doi: 10.1681/asn.2022020189
Zhao, Y., Wang, Y., Meng, F., Chen, X., Chang, T., Huang, H., et al. (2023). Altered gut microbiota as potential biomarkers for autism spectrum disorder in early childhood. Neuroscience 523, 118–131. doi: 10.1016/j.neuroscience.2023.04.029
Keywords: autism spectrum disorder, gut microbiota, 16S rRNA sequencing, metabolomics, biomarker
Citation: Zheng R, Huang S, Feng P, Liu S, Jiang M, Li H, Zheng P, Mi Y and Li E (2025) Comprehensive analysis of gut microbiota and fecal metabolites in patients with autism spectrum disorder. Front. Microbiol. 16:1557174. doi: 10.3389/fmicb.2025.1557174
Received: 09 January 2025; Accepted: 17 February 2025;
Published: 25 April 2025.
Edited by:
Huan Li, Lanzhou University, ChinaReviewed by:
Zhu Wanlong, Yunnan Normal University, ChinaYue Ren, Shanxi Agricultural University, China
Yansu Wang, University of Electronic Science and Technology of China, China
Copyright © 2025 Zheng, Huang, Feng, Liu, Jiang, Li, Zheng, Mi and Li. This is an open-access article distributed under the terms of the Creative Commons Attribution License (CC BY). The use, distribution or reproduction in other forums is permitted, provided the original author(s) and the copyright owner(s) are credited and that the original publication in this journal is cited, in accordance with accepted academic practice. No use, distribution or reproduction is permitted which does not comply with these terms.
*Correspondence: Pengyuan Zheng, cHl6aGVuZ0B6enUuZWR1LmNu; Yang Mi, eWFuZ21pMTk4QHp6dS5lZHUuY24=; Enyao Li, MTM1MjY2NzY2NzZAMTI2LmNvbQ==