Abstract
Purpose:
Tuberculosis (TB) remains a significant global health concern, necessitating effective measures to control the epidemic. Understanding the evolution of Mycobacterium tuberculosis (M. tb) through molecular clock analysis is crucial for tracing outbreaks, managing transmission, and ultimately improving TB management in practice.
Results:
A total of 27 studies were included for analysis. The pooled mutation rate was estimated at 0.63 single nucleotide polymorphisms (SNPs) per genome per year [95% confidence interval (CI): 0.51–0.75; 95% predictive interval (PI): 0.04–1.22], significant heterogeneity (I2 = 92.7%, p < 0.001) was observed. Clinical strains had a mutation rate of 0.55 SNPs per year (95% CI: 0.45–0.65; 95% PI: 0.12–0.98), while model strains showed a higher rate of 1.14 SNPs per year (95% CI: 0.68–1.60; 95% PI: −0.22-2.50; Meta-regression analysis, p = 0.006). Mutation rates did not significantly differ between transmission events and reactivation or single episodes (p = 0.497).
Conclusion:
The mutation rate of clinical M. tb strains is below 1 SNP per genome per year, indicating evolutionary stability in clinical settings. This finding is important for TB outbreak reconstructions and public health strategies. Future research should refine subgroup analyses based on infection characteristics for more precise molecular clock estimates.
Systematic review registration:
PROSPERO, identifier CRD42024595161.
Introduction
Tuberculosis (TB) remains a major global health concern, with 10.6 million new cases and 1.3 million deaths reported by the WHO in 2022. Molecular clock analysis, which could examine the genetic evolution of Mycobacterium tuberculosis (M. tb), is critical for understanding TB outbreaks and the emergence of drug-resistant strains. This method estimates the timing of evolutionary events by assuming mutations accumulate at a relatively constant rate. However, determining M. tb’s precise molecular clock rate remains a challenge, with estimates ranging from 0.13 to over 6 single nucleotide polymorphisms (SNPs) per genome per year, varying across epidemiological contexts (Colangeli et al., 2014; Copin et al., 2016). Factors such as lineage type, immune pressure, and antibiotic exposure may influence its variability. Embracing this variability through a meta-analysis of clinical data can improve both replicability and generalizability in biomedical research (Usui et al., 2021). In this context, this systematic review aims to gather and synthesize existing evidence to generate a pooled estimate of the molecular clock rate for M. tb, providing more reliable insights into its evolutionary dynamics. Such consistent estimate will aid in constructing accurate epidemiological links and support more effective interventions during TB outbreaks.
Methods
This systematic review and meta-analysis followed a registered protocol in PROSPERO (CRD42024595161) and adhered to PRISMA guidelines to ensure thorough methodology (Page et al., 2021). The aim was to estimate mutation rates in M. tb and assess contributing factors to its variability.
A comprehensive literature search of PubMed, Scopus, Web of Science, and Embase was conducted as of August 16, 2024, using keywords related to, but not limited to: M. tb and mutation rates (Supplementary material, p. 1). Literature selection, data extraction, and quality assessment were independently conducted by two authors (CYL and GCP), with a third author (WJL) consulted for disagreements. Studies were eligible if they (1) directly reported mutation rates, and (2) included mutants or SNPs identified during a specified period. Exclusion criteria included reviews, conference meeting, editorials, or studies lacking sufficient quantitative data; non-English literature; duplicate studies; replicated datasets, and those relying solely on database-derived information or involving drug-resistance mutations. Additionally, Indel and other structural variants were excluded and not included for analysis.
The quality of included studies was assessed using the AXIS tool, considering elements such as sample size justification, methodology, and result reporting (Downes et al., 2016). No studies were excluded based on quality, as there are no established quantitative thresholds for such exclusions.
Pooled mutation rates were estimated using a random-effects model with 95% confidence intervals (CI) and predictive intervals (PI), employing the metan command in Stata/SE (v18.0). Heterogeneity was quantified using the I2 statistic and the Chi-square test, with I2 > 75% or p < 0.05 indicating significant heterogeneity. Subgroup analyses assessed variation in mutation rates by model versus clinical strains and transmission versus “reactivation or single infection episode,” and sources of heterogeneity were assessed using Meta-regression analysis. Publication bias was not evaluated, as established methods for assessing bias in single-arm meta-analyses may be unreliable (Hunter et al., 2014).
Results
Literature selection
Overall, 31,750 citations were identified through database searches. After removing duplicates (n = 10,721) and other unsuitable articles (n = 3,188), including inappropriate document types (n = 3,188) and non-English publications (n = 1,215), 16,626 records were screened by title and abstract for eligibility. Of these, 16,501 were excluded, leaving 125 citations identified as relevant or potentially relevant for full-text screening. Following further exclusions (n = 97), 27 studies were included in the final analysis (Figure 1).
Figure 1
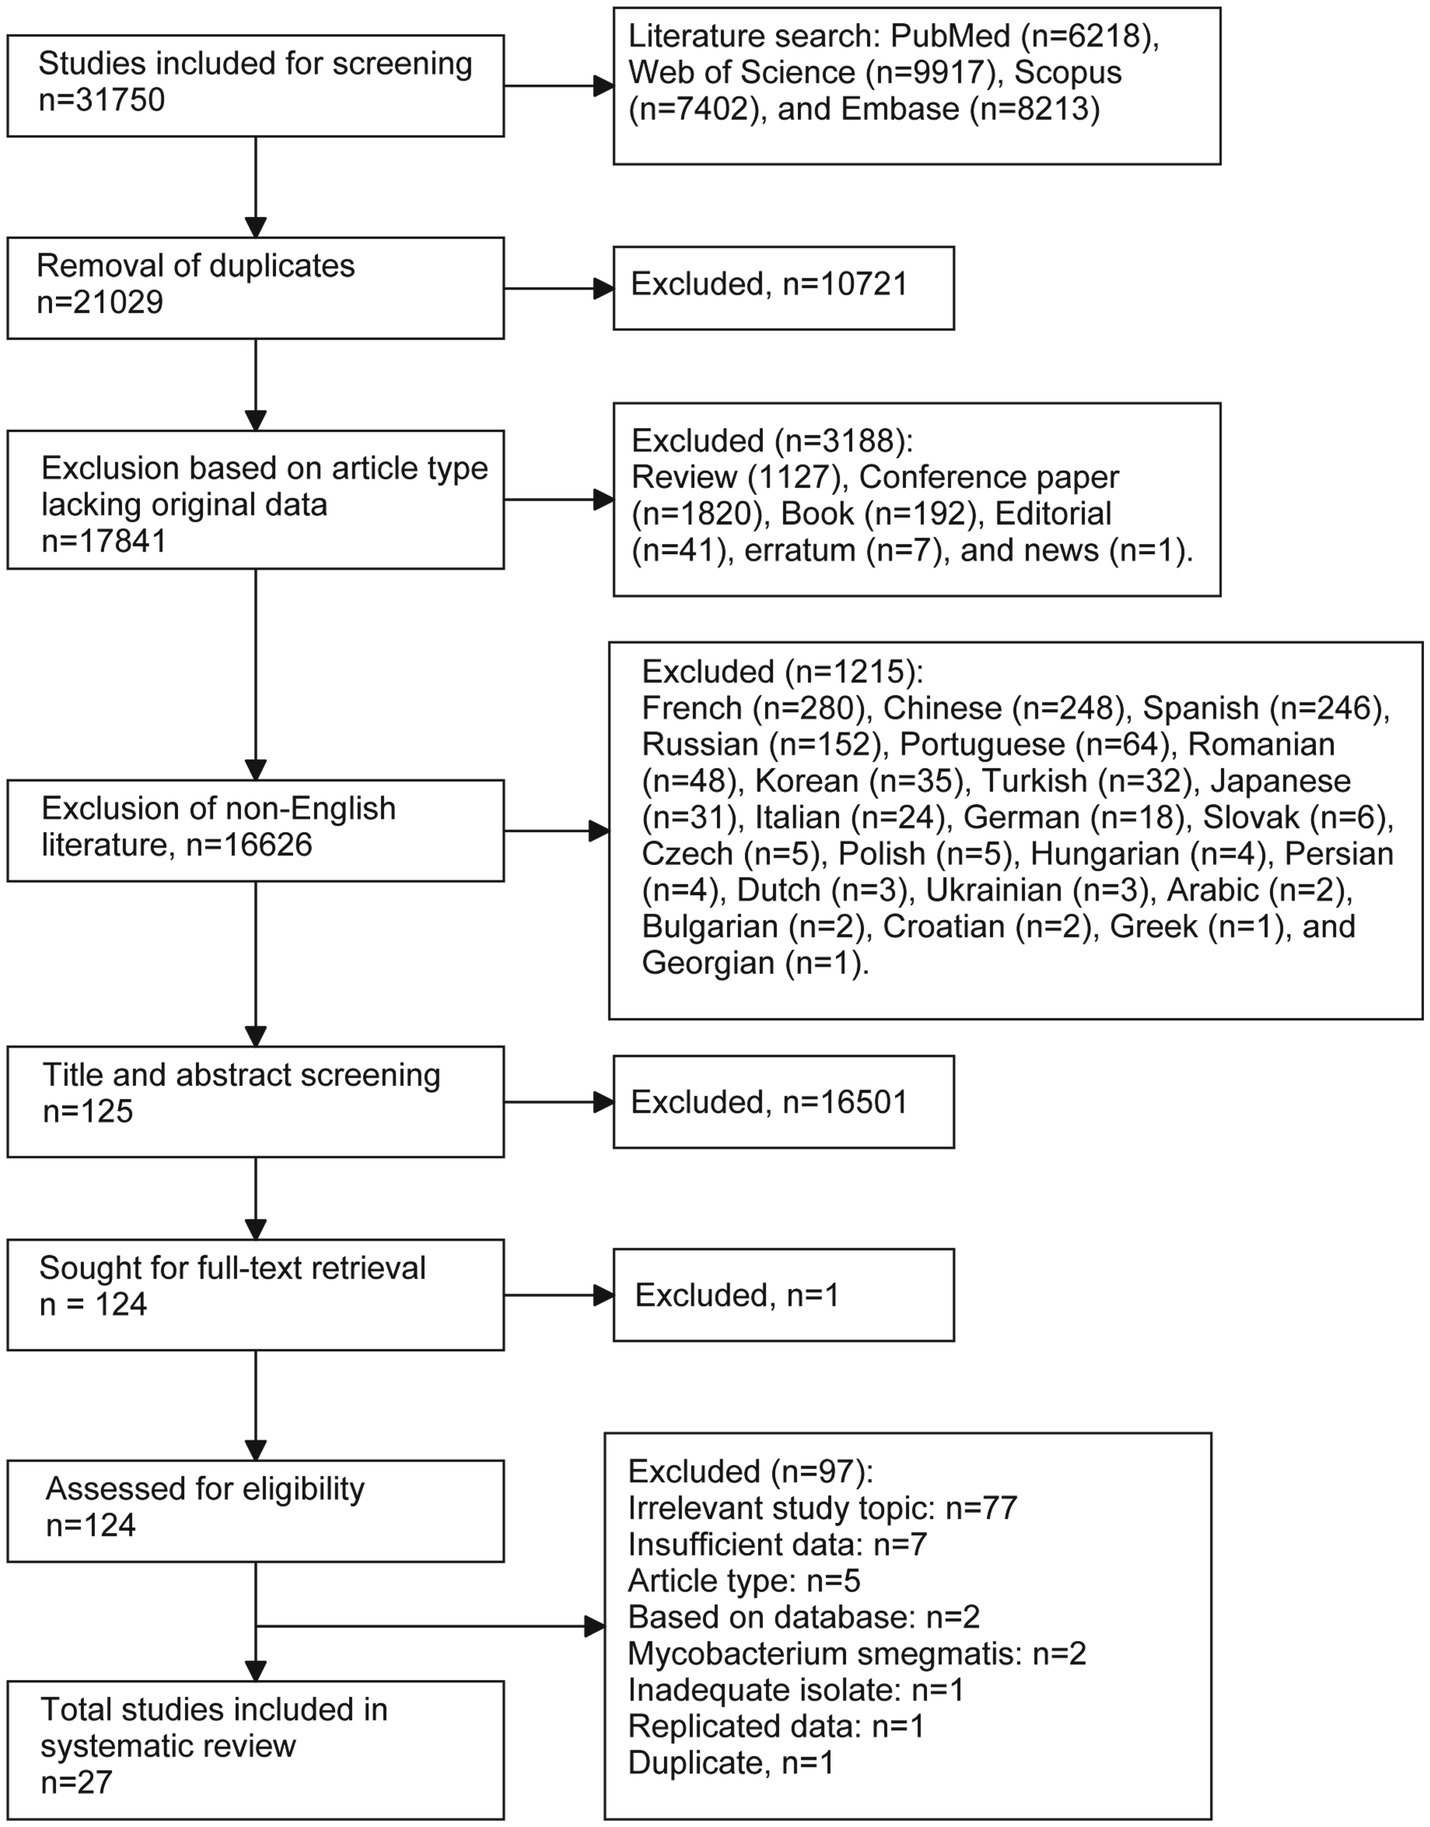
Flow chart of the literature selection process.
Basical characteristics
Table 1 provides a comprehensive summary of the characteristics of the studies included in this meta-analysis. Of these included studies, three were bench studies (Copin et al., 2016; Ford et al., 2011; Comas et al., 2011) and other were cohort. Most cohort studies (23 out of 24) were conducted retrospectively, with only one study being prospective (Roetzer et al., 2013). One study utilized culture media (Comas et al., 2011), while two were conducted on animal models: one on Cynomolgus macaques (Ford et al., 2011) and the other on mice (Copin et al., 2016). In three studies, model isolates [Erdman (Ford et al., 2011), CDC1551 (Comas et al., 2011), T85 (Comas et al., 2011), and H37Rv (Copin et al., 2016)] were measured, whereas clinical isolates were evaluated in the remaining 24 studies. In eight studies, isolates were collected from within a single host (either reactivation or a single infection episode). The remaining 18 studies involved isolates collected from transmission events between patients. Additionally, six studies (with eight datasets) reported single or dual mutation rates without accompanying 95% CI; these rates were combined to calculate the pooled mean and 95% CI. Three studies (with seven datasets) reported means and 95% highest posterior density (HPD), and the 95% HPD was used in place of the 95% CI for the pooled estimate (Bainomugisa et al., 2021; Kuhnert et al., 2018; Merker et al., 2018). The remaining 19 studies (with 35 datasets) provided both the mean mutation rates and their corresponding 95% CI.
Table 1
| Sequence | Study characteritics | M. tuberculosis | Mutation rate (SNPs/genome/year) | ||||||
|---|---|---|---|---|---|---|---|---|---|
| First author, year | Country | Study period | Study design | Host | Isolates | Transmission | Primary data or Calculation (original unit) | ||
| 1.1 | Ford et al. (2011) | USA | – | Bench studies | Cynomolgus macaques | M. tuberculosis (Erdman) | Single episode | Calculation (SNPs/bp/day)a | 1.28 (1.15, 1.40) |
| 1.2 | Ford et al. (2011) | USA | – | Bench studies | Cynomolgus macaques | M. tuberculosis (Erdman) | Latent status | Calculation (SNPs/bp/day)a | 0.73 (0.19, 2.68) |
| 1.3 | Ford et al. (2011) | USA | – | Bench studies | Cynomolgus macaques | M. tuberculosis (Erdman) | Reactivation | Calculation (SNPs/bp/day)a | 0.91 (0.41, 2.12) |
| 1.4 | Ford et al. (2011) | USA | – | Bench studies | Cynomolgus macaques | M. tuberculosis (Erdman) | In vitro culture | Calculation (SNPs/bp/day)a | 0.91 (0.43, 1.42) |
| 2 | Sandegren et al. (2011) | Sweden | 1996–2010 | Retrospective corhort | Human | Clinical isolates | Transmission | Calculation (SNPs and years) | 0.44 and 0 |
| 3 | Saunders et al. (2011) | UK | – | Retrospective corhort | Human | Clinical isolates | Transmission | Calculation (SNPs and years) | 2 |
| 4 | Comas et al. (2011) | USA | – | Bench studies | 7H9 media | M. tuberculosis (CDC1551; T85) | In vitro culture | Calculation (SNPs and years) | 5.00 (2.10, 7.91) |
| 5 | Bryant et al. (2013) | Netherlands | 1992–2007 | Retrospective corhort | Human | Clinical isolates | Transmission | Primary data | 0.27 (0.13, 0.41) |
| 6 | Ford et al. (2013) | Canada | 2006 | Retrospective corhort | Human | Clinical isolates | Transmission | Calculation (SNPs/bp/day)a | 0.63 (0.54, 0.72) |
| 7 | Kato-Maeda et al. (2013) | USA | 1991–2003 | Retrospective corhort | Human | Clinical isolates | Transmission | Calculation (SNPs and years) | 1.78 (0.11, 3.45) |
| 8 | Roetzer et al. (2013) | Germany | 1997–2010 | Prospective cohort | Human | Clinical isolates | Transmission | Calculation (SNPs/bp/year)a | 0.44 (0.26, 0.66) |
| 9.1 | Walker et al. (2013) | UK | 1994–2011 | Retrospective corhort | Human | Clinical isolates | Reactivation or Single episode | Primary data | 0.3 (0, 0.6) |
| 9.2 | Walker et al. (2013) | UK | 1994–2011 | Retrospective corhort | Human | Clinical isolates | Transmission | Primary data | 0.6 (0.3, 0.9) |
| 10.1 | Colangeli et al. (2014) | New Zealand | 1991–2011 | Retrospective corhort | Human | Clinical isolates | Transmission | Calculation (SNPs/bp/generation)a | 1.95 and 0.64 |
| 10.2 | Colangeli et al. (2014) | New Zealand | 1991–2011 | Retrospective corhort | Human | Clinical isolates | Reactivation | Calculation (SNPs/bp/generation)a | 0.13 and 0.22 |
| 11 | Eldholm et al. (2014) | Norway | 2014 | Retrospective corhort | Human | Clinical isolates | Transmission | Primary data | 1.1 (0.7, 1.6) |
| 12 | Cohen et al. (2015) | South Africa | 2008–2013 | Retrospective corhort | Human | Clinical isolates | Transmission | Primary data | 0.61 |
| 13.1 | Guerra-Assuncao et al. (2015) | Malawi | 1995–2010 | Retrospective corhort | Human | Clinical isolates | Transmission | Primary data | 0.26 (0.21, 0.31) |
| 13.2 | Guerra-Assuncao et al. (2015) | Malawi | 1995–2010 | Retrospective corhort | Human | Clinical isolates | Reactivation | Primary data | 0.45 (0.15, 0.75) |
| 14 | Copin et al. (2016) | USA | – | Bench studies | Mouse | M. tuberculosis (H37Rv) | Transmission | Primary data | 6.43 and 1.28 |
| 15 | Korhonen et al. (2016) | Finland | 1995–2013 | Retrospective corhort | Human | Clinical isolates | Transmission | Calculation (SNPs and years) | 0.96 (0.24, 1.68) |
| 16 | Lillebaek et al. (2016) | Denmark | 1960s | Retrospective corhort | Human | Clinical isolates | Transmission | Calculation (SNPs and years) | 0.24 and 0.30 |
| 17 | Folkvardsen et al. (2017) | Denmark | 1992–2014 | Retrospective corhort | Human | Clinical isolates | Transmission | Primary data | 0.24 (0.19, 0.29) |
| 18 | Herranz et al. (2017) | Spain and Latvia | 2012–2015 | Retrospective corhort | Human | Clinical isolates | Reactivation or Single episode | Calculation (SNPs and years) | 0.95 (0.56, 1.35) |
| 19.1 | Kuhnert et al. (2018) | Switzerland, USA, and Thailand | 1987–2012 | Retrospective corhort | Human | Clinical isolates | Transmission | Primary data | 0.72 (0.40, 1.24)b |
| 19.2 | Kuhnert et al. (2018) | Switzerland, USA, and Thailand | 1987–2012 | Retrospective corhort | Human | Clinical isolates | Transmission | Primary data | 0.80 (0.41, 1.50)b |
| 19.3 | Kuhnert et al. (2018) | Switzerland, USA, and Thailand | 1987–2012 | Retrospective corhort | Human | Clinical isolates | Transmission | Primary data | 0.83 (0.42, 1.60)b |
| 19.4 | Kuhnert et al. (2018) | Switzerland, USA, and Thailand | 1987–2012 | Retrospective corhort | Human | Clinical isolates | Transmission | Primary data | 0.55 (0.32, 0.86)b |
| 19.5 | Kuhnert et al. (2018) | Switzerland, USA, and Thailand | 1987–2012 | Retrospective corhort | Human | Clinical isolates | Transmission | Primary data | 0.36 (0.11, 0.57)b |
| 20 | Merker et al. (2018) | Uzbekistan | 2001–2006 | Retrospective corhort | Human | Clinical isolates | Transmission | Primary data | 0.41 (0.32, 0.51)b |
| 21 | Xu et al. (2018) | China | – | Retrospective corhort | Human | Clinical isolates | Reactivation or Single episode | Primary data | 3.2 |
| 22.1 | Colangeli et al. (2020) | Brazil | 2008–2013 | Retrospective corhort | Human | Clinical isolates | Reactivation | Primary data | 1.80 (0.80, 4.05) |
| 22.2 | Colangeli et al. (2020) | Brazil | 2008–2013 | Retrospective corhort | Human | Clinical isolates | Reactivation | Primary data | 0.82 (0.37, 1.84) |
| 23 | Godfroid et al. (2020) | Central Asia | 1995–2015 | Retrospective corhort | Human | Clinical isolates | Transmission | Primary data | 0.54 (0.44, 0.63) |
| 24 | Bainomugisa et al. (2021) | Malaysia | 2012–2017 | Retrospective corhort | Human | Clinical isolates | Transmission | Primary data | 0.56 (0.23, 0.79)b |
| 25.1 | Comín et al. (2022) | Spain | 2004–2019 | Retrospective corhort | Human | Clinical isolates | Reactivation (1–2 years) | Primary data | 0.60 (0.26, 1.39) |
| 25.2 | Comín et al. (2022) | Spain | 2004–2019 | Retrospective corhort | Human | Clinical isolates | Reactivation (2–14 years) | Primary data | 0.59 (0.31, 1.12) |
| 26.1 | Sadovska et al. (2023) | Latvia | 2002–2019 | Retrospective corhort | Human | Clinical isolates | Single episode | Calculation (SNPs and years) | 0.39 (0.01, 0.77) |
| 26.2 | Sadovska et al. (2023) | Latvia | 2002–2019 | Retrospective corhort | Human | Clinical isolates | Reactivation | Calculation (SNPs and years) | 0.25 (0.16, 0.34) |
| 27 | Zhang et al. (2024) | China | 2009–2016 | Retrospective corhort | Human | Clinical isolates | Single episode | Primary data | 1.20 (1.02, 1.38) |
Characteristics of included studies (n = 27) for estimating the mutation rate of Mycobacterium tuberculosis isolates.
During the conversion from other units (e.g., SNPs/bp/day), calculations were based on the following parameters: (1) genome size of 4,411,532 bp (source: https://www.ncbi.nlm.nih.gov/nuccore/NC_000962.2); (2) generation time of 18 h; and (3) one year equal to 365 days.
95% HPD (Highest Posterior Density) is used instead of the 95% confidence interval.
SNPs, single nucleotide polymorphisms.
Bias assessment
The bias assessment results, detailed in Supplementary Table 1 (Supplementary materials, p. 2–6), revealed several limitations across the included studies. None of the studies provided justification for their sample sizes. Due to the nature of bench studies and retrospective designs, only a few studies discussed the exclusion process, and no studies implemented measures to address or categorize non-responders. However, two studies (7.4%) provided detailed exclusion results. Eight studies (29.6%) did not report mutation rates directly; these rates were instead calculated based on the number of SNPs and the specified study period. Additionally, 14 studies (51.9%) did not report 95% CI due to either reporting a single rate or lacking sufficient information. Ten studies (37.0%) failed to acknowledge limitations in their findings, and one study (3.7%) did not provide information on funding sources. Furthermore, 13 studies (48.1%) did not obtain ethical approval, as the authors considered their research exempt from this requirement.
Mutation rate
The pooled mutation rate for M. tb was estimated at 0.63 SNPs/genome/year (95% CI: 0.51–0.75; I2 = 92.7%, p < 0.001; Heterogeneity: I2 = 92.7%, p < 0.001; Figure 2), with a 95% PI of 0.04 to 1.22.
Figure 2
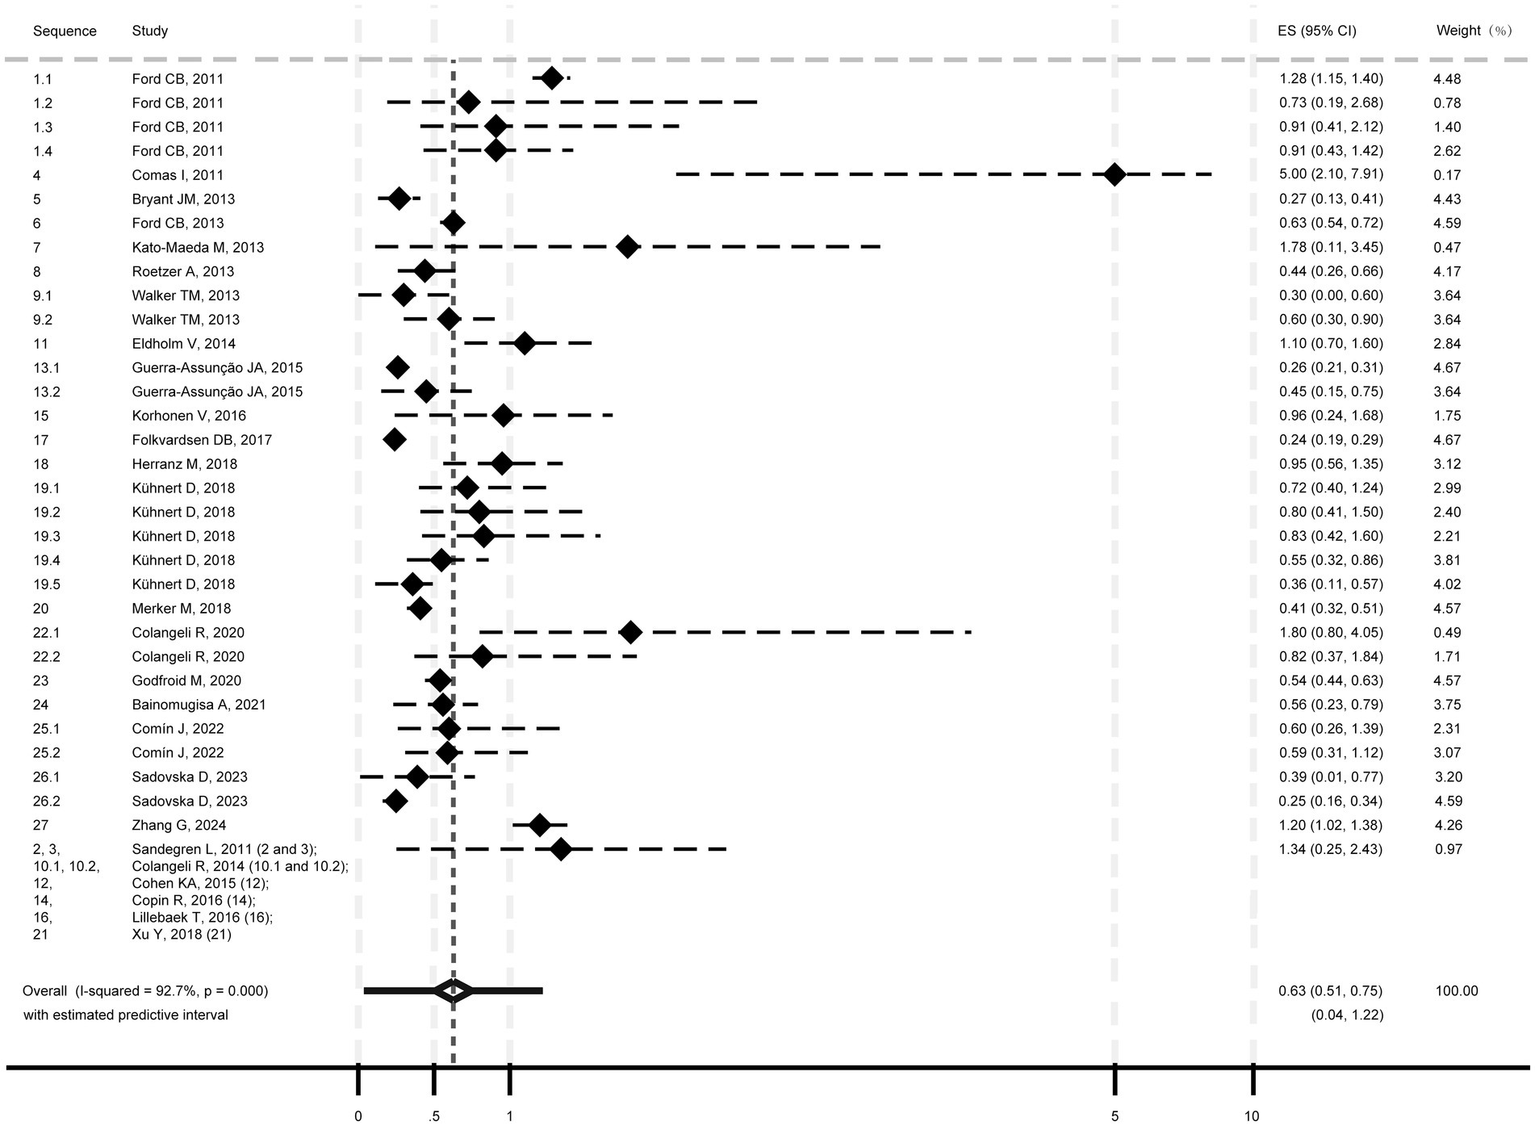
Pooled mutation rate estimate of Mycobacterium tuberculosis isolates.
Subgroup analyses showed mutation rates of 1.14 SNPs/genome/year (95% CI: 0.68–1.60; 95% PI: −0.22-2.50; Supplementary Figure 1, p. 7) for model strains (I2 = 58.8%, p = 0.046) and 0.55 SNPs/genome/year (95% CI: 0.45–0.65; 95% PI: 0.12–0.98) for clinical strains (I2 = 88.1%, p < 0.001). Transmission isolates had a rate of 0.50 SNPs/genome/year (95% CI: 0.40–0.60; 95% PI: 0.14–0.86; Heterogeneity: I2 = 85.9%, p < 0.001; Supplementary Figure 2, p. 8), while “reactivation or single episode” isolates showed 0.64 SNPs/genome/year (95% CI: 0.33–0.95; 95% PI: −0.43 to 1.72; Heterogeneity: I2 = 90.7%, p < 0.001). Meta-regression indicated heterogeneity was significantly associated with isolate type (model vs. clinical; p = 0.006), but not transmission/ “reactivation or single episode” (p = 0.497).
Discussion
TB remains a significant global health challenge, with M. tb continually evolving to resist existing treatments. Understanding the molecular clock of M. tb is crucial for tracking drug resistance, mapping transmission networks, and designing effective interventions. Our systematic review and meta-analysis estimate the mutation rate at 0.63 SNPs/genome/year, with significant variation between model and clinical strains. Regarding clinical M. tb strains, the mutation rate is typically below 1 SNP/genome/year, supported by a 95% PI of 0.12–0.98. This estimate aligns well with existing molecular clock data and appears more precise than earlier findings, which ranged from 0.04 to 2.2 SNPs/genome/year (Menardo et al., 2019). Overall, this mutation rate is slower than previously thought, as rates below 10 SNPs were often used as a criterion for recent infection and reactivation (Sadovska et al., 2023). The observed rate underscores the evolutionary stability of M. tb in clinical environments, despite host immune pressures and treatment regimens (Nimmo et al., 2020; Reiling et al., 2018). In contrast, model strains showed a higher mutation rate of 1.14 SNPs/genome/year. This discrepancy may be due to fewer environmental constraints in model strains, leading to a higher accumulation of mutations (Perrier, 2020), as well as differences in generation times between model and clinical strains (Colangeli et al., 2014). These findings highlight the need to consider experimental context when interpreting the evolutionary dynamics of M. tb.
Furthermore, although isolates derived from transmission events exhibited a lower mutation rate (0.50 SNPs per genome per year) compared to those from reactivation or single infection episodes (0.64 SNPs per genome per year), this difference was not statistically significant. This suggests a potentially rapid mutation rate during reactivation (or single infection episode), likely due to gradual mutation accumulation over time. While transmission imposes selective pressures for host adaptation (Brites and Gagneux, 2012), the overall mutation rate remained slow. This may be explained by that (1) the establishment of infection typically requiring fewer than 10 M. tb isolates, thereby limiting genetic diversity during transmission (Treibert et al., 2018); and (2) transmission not relying on rapid evolutionary changes, suggesting that significant mutations may not be immediately necessary.
These findings have important implications for public health and TB control strategies. Establishing that the mutation rate of clinical isolates is typically below 1 SNP per genome per year allows for greater accuracy in outbreak reconstructions and transmission network modeling. The molecular clock offers valuable insights into the genetic evolution of M. tb, particularly by helping to identify the timeline of outbreaks, track the spread of resistant strains, and understand transmission dynamics. Most importantly, this precise mutation rate estimate will aid in establishing criteria for distinguishing reactivation from recent infection, accounting for the interval between isolates.
Despite valuable insights, this study has several limitations, including significant heterogeneity, inconsistent study characteristics, reliance on indirect SNP calculations (partly), lack of confidence intervals (partly), and potential bias from pooling single-rate estimates for summary analysis. Another important limitation is the inclusion of datasets derived from diverse geographic and demographic settings. Geographic heterogeneity likely reflects differences in lineage distribution (Brenner and Sreevatsan, 2023), while demographic variability may correspond to the emergence of locally adapted variants (Correa-Macedo et al., 2019). Furthermore, differences in sequencing technologies, bioinformatics pipelines, reference genomes, and variant-calling thresholds across studies can influence the sensitivity and specificity of SNP detection, leading to variability in reported mutation rates. For instance, studies using higher-depth sequencing or more stringent variant-calling criteria may detect fewer mutations, resulting in lower mutation rate estimates, whereas more permissive pipelines could inflate the apparent rate (Koboldt, 2020; Feng et al., 2023). Variations in reference genomes can also introduce systematic biases by affecting alignment accuracy and SNP calling (Valiente-Mullor et al., 2021; Zverinova and Guryev, 2022). Collectively, these methodological discrepancies may contribute to the heterogeneity observed in our meta-analysis and limit the comparability of results across studies. To standardize mutation rates, a fixed genome size corresponding to the H37Rv reference strain (4,411,532 bp) was adopted. Minor discrepancies (<2%) may result from slight variations in genome size across different strains (Sanoussi et al., 2021). Additionally, the limited number of studies involving model isolates constrains the statistical power and generalizability of comparisons with clinical isolates. Therefore, future studies incorporating larger datasets of model isolates are warranted to validate and extend these findings.
In conclusion, this study provides a comprehensive analysis of the molecular clock rates of M. tb, highlighting significant variations between model and clinical strains, as well as substantial heterogeneity that underscores the large variation in clock rates across different infection scenarios. Future research should prioritize the collection of more detailed characteristics of each M. tb infection event and its context to enhance the precision of molecular clock estimates.
Statements
Data availability statement
The original contributions presented in the study are included in the article/Supplementary material, further inquiries can be directed to the corresponding author.
Author contributions
J-LW: Conceptualization, Methodology, Supervision, Writing – original draft, Writing – review & editing. Y-LC: Data curation, Formal analysis, Investigation, Writing – review & editing. C-PG: Data curation, Formal analysis, Investigation, Writing – review & editing. KY: Validation, Writing – review & editing. M-SW: Conceptualization, Funding acquisition, Project administration, Supervision, Writing – original draft.
Funding
The author(s) declare that financial support was received for the research and/or publication of this article. This study was funded by the Taishan Scholar Project of Shandong Province (No. tsqn202211358).
Conflict of interest
The authors declare that the research was conducted in the absence of any commercial or financial relationships that could be construed as a potential conflict of interest.
Generative AI statement
The authors declare that no Gen AI was used in the creation of this manuscript.
Publisher’s note
All claims expressed in this article are solely those of the authors and do not necessarily represent those of their affiliated organizations, or those of the publisher, the editors and the reviewers. Any product that may be evaluated in this article, or claim that may be made by its manufacturer, is not guaranteed or endorsed by the publisher.
Supplementary material
The Supplementary material for this article can be found online at: https://www.frontiersin.org/articles/10.3389/fmicb.2025.1591792/full#supplementary-material
Abbreviations
TB, Tuberculosis; M. tb, Mycobacterium tuberculosis; SNP, single nucleotide polymorphism; 95% CI, 95% confidence interval; 95% PI, 95% predictive interval; 95% HPD, 95% highest posterior density.
References
1
BainomugisaA.MeumannE. M.RajahramG. S.OngR. T.CoinL.PaulD. C.et al. (2021). Genomic epidemiology of tuberculosis in eastern Malaysia: insights for strengthening public health responses. Microb. Genom.7:573. doi: 10.1099/mgen.0.000573
2
BrennerE. P.SreevatsanS. (2023). Global-scale GWAS associates a subset of SNPs with animal-adapted variants in M. tuberculosis complex. BMC Med. Genet.16:260. doi: 10.1186/s12920-023-01695-5
3
BritesD.GagneuxS. (2012). Old and new selective pressures on Mycobacterium tuberculosis. Infect. Genet. Evol.12, 678–685. doi: 10.1016/j.meegid.2011.08.010
4
BryantJ. M.SchurchA. C.van DeutekomH.HarrisS. R.de BeerJ. L.de JagerV.et al. (2013). Inferring patient to patient transmission of Mycobacterium tuberculosis from whole genome sequencing data. BMC Infect. Dis.13:110. doi: 10.1186/1471-2334-13-110
5
CohenK. A.AbeelT.Manson McGuireA.DesjardinsC. A.MunsamyV.SheaT. P.et al. (2015). Evolution of extensively drug-resistant tuberculosis over four decades: whole genome sequencing and dating analysis of Mycobacterium tuberculosis isolates from KwaZulu-Natal. PLoS Med.12:e1001880. doi: 10.1371/journal.pmed.1001880
6
ColangeliR.ArcusV. L.CursonsR. T.RutheA.KaralusN.ColeyK.et al. (2014). Whole genome sequencing of Mycobacterium tuberculosis reveals slow growth and low mutation rates during latent infections in humans. PLoS One9:e91024. doi: 10.1371/journal.pone.0091024
7
ColangeliR.GuptaA.VinhasS. A.Chippada VenkataU. D.KimS.GradyC.et al. (2020). Mycobacterium tuberculosis progresses through two phases of latent infection in humans. Nat. Commun.11:4870. doi: 10.1038/s41467-020-18699-9
8
ComasI.BorrellS.RoetzerA.RoseG.MallaB.Kato-MaedaM.et al. (2011). Whole-genome sequencing of rifampicin-resistant Mycobacterium tuberculosis strains identifies compensatory mutations in RNA polymerase genes. Nat. Genet.44, 106–110. doi: 10.1038/ng.1038
9
ComínJ.CebolladaA.Aragonese Working Group on Molecular Epidemiology of Tuberculosis (EPIMOLA)SamperS. (2022). Estimation of the mutation rate of Mycobacterium tuberculosis in cases with recurrent tuberculosis using whole genome sequencing. Sci. Rep.12:16728. doi: 10.1038/s41598-022-21144-0
10
CopinR.WangX.LouieE.EscuyerV.CoscollaM.GagneuxS.et al. (2016). Within host evolution selects for a dominant genotype of Mycobacterium tuberculosis while T cells increase pathogen genetic diversity. PLoS Pathog.12:e1006111. doi: 10.1371/journal.ppat.1006111
11
Correa-MacedoW.CambriG.SchurrE. (2019). The interplay of human and Mycobacterium Tuberculosis genomic variability. Front. Genet.10:865. doi: 10.3389/fgene.2019.00865
12
DownesM. J.BrennanM. L.WilliamsH. C.DeanR. S. (2016). Development of a critical appraisal tool to assess the quality of cross-sectional studies (AXIS). BMJ Open6:e011458. doi: 10.1136/bmjopen-2016-011458
13
EldholmV.NorheimG.von der LippeB.KinanderW.DahleU. R.CaugantD. A.et al. (2014). Evolution of extensively drug-resistant Mycobacterium tuberculosis from a susceptible ancestor in a single patient. Genome Biol.15:490. doi: 10.1186/s13059-014-0490-3
14
FengB.LaiJ.FanX.LiuY.WangM.WuP.et al. (2023). Systematic comparison of variant calling pipelines of target genome sequencing cross multiple next-generation sequencers. Front. Genet.14:1293974. doi: 10.3389/fgene.2023.1293974
15
FolkvardsenD. B.NormanA.AndersenA. B.Michael RasmussenE.JelsbakL.LillebaekT. (2017). Genomic epidemiology of a major Mycobacterium tuberculosis outbreak: retrospective cohort study in a low-incidence setting using sparse time-series sampling. J. Infect. Dis.216, 366–374. doi: 10.1093/infdis/jix298
16
FordC. B.LinP. L.ChaseM. R.ShahR. R.IartchoukO.GalaganJ.et al. (2011). Use of whole genome sequencing to estimate the mutation rate of Mycobacterium tuberculosis during latent infection. Nat. Genet.43, 482–486. doi: 10.1038/ng.811
17
FordC. B.ShahR. R.MaedaM. K.GagneuxS.MurrayM. B.CohenT.et al. (2013). Mycobacterium tuberculosis mutation rate estimates from different lineages predict substantial differences in the emergence of drug-resistant tuberculosis. Nat. Genet.45, 784–790. doi: 10.1038/ng.2656
18
GodfroidM.DaganT.MerkerM.KohlT. A.DielR.MaurerF. P.et al. (2020). Insertion and deletion evolution reflects antibiotics selection pressure in a Mycobacterium tuberculosis outbreak. PLoS Pathog.16:e1008357. doi: 10.1371/journal.ppat.1008357
19
Guerra-AssuncaoJ. A.CrampinA. C.HoubenR. M.MzembeT.MallardK.CollF.et al. (2015). Large-scale whole genome sequencing of M. tuberculosis provides insights into transmission in a high prevalence area. eLife4:e05166. doi: 10.7554/eLife.05166
20
HerranzM.PoleI.OzereI.Chiner-OmsA.Martinez-LirolaM.Perez-GarciaF.et al. (2017). Mycobacterium tuberculosis acquires limited genetic diversity in prolonged infections, reactivations and transmissions involving multiple hosts. Front. Microbiol.8:2661. doi: 10.3389/fmicb.2017.02661
21
HunterJ. P.SaratzisA.SuttonA. J.BoucherR. H.SayersR. D.BownM. J. (2014). In meta-analyses of proportion studies, funnel plots were found to be an inaccurate method of assessing publication bias. J. Clin. Epidemiol.67, 897–903. doi: 10.1016/j.jclinepi.2014.03.003
22
Kato-MaedaM.HoC.PassarelliB.BanaeiN.GrinsdaleJ.FloresL.et al. (2013). Use of whole genome sequencing to determine the microevolution of Mycobacterium tuberculosis during an outbreak. PLoS One8:e58235. doi: 10.1371/journal.pone.0058235
23
KoboldtD. C. (2020). Best practices for variant calling in clinical sequencing. Genome Med.12:91. doi: 10.1186/s13073-020-00791-w
24
KorhonenV.SmitP. W.HaanperaM.CasaliN.RuutuP.VasankariT.et al. (2016). Whole genome analysis of Mycobacterium tuberculosis isolates from recurrent episodes of tuberculosis, Finland, 1995-2013. Clin. Microbiol. Infect.22, 549–554. doi: 10.1016/j.cmi.2016.03.014
25
KuhnertD.CoscollaM.BritesD.StuckiD.MetcalfeJ.FennerL.et al. (2018). Tuberculosis outbreak investigation using phylodynamic analysis. Epidemics25, 47–53. doi: 10.1016/j.epidem.2018.05.004
26
LillebaekT.NormanA.RasmussenE. M.MarvigR. L.FolkvardsenD. B.AndersenA. B.et al. (2016). Substantial molecular evolution and mutation rates in prolonged latent Mycobacterium tuberculosis infection in humans. Int. J. Med. Microbiol.306, 580–585. doi: 10.1016/j.ijmm.2016.05.017
27
MenardoF.DucheneS.BritesD.GagneuxS. (2019). The molecular clock of Mycobacterium tuberculosis. PLoS Pathog.15:e1008067. doi: 10.1371/journal.ppat.1008067
28
MerkerM.BarbierM.CoxH.RasigadeJ. P.FeuerriegelS.KohlT. A.et al. (2018). Compensatory evolution drives multidrug-resistant tuberculosis in Central Asia. eLife7:e38200. doi: 10.7554/eLife.38200
29
NimmoC.BrienK.MillardJ.GrantA. D.PadayatchiN.PymA. S.et al. (2020). Dynamics of within-host Mycobacterium tuberculosis diversity and heteroresistance during treatment. EBioMedicine55:102747. doi: 10.1016/j.ebiom.2020.102747
30
PageM. J.MoherD.BossuytP. M.BoutronI.HoffmannT. C.MulrowC. D.et al. (2021). PRISMA 2020 explanation and elaboration: updated guidance and exemplars for reporting systematic reviews. BMJ372:n160. doi: 10.1136/bmj.n160
31
PerrierA. (2020). Genetic and environmental constraints causing species’ range limits. [dissertation/doctoral thesis]. Basel, Switzerland: University of Basel. Available at: https://edoc.unibas.ch/entities/publication/51e35328-feff-41c1-b9bc-7e44b1aa57ce
32
ReilingN.HomolkaS.KohlT. A.SteinhauserC.KolbeK.SchutzeS.et al. (2018). Shaping the niche in macrophages: genetic diversity of the M. tuberculosis complex and its consequences for the infected host. Int. J. Med. Microbiol.308, 118–128. doi: 10.1016/j.ijmm.2017.09.009
33
RoetzerA.DielR.KohlT. A.RuckertC.NubelU.BlomJ.et al. (2013). Whole genome sequencing versus traditional genotyping for investigation of a Mycobacterium tuberculosis outbreak: a longitudinal molecular epidemiological study. PLoS Med.10:e1001387. doi: 10.1371/journal.pmed.1001387
34
SadovskaD.NodievaA.PoleI.KimsisJ.ViksnaA.OzereI.et al. (2023). Advantages of analysing both pairwise SNV-distance and differing SNVs between Mycobacterium tuberculosis isolates for recurrent tuberculosis cause determination. Microb. Genom.9:mgen000956. doi: 10.1099/mgen.0.000956
35
SandegrenL.GroenheitR.KoivulaT.GhebremichaelS.AdvaniA.CastroE.et al. (2011). Genomic stability over 9 years of an isoniazid resistant Mycobacterium tuberculosis outbreak strain in Sweden. PLoS One6:e16647. doi: 10.1371/journal.pone.0016647
36
SanoussiC. N.CoscollaM.Ofori-AnyinamB.OtchereI. D.AntonioM.NiemannS.et al. (2021). Mycobacterium tuberculosis complex lineage 5 exhibits high levels of within-lineage genomic diversity and differing gene content compared to the type strain H37Rv. Microb. Genom.7:437. doi: 10.1099/mgen.0.000437
37
SaundersN. J.TrivediU. H.ThomsonM. L.DoigC.LaurensonI. F.BlaxterM. L. (2011). Deep resequencing of serial sputum isolates of Mycobacterium tuberculosis during therapeutic failure due to poor compliance reveals stepwise mutation of key resistance genes on an otherwise stable genetic background. J. Infect.62, 212–217. doi: 10.1016/j.jinf.2011.01.003
38
TreibertS.BrunnerH.EhrhardtM. (2018). Compartment models for vaccine effectiveness and non-specific effects for Tuberculosis. Math. Biosci. Eng.16, 7250–7298. doi: 10.3934/mbe.2019364
39
UsuiT.MacleodM. R.McCannS. K.SeniorA. M.NakagawaS. (2021). Meta-analysis of variation suggests that embracing variability improves both replicability and generalizability in preclinical research. PLoS Biol.19:e3001009. doi: 10.1371/journal.pbio.3001009
40
Valiente-MullorC.BeamudB.AnsariI.Frances-CuestaC.Garcia-GonzalezN.MejiaL.et al. (2021). One is not enough: on the effects of reference genome for the mapping and subsequent analyses of short-reads. PLoS Comput. Biol.17:e1008678. doi: 10.1371/journal.pcbi.1008678
41
WalkerT. M.IpC. L.HarrellR. H.EvansJ. T.KapataiG.DedicoatM. J.et al. (2013). Whole-genome sequencing to delineate Mycobacterium tuberculosis outbreaks: a retrospective observational study. Lancet Infect. Dis.13, 137–146. doi: 10.1016/S1473-3099(12)70277-3
42
XuY.LiuF.ChenS.WuJ.HuY.ZhuB.et al. (2018). In vivo evolution of drug-resistant Mycobacterium tuberculosis in patients during long-term treatment. BMC Genomics19:640. doi: 10.1186/s12864-018-5010-5
43
ZhangG.SunX.FlemingJ.RanF.LuoJ.ChenH.et al. (2024). Genetic factors associated with acquired phenotypic drug resistance and its compensatory evolution during tuberculosis treatment. Clin. Microbiol. Infect.30, 637–645. doi: 10.1016/j.cmi.2024.01.016
44
ZverinovaS.GuryevV. (2022). Variant calling: considerations, practices, and developments. Hum. Mutat.43, 976–985. doi: 10.1002/humu.24311
Summary
Keywords
molecular clock, Mycobacterium tuberculosis, single nucleotide polymorphism, heterogeneity, systematic review
Citation
Wang J-L, Chen Y-L, Guan C-P, Yu K and Wang M-S (2025) Clinical Mycobacterium tuberculosis isolates exhibit a molecular clock rate below 1 SNP per genome per year. Front. Microbiol. 16:1591792. doi: 10.3389/fmicb.2025.1591792
Received
11 March 2025
Accepted
16 May 2025
Published
13 June 2025
Volume
16 - 2025
Edited by
Axel Cloeckaert, Institut National de recherche pour l’agriculture, l’alimentation et l’environnement (INRAE), France
Reviewed by
Oana Dumitrescu, Hospices Civils de Lyon, France
Padmani Sandhu, Institute of Microbial Technology (CSIR), India
Sanjay Gautam, The University of Melbourne, Australia
Raquel Muñiz-Salazar, Autonomous University of Baja California, Mexico
Richa Dwivedi, Meharry Medical College, United States
Updates
Copyright
© 2025 Wang, Chen, Guan, Yu and Wang.
This is an open-access article distributed under the terms of the Creative Commons Attribution License (CC BY). The use, distribution or reproduction in other forums is permitted, provided the original author(s) and the copyright owner(s) are credited and that the original publication in this journal is cited, in accordance with accepted academic practice. No use, distribution or reproduction is permitted which does not comply with these terms.
*Correspondence: Mao-Shui Wang, wangmaoshui@gmail.com
†ORCID: Mao-Shui Wang, https://orcid.org/0000-0001-6046-3953
Disclaimer
All claims expressed in this article are solely those of the authors and do not necessarily represent those of their affiliated organizations, or those of the publisher, the editors and the reviewers. Any product that may be evaluated in this article or claim that may be made by its manufacturer is not guaranteed or endorsed by the publisher.