 John K. Barrows1
 Ross M. Wood2Alaina B. Westee3Kamya A. Stubbs3Melanie Ratliff-Griffin2
 Michael W. Van Dyke3*
- 1College of Humanities, Sciences, and Technology, Reinhardt University, Waleska, GA, United States
- 2Department of Cellular and Molecular Biology, Kennesaw State University, Kennesaw, GA, United States
- 3Department of Chemistry and Biochemistry, Kennesaw State University, Kennesaw, GA, United States
Transition metals, such as cadmium (Cd) and zinc (Zn), can be detrimental to cell viability in excess. Bacteria contain conserved regulatory mechanisms to sense and respond to a variety of environmental stressors, such as an influx of metal cations. One such mechanism is the activation of metalloregulatory transcription factors that bind to cognate metal cofactors to induce a transcription regulatory response. Metalloregulatory transcription factor families, such as the ferric uptake regulator (FUR), mercury-resistant regulator (MerR), copper-sensitive operon repressor (CsoR), and diphtheria toxin regulator (DtxR), are found widespread throughout bacterial genomes. Often, these transcription factors bind a specific DNA sequence found in the promoter of regulated genes to exert their transcription regulatory functions. In this study, we use an iterative selection technique called restriction endonuclease protection, selection, and amplification (RESPA) to identify the preferred DNA binding sequence for the MerR family, Cd/Zn-responsive regulator, CadR, from the opportunistic human pathogen, Pseudomonas aeruginosa. By doing so, we identify the transcription regulatory network for CadR, which includes the Cd/Zn-exporter, cadA, as well as an uncharacterized zinc ribbon domain-containing protein.
1 Introduction
The MerR family of transcription regulators is found extensively throughout bacteria. Structurally, these transcription factors contain a conserved N-terminal DNA-binding domain, a central dimerization helix, and a divergent C-terminal binding domain (Brown et al., 2003). MerR family members bind a diverse group of ligands, including a variety of heavy metal ions (Hg+, Zn2+, Cu2+, Cd2+, Pd2+, Co2+, and Ni2+), redox-responsive metabolites, and exogenous toxic compounds such as antibiotics (Fang and Zhang, 2022). Typically, promoters of MerR-regulated genes contain abnormally long spacer regions between the −35 and −10 elements, whereas the optimal spacing between these elements is 17+/−1 bp (Vassylyev et al., 2002). Apo-MerR dimers bind the DNA sequence between the −35 and −10 elements, often leading to transcriptional repression of the downstream gene. Upon effector binding, the MerR dimers distort DNA topology bringing the −35 and −10 elements in preferred proximity, thus allowing RNA polymerase holoenzyme recognition and subsequent transcription activation (Philips et al., 2015). Regulons for MerR transcription factors usually include efflux systems used to remove their often-toxic effector molecule.
Most bacterial transcription factors recognize a specific DNA sequence found immediately upstream of a regulated gene (Browning and Busby, 2004; Seshasayee et al., 2011). Several in vitro and in vivo techniques have been developed to identify preferred DNA binding sequences for transcription regulatory proteins, including chromatin immunoprecipitation (ChIP)-seq (Robertson et al., 2007), SELEX-seq, and high-density dsDNA microarrays (Wang et al., 2011). However, these technologies often need recombinant proteins with either N- or C-terminus tags, which may interfere with DNA binding. If a tag is not used for affinity capture, then antibodies are needed, which may not be readily available for bacterial proteins. An alternative, iterative selection approach is restriction endonuclease protection, selection, and amplification (REPSA; Barrows and Van Dyke, 2023). This technique is performed in sequential rounds, wherein in each round a population of preferred DNA-binding sequences is selected by type IIS restriction endonuclease (IISRE) digestion. DNA templates used in REPSA contain defined flanking regions harboring IISRE binding sites and an internal region of random nucleotides. IISREs bind DNA at a specific sequence and cleave DNA at a set distance away from where they bind. The DNA templates for REPSA are designed so that the IISRE cleaves DNA within the region of random nucleotides. If a transcription factor of interest binds DNA within the random region, IISRE-dependent cleavage will be blocked. Uncleaved DNAs are amplified by PCR, which are then used as inputs to the next round of REPSA. This process is repeated until an uncleaved DNA population is observed by gel electrophoresis, indicative of selecting high-affinity DNA binding sequences for the transcription factor of interest. Resulting DNAs are subject to high-throughput sequencing and motif discovery software to identify consensus DNA-binding motifs.
Pseudomonas aeruginosa is a gram-negative, ubiquitous bacterium commonly found in freshwater environments. P. aeruginosa is an opportunistic pathogen often infecting immunocompromised hosts, such as burn victims, cystic fibrosis patients, and those requiring treatment by ventilation (Qin et al., 2022). As such, P. aeruginosa is a common cause of nosocomial, or hospital-borne, infections and is considered a high-priority pathogen by the World Health Organization (Jesudason, 2024). Understanding the fundamental biology of P. aeruginosa has therefore become essential to laying the foundation for future treatment strategies.
In this study, we identify a preferred DNA binding motif for the cadmium (Cd2+)/zinc (Zn2+)-responsive MerR regulator, CadR, from P. aeruginosa PAO1. Similar to traditional MerR regulators, CadR homologs bind a specific DNA sequence and induce DNA distortion and transcription activation upon metal effector binding, as exemplified by the CadR homolog from Pseudomonas putida (Liu et al., 2019). Using REPSA, we find PaCadR binds a palindromic, 23 bp inverted repeat containing 11 bp repeat units separated by 1 bp. When mapped to the P. aeruginosa PAO1 genome, we identified two sequences that exhibited high-affinity PaCadR binding. Identification and regulation of genes adjacent to these binding sequences were validated in vitro and in vivo, leading to the promoter characterization of a previously unannotated open reading frame encoding a zinc ribbon domain-containing protein. Collectively, these results showcase the DNA specificity of a CadR homolog and provide a framework for transcription factor characterization in P. aeruginosa.
2 Materials and methods
2.1 PaCadR protein expression and purification
A P. aeruginosa CadR expression vector was developed using GenScript®. To do so, the coding region of PaCadR (PA3689; complement position 4,130,952–4,131,422 on P. aeruginosa PAO1 chromosome) as well as additional upstream sequences used for purification were codon optimized for expression in E. coli and inserted into a pET-11a expression vector using restriction enzyme sites, NdeI and BamHI. The complete amino acid sequence added before the cadR start codon was MGSSHHHHHHENLYFQGS, which includes a 6× histidine and TEV-protease cleavage sequence. E. coli strain Rosetta 2 (DE3) competent cells (Millipore) were transformed with the expression plasmid and selected for on agar plates containing 100 μg/mL ampicillin and 34 μg/mL chloramphenicol. Successfully transformed cells were initially grown in 2 mL Luria-Bertani (LB) broth at 37°C and 250 RPM for 1 h, then seeded into a 50 mL culture. The larger culture was grown at 37°C and 250 RPM to an OD of ~0.5 and then induced with 1 mM IPTG for 3 h. Cells were then pelleted and stored at −80°C. For purification, the pellet was thawed and resuspended in 1 mL 2X Bacterial Extract Buffer [40 mM Tris-Cl (pH 7.5), 200 mM NaCl, 0.2 mM EDTA, 5 mM βME and 1 mM PMSF]. Next, 22 μL of a 10 μg/μL lysozyme solution was added, and the mixture was incubated on ice for 10 min. The cell solution was then sonicated at 3 W, 10 s on/50 s off, for 5 cycles, and then pelleted. The resulting supernatant was supplemented with imidazole and NaCl to final concentrations of 20 mM and 500 mM, respectively, then loaded onto a His SpinTrap column (Cytiva) following the manufacturer’s protocol. Eluted material was combined, supplemented with 10 μL of 10 U/μL AcTEV protease (Invitrogen), and buffer exchanged to 50 mM Tris-Cl (pH 8.0), 0.5 mM EDTA, 1 mM βME by overnight dialysis at 4°C. The dialyzed sample was supplemented with imidazole and NaCl to final concentrations of 100 mM and 500 mM, respectively, then loaded onto a His SpinTrap column (Cytiva). Cleaved PaCadR was collected from the flowthrough (Supplementary Figure S1), buffer exchanged to 2X Bacterial Extract Buffer, diluted 2-fold with 100% glycerol, and stored at −20°C.
2.2 DNA oligonucleotides
All DNA oligonucleotides used in this study are presented in Supplementary File S1. Each oligonucleotide was purchased from Integrated DNA Technologies (IDT) and purified using their standard desalting procedure. Selection template oligonucleotides for REPSA were amplified using ST5L and 5′ IRDye-700 labeled ST2R primers. Oligonucleotides used for biolayer interferometry (BLI) were amplified using ST2L and 5′ biotin-labeled ST2R primers. For electromobility shift assay (EMSA), the control DNA oligonucleotide was amplified using ST2R and 5′ IRDye-800 labeled ConL primers, while each experimental oligonucleotide was amplified with ST2L and 5′ IRDye-700 labeled ST2R primers. PCR reactions were performed using New England Biolabs (NEB) Taq DNA polymerase with standard Taq buffer under reaction conditions specified by the manufacturer. dsDNA quantification following PCR amplification was achieved using a Qubit 3 Fluorometer (Invitrogen).
2.3 Restriction endonuclease protection, selection, and amplification
REPSA was performed as described previously (Barrows and Van Dyke, 2023), with minor changes. Our selection template oligonucleotide (ST5R26, Supplementary File S1) contained defined regions flanking an internal 26-mer random nucleotide sequence. The random nucleotide region was created using IDT’s Handmix method with a 25% representation of each nucleotide. To add a 5′ IRDye700 label to our selection template, 200 ng of the ST5R26 oligonucleotide was subject to a single cycle of PCR using the 5′ IRDye700 labeled ST2R primer. The resulting DNAs were purified using a DNA Clean and Concentrator-5 kit (Zymo Research) and treated with 20 units Mung Bean Nuclease (NEB) in 1X CutSmart® buffer (NEB) for 30 min at 37°C to remove ssDNA species. The resulting DNAs were purified with a DNA Clean and Concentrator-5 kit (Zymo Research) and subsequently used for the first round of REPSA. REPSA reactions were performed at 37°C in 1X CutSmart® buffer containing 1 mM DTT, 0.1 ng/μL DNA template, and 100 nM PaCadR, where indicated. After a 20-min incubation, type IIS restriction enzyme (IISRE) was added at 0.04 U/μL and mixed by thorough pipetting. Reactions were incubated for 5 more minutes at 37°C, then placed on ice to stop IISRE-cleavage. A 9 μL sample from reactions containing IISRE and PaCadR was used for PCR amplification. The resulting DNAs were purified by a DNA Clean and Concentrator-5 kit (Zymo Research) and used as inputs for the next round of REPSA. The IISRE BpmI (NEB) was used for Rounds 1, 3, 5, 6, 8, and 9, while FokI (NEB) was used for Rounds 2, 4, 7, and 10.
2.4 DNA sequencing and bioinformatics
DNAs from Round 10 of REPSA (Figure 1A) were subject to fusion PCR to add Nextera read sequences (“NT1/2”), Nextera XT index sequences (“2i”), and Illumina P5/P7 adapter sequences to each side of our DNA template (Supplementary File S1). The resulting DNAs were 183 nt in length. 75 pM barcoded DNAs and 50 pM phiX control v3 DNAs (Illumina) were analyzed by high-throughput sequencing using an iSeq100 system following the manufacturer’s instructions. Resulting fastq files were processed to remove defined flanking regions, leaving only the 26-mer randomized region. The refined sequencing library was input into Sensitive, Thorough, Rapid, Enriched Motif Elicitation (STREME) v 5.5.31 to identify a consensus motif. Default STREME parameters were used, including shuffled input sequences as the control. The only deviation from the default parameters was the minimum motif width was set to 15, and the maximum motif width was set to 26. The position weight matrix in Supplementary Figure S2D was mapped to the Pseudomonas aeruginosa PAO1 VE13 uid 212,862 version 251 genome within the GenBank Bacteria Genomes and Proteins database using the Find Individual Motif Occurrences (FIMO) v 5.5.4.2 Default parameters were used for FIMO analysis, with a p-value cutoff of 1 × 10⁻⁵. Regulatory elements in gene promoters were predicted using Softberry BPROM (Solovyev and Salamov, 2011).3 Promoter prediction in P. aeruginosa was performed using SAPHIRRE. CNN.pseudmonas.4 Protein structure prediction was performed using the AlphaFold 3 server,5 and representative images were obtained using its default 3D visualization tool.
![[A] Two gel electrophoresis panels showing REPSA results for Round 1 and Round 10. Signs +/- and +/+ denote different conditions. Bands are labeled UC (upper) and C (lower). [B] Gel showing binding of PaCadR at different concentrations in Round 1 and Round 10, with bands labeled as](https://www.frontiersin.org/files/Articles/1608957/fmicb-16-1608957-HTML/image_m/fmicb-16-1608957-g001.jpg)
Figure 1. Identification of PaCadR preferred DNA binding sequences by REPSA. (A) REPSA was performed with 100 nM PaCadR. Results from Rounds 1 and 10 are shown. Uncut (UC) and cut (C) DNA bands are identified. Note the presence of an uncut DNA population in Round 10. (B) Input DNAs from Round 1 and Round 10 were incubated with 25, 50, or 100 nM PaCadR. Samples were analyzed by native PAGE and visualized using a LICOR Odyssey imager. Protein-bound (Bound) and unbound (Free) DNA complexes are identified. (C) DNAs from Round 10 of REPSA were analyzed by high-throughput sequencing and motif elucidation software. The most common and significant DNA motif is presented.
2.5 Biolayer interferometry
BLI was performed essentially as described previously (Barrows and Van Dyke, 2022), with minor changes. All BLI experiments were conducted using an Octet Red96e system (FortéBio), streptavidin-coated Dip and Read Biosensors (FortéBio), and the following reaction buffer: 20 mM Tris-Cl (pH 7.5), 100 mM NaCl, 0.01% Tween-20, and 1 mM DTT. The experimental setup included the following steps in sequential order: an initial 100 s startup step where biosensors were incubated with buffer, a 900 s DNA loading step where biosensors were incubated with ~100 ng 5′ biotin-labeled DNA templates, a 100 s baseline step where biosensors were incubated in buffer, a 500 s association step where biosensors were incubated with the indicated amount of PaCadR, and finally a 500 s dissociation step where biosensors were incubated in buffer. All steps were performed at 37°C. Shifts corresponding to association and dissociation steps were normalized to the shift observed at baseline immediately prior to association. These values were input into GraphPad Prism 9 and then graphed to create the curves shown in Figure 2B. Kd values were predicted using the nonlinear regression, association then dissociation model.
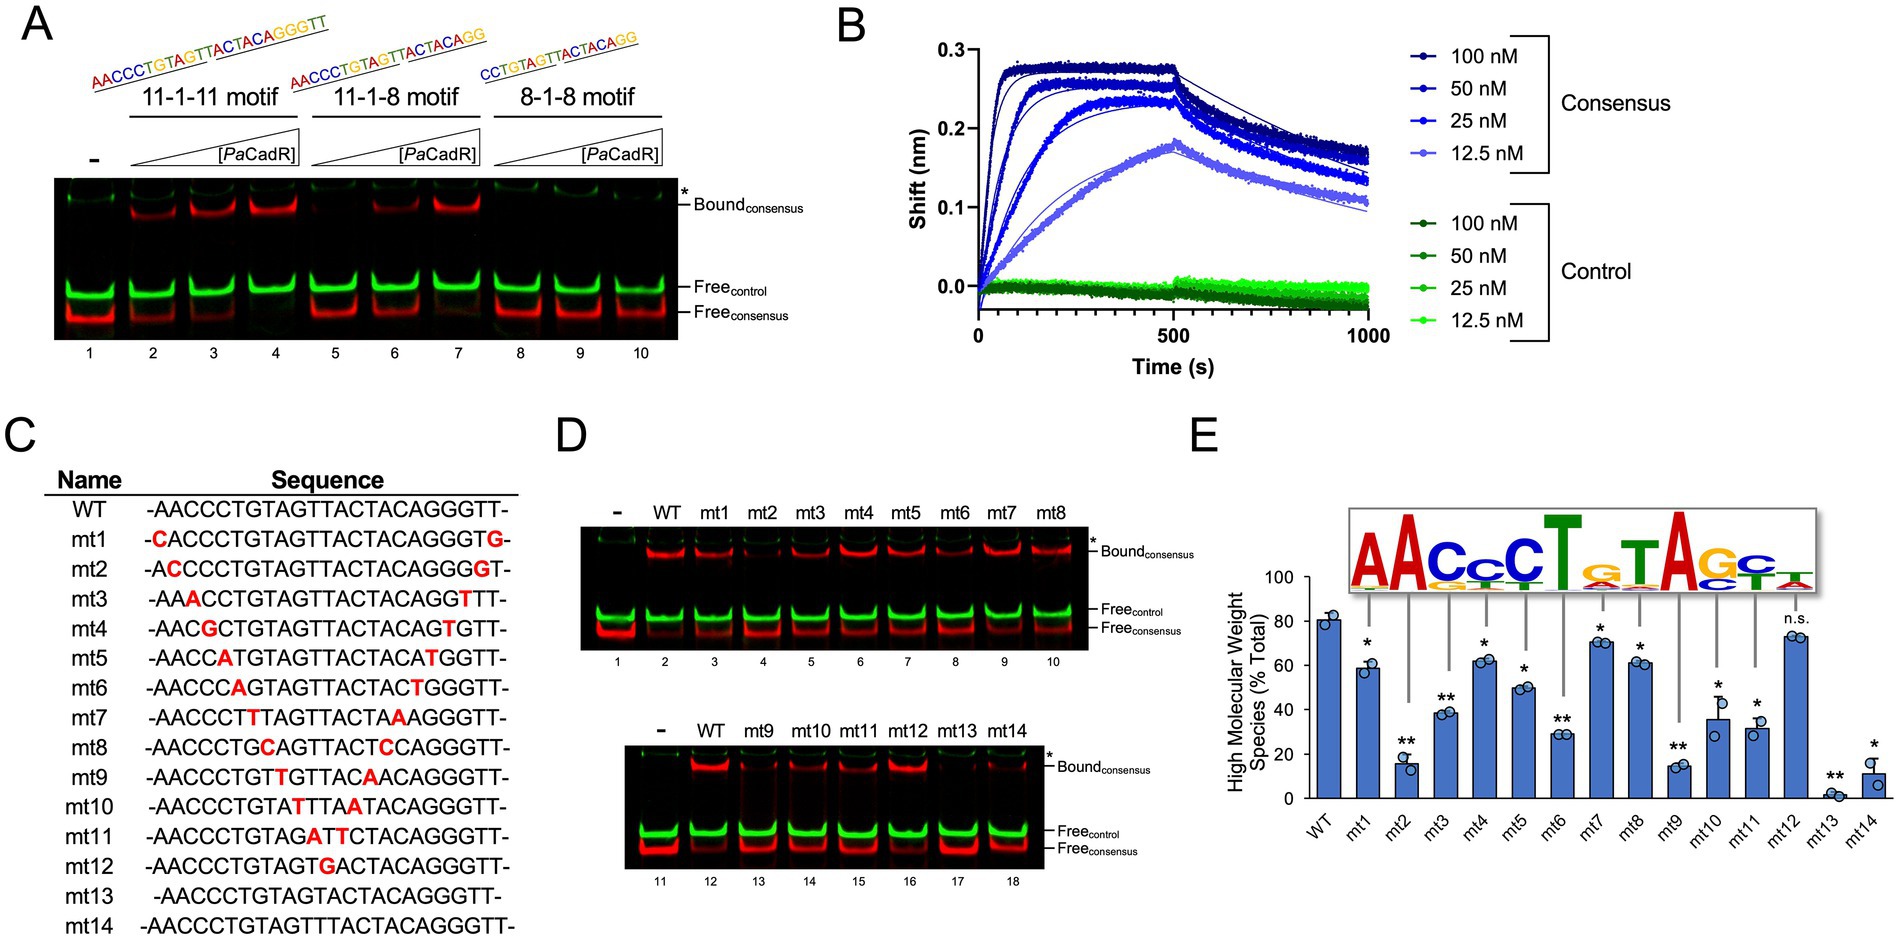
Figure 2. Mutational analysis of DNA binding sequence. (A) IRDye-700 labeled consensus sequence DNAs (red) and IRDye-800 labeled control DNA (green) were incubated with 20, 40, or 80 nM PaCadR. Samples were analyzed by native PAGE and visualized using a LICOR Odyssey imager. Protein-bound (Bound) and unbound (Free) DNA complexes are identified. (*) Nonspecific IRDye-800 PCR product. (B) Biolayer interferometry was performed with 5′ biotin-labeled consensus DNA (blue traces) and control DNA (green traces). At time <500 s, DNA-loaded biosensors were subject to solutions containing the indicated concentrations of PaCadR. At 500 s, biosensors were transferred to wells lacking PaCadR. Kinetic values were determined using GraphPad Prism 9. (C) List of mutant DNAs used in (D). Full-length oligos are presented in Supplementary File S1. Mutated nucleotides are bolded in red. Mutants 13 and 14 lack or add an additional nucleotide between the 11 bp inverted repeats, respectively. (D) IRDye-700 labeled consensus sequence DNAs (red) and IRDye-800 labeled control DNA (green) were incubated with 50 nM PaCadR. Samples were analyzed by native PAGE and visualized using a LICOR Odyssey imager. Protein-bound (Bound) and unbound (Free) DNA complexes are identified. (*) Nonspecific IRDye-800 PCR product. (E) Quantification of protein-bound species in (D). An overlay of one 11 bp inverted repeat from Figure 1C is presented. Each nucleotide position is aligned to its respective mutation. Error bars represent +1 standard deviation of two independent experiments. Student’s two-tailed t-test; N = 2; *p < 0.05 and **p < 0.005. Statistical analysis compared the binding of the indicated DNA template to the binding of the WT template.
2.6 Electromobility shift assay
EMSA reactions were performed in 1X CutSmart® buffer, 1 mM DTT, and 3 mM EDTA. Reactions contained 5 nM of each dsDNA template shown. To achieve the indicated concentration of PaCadR, the stock PaCadR solution was diluted with 1X CutSmart® buffer and added at 1/10th reaction volume. Reactions were incubated at 37°C for 20 min, and then 6× EMSA dye (20% glucose, 0.9% Orange G) was added at 1/5th reaction volume. Samples were separated by 10% native PAGE (4 V/cm for 15 min, then 8 V/cm until the dye front reached the bottom of the gel) and visualized using a LI-COR Odyssey imaging system.
2.7 Pseudomonas aeruginosa PAO1 strains, growth, and gene expression analysis
Reference and ΔcadR strains of P. aeruginosa PAO1, as well as the replicative plasmid, pME6001, and a pME6001 derivative containing the PaCadR promoter and coding region (pME6001-CadR), were generously gifted by Karl Perron, PhD (Ducret et al., 2020; University of Geneva, Geneva, Switzerland). To ectopically express a His-tagged CadR protein, we designed a gene fragment (GenScript®) containing ~260 bp upstream of cadR and the PaCadR coding sequence, which included a -GSSHHHHHHSM- insertion after the initial methionine. The complete sequence is presented in Supplementary File S2, and it was cloned into pME6001 using BamHI and HindIII sites to create pME6001-HisCadR.
To create electrocompetent P. aeruginosa cells, strains were inoculated into 3 mL LB media in glass tubes and grown for 16 h at 37°C and 180 RPM, angled at ~45°. 1 mL of the culture was then pelleted and washed twice with 1 mL 300 mM D-sucrose. Cells were then resuspended in 100 μL 300 mM D-sucrose, and 100 ng pME6001 or its derivatives were electroporated into the indicated strain using a Gene Pulser Xcell (Bio-Rad) with pulse settings: 25 μF; 200 Ω; 2.5 kV. 1 mL of LB medium was added directly to the pulse cuvette, pipetted up and down, then the cells were transferred to a glass tube and shaken for 1 h at 37°C. Transformed cells were selected on LB-agar plates containing 50 μg/mL gentamicin.
To confirm cadR deletion in the ΔcadR strain, genomic DNA from reference and ΔcadR strains was isolated from streaked colonies using a Quick-DNA Fungal/Bacterial Miniprep kit (Zymo Research) following the manufacturer’s instructions. Resulting DNAs were amplified using the IVT_CadR/A_L1 and IVT_CadR/A_R1 primers to identify cadR and gPCR_fur_L and gPCR_fur_R primers to identify a genomic region upstream of fur (PA2384; Supplementary Figure S3).
For gene expression analysis, glycerol stocks of each experimental strain were streaked onto LB-agar plates and grown for 16 h at 37°C. For strains containing pME6001 or its derivatives, 50 μg/mL gentamicin was used in solid and liquid media. Single colonies were inoculated into 3 mL LB media in glass tubes and grown for 16 h at 37°C and 180 RPM, angled at ~45°. Where indicated, cultures were supplemented with 100 μM CdCl2 or 100 μM ZnSO4 for 10 min. Then, 1 mL of culture was pelleted and placed on ice. RNA from each sample was isolated within 1 h of cell pelleting. RNA isolation was performed using a Quick-RNA Fungal/Bacterial Miniprep kit (Zymo Research). The resulting nucleic acid was treated with 5 units DNase I (Zymo Research) for 15 min at room temperature, then purified using an RNA Clean & Concentrator kit (Zymo Research). qPCR reactions were performed using iTaq Universal SYBR Green One-Step Kit (Bio-Rad) in 10 μL reactions containing 20 ng purified RNA, 250 nM primers, 5 μL iTaq Universal SYBR Green Supermix, and 0.125 μL iScript Reverse Transcriptase. The thermocycler set up was as follows: 50°C, 10 min; 95°C, 1 min; (95°C, 10 s; 60°C, 30 s; fluorescent reading) × 39 cycles with an associated melt curve. Gene expression was normalized to the pyruvate dehydrogenase E1 component gene (aceE/PA5015). The efficiencies for each primer set used for qPCR are presented in Supplementary Figure S4.
2.8 Chromatin immunoprecipitation
Single colonies of ΔcadR P. aeruginosa PAO1 containing a His-CadR expression vector (pME6001-HisCadR) were inoculated into 35 mL LB containing 50 μg/mL gentamicin and grown at 37°C, 180 RPM for 16 h. 10 mL of the culture was pelleted, resuspended in 1 mL PBS (137 mM NaCl, 2.7 mM KCl, 10 mM Na2HPO4, and 1.8 mM KH2PO4) containing 1% formaldehyde, then rotated for 10 min at room temperature. 137 μL of 1 M glycine-NaOH (pH 7.5) was added, then the mixture was rotated for 30 min at 4°C. The cells were pelleted, washed twice with 1 mL IMAC Buffer (20 mM sodium phosphate, 300 mM NaCl, 10 mM imidazole, pH 7.4), and then resuspended in 1 mL IMAC Buffer. The cells were then sonicated at 2.5 W, 10 s on/50 s off. This was repeated five times; then, the mixture was centrifuged for 10 min at 16,000 × g and 4°C. The lysate was collected, and 10 μL was stored on ice as an INPUT sample. NEBExpress® Ni-NTA Magnetic Beads (NEB) were obtained and gently vortexed to resuspend. 50 μL of the bead slurry was washed twice with 200 μL IMAC buffer and then added to the lysate. The mixture was rotated for 30 min at room temperature; then, the beads were washed thrice with 500 μL IMAC buffer. 50 μL of elution buffer (20 mM sodium phosphate, 300 mM NaCl, 500 mM imidazole, pH 7.4) was added to the beads and gently mixed for 2 min. 40 μL of elution buffer was added to the INPUT sample, and then both samples were incubated at 65°C for 16 h to reverse crosslinks. The resulting DNA was purified using the DNA Clean & Concentrator-5 kit (Zymo Research) and analyzed by qPCR.
2.9 In vitro transcription
Promoter templates were designed to include sequences ~250 nt upstream and ~250 nt downstream of the indicated translation start site and were amplified by PCR from the P. aeruginosa PAO1 genome (see Supplementary File S1 for primer sequences). The resulting templates were purified using a DNA Clean & Concentrator-5 kit (Zymo Research). In vitro transcription assays were performed in 1X E. coli RNAP reaction buffer (NEB) containing 0.3 mM NTPs, 100 nM promoter template, and 0.1 U/μL E. coli RNAP holoenzyme (NEB). Where indicated, reactions contained 4 μM PaCadR and/or 100 μM CdCl2. Reactions were incubated at 37°C for 20 min, then 4 μL samples were treated with 0.5 units DNase I (Zymo Research) for 5 min at room temperature. Samples were then diluted 2-fold with 2X RNA Loading Dye (NEB). Prior to gel electrophoresis, samples were heated at 75°C for 5 min and then placed on ice for 2 min. Samples were separated by 5% TBE-urea PAGE (16 V/cm for 30 min) and visualized with SYBR Gold staining (Molecular Probes). To differentiate cadR and cadA RNA transcripts, templates of varying lengths were developed, and changes in output RNA length were determined (Supplementary Figure S5).
3 Results
3.1 Identification of the PaCadR DNA binding sequence
Previous studies have characterized a single genomic binding site for CadR from P. aeruginosa PAO1 (Brocklehurst et al., 2003; Ducret et al., 2020; referred to hereafter as PaCadR). However, whether PaCadR binds multiple genomic locations is unknown. To uncover all potential genomic binding sequences, we first sought to identify a consensus DNA binding motif for PaCadR using REPSA. Recombinant PaCadR was purified using immobilized metal affinity chromatography, followed by TEV protease-dependent cleavage to remove a 6x histidine tag (Supplementary Figure S1). In the first round of REPSA, the addition of PaCadR had no noticeable effect on the IISRE-dependent cleavage of selection template DNAs. However, by Round 10, we identified a cleavage-resistant population of DNA sequences that only occurred when incubated with PaCadR (Figure 1A). The emergence of a protected DNA population in later rounds of REPSA suggests the identification of preferred PaCadR binding sequences. To test the specificity of PaCadR to our REPSA-identified DNAs, we performed an electromobility shift assay (EMSA) using DNAs from Round 1 or Round 10 of REPSA (Figure 1B). DNAs from Round 10 showed a PaCadR-dependent shift that was not present with Round 1 DNAs, thereby confirming PaCadR association.
To determine PaCadR-specific DNA binding motifs, Round 10 DNAs were barcoded with sequences suitable for Illumina-based technologies (Nextera XT) and sequenced using an iSeq100 system. The resulting reads (153,845 total) were trimmed to include only the original internal cassette of random nucleotides from our selection template DNAs (26 nt in length). Motif elucidation was performed using Sensitive, Thorough, Rapid, Enriched Motif Elicitation (STREME) software from the MEME suite (Bailey et al., 2015). The most common and significant motif produced from this output, shown in Figure 1C, had a significance E-value of 5.0 × 10−3233 and was found in over 59% of input sequences. This motif can be described as pseudo-palindromic, containing a 17 bp inverted repeat with 8 bp repeat units from positions 6–13 and 15–22, which likely represents the preferred DNA binding motif for PaCadR.
3.2 Validation and mutational analysis of the consensus DNA binding sequence
To validate PaCadR binding to our REPSA-identified motif, we developed consensus DNA sequences containing the highest nucleotide count found at each position in the position weight matrix from Figure 1C. The presented motif is pseudo-palindromic, where positions 3–5 in the sequence motif contain nucleotides with high counts that are not reciprocated at the end of the motif (hypothetical positions 23–25). Therefore, we first tested the binding affinity of PaCadR to a complete 11-1-11 palindromic sequence (AACCCTGTAGTTACTACAGGGTT), the 11-1-8 sequence present in the Figure 1C motif (AACCCTGTAGTTACTACAGG), and a minimal 8-1-8 palindromic sequence (CCTGTAGTTACTACAGG). To do so, we created DNA constructs containing each sequence and assayed PaCadR binding by EMSA. PaCadR bound to the 11-1-11 construct with the highest affinity yet still showed appreciable binding toward the 11-1-8 sequence (Figure 2A, red). However, incubation with the 8-1-8 sequence yielded little to no detectable binding. For each EMSA reaction, PaCadR showed no apparent affinity to a control DNA that contained identical flanking regions as our consensus sequences (used for PCR amplification), yet a unique internal DNA sequence (Figure 2A, green). This result suggests PaCadR preferentially binds a full palindromic sequence consisting of two 11 bp repeat units separated by one nucleotide.
When analyzing PaCadR binding by EMSA, we observed a single shifted DNA band when complexed with PaCadR (see “Bound” species in Figure 2A). Currently studied MerR homologs bind DNA as a homodimer to exert their transcription regulatory functions (Liu et al., 2019), although other bacterial metalloregulatory transcription factors have been shown to bind target DNA sequences as a dimer of dimers or higher-order oligomers (Baichoo and Helmann, 2002; Choi et al., 2024; Dwarakanath et al., 2012). To confirm the oligomer state of DNA-bound PaCadR, we utilized an adaptation of a Ferguson plot (Orchard and May, 1993; Supplementary Figure S6). We found the apparent weight of DNA-bound PaCadR to be ~38 kDa, which is consistent with dimeric binding (the estimated molecular weight of PaCadR homodimer is ~36 kDa). Similarly, we found that purified PaCadR exists predominantly as a homodimer in solution (Supplementary Figure S7).
To further analyze binding kinetics, we assayed PaCadR binding to the 11-1-11 consensus sequence by biolayer interferometry (BLI). When consensus DNA sequences were probed with PaCadR, we observed sensogram-type signal amplitudes (i.e., wavelength shifts) consistent with PaCadR binding that were retained after extensive dilution (Time > 500 s; Figure 2B, blue traces). Kinetic analysis of this interaction yielded a dissociation constant, KD, of ~3 nM. DNA binding kinetics have not been performed for other CadR homologs; however, our low nanomolar KD value is consistent with a previous finding for a MerR regulator (Shewchuk et al., 1989). When BLI was performed with DNAs containing a control sequence with an internal DNA sequence having no homology to the consensus sequence, we observed no apparent shift in wavelength (Figure 2B, green traces). Collectively, these data show high-affinity binding of PaCadR to its REPSA-identified consensus DNA sequence.
The position weight matrix identified by STREME indicates the relative abundance of nucleotides at a certain position based on input sequences. Often, the more frequently a particular nucleotide is found in the same position, the more likely that nucleotide is critical for promoting a protein-DNA interaction. To formally address this, we created point mutations in each inverted repeat of the PaCadR consensus motif (Figure 2C) and assayed binding by EMSA (Figure 2D). Each mutation contained the least common nucleotide found at that position based on the position weight matrix. Every mutation occurring within the 11 bp repeat regions significantly reduced PaCadR binding compared to the wild-type (WT) consensus sequence at the tested PaCadR concentration (Figures 2D,E). As expected, the mutations within this region that affected binding the most occurred at positions containing the highest single nucleotide counts (Figure 2E, mts 2, 6, and 9). Removing the linker bp between the repeat regions (mt13) or adding an additional linker bp (mt14) also significantly reduced PaCadR binding. The only mutation that did not significantly alter PaCadR binding was mutating the linker nucleotide itself, even though the position weight matrix from REPSA suggested either a T or A preference at that position (Figure 1C, position 14; Figure 2E, mt 12). Altogether, these data suggest that the position weight matrix in Figure 1C accurately models the relative importance of each nucleotide in promoting a DNA-PaCadR interaction.
3.3 Identification and validation of genomic binding sequences
To identify potential genomic PaCadR binding sequences, we input the position weight matrix from the PaCadR consensus binding motif into Find Individual Motif Occurrences (FIMO) software (Grant et al., 2011) to scan the P. aeruginosa PAO1 genome. To create a complete position weight matrix for the 11-1-11 motif, we supplemented the 8 bp repeat unit from the STREME output in Figure 1C with the inverse of the three additional nucleotide counts from the full 11 bp repeat unit (Supplementary Figure S2). The output of the FIMO analysis with a cutoff significance E-value of 6 × 10⁻⁷ is presented in Table 1. Two genomic sequences significantly matched the input motif with a p < 1 × 10⁻⁹. As expected, one sequence (gDNA1_cadA/R) was found in the promoter region of the Cd2+/Zn2+-specific exporter, cadA (PA3690), which is regulated by PaCadR (Brocklehurst et al., 2003; Ducret et al., 2020). The other sequence (gDNA2) was not found within −200/+20 bp of a transcription start site, the most common region to find binding sites for bacterial transcription factors. The next most significant sequences had p-values over two orders of magnitude lower than the previous and were mostly found over 200 bp away from transcription start sites.
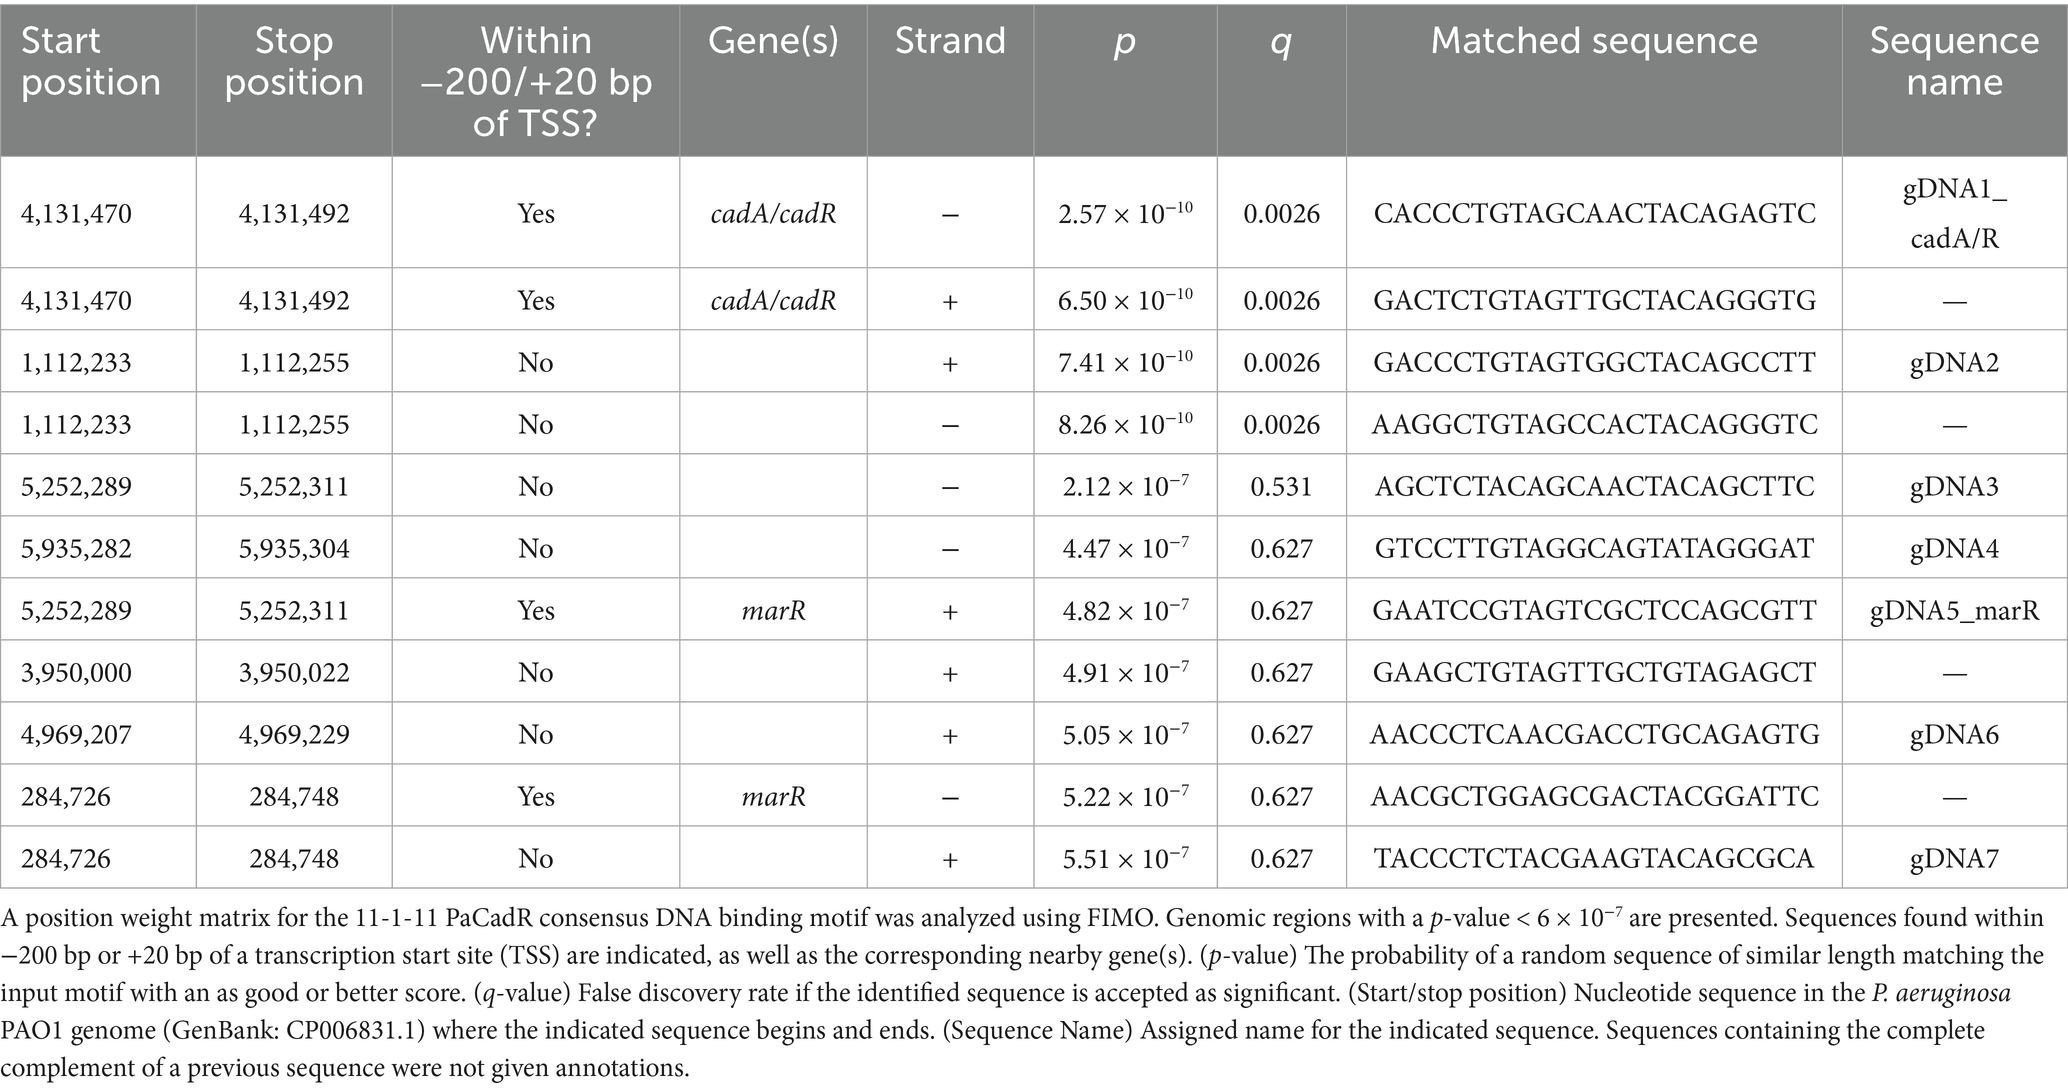
Table 1. FIMO analysis of REPSA-identified motif.
To validate PaCadR binding to these genomic regions in vitro, we developed DNA templates that contained each genomic sequence presented in Table 1 and assayed PaCadR binding by EMSA. We observed high affinity binding to the two most significant, FIMO-identified, genomic sequences (gDNA1_cadA/R and gDNA2; Figure 3A), which was comparable to PaCadR binding to its REPSA-identified consensus sequence (compare Figures 2A, 3A). Conversely, PaCadR exhibited little to no affinity toward the remaining DNAs from Table 1 (Supplementary Figure S8). This result identifies two genomic binding sequences for PaCadR and highlights its apparent sequence specificity.
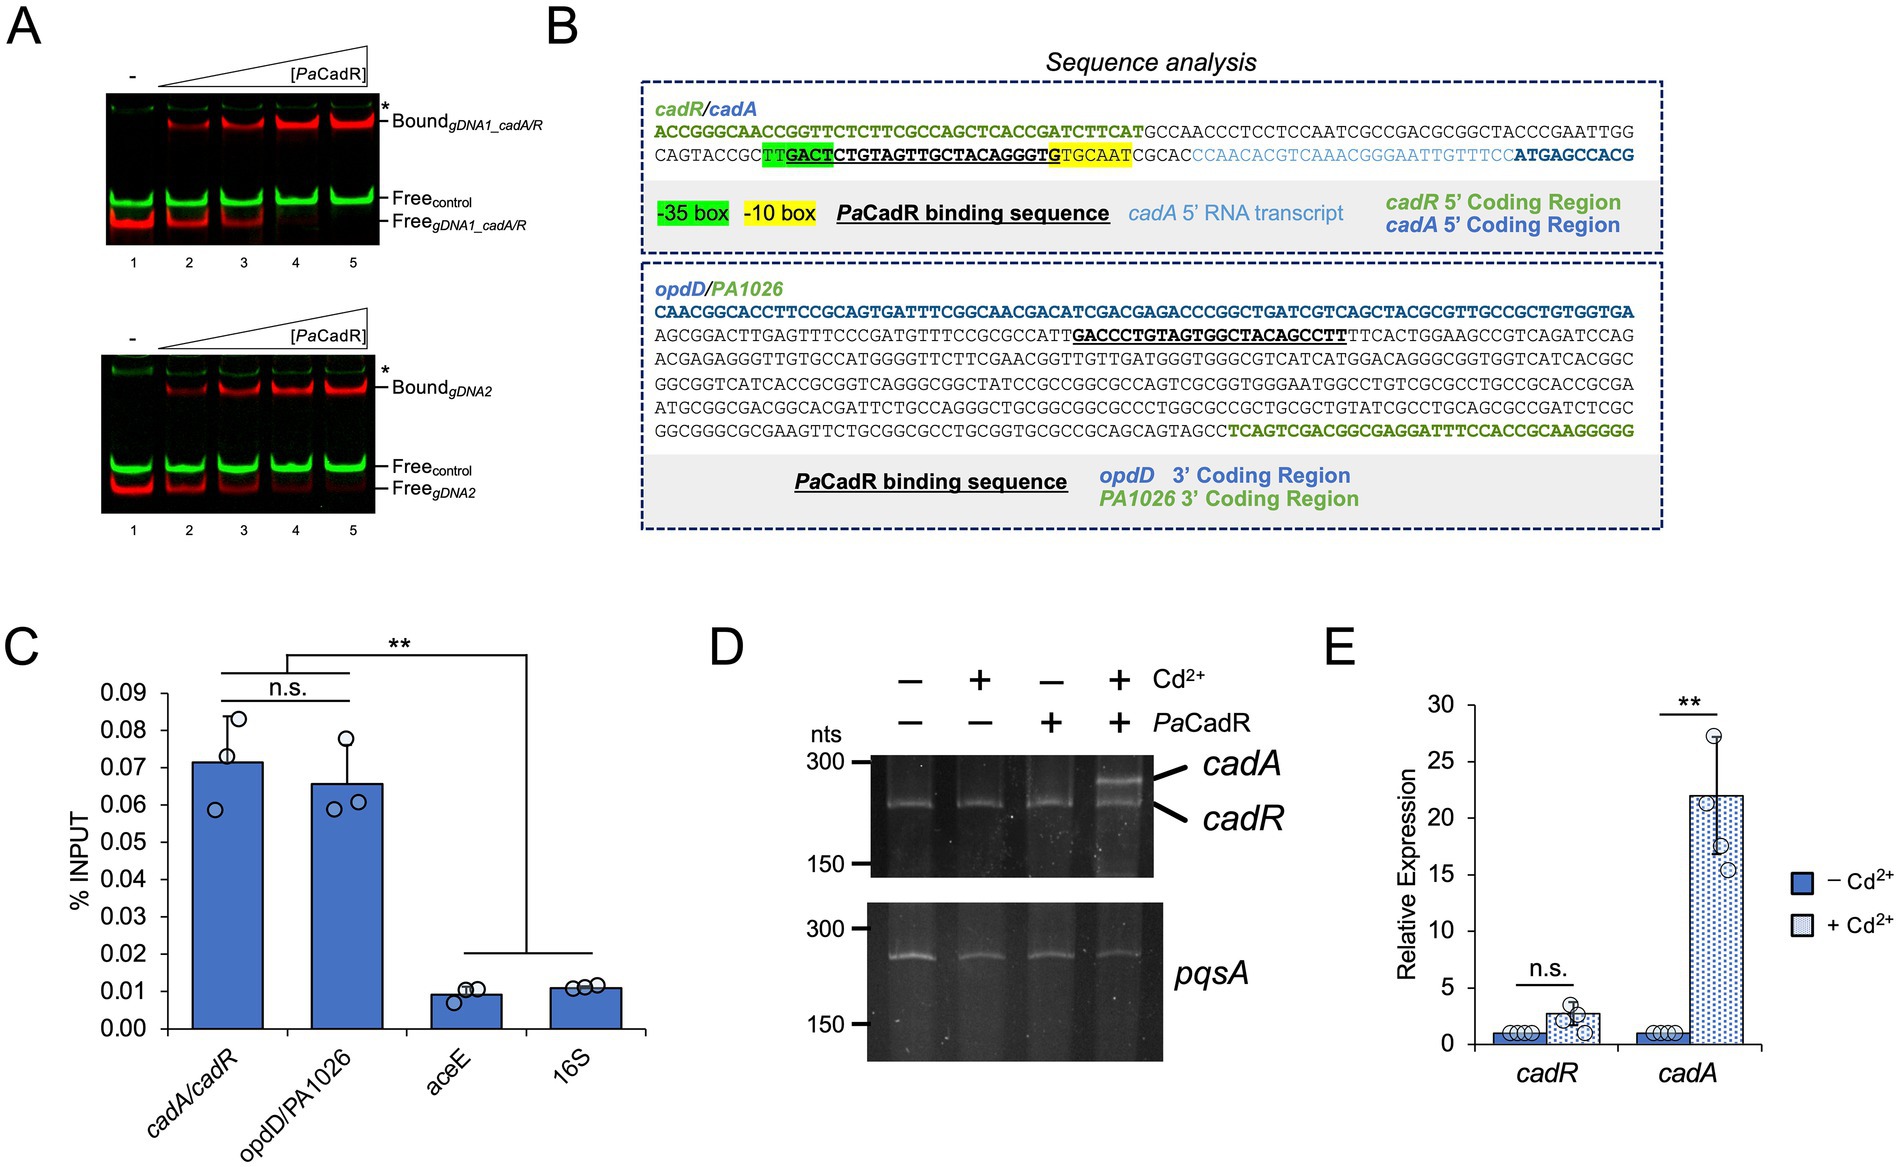
Figure 3. Validation of genomic binding sequences and in vitro analysis of cadR autoregulation. (A) IRDye-700 labeled genomic DNA (red) and IRDye-800 labeled control DNA (green) were incubated with 20, 40, 80, or 160 nM PaCadR. Samples were analyzed by native PAGE and visualized using a LICOR Odyssey imager. Protein-bound (Bound) and unbound (Free) DNA complexes are identified. (*) Nonspecific IRDye-800 PCR product. (B) Analysis of genomic regions containing PaCadR binding sequences. −10, −35, and transcription start sequences were predicted using SoftBerry BPROM. (C) DNA regions bound to ectopically expressed, His-tagged PaCadR were purified by ChIP and analyzed by qPCR. Recovered DNAs are presented as a percentage of input DNAs, which were not subject to metal affinity chromatography. Error bars represent +1 standard deviation of three independent experiments. Student’s two-tailed t-test; p > 0.2 (n.s.), **p < 0.005. (D) In vitro transcription reactions were performed containing 0.1 U/μL E. coli RNA polymerase holoenzyme, 100 nM of the cadA/cadR or pqsA promoter template, and 4 μM PaCadR or buffer control. Where specified, reactions contained 100 μM CdCl2. Samples were treated with DNase I and then separated by denaturing PAGE. RNA was visualized by SYBR Gold staining. (E) RNA was isolated from P. aeruginosa PAO1 before and after a 10-min treatment with 100 μM CdCl2. Gene expression for cadR and cadA was quantified by RT-qPCR and normalized to the expression of aceE (pyruvate dehydrogenase E1 component, PA5015). Values are presented relative to expression prior to CdCl2 addition. Error bars represent +/− 1 standard deviation between four independent experiments. Student’s two-tailed t-test with unequal variance; p > 0.05 (n.s.), **p < 0.005.
To further study the in vitro-validated PaCadR genomic binding sequences, we analyzed each sequence in relation to nearby genes and predicted promoter elements (Figure 3B). The previously established PaCadR binding sequence in the cadA promoter is positioned in between the −35 and −10 elements, typical of a MerR regulator. In P. aeruginosa, the cadR gene is found upstream of the cadA gene, transcribed in the opposite direction. No obvious promoter elements were identified for the cadR gene using prediction software, and whether PaCadR regulates its own promoter has not been formally addressed. The second PaCadR binding sequence was found within a 376 bp, intergenic region between converging genes, opdD (PA1025) and an uncharacterized transcription elongation factor (PA1026). To validate PaCadR binding to these genomic sequences in vivo, we performed ChIP using P. aeruginosa PAO1 strains expressing a 6x-histidine tagged CadR construct (Supplementary Figure S9). When compared to control DNA regions (aceE and 16S rRNA genes), we observed significantly increased recovery of DNA containing the cadR/cadA promoter as well as the intergenic region between opdD and PA1026 (Figure 3C). Collectively, this data validates PaCadR-binding to two genomic sequences in vivo.
3.4 PaCadR does not regulate its own promoter in vitro
PaCadR-dependent regulation of cadA has been shown previously (Brocklehurst et al., 2003; Ducret et al., 2020). However, autoregulation of cadR has not been extensively studied. To address this, we developed an in vitro transcription assay using E. coli RNA polymerase holoenzyme and a DNA template containing 5′ coding and promoter regions for P. aeruginosa PAO1 cadR and cadA. DNA templates with different lengths were initially used to differentiate between cadR and cadA transcripts (Supplementary Figures S5A,B). A control sequence containing the promoter and 5′ coding region from pqsA was also used. RNA expression from the pqsA promoter occurred regardless of Cd2+ or PaCadR addition (Figure 3D). As expected, expression from the cadA promoter dramatically increased when both PaCadR and Cd2+ were added to the reaction (Figure 3D). Conversely, the expression of cadR was not altered with the addition of PaCadR and Cd2+. This result demonstrates PaCadR-dependent transcription activation in vitro and suggests PaCadR does not regulate gene expression from its own promoter. Furthermore, when cultures of P. aeruginosa PAO1 were treated with Cd2+, expression of cadA, but not cadR, increased significantly (Figure 3E). Together, these data suggest PaCadR does not autoregulate cadR expression.
3.5 Regulation of an uncharacterized zinc ribbon domain-containing protein transcript
Since MerR regulators often bind promoter regions, we were surprised to identify a PaCadR binding site within an intergenic region between two converging genes (Figure 3B). We postulated that a previously uncharacterized promoter may be present in this region. MerR regulators can activate the expression of genes whose promoters contain regulatory elements (i.e., the −10 and −35 sequences) that are spaced too far apart for recognition by RNA polymerase holoenzyme. MerR binding distorts the DNA double helix and pulls the recognition sequences closer together, thus leading to gene expression. This distortion can be mimicked in vitro by removing nucleotides between these promoter recognition sequences (Parkhill and Brown, 1990). To test whether PaCadR may activate a dormant promoter within the opdD and PA1026 intergenic region, we input a 60 nt region containing the PaCadR binding sequence into Pseudomonas promoter prediction software (Coppens and Lavigne, 2020; Figure 4A). As expected, the unaltered sequence did not identify a Pseudomonas promoter. However, as we removed nucleotides from the middle of the PaCadR binding sequence, thus mimicking CadR-dependent DNA distortion, promoter sequences were identified. The most significant promoter sequence was identified when two nucleotides were removed from the PaCadR binding sequence. Similar results were observed when a promoter analysis was conducted using the cadA promoter sequence (Supplementary Figure S10). This result suggests the presence of a non-coding RNA or an open reading frame within the opdD and PA1026 genes.
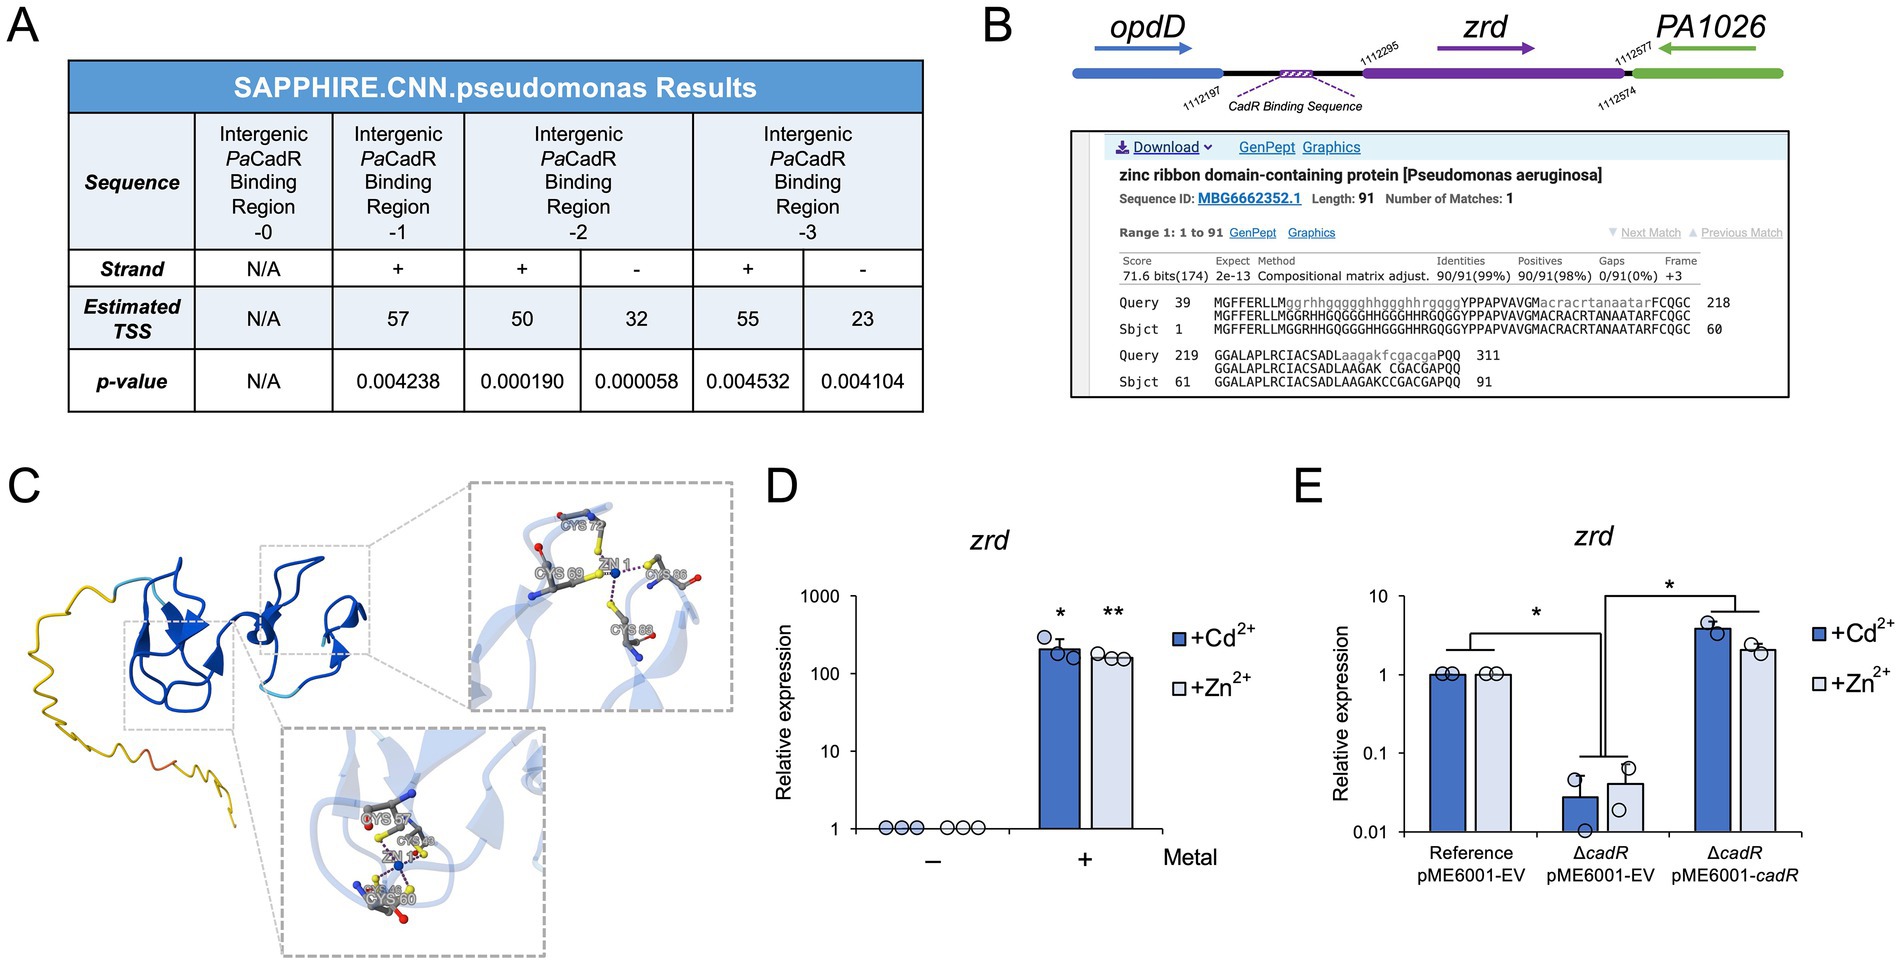
Figure 4. PaCadR activates the expression of an uncharacterized transcript. (A) A 60 nt region containing the PaCadR binding sequence between converging genes, opdD and PA1026, was analyzed by SAPPHIRE promoter prediction software. Where indicated, one, two, or three nucleotides from the center of the PaCadR binding sequence were removed. (N/A) no promoter elements with a p < 0.05 were found. (Strand) promoter sequences were found on submitted DNA sequence (+) or complementary sequence (−). (Estimated TSS) the predicted transcription start site of the indicated promoter. (B) (Top) A model depicting the genomic location of zrd in relation to opdD and PA1026. Nucleotide positions correspond to the P. aeruginosa PAO1 genome. (Bottom) blastx result from a nucleotide query containing the region between the PaCadR binding sequence and PA1026 coding region. (C) AlphaFold 3 output for the amino acid sequence shown in (B), as well as two zinc ions. Residues involved in zinc coordination are shown in detail. (D) RNA was isolated from P. aeruginosa PAO1 before and after a 10-min treatment with 100 μM CdCl2 or 100 μM ZnSO4. Gene expression for zrd was quantified by RT-qPCR and normalized to the expression of aceE (pyruvate dehydrogenase E1 component, PA5015). Values are relative to the expression before metal addition. Statistical analysis compared the indicated sample to the sample before metal addition. Error bars represent one standard deviation between three independent experiments. Student’s two-tailed t-test with unequal variance: *p < 0.05 and **p < 0.005. (E) RNA was isolated from the indicated P. aeruginosa PAO1 strains after a 10-min treatment with either 100 μM CdCl2 or 100 μM ZnSO4. Gene expression for zrd was quantified by RT-qPCR and normalized to the expression of aceE (pyruvate dehydrogenase E1 component, PA5015). Values are relative to the reference strain containing the empty pME6001 vector (pME6001-EV). Error bars represent one standard deviation between two independent experiments. When comparing the Reference pME6001-EV strain to the ΔcadR pME6001-EV strain, a Student’s two-tailed t-test with unequal variance was used. When comparing the ΔcadR pME6001-EV strain to the ΔcadR pME6001-CadR strain, a Student’s two-tailed t-test with equal variance was used. *p < 0.05.
To identify a potential open reading frame in this region, we analyzed the intergenic DNA sequence between the PaCadR binding sequence and PA1026 by BLAST (blastx; Figure 4B). The results identified an open reading frame encoding a zinc ribbon domain-containing protein (referred to hereafter as “Zrd”) that has been identified in more recent annotations of P. aeruginosa genomes but was not included in the P. aeruginosa PAO1 annotation. The coding region of this potential protein product is found downstream of the PaCadR DNA binding sequence, suggesting PaCadR regulates its expression (Figure 4B). Zinc ribbons, a subgroup of zinc finger domains, are found throughout eukaryotic and prokaryotic proteins and are often identified in nucleic acid-binding proteins (Krishna et al., 2003; Malgieri et al., 2015). zrd exhibits two zinc ribbon motifs (CXXC-N10-CXXC) likely allowing for coordination of two metal ions per protein monomer. To analyze the structure of the potential Zrd protein product, we used AlphaFold 3 (Abramson et al., 2024). This predicted structure shows a disordered N-terminus region along with an ordered C-terminus that contains two, Cys4 metal coordination sites, consistent with dual zinc ribbon domains (Figure 4C). To our knowledge, the zrd open reading frame has only been predicted computationally, and no experimental work on this genomic region has been conducted in P. aeruginosa.
We sought to determine if zrd expression was controlled by PaCadR. First, we found that zrd was activated in response to both Cd2+ and Zn2+ in vivo (Figure 4D), consistent with CadR-regulated genes (Brocklehurst et al., 2003; Ducret et al., 2020). To formally implicate PaCadR in zrd regulation, we analyzed gene expression in response to Cd2+ or Zn2+ in the reference and ΔcadR P. aeruginosa PAO1 strains containing different plasmids. In response to either metal, reference strains exhibited significantly higher expression levels of zrd compared to ΔcadR strains (Figure 4E). Activation of zrd was completely rescued when ΔcadR strains were supplemented with an expression plasmid containing the PaCadR coding sequence (Figure 4E). As a positive control, we observed similar results for cadA expression (Supplementary Figure S11A), and the reconstituted expression of cadR was validated by qPCR (Supplementary Figure S11B). These results show that the increased expression of zrd in response to Cd2+ or Zn2+ is controlled by PaCadR, thus adding a new member to the PaCadR regulon. Together, these findings provide an initial characterization of a new metal-responsive open reading frame in P. aeruginosa.
4 Discussion
In this study, we identified the preferred DNA binding sequence for a CadR homolog in P. aeruginosa PAO1 using the in vitro iterative selection approach, REPSA (Figures 1A–C). REPSA can be performed with untagged, recombinant transcription factors where the DNA-protein interaction does not have to survive affinity purification or gel electrophoresis, thus providing several advantages to other iterative selection approaches. Indeed, a previous study was unsuccessful in identifying a preferred DNA binding sequence of 6xHis-tagged PaCadR by high throughput-SELEX, albeit the researchers only conducted 4 rounds of selection (Wang et al., 2021). Here, we observed the successful selection of PaCadR binding sequences by Round 10 of REPSA. Using high throughput sequencing, motif elucidation, and in vitro binding validation, we found PaCadR preferentially binds a 23 bp inverted repeat consisting of 11 bp repeat units separated by 1 bp. Our 11-1-11 binding motif shows strong similarities, as well as minor differences, to the predicted CadR binding motif from the Pseudomonadaceae family in RegPrecise (Novichkov et al., 2013),6 which is built using predicted and validated genomic binding sequences. The remarkable similarities between these motifs highlight REPSA as a legitimate tool for determining preferred DNA binding sequences, while the differences potentially underscore genus- or species-specific DNA binding preference. Notably, the DNA binding specificity of CadR homologs seems to be evolutionarily conserved throughout Pseudomonadota, as a similar 10-1-10 binding motif has been predicted for CadR homologs in Alphaproteobacteria, Betaproteobacteria and Gammaproteobacteria (Supplementary Figure S12).
By mapping our 11-1-11 consensus DNA binding motif to the P. aeruginosa PAO1 genome, we identified two genomic sequences that PaCadR bound with high affinity (Table 1). One of these sequences was found upstream of the Cd2+/Zn2+-specific exporter, cadA, for which CadR-dependent regulation has been validated previously (Brocklehurst et al., 2003; Ducret et al., 2020). However, cadA and cadR are divergent genes, and autoregulation of cadR has not been thoroughly studied in P. aeruginosa. Using an in vitro transcription system, we show expression of cadA, but not cadR, was specifically activated in the presence of Cd2+ and PaCadR (Figure 3D). We also show expression of cadR is not activated by Cd2+ in vivo and previous studies have shown expression of cadR is not activated by Zn2+ (Ducret et al., 2020), further discounting autoregulation of cadR.
A second PaCadR binding sequence was found within an intergenic region between two converging genes. Using promoter prediction software and BLAST, we identified an uncharacterized open reading frame in this region that is controlled by PaCadR. This gene is predicted to encode a small protein containing two zinc ribbon domains, which we have called Zrd. We show transcription of zrd is induced by either Zn2+ or Cd2+ in vivo, and this activation is mediated by PaCadR (Figures 4D,E). AlphaFold prediction of Zrd structure showed a highly disordered N-terminus region (Figure 4C). While intrinsically disordered domains can have important biological functions, we cannot rule out the use of a downstream translation start site that only translates the zinc ribbon domains.
Based on the structural prediction and gene expression results, Zrd exhibits several similarities to the metallothionein family of proteins. Metallothioneins are found throughout all domains of life and include small, cysteine-rich proteins that function in sequestering metal ions, thereby protecting the cell from heavy metal toxicity (Yang et al., 2024). Bacterial metallothioneins often contain at least one polynuclear metal cluster, as exemplified by SmtA (Blindauer et al., 2001), whereas Zrd is predicted to contain only mononuclear metal-binding sites (Figure 4C). A similar polynuclear cluster to SmtA is shown in Pseudomonas metallothioneins (Habjanič et al., 2020), and a previously characterized metallothionein in P. aeruginosa, PmtA, appears to play a role in biofilm formation and protecting against oxidative stress (Thees et al., 2021). Given zrd activation in response to excess Zn2+ or Cd2+, a plausible model is that metal-bound CadR activates zrd expression leading to Zn2+/Cd2+ coordination through Zrd’s two Cys4 metal-binding sites. Metal coordination by Zrd could function as a mode of sequestration, thereby reducing the intracellular pool of free Zn2+/Cd2+ ions. This proposed mechanism, in conjunction with increased Zn2+/Cd2+ export through CadR-dependent activation of cadA expression, would likely help alleviate metal toxicity. Although this study uncovers the genetic regulation of zrd, future work will help establish the biological function of its protein product and determine how Zrd contributes to metal homeostasis in P. aeruginosa.
Data availability statement
The original contributions presented in the study are included in the article/Supplementary material, further inquiries can be directed to the corresponding author.
Ethics statement
The manuscript presents research on animals that do not require ethical approval for their study.
Author contributions
JB: Writing – review & editing, Investigation, Methodology, Funding acquisition, Conceptualization, Writing – original draft. RW: Investigation, Writing – review & editing. AW: Investigation, Writing – review & editing. KS: Investigation, Writing – review & editing. MR-G: Funding acquisition, Writing – review & editing. MVD: Funding acquisition, Writing – review & editing, Project administration, Data curation, Conceptualization.
Funding
The author(s) declare that financial support was received for the research and/or publication of this article. This work was supported by the U.S. National Science Foundation (grant no. 2041202) and the Department of Health and Human Services, National Institutes of Health, National Institute of General Medical Sciences (grant no. 1R16GM154191). This work was supported by the Office of Undergraduate Research at Kennesaw State University through the Sophomore Scholars and Summer Undergraduate Research programs. RW was supported by an NIH U-RISE Grant, 1T34GM140948-01A1 (PI: MR-G).
Acknowledgments
The authors thank Karl Perron, PhD, for his generosity and insight regarding P. aeruginosa PAO1 strains.
Conflict of interest
The authors declare that the research was conducted in the absence of any commercial or financial relationships that could be construed as a potential conflict of interest.
Generative AI statement
The authors declare that no Gen AI was used in the creation of this manuscript.
Publisher’s note
All claims expressed in this article are solely those of the authors and do not necessarily represent those of their affiliated organizations, or those of the publisher, the editors and the reviewers. Any product that may be evaluated in this article, or claim that may be made by its manufacturer, is not guaranteed or endorsed by the publisher.
Supplementary material
The Supplementary material for this article can be found online at: https://www.frontiersin.org/articles/10.3389/fmicb.2025.1608957/full#supplementary-material
Footnotes
1. ^https://meme-suite.org/meme/tools/streme
2. ^https://meme-suite.org/meme/tools/fimo
3. ^https://www.softberry.com/berry.phtml?topic=bprom&group=programs&subgroup=gfindb
4. ^https://sapphire.biw.kuleuven.be/
References
Abramson, J., Adler, J., Dunger, J., Evans, R., Green, T., Pritzel, A., et al. (2024). Accurate structure prediction of biomolecular interactions with AlphaFold 3. Nature 630, 493–500. doi: 10.1038/s41586-024-07487-w
Baichoo, N., and Helmann, J. D. (2002). Recognition of DNA by fur: a reinterpretation of the fur box consensus sequence. J. Bacteriol. 184, 5826–5832. doi: 10.1128/jb.184.21.5826-5832.2002
Bailey, T. L., Johnson, J., Grant, C. E., and Noble, W. S. (2015). The MEME suite. Nucleic Acids Res. 43, W39–W49. doi: 10.1093/nar/gkv416
Barrows, J. K., and Van Dyke, M. W. (2022). Biolayer interferometry for DNA-protein interactions. PLoS One 17:e0263322. doi: 10.1371/journal.pone.0263322
Barrows, J. K., and Van Dyke, M. W. (2023). Using restriction endonuclease, protection, selection, and amplification to identify preferred DNA-binding sequences of microbial transcription factors. Microbiol. Spectr. 11:e0439722. doi: 10.1128/spectrum.04397-22
Blindauer, C. A., Harrison, M. D., Parkinson, J. A., Robinson, A. K., Cavet, J. S., Robinson, N. J., et al. (2001). A metallothionein containing a zinc finger within a four-metal cluster protects a bacterium from zinc toxicity. Proc. Natl. Acad. Sci. U.S.A. 98, 9593–9598. doi: 10.1073/pnas.171120098
Brocklehurst, K. R., Megit, S. J., and Morby, A. P. (2003). Characterisation of CadR from Pseudomonas aeruginosa: a Cd(II)-responsive MerR homologue. Biochem. Biophys. Res. Commun. 308, 234–239. doi: 10.1016/s0006-291x(03)01366-4
Brown, N. L., Stoyanov, J. V., Kidd, S. P., and Hobman, J. L. (2003). The MerR family of transcriptional regulators. FEMS Microbiol. Rev. 27, 145–163. doi: 10.1016/S0168-6445(03)00051-2
Browning, D. F., and Busby, S. J. (2004). The regulation of bacterial transcription initiation. Nat. Rev. Microbiol. 2, 57–65. doi: 10.1038/nrmicro787
Choi, Y., Koh, J., Cha, S. S., and Roe, J. H. (2024). Activation of zinc uptake regulator by zinc binding to three regulatory sites. Nucleic Acids Res. 52, 4185–4197. doi: 10.1093/nar/gkae079
Coppens, L., and Lavigne, R. (2020). SAPPHIRE: a neural network based classifier for σ70 promoter prediction in Pseudomonas. BMC Bioinformatics 21:415. doi: 10.1186/s12859-020-03730-z
Ducret, V., Gonzalez, M. R., Leoni, S., Valentini, M., and Perron, K. (2020). The CzcCBA efflux system requires the CadA P-type ATPase for timely expression upon zinc excess in Pseudomonas aeruginosa. Front. Microbiol. 11:911. doi: 10.3389/fmicb.2020.00911
Dwarakanath, S., Chaplin, A. K., Hough, M. A., Rigali, S., Vijgenboom, E., and Worrall, J. A. R. (2012). Response to copper stress in Streptomyces lividans extends beyond genes under direct control of a copper-sensitive operon repressor protein (CsoR). J. Biol. Chem. 287, 17833–17847. doi: 10.1074/jbc.M112.352740
Fang, C., and Zhang, Y. (2022). Bacterial MerR family transcription regulators: activation by distortion. Acta Biochim. Biophys. Sin. Shanghai 54, 25–36. doi: 10.3724/abbs.2021003
Grant, C. E., Bailey, T. L., and Noble, W. S. (2011). FIMO: scanning for occurrences of a given motif. Bioinformatics 27, 1017–1018. doi: 10.1093/bioinformatics/btr064
Habjanič, J., Mathew, A., Eberl, L., and Freisinger, E. (2020). Deciphering the enigmatic function of Pseudomonas metallothioneins. Front. Microbiol. 11:1709. doi: 10.3389/fmicb.2020.01709
Jesudason, T. (2024). WHO publishes updated list of bacterial priority pathogens. Lancet Microbe 5:100940. doi: 10.1016/j.lanmic.2024.07.003
Krishna, S. S., Majumdar, I., and Grishin, N. V. (2003). Structural classification of zinc fingers: survey and summary. Nucleic Acids Res. 31, 532–550. doi: 10.1093/nar/gkg161
Liu, X., Hu, Q., Yang, J., Huang, S., Wei, T., Chen, W., et al. (2019). Selective cadmium regulation mediated by a cooperative binding mechanism in CadR. Proc. Natl. Acad. Sci. U.S.A. 116, 20398–20403. doi: 10.1073/pnas.1908610116
Malgieri, G., Palmieri, M., Russo, L., Fattorusso, R., Pedone, P. V., and Isernia, C. (2015). The prokaryotic zinc-finger: structure, function and comparison with the eukaryotic counterpart. FEBS J. 282, 4480–4496. doi: 10.1111/febs.13503
Novichkov, P. S., Kazakov, A. E., Ravcheev, D. A., Leyn, S. A., Kovaleva, G. Y., Sutormin, R. A., et al. (2013). Regprecise 3.0—a resource for genome-scale exploration of transcriptional regulation in bacteria. BMC Genomics 14:745. doi: 10.1186/1471-2164-14-745
Orchard, K., and May, G. E. (1993). An EMSA-based method for determining the molecular weight of a protein-DNA complex. Nucleic Acids Res. 21, 3335–3336. doi: 10.1093/nar/21.14.3335
Parkhill, J., and Brown, N. L. (1990). Site-specific insertion and deletion mutants in the mer promoter-operator region of Tn501; the nineteen base-pair spacer is essential for normal induction of the promoter by MerR. Nucleic Acids Res. 18, 5157–5162. doi: 10.1093/nar/18.17.5157
Philips, S. J., Canalizo-Hernandez, M., Yildirim, I., Schatz, G. C., Mondragón, A., and O’Halloran, T. V. (2015). Allosteric transcriptional regulation via changes in the overall topology of the core promoter. Science 349, 877–881. doi: 10.1126/science.aaa9809
Qin, S., Xiao, W., Zhou, C., Pu, Q., Deng, X., Lan, L., et al. (2022). Pseudomonas aeruginosa: pathogenesis, virulence factors, antibiotic resistance, interaction with host, technology advances and emerging therapeutics. Signal Transduct. Target. Ther. 7:199. doi: 10.1038/s41392-022-01056-1
Robertson, G., Hirst, M., Bainbridge, M., Bilenky, M., Zhao, Y., Zeng, T., et al. (2007). Genome-wide profiles of STAT1 DNA association using chromatin immunoprecipitation and massively parallel sequencing. Nat. Methods 4, 651–657. doi: 10.1038/nmeth1068
Seshasayee, A. S., Sivaraman, K., and Luscombe, N. M. (2011). An overview of prokaryotic transcription factors: a summary of function and occurrence in bacterial genomes. Subcell. Biochem. 52, 7–23. doi: 10.1007/978-90-481-9069-0_2
Shewchuk, L. M., Verdine, G. L., and Walsh, C. T. (1989). Transcriptional switching by the metalloregulatory MerR protein: initial characterization of DNA and mercury (II) binding activities. Biochemistry 28, 2331–2339. doi: 10.1021/bi00431a052
Solovyev, V., and Salamov, A. (2011). “Automatic annotation of microbial genomes and metagenomic sequences” in Metagenomics and its applications in agriculture, biomedicine and environmental studies. ed. R. W. Li (Hauppauge, NY: Nova Science Publishers), 61–78.
Thees, A. V., Pietrosimone, K. M., Melchiorre, C. K., Marden, J. N., Graf, J., Lynes, M. A., et al. (2021). PmtA regulates Pyocyanin expression and biofilm formation in Pseudomonas aeruginosa. Front. Microbiol. 12:789765. doi: 10.3389/fmicb.2021.789765
Vassylyev, D. G., Sekine, S., Laptenko, O., Lee, J., Vassylyeva, M. N., Borukhov, S., et al. (2002). Crystal structure of a bacterial RNA polymerase holoenzyme at 2.6 Å resolution. Nature 417, 712–719. doi: 10.1038/nature752
Wang, J., Lu, J., Gu, G., and Liu, Y. (2011). In vitro DNA-binding profile of transcription factors: methods and new insights. J. Endocrinol. 210, 15–27. doi: 10.1530/JOE-11-0010
Wang, T., Sun, W., Fan, L., Hua, C., Wu, N., Fan, S., et al. (2021). An atlas of the binding specificities of transcription factors in Pseudomonas aeruginosa directs prediction of novel regulators in virulence. eLife 10:e61885. doi: 10.7554/eLife.61885
Keywords: gene regulation, CadR, transcription factors, metal-sensing, Pseudomonas aeruginosa
Citation: Barrows JK, Wood RM, Westee AB, Stubbs KA, Ratliff-Griffin M and Van Dyke MW (2025) Identification of a preferred DNA binding sequence and novel regulon member for CadR in Pseudomonas aeruginosa PAO1. Front. Microbiol. 16:1608957. doi: 10.3389/fmicb.2025.1608957
Edited by:
F. Wayne Outten, University of South Carolina, United StatesReviewed by:
Ashutosh Prakash Dubey, University at Buffalo, United StatesVineet Kumar, The University of Texas at Austin, United States
Copyright © 2025 Barrows, Wood, Westee, Stubbs, Ratliff-Griffin and Van Dyke. This is an open-access article distributed under the terms of the Creative Commons Attribution License (CC BY). The use, distribution or reproduction in other forums is permitted, provided the original author(s) and the copyright owner(s) are credited and that the original publication in this journal is cited, in accordance with accepted academic practice. No use, distribution or reproduction is permitted which does not comply with these terms.
*Correspondence: Michael W. Van Dyke, bXZhbmR5azJAa2VubmVzYXcuZWR1