Abstract
In recent years, Phyllanthus emblica root rot disease has occurred in Yunnan and caused significant economic losses to local plantation farmers, the pathogen was identified as Diaporthe eres through morphological and molecular method. The indoor toxicity testing and biological characteristic research on Diaporthe eres were carried out. Additionally, the transcriptional regulatory mechanism under different pH stress conditions was studied. The results showed that Prochloraz had the strongest inhibitory effect on Diaporthe eres mycelial growth, with an EC50 value of 0.059 mg·L-1. Diaporthe eres grows best in an environment of 26°C, 12: 12 alternating light, and pH 6. Go enrichment analysis revealed that the differentially expressed genes were mainly related to the biosynthesis of ribonucleoprotein complexes, ncRNA metabolic processes, ribosome and so on. KEGG analysis shows that in acidic environments, Diaporthe eres responds to external stress by precisely regulating amino acid metabolism and ribosome function, while in alkaline environments, it helps cells respond to and perceive external stress by forming multi-level adaptive networks and inhibiting activities such as protein synthesis transcription. This study provides relevant references for the prevention and control of this disease.
1 Introduction
Phyllanthus emblica, a deciduous tree of the Euphorbiaceae family, is well known for its nutrient-rich fruits, which contain high levels of vitamin C and various bioactive compounds, including flavonoids, polyphenols, and tannins (Sripanidkulchai and Junlatat, 2014). It has been used for both medicinal and dietary purposes in China for nearly 2,000 years. The tree can grow up to 23 meters in height with a trunk diameter of 50 cm (Luo et al., 2018; Yang et al., 2018). P. emblica is widely distributed across India, Sri Lanka, the Indochinese Peninsula, Indonesia, Malaysia, and southwestern China (Yang et al., 2008), with Yunnan Province being one of the primary regions for its cultivation. In recent years, P. emblica cultivation has increased rapidly in Yunnan due to strong farmer interest and promising market prospects. The species shows high adaptability in the Nujiang River Area, Jinsha River Area, and Lancang River Area of western Yunnan, where natural populations are abundant. It possesses traits such as drought resistance, tolerance to poor soils, rapid growth, early fruiting, and a long economic lifespan (Wu et al., 2016). Common diseases affecting P. emblica include fruit soft rot caused by Penicillium choerospondiatis (Wu et al., 2019), fruit anthracnose caused by Colletotrichum gloeosporioides (Priyamedha et al., 2020), black powder disease caused by Alternaria spp. (Zheng et al., 2014), stem trunk galls caused by Splanchnonema Phyllanthus, and fruit spots caused by Diaporthe phoenicicola. Among these, black powder disease has the highest incidence rate, affecting up to 72.4% of fruits. Surveys indicate that over 98% of fallen fruits show disease symptoms, and 13–15% of unfallen fruits are also affected. While research on P. emblica diseases has primarily focused on fruit, branches, and leaves, studies on root diseases remain limited. In recent years, root rot in P. emblica has become increasingly prevalent in Yunnan Province. Due to a lack of research and management strategies, farmers have been unable to implement effective fungicide treatments, leading to significant yield reductions and economic losses. Currently, no studies have identified the causal pathogen of P. emblica root rot or assessed its biological characteristics and fungicide sensitivity. This study focus on identifying the root rot pathogen through morphological analysis and DNA-based molecular identification, as well as to investigate its biological characteristics to determine optimal growth conditions. Furthermore, the in vitro toxicity of six fungicides against Diaporthe eres was evaluated to provide a foundation for future field trials and more effective disease management strategies.
The pH value significantly affects fungal growth, as an appropriate pH is essential for microbial survival. Environmental pH fluctuations present major challenges to microorganisms, as acid–base stress can disrupt intracellular pH homeostasis, thus affecting the structure and function of biological macromolecules such as proteins, nucleic acids, lipids, and carbohydrates (Krulwich et al., 2011; Gupta et al., 2020). When external pH deviates from the optimal range, microorganisms need one or more regulatory pathways to maintain intracellular pH near neutral, ensuring normal growth and cellular function (Guo et al., 2019; Mamo, 2020). Pathogens adapt to environmental changes during host-pathogen interactions through metabolic adjustments and gene expression regulation to support survival and reproduction (Yin and Keller, 2011; Dong and Ma, 2021; Jiang et al., 2021). Research on plant diseases primarily focuses on the pathogenic processes of pathogens and the host’s gene expression response to infection. Most studies have investigated the infection mechanisms and pathogenicity of Diaporthe eres, along with the gene expression regulation of host responses (Boenisch and Schäfer, 2011; Fernandes et al., 2017). However, limited attention has been given to gene expression changes within Diaporthe eres itself. Therefore, this study systematically explores the gene expression pathways and physiological mechanisms of Diaporthe eres under different pH conditions, providing valuable insights into its regulatory responses to pH variations.
2 Materials and methods
2.1 Samples collection
In March 2024, samples with typical disease characteristics were collected from a P. emblica farm in Guojiaying Community, Ningzhou Sub-district, Hua County, Yuxi City, Yunnan Province (E: 102°49′, N: 24°34′). Compared with healthy plants, diseased P. emblica had the following symptoms: (1) early-stage plants were stunted and wilted (Figure 1A); (2) in the middle stage, root cortex decay was observed, with brown to dark brown lesions forming (Figures 1B,C); (3) in the advanced stage, affected plants fell over and died (Figures 1C,D).
Figure 1
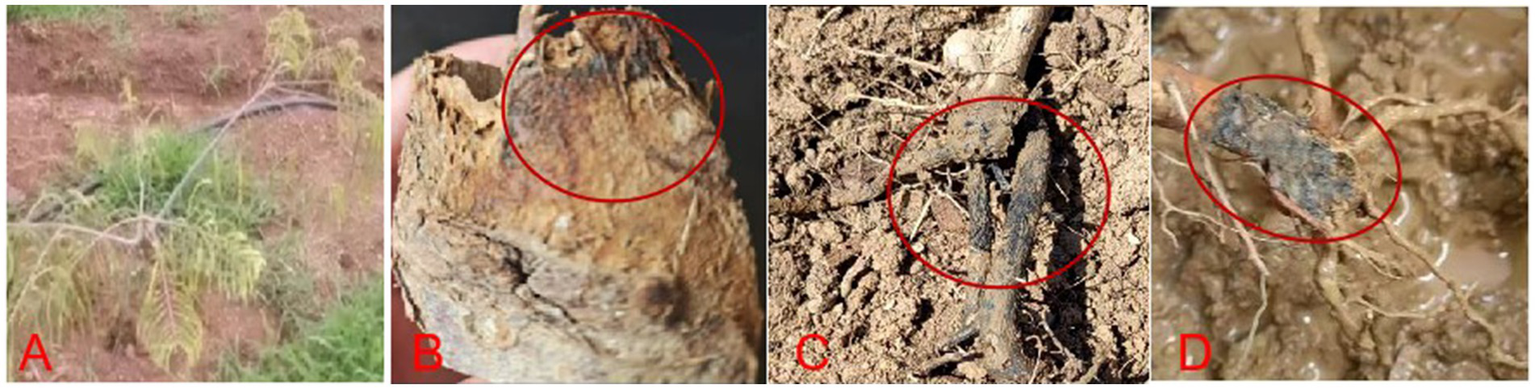
Rot root disease on P. emblica.
2.2 Isolation and purification of pathogen
The pathogen was isolated using the tissue isolation method (Cao et al., 2018). A 1 cm × 1 cm tissue block was excised from the junction of diseased and healthy root tissue of P. emblica. The samples were immersed in 75% ethanol for 30 s for surface disinfection, rinsed with sterile water 3–5 times, then soaked in 2% sodium hypochlorite for 1 min, and rinsed with sterile water again 3–5 times. Before transferring the tissue onto potato dextrose agar (PDA) medium, the excess moisture was removed by sterile filter paper. Cultures were incubated at 25°C for 5–7 days. Growing mycelia were picked with a needle in a sterile laminar flow hood, transferred aseptically to fresh PDA medium, and subcultured for another 5–7 days. Single-spore isolation and purification were performed using the gradient dilution method until a pure pathogen culture was obtained (Leslie and Summerell, 2006). The purified isolates were stored at 4°C for further use.
2.3 Pathogenicity testing
The surface of 3-year-old healthy Phyllanthus emblica roots was disinfected with 75% ethanol for 30 s and then rinsed three times with sterile water. Pathogenicity testing for isolated and purified strains was conducted using the needle puncture method (Gupta et al., 2020). Small wounds were made on the roots using a sterile anatomical needle, and a 0.5 cm mycelial plug was placed onto each wound with the mycelial side facing down. Sterile PDA plugs served as controls, with three replicates per group. After inoculation, the roots were wrapped in cling film and monitored for 15 days. Infected roots were then dissected to observe internal tissue colonization. Moreover, longitudinally sectioned healthy P. emblica roots were inoculated with mycelial plugs for moist culture, and symptoms were observed over 4–15 days.
For pot-based inoculation, three-year-old healthy P. emblica plants were selected. Root surfaces were disinfected, and wounds were made on the primary and fibrous roots using a sterile inoculation needle. A prepared spore suspension (1 × 10⁷ spores/mL) was applied to the wounds, while control plants received sterile water. Inoculated plants were transplanted into sterile soil pots, with three replicates per group. Watering was done every 3 days. After 30 days, symptomatic tissues from inoculated plants were subjected to pathogen re-isolation and culture. The identity of the pathogen was confirmed based on Koch’s postulates (Xi et al., 2018).
2.4 Morphological identification of pathogen
After single spore isolation, the purified strain was cultured on PDA plates for 6 days under dark conditions at 25°C. Colony morphology, including color, size, and shape, was recorded. Once spores were produced, the morphological characteristics of conidia were examined using the microscope and the length and width of at least 30 conidia were measured (An et al., 2020; Zhang and Cao, 2022). The taxonomic status of the pathogen was preliminarily determined based on morphological characteristics and reference data.
2.5 Molecular identification of pathogen
CTAB method (Udayanga et al., 2012) was used for extracting the Genomic DNA and the sequences of the pathogenic were amplified using ITS, EF1-α, and TUB2 primers. All primers (Supplementary Table S1) were synthesized by Youkang Biotech (Hangzhou) Co., Ltd. Polymerase chain reaction (PCR) was performed in a 50 μL reaction system consisting of 25 μL 2 × Taq PCR Master Mix, 21 μL ddH₂O, 1 μL of each 10 μmol/L primer, and 2 μL template DNA. The reaction conditions were as follows: initial denaturation at 95°C for 3 min, 34 cycles of 95°C for 30 s, annealing at the corresponding temperature for 30 s, and extension at 72°C for 1 min, followed by a final extension at 72°C for 10 min (Zhou et al., 2022). PCR products were analyzed by electrophoresis and sent to Youkang Biotech (Hangzhou) Co., Ltd. for sequencing. The obtained sequences were compared using the NCBI database, and the sequences were submitted. Neighbor-joining (NJ) method was used to construct a phylogenetic tree in MEGA 7.0 software.
2.6 In vitro toxicity test of six fungicides against Diaporthe eres
The in vitro toxicity test was conducted using the mycelial growth rate method (Mu, 1994). PDA plates containing different concentrations of the six fungicides (Supplementary Table S2) were prepared, while PDA plates supplemented with an equal volume of sterile water served as the blank control. Each treatment was performed in triplicate. Mycelial plugs (Φ = 5 mm) were excised using a puncher and inoculated onto PDA plates containing the various fungicide concentrations and the control. The plates were incubated in a constant-temperature incubator at 25°C for 6 days. Colony diameters were measured using the cross-method, and the mycelial growth inhibition rate was calculated.
The inhibition rate was converted into the corresponding probability value using a biological statistics probability conversion table. The probability value was plotted as the vertical coordinate, and the logarithm of each fungicide concentration was plotted as the horizontal coordinate to determine the toxicity regression equation. The inhibition rate, EC50 value, slope, and correlation coefficient (r) for each fungicide were calculated (Blanco et al., 2008).
2.7 Research on the bionomics of the pathogen
A mycelial plug (Φ = 5 mm) of the tested strain was inoculated at the center of a PDA plate and incubated at 25°C under three light conditions: continuous light (24 h light),12:12 light–dark cycle, and 24 h dark for 5 days. Each treatment was performed in triplicate. To assess the effect of different culture media, a mycelial plug (Φ = 5 mm) was inoculated onto PDA (20 g agar, 200 g peeled potato, 20 g glucose, 1,000 mL sterile water), PSA (20 g agar, 20 g sucrose, 200 g peeled potato, 1,000 mL sterile water), OMA (20 g agar, 30 g oatmeal, 1,000 mL sterile water), CMA (20 g agar, 40 g corn flour, 1,000 mL sterile water), CPK (1 g dipotassium hydrogen phosphate, 20 g agar, 2 g sodium nitrate, 0.5 g potassium chloride, 0.01 g ferrous sulfate heptahydrate, 20 g sucrose, 0.5 g magnesium sulfate heptahydrate, 1,000 mL sterile water), RD (20 g agar, 200 g fresh P. emblica root stock, 20 g glucose, 1,000 mL sterile water), and WA (20 g agar, 1,000 mL sterile water) media and incubated in the dark at 25°C for 5 days, with three replicates per treatment. PDA medium was adjusted to pH 3–11 using 1 mol/L HCl or 1 mol/L NaOH for pH tolerance analysis. A mycelial plug (Φ = 5 mm) was inoculated at the center of each adjusted medium and incubated in the dark at 25°C for 5 days, with three replicates per treatment. To examine the effect of temperature, mycelial plugs were inoculated onto the PDA medium and incubated in the dark at 5, 10, 15, 20, 25, 30, and 35°C for 5 days with three replicates per treatment. For nitrogen and carbon source utilization studies, modified Czapek (CPK) media were prepared by replacing sodium nitrate with glycine, beef extract, urea, peptone, potassium nitrate, or ammonium sulfate in equal amounts. Similarly, carbon sources were varied by replacing sucrose with soluble starch, D-fructose, glucose, maltose, or D-galactose in equal amounts. Media without nitrogen or carbon sources served as blank controls. Mycelial plugs (Φ = 5 mm) were inoculated at the center of each test medium (one plug per dish) and incubated in the dark at 25°C for 5 days, with three replicates per treatment. Colony diameters were measured using the cross-method to determine growth differences under different conditions.
2.8 Data analysis
The mean diameter of colonies, inhibition rates, EC50 values, correlation coefficients, significant differences and regression equations were calculated using SPSS 19.0 (SPSS Inc., Chicago, Illinois, USA). Three replicates were set for each experimental treatment. Data are expressed as mean ± standard deviation. Differences between groups were analyzed with one-way ANOVA. The significant difference was defined at p < 0.05.
2.9 Strain cultivation and RNA extraction
Diaporthe eres was inoculated onto PDA medium and cultured at 28°C for 7 days. A sterile pipette tip was used to punch out mycelial plugs from the edge of the colony and 10 plugs (Φ = 20 mm) were transferred into the PDB medium (150 mL). After culturing in a shaker at 28°C (150 r/min) for 4 days (Yu et al., 2021), fresh mycelium (1.0 g for each treatment) was collected using 4 layers of gauze and transferred to PDB liquid medium (150 mL) with pH values of 4.5, 6.5 and 8.0, respectively.
The mycelium were incubated under constant temperature conditions at 28°C with shaking at 200 r/min in the dark for 2 days (Shang et al., 2024) and were washed with sterile water, then rapidly frozen in liquid nitrogen (Zhang et al., 2022). There were three biological replicates for each treatment and all collected samples were stored at −80°C before being sent to Nanjing Xianyuan Biotechnology Co., Ltd. for RNA extraction, RNA library construction, and sequencing.
2.10 Transcriptome data processing
Fastp software was used to assess the quality of the sequencing data (Dissanayake et al., 2015), and low-quality reads were filtered out. The clean reads were aligned to the reference genome of Diaporthe eres1 with accession number ASM2257077v2 using HISAT2.
2.11 GO and KEGG enrichment analysis of differentially expressed genes
FeatureCounts software was used to quantify clean reads. Differential expression analysis of gene transcription levels among the three pH-treated samples was conducted using DESeq2. Genes with p < 0.05 and |log₂ fold change| > 1 were considered differentially expressed (DEGs). Gene Ontology (GO) enrichment analysis and Kyoto Encyclopedia of Genes and Genomes (KEGG) enrichment analysis of DEGs were performed using clusterProfiler (Kanehisa and Goto, 2000; Kanehisa, 2019; Aramaki et al., 2020; Kanehisa et al., 2023).
2.12 Quantitative real-time PCR analysis
To further verify the reliability of the RNA-seq experimental results, the total RNA of Diaporthe eres mycelia from the experimental groups (pH = 4.5/pH = 8.0) and the control group (pH = 6.5) was extracted. The RNA was reverse transcribed into cDNA using a reverse transcription kit. Six DEGs were selected, and gene-specific primers were designed based on the gene sequences using Primer Premier 5 software. The primers were synthesized by Youkang Biotechnology (Hangzhou) Co., Ltd. The primer names and sequences are shown in Supplementary Table S3. After the primers were verified to be qualified, RT-qPCR analysis was performed using the Hieff@ qPCR SYBR Green Master Mix fluorescence quantitative premix kit (Yisheng Biotechnology Co., Ltd.). Tubulin was used as the internal reference gene, and the 2−ΔΔCt (Livak and Schmittgen, 2001) was adopted for relative quantification.
3 Results
3.1 Morphological identification of the pathogen
After 10 days of culture on PDA medium, the mycelium was dense and milky white with an irregular edge (Figures 2A,B). After 35 days in the PDA medium, black-brown conidiomata with irregular shapes and papillary tops were scattered on the colony surface (Figure 2D). After 65 days, yellow conidial sterigmata were observed (Figure 2C). Microscopic examination of 58-day-old cultures revealed both α-type and β-type conidia (Figure 2E). The α-type conidia were single-celled, transparent, colorless, and ellipsoidal to fusiform, with a distinct oil drop at each end, measuring 6.5–8.9 μm × 2.4–3.1 μm, with an average size of 7.99 μm × 2.84 μm (n = 30). The β-type conidia were single-celled, transparent, colorless, linear, often hooked at one end, and without oil drops, measuring 21.2–32.4 μm × 1.29–1.84 μm. Based on the above observation results, we have preliminarily identified the pathogen as Diaporthe spp., which belong to Ascomycota, Sordariomycetes, Diaporthales, and Diaporthaceae. The asexual stage was classified as Phomopsis spp.
Figure 2
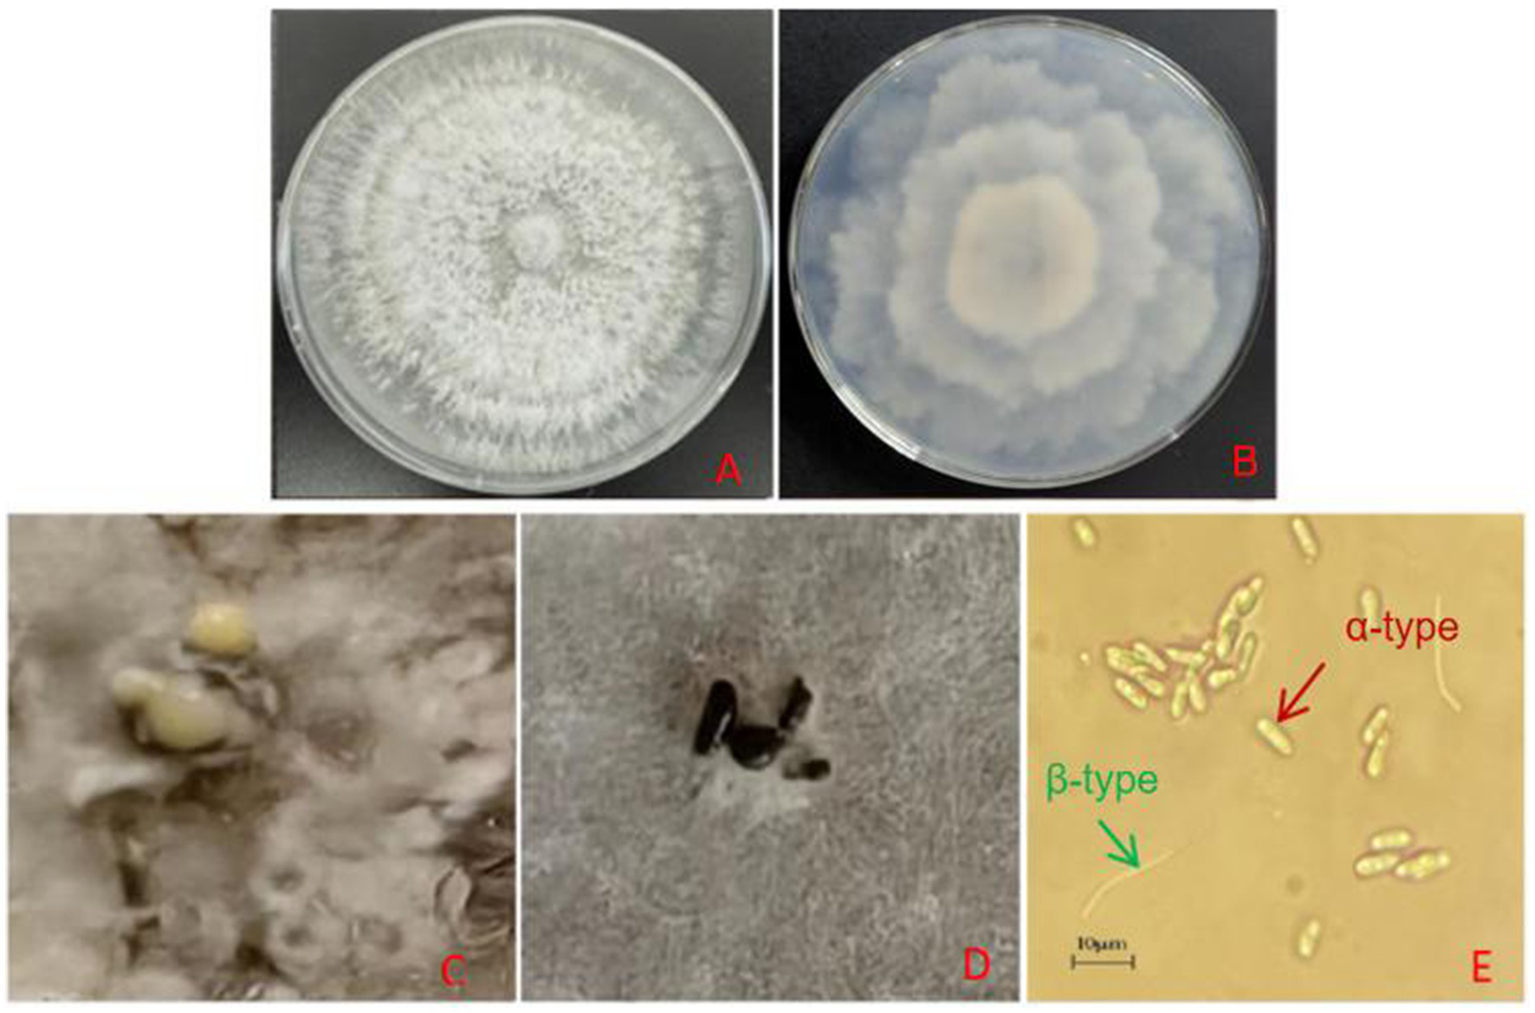
(A) Colony morphology on PDA (front view, 10 days). (B) Colony morphology on PDA (reverse view, 10 days). (C) Conidial angle (65 days). (D) Black conidiomata formation on the colony (35 days). (E)α-conidia and β-conidia (58 days).
3.2 Molecular identification of the pathogen
The genomic DNA of strain YX-1 was amplified using ITS1/ITS4, EF1-728F/EF1-986R, and Bt-2a/Bt-2b primer pairs, resulting in sequences of 558 bp, 330 bp, and 416 bp, respectively. The above sequencing results have been uploaded to the NCBI database with accession numbers PV170938, PV177466, and PV177465. A phylogenetic tree based on the ITS gene sequence (Figure 3A) showed that strain YX-1 clustered with Diaporthe eres isolates (registration numbers MW202936.1, OQ316593.1, OR077897.1, OP277919.1, and MZ078592.1) with a support rate of 100%. A second phylogenetic tree based on the EF1-α gene sequence (Figure 3B) revealed that strain YX-1 shared 100% sequence similarity with Diaporthe eres isolates (registration numbers OP265124, OQ700096.1, OP265123.1, OP265122.1, and MT465652.1). A third phylogenetic tree based on the TUB2 gene sequence (Figure 3C) indicated 99% sequence similarity between strain YX-1 and Diaporthe eres isolates (registration numbers MG281212, MZ724020, MZ724024, MZ724000, and MT561360). Based on the combined molecular analyses and morphological characteristics, strain YX-1 was identified as Diaporthe eres, with its asexual stage classified as Phomopsis eres. The sexual state belongs to Ascomycota, Pyrenomycetes, Sphaeriales, and Diaporthe, while the asexual state belongs to Imperfecti, Coelomycetes, Sphacropsis, and Phomopsis.
Figure 3
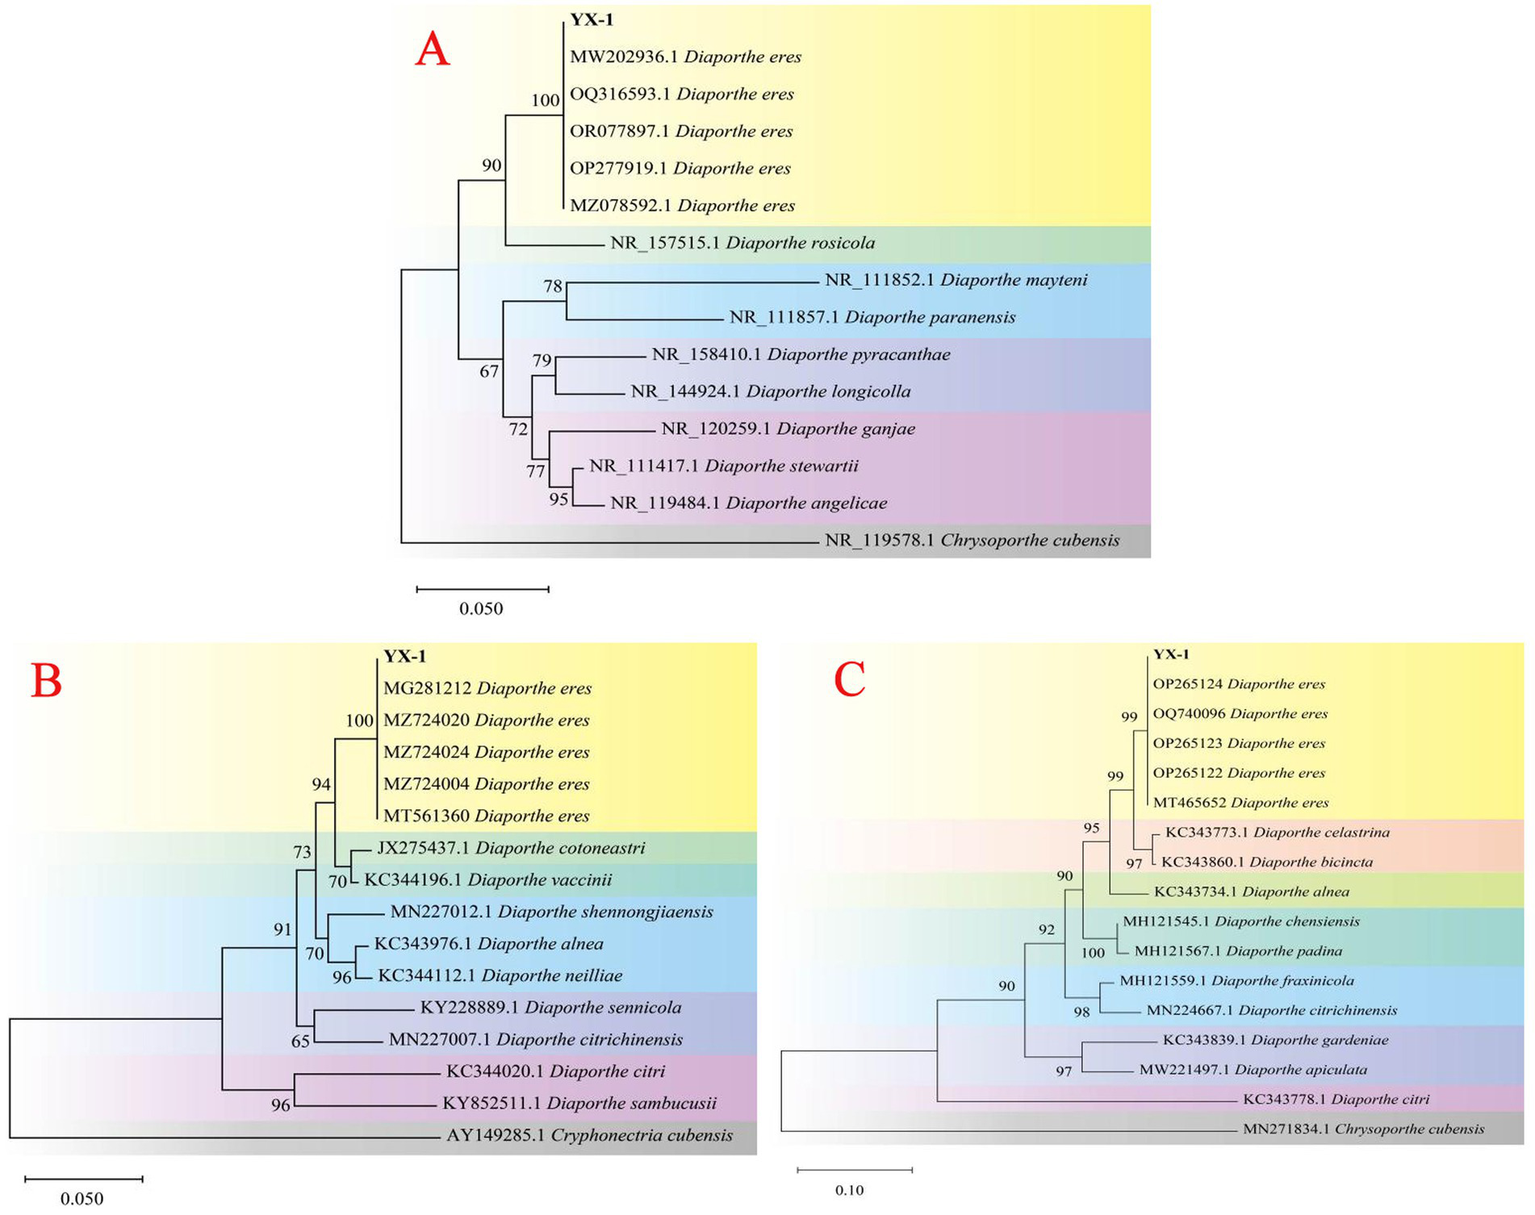
Phylogenetic tree of YX-1 strain based on ITS sequences (A), EF1-α sequences (B) and TUB2 sequences (C).
3.3 Incidence and symptoms of Diaporthe eres
In vitro inoculation experiments demonstrated that severe disease symptoms were observed 15 days after the inoculation of P. emblica roots with strain YX-1. The inoculated root surfaces turned black and rotted, with some of the fibrous roots covered by mycelia (Figure 4A2). Cross-sectional observation of infected roots revealed extensive tissue necrosis, whereas no symptoms were observed in the control group (Figure 4A1). Longitudinal sections of inoculated roots showed vigorous mycelium growth within the tissues (Figure 4A3). Compared with the control group, blackening of the tissue was observed in the main root as early as the fourth day after inoculation (Figure 4B1), with disease severity increasing by day 12. On the 20th day, the roots surface was covered with hyphae, and black conidiomata appeared on the 35th day (Figure 4C1). After microscopic examination of conidiomata, Acervulus of Diaporthe eres were also found (Figures 4C2,C3).
Figure 4
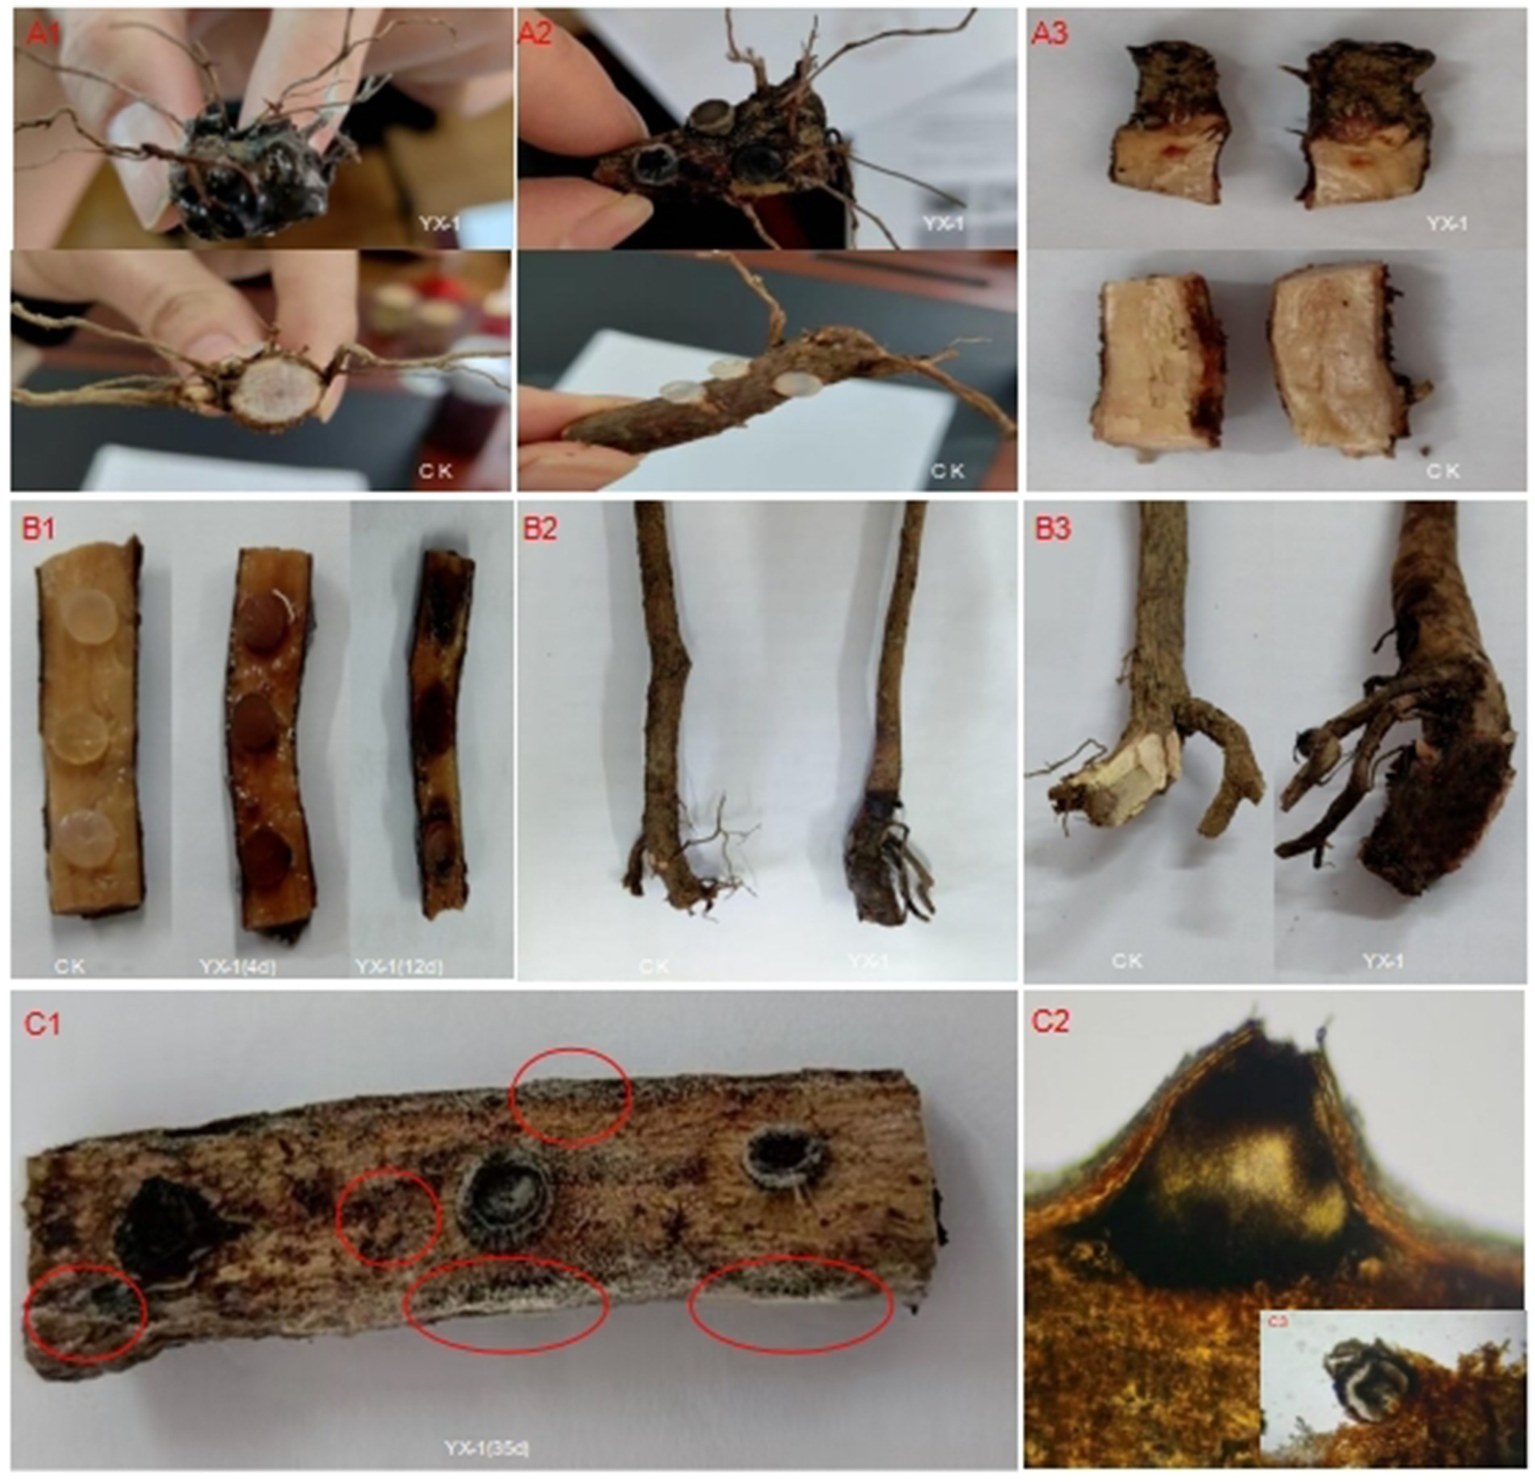
Pathogenicity test of P. emblica root rot. (A1–A3) Disease susceptibility observed 15 days after inoculation with pathogenic fungi. (B1) Slitting phenotype after 4 and 12 days of plug inoculation. (B2,B3) Root surface and sectional symptoms observed in pot anatomy after 30 days. (C1) Black conidiomata on tissues (C2) Morphology of Diaporthe eres’ conidiomata.
In pot inoculation experiments, 30 days after pathogen inoculation, P. emblica roots exhibited symptoms similar to those observed in the field, whereas control plants remained healthy. The infected roots turned black and rotted, with black spots covering the surface (Figures 4B2,B3), while control plants showed normal growth.
Re-isolation and culturing of the pathogen from diseased tissues yielded isolates with morphological characteristics identical to those of the inoculated strain, confirming Diaporthe eres as the causal agent of root rot in P. emblica.
3.4 Effects of six different fungicides on the growth of Diaporthe eres
The six tested fungicides showed varying degrees of inhibitory effects on the mycelial growth of Diaporthe eres at different concentrations. The inhibition rates for Tebuconazole (97.3%), Difenoconazole (95%), Prochloraz (95%), Carbendazim (95%), Azoxystrobin (98.5%), and Chlorothalonil (98%) ranged from 5.23 to 87.36%, 10.66 to 83.66%, 5.15 to 86.40%, 8.30 to 85.12%, 5.23 to 87.36%, and 8.10 to 86.27% (Supplementary Table S4), respectively. Prochloraz (95%) had the strongest inhibitory effect on Diaporthe eres, with an EC50 value of 0.059 μg·mL−1, followed by Difenoconazole (95%), which had an EC50 value of 0.128 μg·mL−1 (Supplementary Table S5). Carbendazim (95%) and Tebuconazole (97.3%) also effectively inhibited mycelial growth, with EC50 values of 0.616 μg·mL−1 and 1.063 μg·mL−1, respectively. On the other hand, Azoxystrobin (98.5%) had the weakest inhibitory effect, with an EC50 value of 32.226 μg·mL−1.
3.5 Bionomics of Diaporthe eres
Diaporthe eres was able to grow on all tested media. A yellow pigment appeared on the mycelium within 5 days on PDA and OMA media. Mycelial growth was fastest on CPK medium, with a colony diameter of 59.4 mm, followed by PDA with a diameter of 56.4 mm. Growth was slowest on WA medium, with a diameter of 24.2 mm (Figures 5A,B). The optimal light condition for Diaporthe eres was 12 h light/12 h dark, where the colony diameter reached 63.4 mm, significantly larger than those under continuous light or darkness (Figures 5A,C).
Figure 5
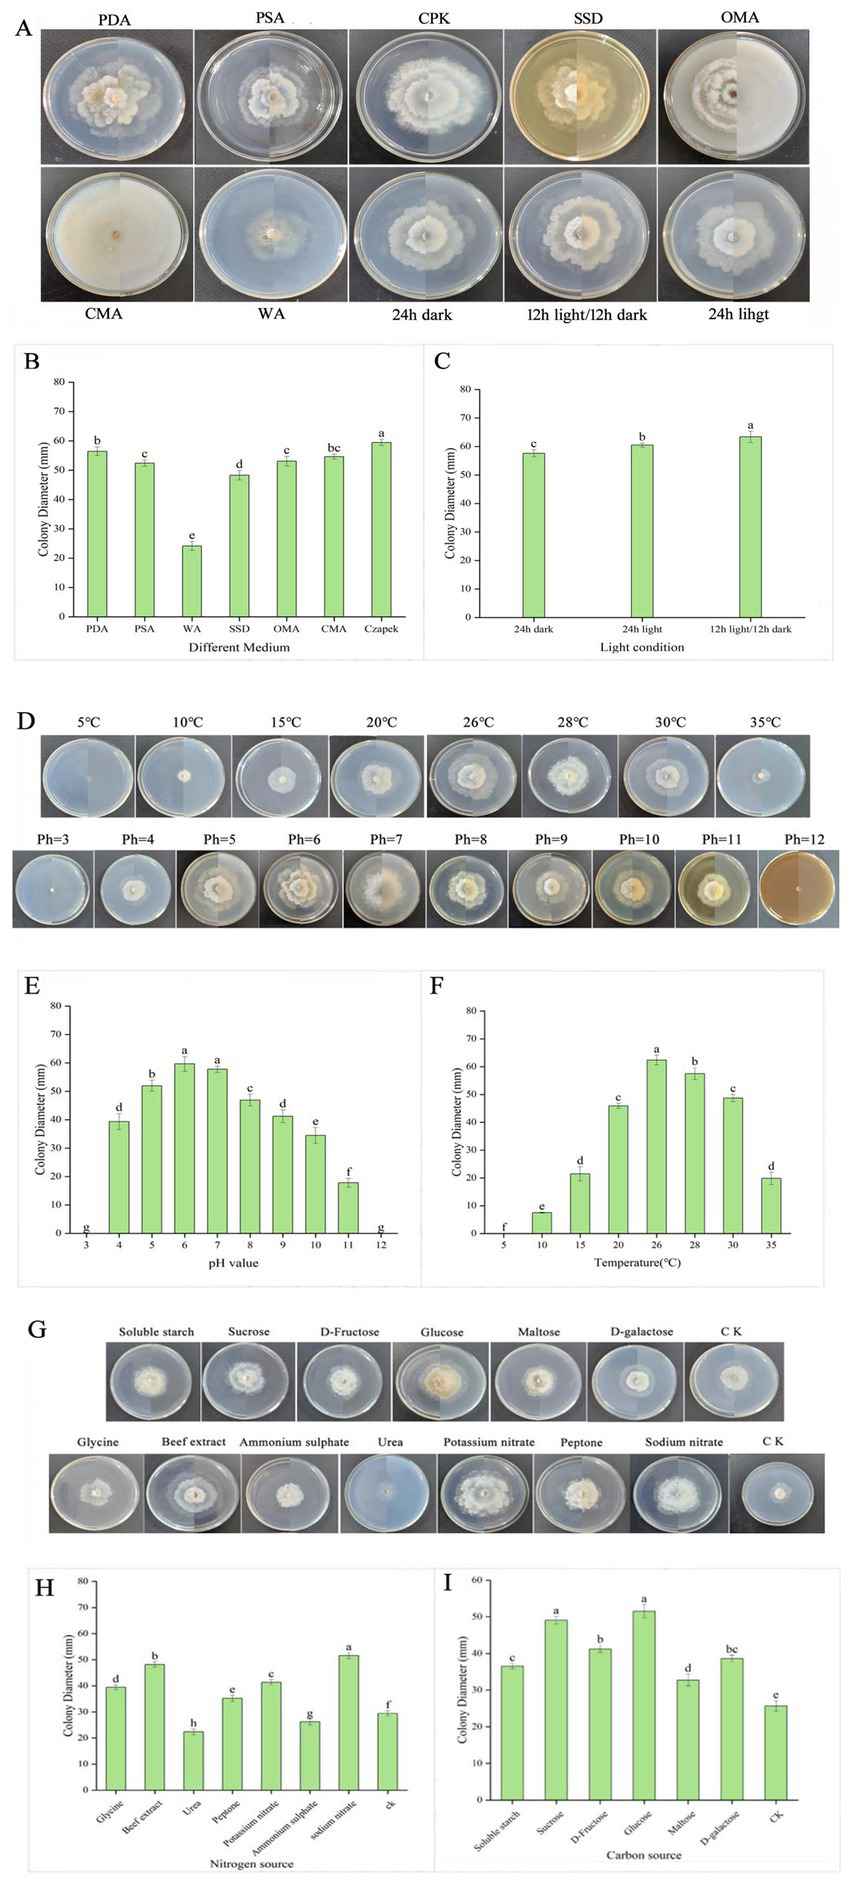
The mycelial growth diameters under different medium and light conditions (A–C), temperatures and pH values (D–F) and carbon and nitrogen sources (G–I).
Diaporthe eres had normal growth at temperatures ranging from 10°C to 30°C, with the fastest growth observed at 26°C, where the average colony diameter was 62.4 mm. At 15 and 20°C, the colony diameters were 21.5 and 45.6 mm, respectively. No signs of growth were observed on Diaporthe eres at both 5 and 35°C (Figures 5D,F).
The mycelium of Diaporthe eres grew on the PDA medium with pH values ranging from 4 to 11, with optimal growth at pH 5 to 7. The largest colony diameter (59.7 mm) was observed at pH 6 on the 5th day of culture, indicating that a weakly acidic environment favors Diaporthe eres growth. Therefore, adjusting soil pH could potentially reduce disease occurrence. For instance, applying plant ash could not only supplement nutrients but also provide a preventive effect by slightly modifying soil pH. The mycelium growth ceased at pH 3 and 12 (Figures 5D,E).
Among the nitrogen sources, sodium nitrate had the most significant effect, with a colony diameter of 51.6 mm. The colony diameters in media supplemented with glycine, beef extract, ammonium sulfate, peptone, and potassium nitrate were 39.4 mm, 48.2 mm, 26.2 mm, 35.2 mm, and 41.4 mm, respectively. The weakest promoting effect was observed in the urea-supplemented medium, where the colony diameter was 22.4 mm (Figures 5G,H). Thus, sodium nitrate was the most effective nitrogen source for Diaporthe eres.
Glucose had the most significant effect on the growth of Diaporthe eres among the carbon sources, with a colony diameter of 51.5 mm (Figures 5G,I). Sucrose and D-fructose also promoted growth, with colony diameters of 49.1 and 41.2 mm, respectively. Maltose, soluble starch, and D-galactose had the weakest effects, with colony diameters of 32.7 mm, 36.5 mm, and 38.6 mm, respectively. Therefore, glucose was determined to be the best carbon source for Diaporthe eres.
3.6 Transcriptome data quality assessment
An overview of the sequencing and mapping results were listed in Supplementary Table S6. Approximately 7,347,954–11,652,356 clean reads per processing were obtained. After mapping clean reads to the Diaporthe eres genome, approximately 84.21–93.45% reads were successfully aligned. The quality assessment of transcriptome data from three biological replicates showed that Q20 and Q30 values exceeded 98.76 and 95.90%, respectively, with G + C content ranging from 57.24 to 57.72% (Supplementary Table S6). These results indicate that the sequencing data are of high quality and suitable for subsequent transcriptome analysis.
Pearson correlation analysis was performed to evaluate the consistency of biological replicates, revealing correlation coefficients ranging from 0.972 to 0.997, confirming strong reproducibility among the samples (Figure 6A). Principal component analysis (Figure 6B) further demonstrated that all sample data were consistent and reliable for further analyses.
Figure 6
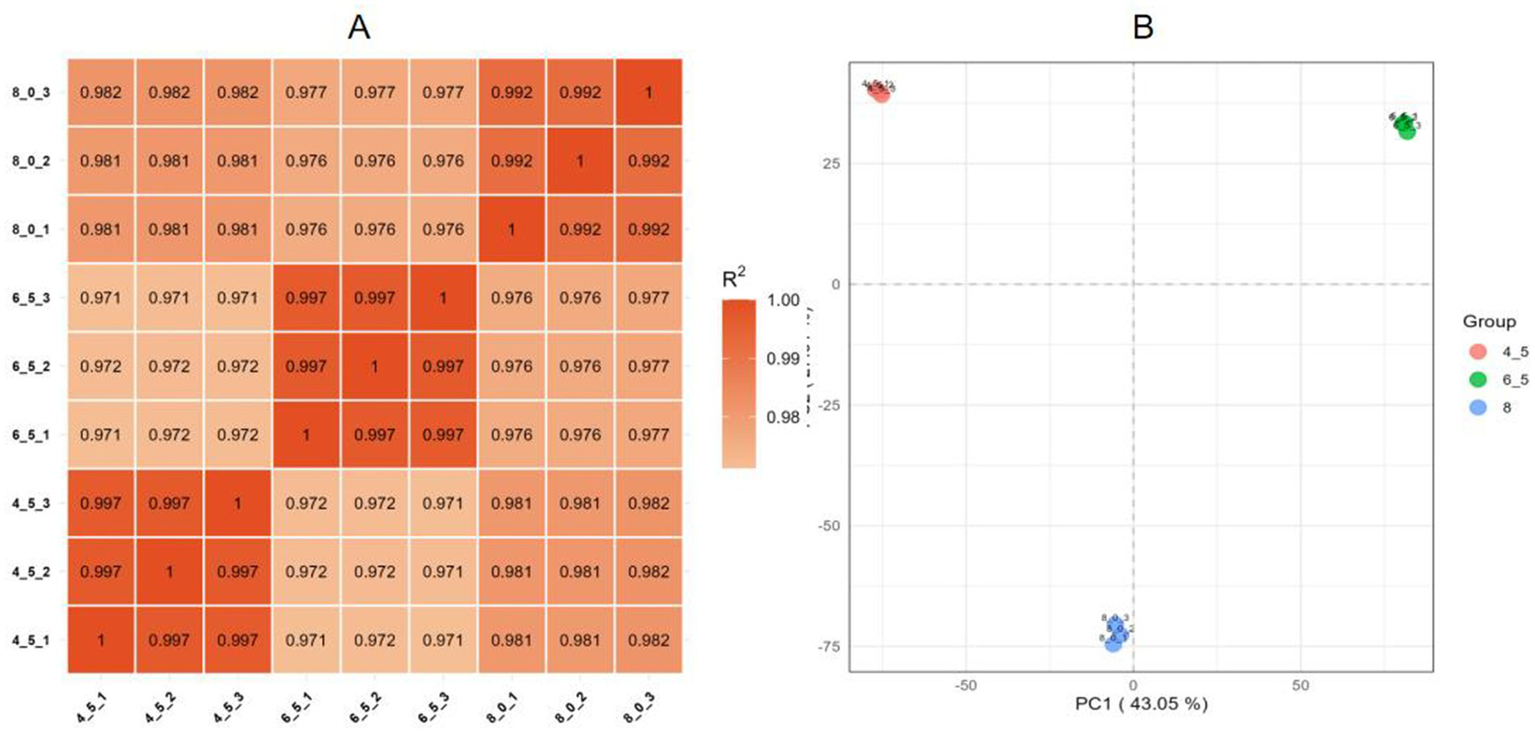
Reproducibility of Diaporthe eres transcriptome data under different pH treatments. (A) Heatmap of RNA expression values across different samples, with Pearson correlation coefficients represented by color and numerical values. (B) Principal component analysis (PCA) showing the distances between samples from different treatment groups.
3.7 Analysis of the number of upregulated and downregulated genes
Differential gene expression analysis was performed on three samples treated with different pH levels, with p < 0.05 and |log₂FC| > 1 considered as differentially expressed genes (DEGs). Compared with the control group (pH 6.5), 2,733 DEGs were identified at pH 4.5, including 1,471 upregulated and 1,252 downregulated genes (Figure 7A). At pH 8.0, 1,673 DEGs were detected, with 842 upregulated and 831 downregulated genes (Figure 7B).
Figure 7
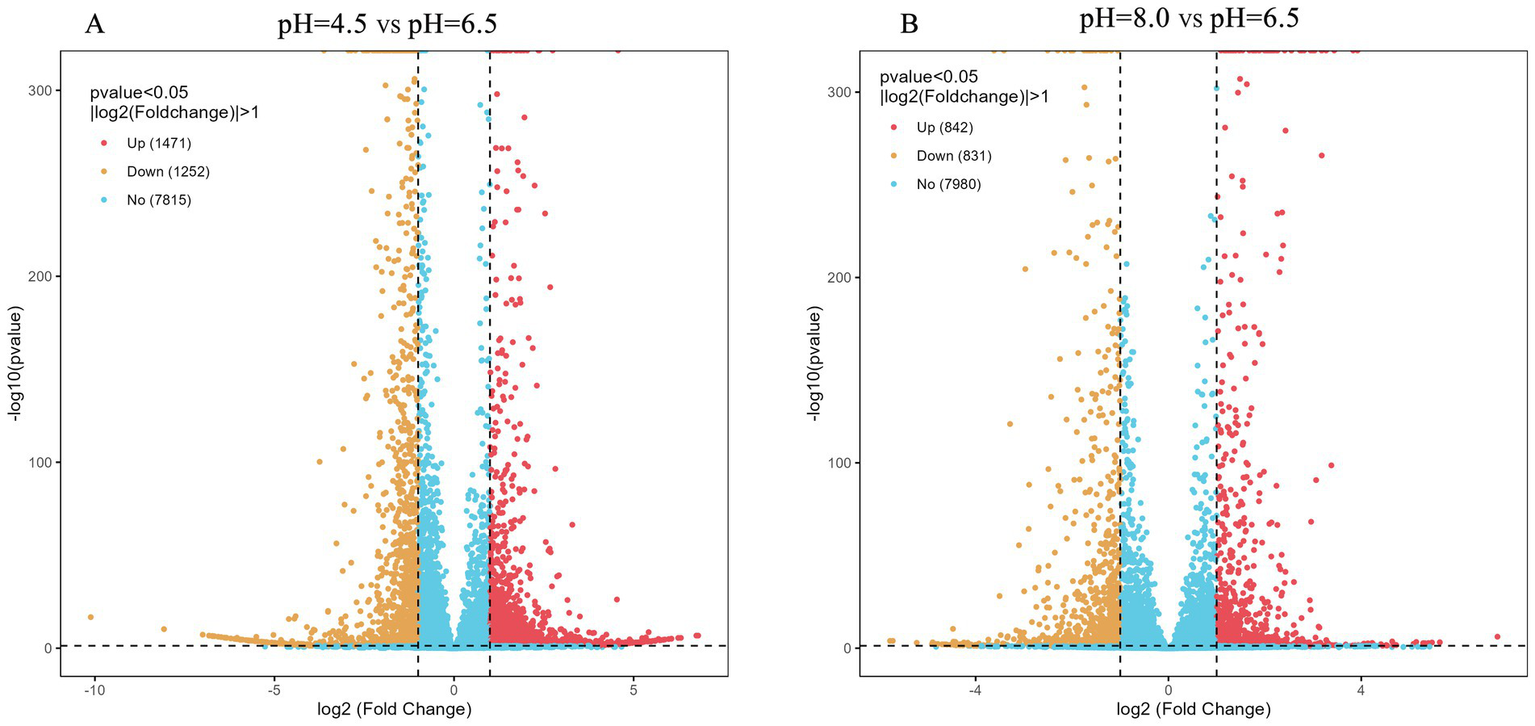
Volcano map of DEGs on Diaporthe eres under acidic and alkaline conditions.
3.8 GO enrichment analysis and KEGG enrichment analysis of differential expression genes
GO enrichment analysis revealed that under pH 4.5 conditions, DEGs were primarily associated with ribonucleoprotein complex biogenesis, ncRNA metabolic processing, and ribosome biogenesis in biological processes. In cellular components, DEGs were mainly enriched in the nucleolus, preribosomes, and ribosomes. Regarding molecular function, the most enriched categories included RNA binding, structural molecular activity, and structural constituent of ribosome (Figure 8A). Under pH 8.0 conditions, DEGs were enriched in biological processes and cellular components similar to those observed under acidic conditions. In terms of molecular function, DEGs were primarily involved in RNA binding, catalytic activity, acting on RNA, and snRNA binding (Figure 8B). These findings suggest that Diaporthe eres adapts to intracellular and extracellular environmental changes by regulating ribonucleo protein complex production and modifying cellular metabolism under acid–base stress.
Figure 8
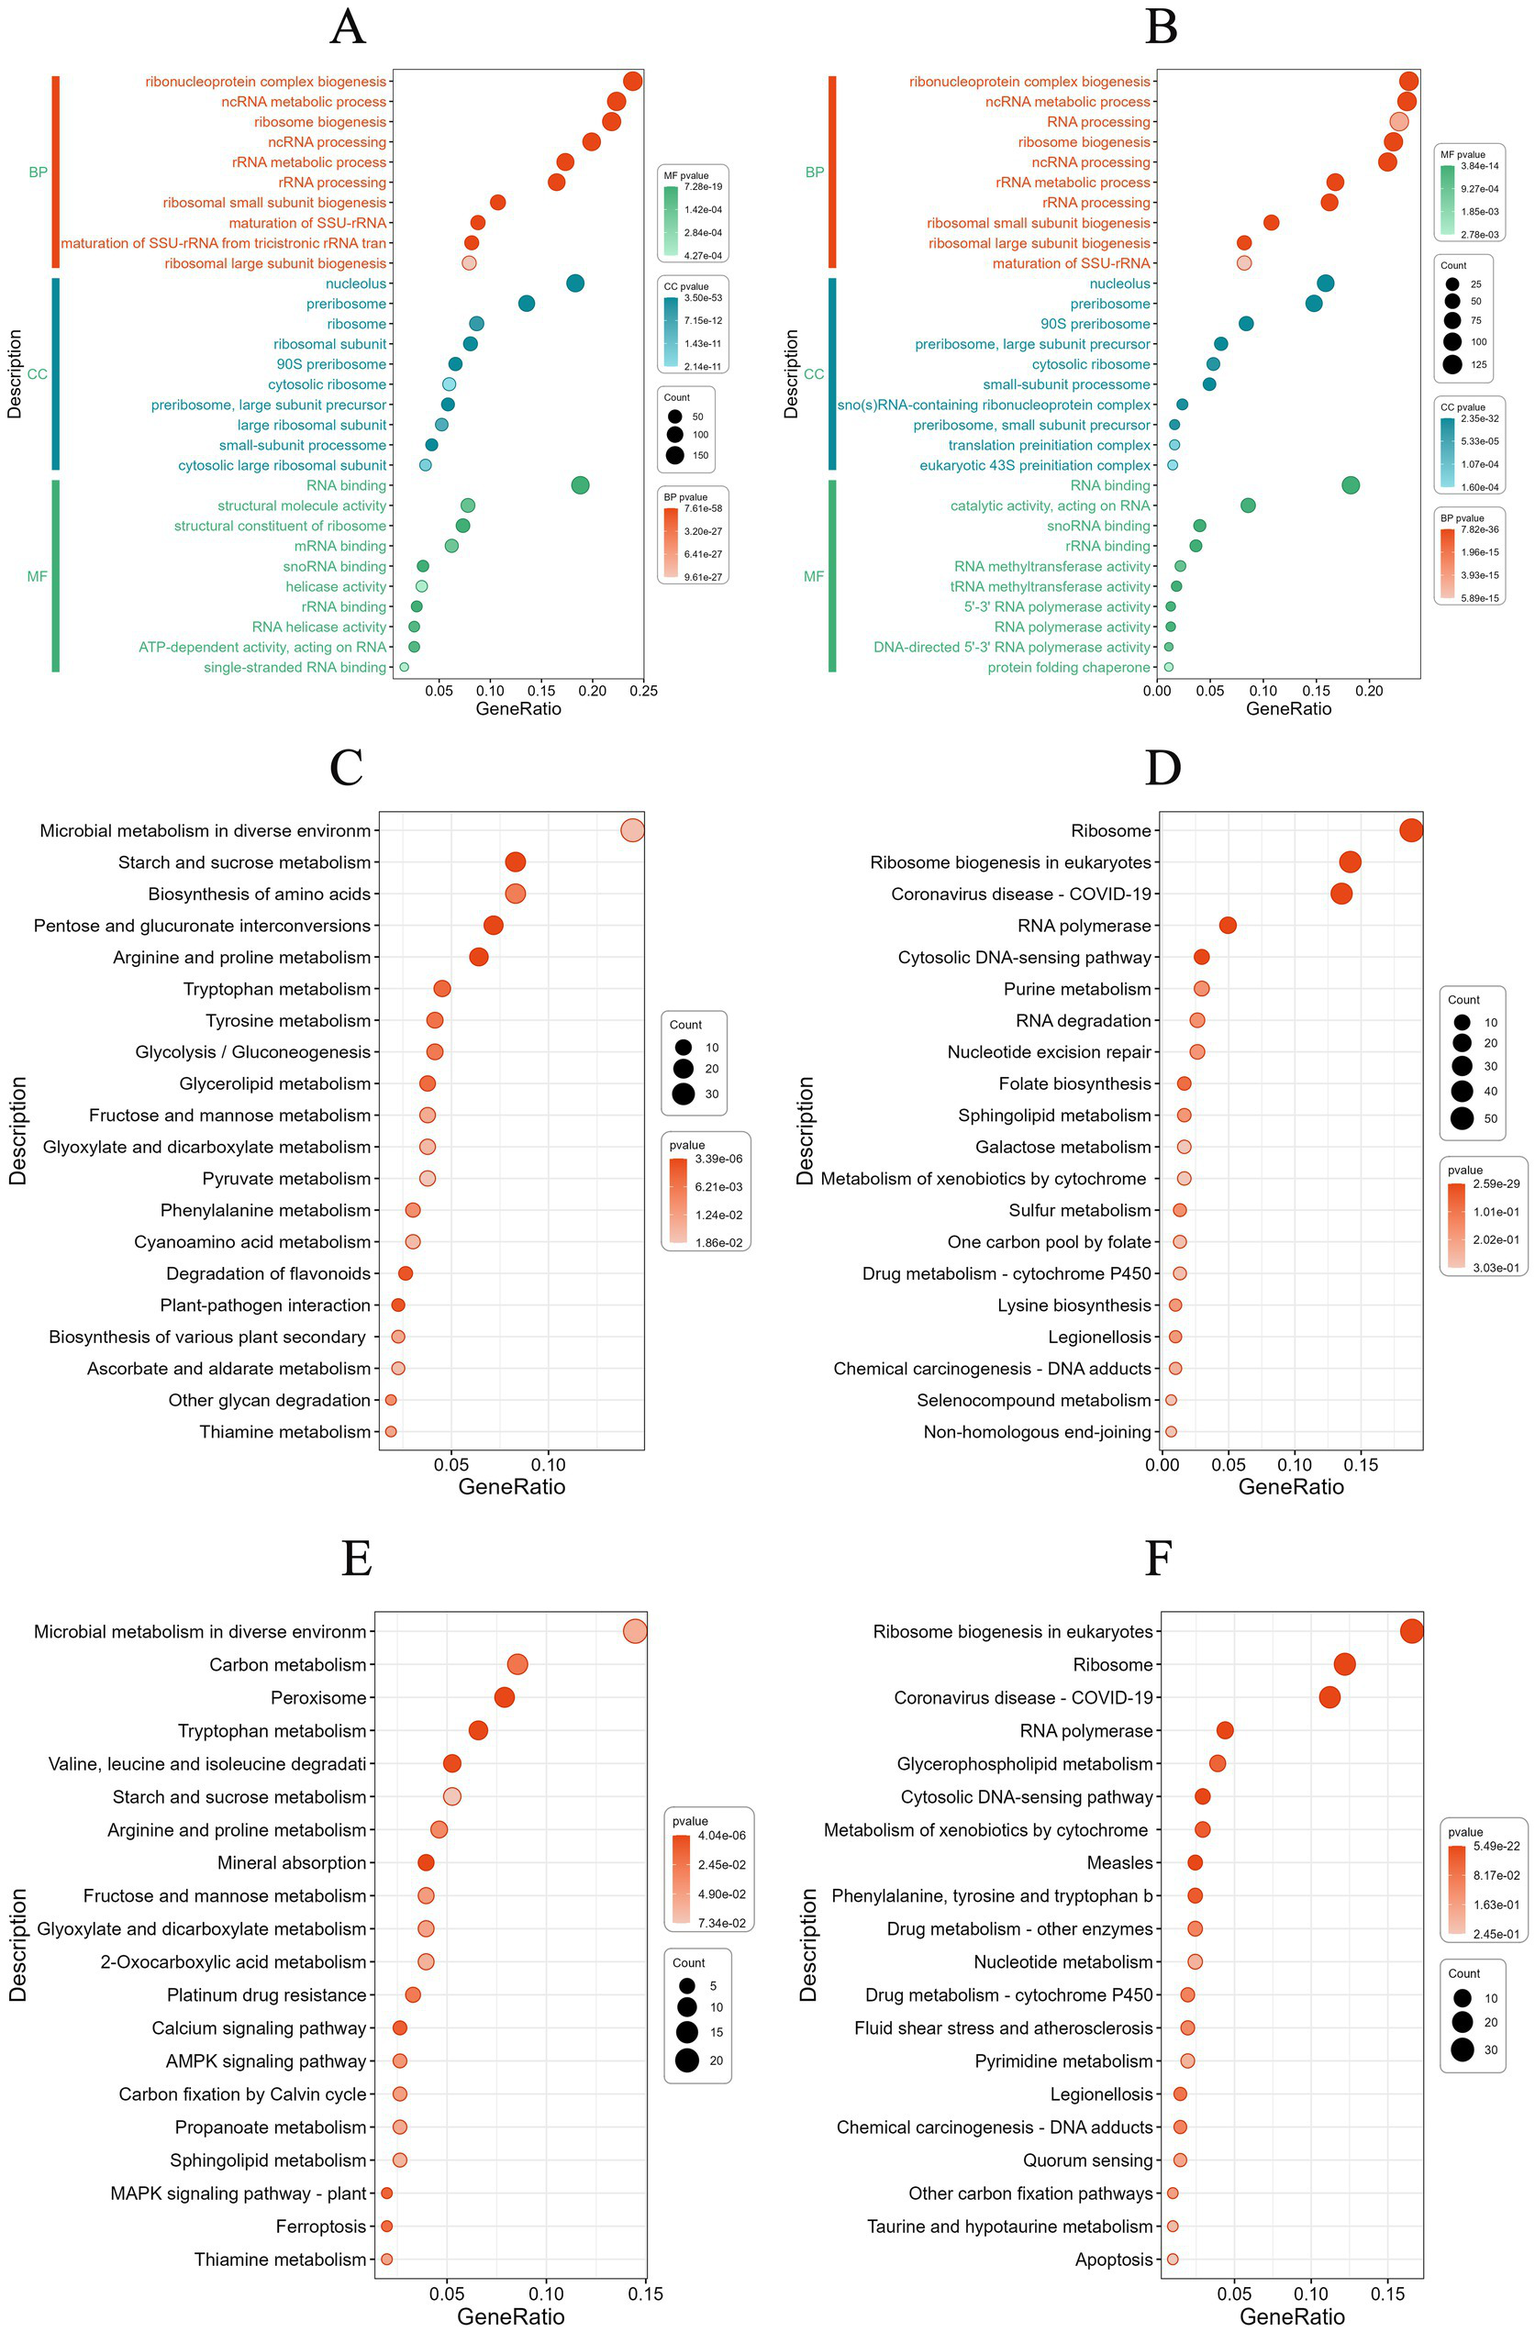
(A) Gene Ontology (GO) enrichment analysis of differentially expressed genes (DEGs) under acidic stress. (B) GO enrichment analysis of DEGs under alkaline stress. (C) KEGG enrichment analysis of up-regulated DEGs at acid stress. (D) KEGG enrichment analysis of down-regulated DEGs at acid stress. (E) KEGG enrichment analysis of up-regulated DEGs at alkaline stress. (F) KEGG enrichment analysis of down-regulated DEGs at alkaline stress.
To further investigate the metabolic pathways influenced by DEGs under different pH conditions, KEGG enrichment analysis was performed. The results show KEGG pathway enriched by upregulating DEGs showed significant enrichment in the amino acid metabolism pathway under acidic conditions (Figure 8C). For example, the pathways of arginine and proline metabolism, tryptophan metabolism, and tyrosine metabolism indicates that cells may respond to stress by regulating amino acid metabolism. The genes SLS64_004997 (Glutamate 5-kinase) and SLS64_009143 (Proline dehydrogenase) are involved in proline synthesis and degradation, respectively, the gene SLS64_002201 (3-hydroxyanthranilic acid dioxygenase) catalyzes the conversion of 3-hydroxyanthranilic acid to 2-amino-3-carboxy glucuronic acid semialdehyde in the tryptophan metabolism pathway. This reaction is closely related to NAD + synthesis and may provide energy and coenzyme support for cells. The gene SLS64_002335 (succinate semialdehyde dehydrogenase) catalyzes the conversion of succinic acid semialdehyde into succinic acid, which enters the TCA cycle production capacity. The synergistic upregulation of these genes indicates that under acid stress, cells may maintain redox balance by activating amino acid catabolic pathways and providing precursor substances for important biosynthetic processes.
The ribosome pathway showed significant downregulation (Figure 8D), with SLS64_000533 (60 S ribosomal protein L3), SLS64_002840 (60S ribosomal protein L2), SLS64_003134 (40S ribosomal protein S12) and SLS64_005120 (54S ribosomal protein L7), SLS64_002938 (54S ribosomal protein L23), etc. are generally inhibited under acidic stress conditions. This global downregulation of ribosomal gene expression is closely related to the metabolic reprogramming of cells under stress conditions, manifested as: (1) reducing energy consumption by inhibiting protein synthesis; (2) synergistic downregulation of the ribosome biosynthesis regulatory factor ATPase activating ribosomal biosynthesis protein (SLS64_002972); (3) forming a regulatory network for metabolic resource redistribution with the significantly upregulated amino acid metabolism pathways (proline, tryptophan, and tyrosine metabolism) mentioned earlier. These changes collectively reflect the molecular mechanism by which cells achieve survival adaptation by finely regulating ribosome function in acidic environments.
Under alkaline stress conditions, cells form a systemic adaptation mechanism by synergistically regulating multiple metabolic pathways under alkaline stress conditions (Figure 8E). The significant upregulation of SLS64_012946 and SLS64_004253 (high affinity copper transporters) in the mineral absorption pathway indicates that cells maintain ion homeostasis by enhancing copper ion absorption; The activation of the peroxisome pathway is manifested by the synergistic upregulation of SLS64_000592 and SLS64_003452 (fatty acid metabolism related enzymes) and SLS64_008838 (antioxidant enzymes), enhancing the ability of fatty acid β-oxidation and reactive oxygen species scavenging; At the same time, the expression of SLS64_010853 (2-ketoglutarate dehydrogenase) and SLS64_010471 (aromatic transaminase) in the tryptophan metabolism pathway increased, promoting NAD + synthesis and redox balance. The synergistic regulation of these three pathways forms a multi-level adaptive network from ion balance, energy metabolism to oxidative defense, jointly helping cells cope with multiple stresses caused by alkaline environments.
Cells exhibit significant synergistic downregulation of ribosome synthesis and transcription machinery related genes under alkaline stress conditions (Figure 8F). Structural protein genes of 40S and 60S ribosomal subunits in the ribosomal pathway such as 60S ribosomal protein L3 (SLS64_000533) 60S ribosomal protein L2 (SLS64_002840),40S ribosomal protein S12 (SLS64_003134). At the same time, the ribosome biosynthesis regulatory factor ATPase activating ribosome biosynthesis protein (SLS64_002972) was significantly downregulated. Inhibition of ribosomal gene expression and RNA polymerase complex subunit genes such as DNA-directed RNA polymerase I subunit RPA2 (SLS64_001862), DNA-directed RNA polymerase III subunit C1 (SLS64_006317). The downregulation of protein synthesis and transcriptional activity in alkaline environments reflects the basic metabolic regulation strategy of cells to reduce energy consumption by inhibiting protein synthesis and transcriptional activity. It is worth noting that the expression of key enzyme genes, such as SLS64_011427 (3-deoxy-7-phosphoheptulonate synthase), SLS64_014097 (bifunctional chorismate synthase/riboflavin reductase) in the biosynthesis pathways of phenylalanine, tyrosine, and tryptophan are reduced, further indicating that cells may redistribute metabolic resources by reducing the synthesis of aromatic amino acids. These downregulated pathways, in stark contrast to the previously upregulated mineral absorption, peroxisome, and tryptophan metabolism pathways, together form a global metabolic reprogramming network for cells to cope with alkaline stress, achieving environmental adaptation by precisely regulating the expression levels of different functional modules.
3.9 RT-qPCR validation of differentially expressed genes
To verify the reliability of the RNA-seq data, six genes (SLS64_010853, SLS64_010914, SLS64_011144, SLS64_010245, SLS64_007082, and SLS64_002644) were selected from the transcriptome sequencing results for RT-qPCR validation. The detection results are shown in Figure 9A. The expression trends of SLS64_010853, SLS64_010914, SLS64_011144, SLS64_010245, and SLS64_002644 genes were all upregulated under acidic and alkaline conditions, while SLS64_007082 was downregulated in both conditions (Figure 9A). The above results were consistent with the transcriptome data (Figure 9B), verifying the reliability of the RNA-seq results.
Figure 9
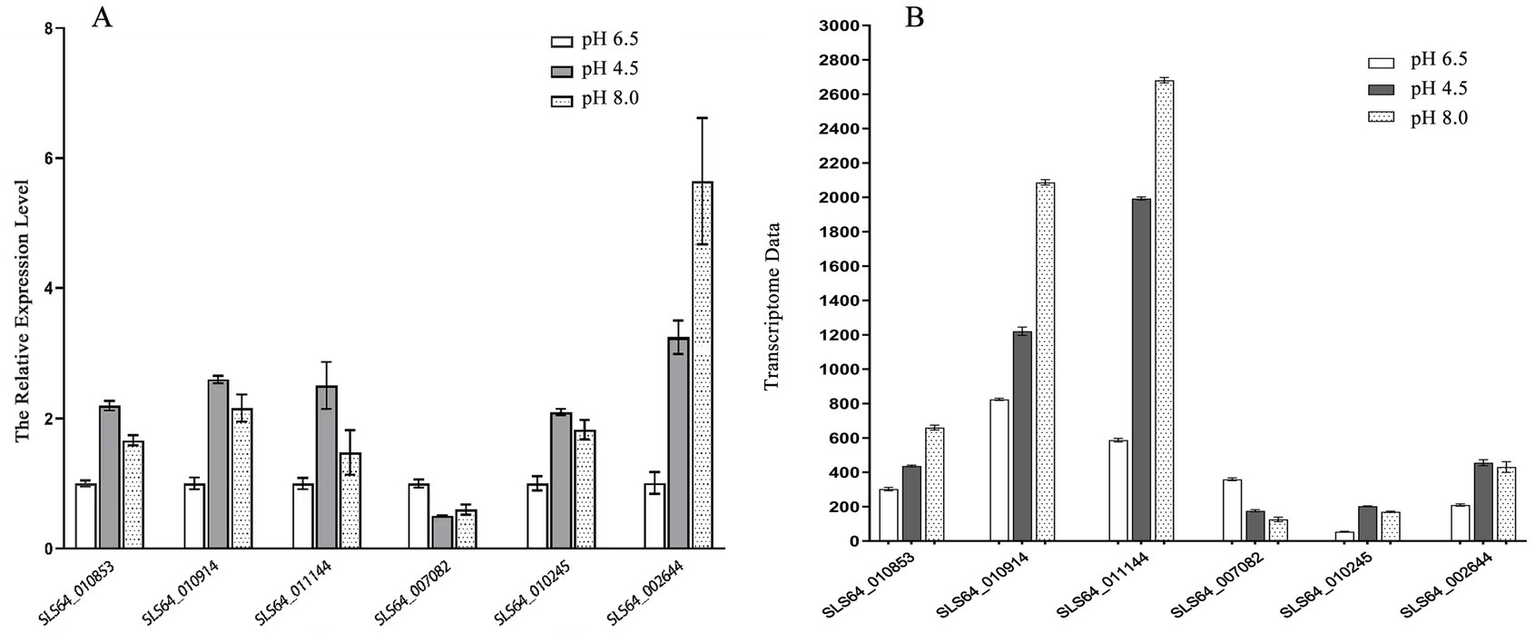
RT-qPCR verification of target gene expression levels. (A) RT-qPCR detection of six target gene expression levels in Diaporthe eres under acidic or alkaline stress. (B) Target gene expression levels in transcriptome data.
4 Discussion and conclusion
Current research on P. emblica diseases has mainly focused on fruit-related infections. However, root rot disease in P. emblica has not been previously reported. This study is the first to report the identification of root rot in P. emblica caused by Diaporthe eres, providing novel insights into disease management and cultivation practices for this species. Therefore, based on the investigation results of the first discovery of root rot disease on Phyllanthus emblica, this study conducted pathogen identification, investigated the bionomics of Diaporthe eres, and evaluated the in vitro toxicity of different fungicides.
Diaporthe is a significant plant pathogen with a broad host range, affecting various crops, trees, and ornamental plants (Yang et al., 2021). Reported hosts include species from families such as Rutaceae, Theaceae, Leguminosae, Rosaceae, Sapindaceae, and Vitaceae, including Pyrus spp. (Xu et al., 2018), Citrus reticulata (Huang et al., 2015), Juglans regia (Liu et al., 2020), Mangifera indica (Lim et al., 2019), Vitis vinifera (Dissanayake et al., 2015), and Camellia oleifera (Yang et al., 2023). Diaporthe infections can cause diverse plant diseases, including root rot, fruit rot, top blight, ulcer disease, leaf spot disease, leaf blight, rot, and wilt disease (Gomes et al., 2013). This pathogen is known to coexist with its host and become pathogenic under conditions of reduced plant immunity or metabolic imbalance (Díaz et al., 2017; Wang X. H. et al., 2022; Wang Y. et al., 2022).
This study identified Diaporthe eres as the causative agent of P. emblica root rot. Glucose and sodium nitrate was the optimal carbon and nitrogen sources for mycelial growth of Diaporthe eres, respectively. On the other hand, a previous study by Yan et al. (2015) on Diaporthe eres causing blueberry bud blight in Shenyang reported soluble starch and peptone as the optimal carbon and nitrogen sources. These differences may be attributed to variations in fungal strains from different geographical regions and host plants. Future research should further explore the adaptability of the P. emblica root rot pathogen to different monosaccharides and polysaccharides, as well as organic and inorganic nitrogen sources. Moreover, no sexual spores of Diaporthe eres were observed in this study, and further investigations will be conducted to determine the underlying reasons.
P. emblica thrives in dry, warm, and hot climates and grows well in fertile, neutral, and acidic soils but poorly in low-lying, waterlogged areas and calcareous soils. Considering the optimal growth conditions of Diaporthe eres identified in this study, P. emblica should be cultivated in neutral soil environments. If the soil is slightly acidic, its pH can be adjusted by incorporating plant ash, which not only supplements nutrients but also provides certain preventive effects against the disease. Furthermore, the application of alkaline fungicides or growth regulators may help control root rot disease in P. emblica. To validate the feasibility and effectiveness of these strategies, field experiments are planned, and necessary adjustments will be made to plant protection strategies based on the results to ensure they align with the environmental and management requirements of P. emblica cultivation.
Chemical control has always been an important strategy for managing fruit and vegetable diseases. This study identified Prochloraz as the most effective fungicide against Diaporthe eres, with an EC50 value of 0.059 mg/L. Prochloraz, a sterol demethylase inhibitor (DMI), may exert its inhibitory effect due to the sensitivity of Diaporthe eres to this class of fungicides, consistent with findings by Yan et al. (2015), Tao et al. (2020), Wang X. H. et al. (2022), and Wang Y. et al. (2022). In actual production, rotating fungicides with different mechanisms of action is essential for delaying resistance development and extending their efficacy in disease management.
The research found that the acid–base environment significantly affects the transcriptional level of Diaporthe eres. Under acidic conditions, there were a total of 1,413 differentially expressed genes (DEGs), including 803 up-regulated genes and 610 down-regulated genes. Under alkaline conditions, there were 933 DEGs, including 452 up-regulated genes and 481 down-regulated genes. The reliability of the RNA-seq results was verified by RT-qPCR detection of the expression levels of target genes. The results of this study indicate that when Diaporthe eres is subjected to acid stress, it maintains osmotic balance and redox homeostasis by significantly activating amino acid metabolism, while reducing the energy consumption of protein synthesis and RNA biosynthesis by down-regulating ribosome and transcription-related genes (Clark et al., 2012). Under alkaline conditions, Diaporthe eres up-regulates mineral absorption and peroxisome function, enhances copper ion uptake, fatty acid β-oxidation, and reactive oxygen species (ROS) scavenging capacity and cooperates with tryptophan metabolism to support NAD+ compensation and redox balance. At the same time, the general down-regulation of ribosome and RNA polymerase complex genes, as well as the suppression of aromatic amino acid biosynthesis, reflects a global adaptation pattern of “increasing ions/antioxidants and reducing proteins/transcription.” This study, through the research on genes with expression changes, contribute to a better understanding of the molecular mechanism of Diaporthe eres infection in the host in the future.
Statements
Data availability statement
The datasets presented in this study can be found in online repositories. The names of the repository and accession numbers are as follows: https://www.ncbi.nlm.nih.gov/, PRJNA1284586, PV170938, PV177466, and PV177465.
Author contributions
YZ: Project administration, Validation, Data curation, Conceptualization, Writing – review & editing, Writing – original draft. MS: Formal analysis, Methodology, Writing – review & editing, Writing – original draft, Investigation. YH: Validation, Conceptualization, Resources, Software, Writing – original draft, Writing – review & editing, Visualization. YS: Formal analysis, Writing – review & editing, Writing – original draft.
Funding
The author(s) declare that financial support was received for the research and/or publication of this article. Project was funded by the Huzhou Vocational and Technical College Tourism Management College Science and Technology Innovation Team.
Acknowledgments
The authors thank Yulei Zhang and Peng Hu for their help with sample collection for this research.
Conflict of interest
The authors declare that the research was conducted in the absence of any commercial or financial relationships that could be construed as a potential conflict of interest.
Generative AI statement
The authors declare that no Gen AI was used in the creation of this manuscript.
Publisher’s note
All claims expressed in this article are solely those of the authors and do not necessarily represent those of their affiliated organizations, or those of the publisher, the editors and the reviewers. Any product that may be evaluated in this article, or claim that may be made by its manufacturer, is not guaranteed or endorsed by the publisher.
Supplementary material
The Supplementary material for this article can be found online at: https://www.frontiersin.org/articles/10.3389/fmicb.2025.1612979/full#supplementary-material
References
1
AnX. L.WuX.RenY. F.YinQ. X.WangX.LiD. X.et al. (2020). Identification and biological characteristics of Pseudopestalotiopsis theae, an important pathogenic fungus causing tealeaf spot. Chin. Plant Prot.40, 12–19.
2
AramakiT.Blanc-MathieuR.EndoH.OhkuboK.KanehisaM.GotoS.et al. (2020). KofamKOALA: KEGG ortholog assignment based on profile HMM and adaptive score threshold. Bioinformatics36, 2251–2252. doi: 10.1093/bioinformatics/btz859
3
BlancoC.RomeroF.de los SantosB. (2008). First report of Pestalotiopsis diospyri causing calyx blight of sweet persimmon in Huelva province (southwestern Spain). Plant Dis.92:176. doi: 10.1094/PDIS-92-2-0176A
4
BoenischM. J.SchäferW. (2011). Fusarium graminearum forms mycotoxin producing infection structures on wheat. BMC Plant Biol.11:110. doi: 10.1186/1471-2229-11-110
5
CaoS.YangN. B.ZhaoC. (2018). Diversity of fusarium species associated with root rot of sugar beet in China. J. Gen. Plant Pathol.84, 321–329. doi: 10.1007/s10327-018-0792-5
6
ClarkM. E.HeZ.ReddingA. M. (2012). Transcriptomic and proteomic analyses of Desulfovibrio vulgaris biofilms: carbon and energy flow contribute to the distinct biofilm growth state. BMC Genomics13:138. doi: 10.1186/1471-2164-13-138
7
DíazG. A.LatorreB. A.LolasM.FerradaE.NaranjoP.ZoffoliJ. P. (2017). Identification and characterization of Diaporthe ambigua, D. Australafricana, D. Novem, and D. rudis causing a postharvest fruit rot in kiwifruit. Plant Dis.101, 1402–1410. doi: 10.1094/PDIS-10-16-1535-RE
8
DissanayakeA. J.LiuM.ZhangW.ChenZ.UdayangaD.ChukeatiroteE.et al. (2015). Morphological and molecular characterisation of Diaporthe species associated with grapevine trunk disease in China. Fungal Biol.119, 283–294. doi: 10.1016/j.funbio.2014.11.003
9
DongS.MaW. (2021). How to win a tug-of-war: the adaptive evolution of Phytophthora effectors. Curr. Opin. Plant Biol.62:102027. doi: 10.1016/j.pbi.2021.102027
10
FernandesT. R.SegorbeD.PruskyD.Di PietroA. (2017). How alkalinization drives fungal pathogenicity. PLoS Pathog.13:e1006621. doi: 10.1371/journal.ppat.1006621
11
GomesR. R.GlienkeC.VideiraS. I.LombardL.GroenewaldJ. Z.CrousP. W. (2013). Diaporthe: a genus of endophytic, saprobic and plant pathogenic fungi. Persoonia31, 1–41. doi: 10.3767/003158513X666844
12
GuoJ.MaZ.GaoJ.ZhaoJ.WeiL.LiuJ.et al. (2019). Recent advances of pH homeostasis mechanisms in Corynebacterium glutamicum. World J. Microbiol. Biotechnol.35:192. doi: 10.1007/s11274-019-2770-2
13
GuptaP.KhanF. I.RoyS.AnwarS.DahiyaR.AlajmiM. F.et al. (2020). Functional implications of pH-inducedconformational changes in the sphingosine kinase 1. Spectrochim. Acta A Mol. Biomol. Spectrosc.225:117453. doi: 10.1016/j.saa.2019.117453
14
HuangF.UdayangaD.WangX.HouX.MeiX.FuY.et al. (2015). Endophytic Diaporthe associated with Citrus: a phylogenetic reassessment with seven new species from China. Fungal Biol.119, 331–347. doi: 10.1016/j.funbio.2015.02.006
15
JiangL.WangP.SongX.ZhangH.MaS.WangJ.et al. (2021). Salmonella Typhimurium reprograms macrophage metabolism via T3SS effector SopE2 to promote intracellular replication and virulence. Nat. Commun.12:879. doi: 10.1038/s41467-021-21186-4
16
KanehisaM. (2019). Toward understanding the origin and evolution of cellular organisms. Protein Sci.28, 1947–1951. doi: 10.1002/pro.3715
17
KanehisaM.FurumichiM.SatoY.KawashimaM.Ishiguro-WatanabeM. (2023). KEGG for taxonomy-based analysis of pathways and genomes. Nucleic Acids Res.51, D587–D592. doi: 10.1093/nar/gkac963
18
KanehisaM.GotoS. (2000). KEGG: Kyoto encyclopedia of genes and genomes. Nucleic Acids Res.28, 27–30. doi: 10.1093/nar/28.1.27
19
KrulwichT. A.SachsG.PadanE. (2011). Molecular aspects of bacterial pH sensing and homeostasis. Nat. Rev. Microbiol.9, 330–343. doi: 10.1038/nrmicro2549
20
LeslieJ. F.SummerellB. A. (2006). The fusarium laboratory manual. Hoboken, NJ: Blackwell Publishing.
21
LimL.MohdM. H.ZakariaL. (2019). Identification and pathogenicity of Diaporthe species associated with stem-end rot of mango (Mangifera indica L.). Eur. J. Plant Pathol.155, 687–696. doi: 10.1007/s10658-019-01800-4
22
LiuJ.SunC. C.XueD. S.LiB. H.LianS.WangC. X. (2020). Identification of the pathogen causing shoot dieback on walnut and study on its biological characteristics. Acta Phytopathol. Sin.50, 774–778. doi: 10.13926/j.cnki.apps.000404
23
LivakK. J.SchmittgenT. D. (2001). Analysis of relative gene expression data using real time quantitive PCR and the 2-△△CT method. Methods25, 402–408. doi: 10.1006/meth.2001.1262
24
LuoC. Z.GuoJ. J.HuangJ. C.ZhangW.LiG. L. (2018). Breeding of excellent clones of "Baoshan no.2" Yuganzi. For. Sci. Technol.6, 3–6. doi: 10.13456/j.cnki.lykt.2018.06.001
25
MamoG. (2020). Challenges and adaptations of life in alkaline habitats. Adv. Biochem. Eng. Biotechnol.172, 85–133. doi: 10.1007/10_2019_97
26
MuL. (1994). Research methods of chemical plant protection. Beijing: China Agriculture Press.
27
PriyamedhaS.SurjitS.KhushiM. (2020). Postharvest diseases of Indian gooseberry and their management: a review. Int. J. Fruit Sci.20, 178–190. doi: 10.1080/15538362.2019.1608889
28
ShangY. P.WangY. W.WangG.LiH. Q.LiP. F.GuoJ.et al. (2024). Transcriptomics reveals gene expression patterns of fusarium graminearum under pH stress. Acta Microbiol Sin.64, 4271–4289. doi: 10.13343/j.cnki.wsxb.20240302
29
SripanidkulchaiB.JunlatatJ. (2014). Bioactivities of alcohol based ex-tracts of Phyllanthus emblica branches: antioxidation, antimelanogenesis and anti-inflammation. J. Nat. Med.68, 615–622. doi: 10.1007/s11418-014-0824-1
30
TaoH. W.HaoH.ShenX. Z.YeZ.ZiH. L.WangS.et al. (2020). Identification and characterization of Diaporthe eres causing leaf blight disease on the medicinal herb Polygonatum sibiricum. J. Gen. Plant Pathol.86, 1–9. doi: 10.1007/s10327-020-00952-0
31
UdayangaD.LiuX. Z.CrousP. W.McKenzieE. H. C.ChukeatiroteE.HydeK. D. (2012). A multi-locus phylogenetic evaluation of Diaporthe (Phomopsis). Fungal Divers.56, 157–171. doi: 10.1007/s13225-012-0190-9
32
WangX. H.JiangJ. Q.HongN.WangG. P. (2022). Diaporthe species causing pear bud witherings in Guizhou, Southwest China. Mycosystema41, 1151–1164. doi: 10.13346/j.mycosystema.220073
33
WangY.PruittR. N.NürnbergerT.WangY. (2022). Evasion of plant immunity by microbial pathogens. Nat. Rev. Microbiol.20, 449–464. doi: 10.1038/s41579-022-00710-3
34
WuJ. H.YangK. B.YangY. P.HuangJ. C.GongF. P.WangB. S. (2016). Variation of fruit economic traits in natural populations of Phyllanthus emblica in western Yunnan. J. Yunnan Agric. Univ. (Nat. Sci.).30, 281–287. doi: 10.16211/j.issn.1004-390X(n).2016.02.014
35
WuY.ZhouZ. J.ShiH.TanX. Y.XuJ. R.ChengX. (2019). Identification of the pathogen causing fruit rot of postharvest Phyllanthus emblica and its cell wall degrading enzyme activity. Microbiol. China.46, 760–769. doi: 10.13344/j.microbiol.china.180248
36
XiZ. G.YouJ. M.ZhengL.LiuH.HuangJ. B. (2018). Identification and biological characteristics of the pathogen causing leaf spot on Coptis chinensis in Hubei province. J. Plant Prot.45, 315–321. doi: 10.13802/j.cnki.zwbhxb.2018.2016154
37
XuC. N.ChiF. M.JiZ. R.ZhangJ. X.WangN.TianH.et al. (2018). Identification of the Diaporthe pathgen causing stem blight in Liaoning Province. Acta Phytopathol. Sin.48, 577–581. doi: 10.13926/j.cnki.apps.000000
38
YanX. R.WangX.HuM. Q.DaiH. P.FuJ. F.LiT. L. (2015). Identification and biological characteristic of blueberry Diaporthe bud blight pathogen. Acta Phytopathol. Sin.45, 556–560. doi: 10.13926/j.cnki.apps.2015.05.015
39
YangY. L.ChenJ. X.WuZ. Q.ZhangD. H.MaH. C.WuJ. R. (2023). Bacterial community structure and diversity in rhizosphere soil and root system of Camellia oleifera root rot. Non-wood For. Res.41, 69–82. doi: 10.14067/j.cnki.1003-8981.2023.02.009
40
YangX. X.HuangJ. C.YangY. P.WanX. J.ZhangW.LiG. L. (2018). Breeding of the new variety 'Baoshan no.1′ in Yuganzi. Chin Fruits4, 85–87. doi: 10.16626/j.cnki.issn1000-8047.2018.04.018
41
YangQ.JiangN.TianC. M. (2021). New species and records of Diaporthe from Jiangxi Province, China. MycoKeys77, 41–64. doi: 10.3897/mycokeys.77.59999
42
YangS. K.YangY. L.YangW. L. (2008). Advances in research and development of Phyllanthus emblica L.Chin Fruits14, 846–854. doi: 10.3724/SP.J.1145.2008.00846
43
YinW.KellerN. P. (2011). Transcriptional regulatory elements in fungal secondary metabolism. J. Microbiol.49, 329–339. doi: 10.1007/s12275-011-1009-1
44
YuJ.XuQ. Q.LiZ. Y. (2021). Isolation and identification of endophytic fungi from Polygonum cuspidatum for polydatin transformation. Food Ferment. Ind.47, 21–26. doi: 10.13995/j.cnki.11-1802/ts.025545
45
ZhangX. L.CaoZ. Y. (2022). Identification of the pathogen causing root rot of Dendrobium officinale and sensitivity to the fermentation broth of Streptomyces. Chin. J. Biol. Control38, 258–266. doi: 10.16409/j.cnki.2095-039x.2022.02.004
46
ZhangL. N.ZhouX. S.LiP. F.WangY. W.HuQ. Y.ShangY. P.et al. (2022). Transcriptome profile of fusarium graminearum treated by putrescine. J. Fungi.9:60. doi: 10.3390/jof9010060
47
ZhengY.JiangS. J.DengJ. M. (2014). Isolation and identification of pathogen causing black spot of Phyllanthus emblica fruit in post harvest period. J. Henan Agric. Sci.43, 89–92.
48
ZhouY. Y.ZhangW.LiX. H.JiS. X.HanC. P.YanJ. Y. (2022). Identification of Diaporthe species associated with cherry leaf spot in China. J. Plant Prot.49, 1077–1084. doi: 10.13802/j.cnki.zwbhxb.2022.2021007
Summary
Keywords
crop protection, Phyllanthus emblica, root rot disease, Diaporthe eres, EC50
Citation
Zhang Y, Song M, He Y and Si Y (2025) Research on the pathogen causing root rot on Phyllanthus emblica from the perspectives of identification, bionomics, fungicide sensitivity assay, and transcriptome analysis under different pH stress. Front. Microbiol. 16:1612979. doi: 10.3389/fmicb.2025.1612979
Received
24 April 2025
Accepted
09 July 2025
Published
31 July 2025
Volume
16 - 2025
Edited by
Ravinder Kumar, Indian Agricultural Research Institute (ICAR), India
Reviewed by
Divya Koilparambil, Dubai Scholars Private School, United Arab Emirates
Zhang Ping, Northeast Forestry University, China
Updates
Copyright
© 2025 Zhang, Song, He and Si.
This is an open-access article distributed under the terms of the Creative Commons Attribution License (CC BY). The use, distribution or reproduction in other forums is permitted, provided the original author(s) and the copyright owner(s) are credited and that the original publication in this journal is cited, in accordance with accepted academic practice. No use, distribution or reproduction is permitted which does not comply with these terms.
*Correspondence: Minyan Song, sennsong@163.comYonghong He, heyonghong700327@163.com
Disclaimer
All claims expressed in this article are solely those of the authors and do not necessarily represent those of their affiliated organizations, or those of the publisher, the editors and the reviewers. Any product that may be evaluated in this article or claim that may be made by its manufacturer is not guaranteed or endorsed by the publisher.