 Shanxia Yao1
 Shenglong Xue1Na Li2,3
 Tian Shi2,3Yan Feng2,3Munila Maimaiti2,3Ayinuer Maimaitireyimu2,3Halina Halike2,3
 Feng Gao2,3*
- 1College of Life Science and Technology, Xinjiang University, Urumqi, China
- 2Department of Gastroenterology, People’s Hospital of Xinjiang Uygur Autonomous Region, Urumqi, China
- 3Xinjiang Clinical Research Center for Digestive Diseases, Urumqi, China
Introduction: Celiac Disease (CeD) is an autoimmune small intestinal disorder triggered by gluten, with clinical subtypes including typical, atypical, and asymptomatic forms.While classic CeD development is linked to microbes/metabolites, their relationships with other subtypes remain unclear.
Methods: We conducted 16S rDNA sequencing on fecal samples from 14 asymptomatic CeD (SCeD) patients and integrated this data with our team’s prior sequencing data of 30 classic CeD (CDF) patients and 30 healthy controls (CDFH).
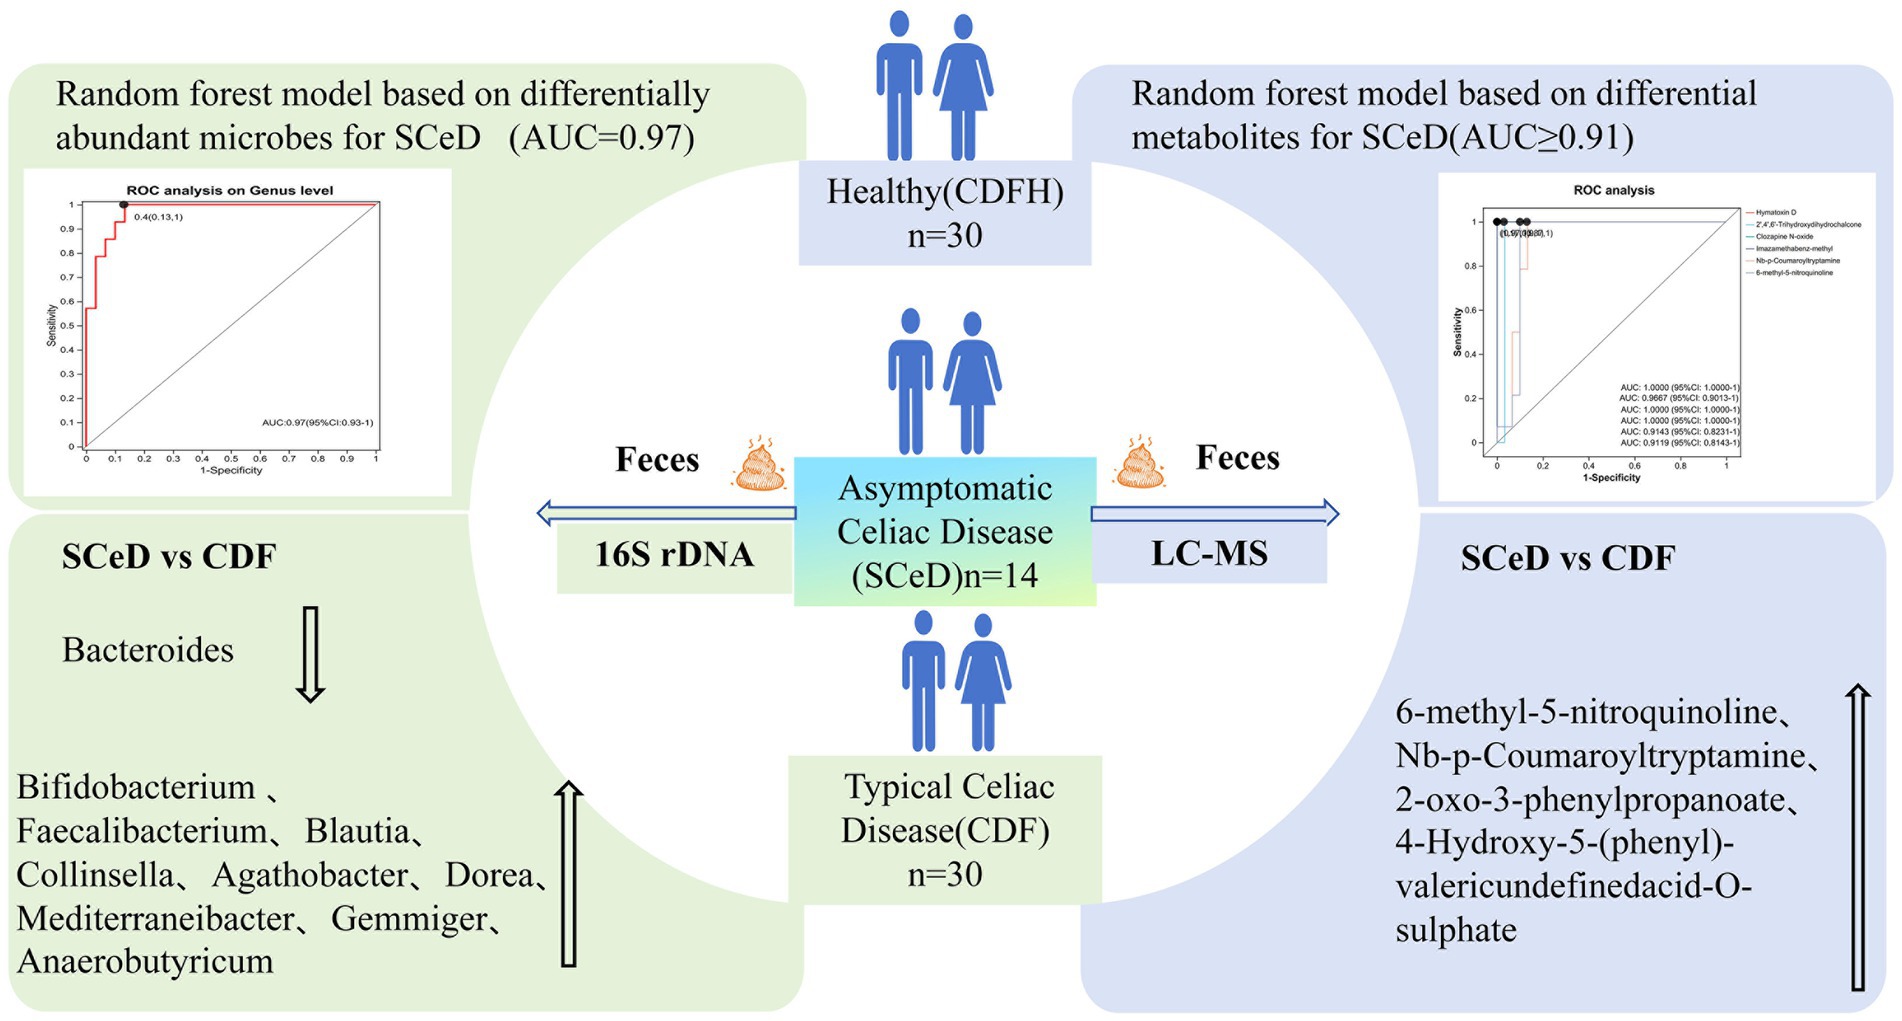
Results: 16S rDNA results showed: Compared to CDFH, SCeD had lower abundances of Bacteroides, Alistipes, CAG-352 and higher abundances of Blautia, Collinsella, Dorea, Mediterraneibacter, Gemmiger; a random forest model based on 8 differential microbes distinguished SCeD from CDFH (AUC = 0.97). Compared to CDF, SCeD had lower Bacteroides and higher Faecalibacterium, Blautia, Collinsella, Agathobacter—suggesting Bacteroides may relate to CeD symptoms, while Faecalibacterium and Agathobacter may alleviate symptoms. Metabolomic analysis identified differential metabolites between SCeD and CDFH (enriched in “Steroid Hormone Biosynthesis,” “Primary Bile Acid Biosynthesis,” “Tryptophan Metabolism” via KEGG) and between SCeD and CDF (enriched in “Tryptophan Metabolism,” “Biosynthesis of Plant Secondary Metabolites,” “Degradation of Flavonoids”). Spearman analysis showed correlations between differential microbes and metabolites.
Discussion: In conclusion, different CeD subtypes may involve a “host-microbe-metabolite” trinity network: A random forest model built with SCeD-CDFH differential microbes/metabolites is a high-efficacy SCeD diagnostic tool; modulating these microbes/metabolites could be a new entry point for CeD mechanism research and adjunctive therapy.
Graphical Abstract.
1 Introduction
Celiac Disease (CeD) is an autoimmune enteropathy triggered by exposure to dietary gluten in genetically susceptible individuals (Catassi et al., 2022). The global prevalence of CeD is approximately 1.4%, and recent studies indicate a rising trend in its prevalence—posing a significant impact on patients’ quality of life and overall health (Lebwohl and Rubio-Tapia, 2021). CeD presents with a wide range of clinical manifestations, most commonly gastrointestinal symptoms such as abdominal pain and diarrhea; additionally, patients with CeD face an increased risk of developing complications affecting other bodily systems (Catassi et al., 2022). However, a subset of patients show no obvious clinical symptoms and are therefore classified as having asymptomatic celiac disease (SCeD). As a distinct subtype of CeD, SCeD is defined by the absence of overt clinical symptoms, alongside positive serological test results and pathological changes in the small intestinal mucosa (Marsh grade ≥ 2). Notably, SCeD patients remain at risk of progressing to classic celiac disease (CDF) or developing other related complications (Laurikka et al., 2022). Given the heterogeneity of CeD subtypes, analyzing only a single subgroup makes it challenging to address complex research questions. Timely intervention after diagnosis, for example, strict adherence to a gluten-free diet (Gluten-Free Diet, GFD), can effectively curb the progression of the disease and prevent the occurrence of complications (Aljada et al., 2021). That said, due to the lack of typical symptoms in SCeD, conventional diagnostic approaches often lead to missed diagnoses. Early detection of SCeD is critical for preventing complications like malnutrition, osteoporosis, and elevated risk of malignant tumors; delayed diagnosis resulting from missed cases significantly increases the likelihood of these adverse outcomes. Thus, novel diagnostic strategies are urgently needed to enhance the diagnostic efficiency of SCeD (Makharia et al., 2022). Ultimately, understanding the differences in microbial communities and metabolite profiles across various CeD subtypes can facilitate both the diagnosis and adjuvant treatment of CeD.
The intestine, a digestive organ consisting of the large and small intestines, is often referred to as “the human body’s second brain.” As a key “microbial organ” in humans, the gut microbiota plays a pivotal role in maintaining intestinal homeostasis, regulating immune responses, and facilitating nutrient metabolism (Zhao et al., 2023). Studies have shown that gut microbial dysbiosis is associated with various gastrointestinal disorders (Li H. et al., 2023); it produces diverse metabolites—such as bile acids, short-chain fatty acids, tryptophan, and methane—all of which are critical for intestinal peristalsis and secretion (Fan et al., 2022). Moreover, research has demonstrated that gut microbial dysbiosis is closely associated with the development and progression of multiple autoimmune diseases, including CeD (Han et al., 2025). Furthermore, CeD development is shaped by genetic background, diet, and environment—and these same factors also modulate the gut microbiota (Gupta et al., 2023). Specifically, research focusing on patients with classic celiac disease (CDF) has confirmed that, when compared to healthy controls, CDF patients show marked changes in gut microbial community structure. Such changes include higher abundances of specific pathogenic bacteria and lower abundances of beneficial bacteria. These microbial shifts are not only directly linked to intestinal mucosal barrier damage but also influence immune-inflammatory responses through metabolite regulation, ultimately driving the pathological initiation, progression, and symptom onset of CDF (Bascuñán et al., 2025; Catassi et al., 2024). Certain bacteria elicit host immune responses by expressing epitopes analogous to gliadin (Belei et al., 2023), whereas other microbes induce intestinal mucosal damage by disrupting host immune responses (Acharya et al., 2024), ultimately contributing to CeD’s clinical manifestations. In contrast, specific beneficial microbes can alleviate disease symptoms by preserving intestinal microecological balance (Peng et al., 2022). Alterations in gut microbiota composition typically result in shifts in metabolite profiles (Koh and Bäckhed, 2020). Metabolomics allows for comprehensive analysis of endogenous metabolite alterations in biological systems, providing insights into an organism’s physiological and pathological status (Rostami-Nejad et al., 2024). In CeD research, metabolomic technologies have been used to identify potential biomarkers and uncover disease-related metabolic pathways (Girdhar et al., 2023). Early studies conducted metabolomic analyses on samples from CD patients and healthy controls (CDH), revealing a series of disease-associated differential metabolites involved in multiple metabolic pathways such as energy metabolism, amino acid metabolism, and lipid metabolism. These findings provided new insights into the pathogenesis of celiac disease (Kelley et al., 2025). Additionally, metabolomics has been applied to analyze changes in metabolites in CeD patients before and after a gluten-free diet (GFD) (Vacca et al., 2022). However, these studies have primarily focused on celiac disease with typical symptoms, while the characteristics of the microbial community, metabolic alterations, and their interactions in SCeD patients remain unclear. Currently, there is still a lack of reported research on the microbiota and metabolites in SCeD patients.
Combining the use of 16S rDNA sequencing and untargeted metabolomics enables an understanding of disease pathogenesis from two perspectives: the gut microbial community and metabolite levels (Zhao et al., 2025). 16S rDNA sequencing can accurately characterize changes in the composition and structure of the gut microbial community, while untargeted metabolomics can capture disease-related metabolite fingerprint profiles. The combination of these two techniques helps reveal the interaction between microbes and host metabolism, providing more comprehensive insights into the pathogenesis of celiac disease (CeD) (Gu et al., 2024). Therefore, based on 16S rDNA sequencing and untargeted metabolomics, this study aims to investigate the roles of microbes and metabolites in different subtypes of CeD. Specifically, by comparing differences in microbes and metabolites between the asymptomatic CeD (SCeD) group and the healthy control (CDFH) group, we seek to identify microbes and metabolites with diagnostic value for SCeD. A diagnostic model will then be developed using machine learning, providing new methods and tools for the early diagnosis of SCeD. Additionally, by analyzing differences in microbes and metabolites between the SCeD group and the classic CeD (CDF) group, this study explores the roles of microbes and metabolites in the development of different CeD subtypes. This work not only provides a theoretical basis for a deeper understanding of the progression of different CeD subtypes but also lays the groundwork for the development of new therapeutic strategies.
2 Materials
2.1 Patients and healthy controls
Starting in 2022, the Gastroenterology Department of the People’s Hospital of Xinjiang Uygur Autonomous Region initiated an epidemiological survey. A total of 5,600 individuals participated in this investigation. Through screening, 54 patients tested positive for tTG were identified. Based on the questionnaires, 14 individuals who exhibited no clinical symptoms but had tTG levels greater than 200 were included in the SCeD group. Additionally, 30 patients with typical CeD diagnosed in our team’s earlier study were included as the CDF group, along with 30 healthy controls (CDFH group) who were negative for both EMA and tTG antibodies, matched by ethnicity, gender, and age (±3 years) (Shi et al., 2022). Thus, this study included a total of 44 cases in the disease group (CeD) (14 SCeD cases with complete epidemiological survey information and stool samples, and 30 CDF cases) and 30 cases in the healthy control group (CDFH), All participants included in this study are from the Xinjiang Uygur Autonomous Region of China. The inclusion and exclusion criteria for this study are as follows:
Inclusion criteria: CDF group: Positive for serum tissue transglutaminase IgA (tTG-IgA) or endomysial antibody IgA (EMA-IgA), with celiac disease (CeD) confirmed by small intestinal biopsy combined with histopathological diagnosis (Bai and Ciacci, 2017). SCeD group: Serum tTG-IgA titer 10 times the normal value, positive for EMA-IgA, and exempt from biopsy for direct diagnosis of CeD (Rubio-Tapia et al., 2023). Healthy control group: Negative for serum tTG-IgA or EMA-IgA, on a normal diet, and no chronic diseases in recent periods.
Exclusion criteria: Patients with other autoimmune diseases (including inflammatory bowel disease [IBD], autoimmune gastritis, type 1 diabetes mellitus [T1DM], and rheumatoid arthritis [RA]); Patients with other specific gastrointestinal infections (bacterial or viral infections) or parasitic infections; Pregnant or lactating women; Patients who have received antibiotic or probiotic treatment recently; Patients who are unwilling to participate in this study. Patients meeting any of the above criteria will be excluded from the study.
All participants in this study signed the informed consent form. This study was approved by the Ethics Committee of the People’s Hospital of Xinjiang Uygur Autonomous Region, with the Ethics Approval Number: KY20220311067.
3 Methods
3.1 16S rDNA sequencing and data processing
Total genomic DNA was extracted from stool samples of the enrolled population using the FastPure Stool DNA Isolation Kit (MJYH, Shanghai, China) according to the manufacturer’s instructions. DNA integrity was assessed by 1% agarose gel electrophoresis, and concentration and purity were determined using the NanoDrop2000 (Thermo Scientific, United States). Using the extracted DNA as a template, PCR amplification of the 16S rRNA gene V3-V4 variable region was performed with the barcoded upstream primer 338F (5’-ACTCCTACGGGAGGCAGCAG-3′) and downstream primer 806R (5’-GGACTACHVGGGTWTCTAAT-3′) (Marascio et al., 2023). Libraries were constructed using the NEXTFLEX Rapid DNA-Seq Kit, followed by adapter ligation, magnetic bead selection, PCR amplification, and magnetic bead recovery. Sequencing was performed on the Illumina NextSeq 2000 platform. Raw sequencing reads underwent quality control and assembly using fastp (Chen et al., 2018) (version 0.19.6) and FLASH (Magoč and Salzberg, 2011) (version 1.2.11). Reads were filtered for low-quality bases, short reads, and N-containing bases as required. Sequences were assembled based on overlap relationships and screened, with orientation adjusted according to barcodes and primers. OTUs were clustered at 97% similarity using UPARSE v7.1 (Edgar, 2013), and chimeras were removed. Sample sequences were downsampled to 20,000 sequences, achieving an average sequence coverage of 99.09% post-downsampling. OTU species taxonomic annotation was performed using RDP classifier (version 2.11) with a confidence threshold of 70%. Functional prediction analysis of 16S rRNA genes was conducted using PICRUSt2 (Douglas et al., 2020) (version 2.2.0).
3.2 Sample preparation, sequencing, and data processing for LC–MS
3.2.1 Solid sample processing
Place 50 mg of solid sample into a 2 mL centrifuge tube. Add one 6 mm diameter grinding bead. Extract metabolites using 400 μL of extraction solution (methanol:water = 4:1) for metabolite extraction. Grind for 6 min at −10 °C and 50 Hz using a cryogenic tissue grinder. Perform low-temperature ultrasonic extraction at 5 °C and 40 kHz for 30 min. After standing at −20 °C for 30 min, centrifuge at 4 °C and 13,000 g for 15 min. Transfer the supernatant to vials with inserts for instrument analysis. Equal volumes of metabolites from all samples were pooled to create QC samples. During instrument analysis, one QC sample was inserted every 5–15 samples to assess analytical process repeatability.
The analysis was performed on a Thermo Fisher Scientific Ultra High Performance Liquid Chromatography-Quadrupole-Tandem Mass Spectrometry system (UHPLC-Q Exactive HF-X) (Shanghai Meiji Biotechnology Co., Ltd.). Chromatographic conditions were as follows: 3 μL of sample was injected and separated on an HSS T3 column (100 mm × 2.1 mm i.d., 1.8 μm). Mobile phase A: 95% water + 5% acetonitrile (containing 0.1% formic acid); Mobile phase B: 47.5% acetonitrile + 47.5% isopropanol + 5% water (containing 0.1% formic acid). Flow rate: 0.40 mL/min; Column temperature: 40 °C. Mass spectrometry employed both positive and negative ion scanning modes. The mass scan range was 70–1,050 m/z. Sheath gas flow rate was 50 psi, auxiliary gas flow rate was 13 psi, auxiliary gas heating temperature was 425 °C, positive mode ion spray voltage was 3,500 V, negative mode −3,500 V, ion transfer tube temperature 325 °C, normalized collision energy 20–40–60 V cycle, MS1 resolution 60,000, MS2 resolution 7,500, data acquired in DDA mode.
Raw data were imported into Progenesis QI software for baseline filtering, peak identification, and other processing steps, yielding a data matrix containing retention times, mass-to-charge ratios, and peak intensities. Metabolite information was obtained by matching MS and MS/MS data against the HMDB, Metlin, and Meiji’s proprietary databases. The data matrix was uploaded to the Meiji Cloud platform, where it underwent the following preprocessing steps: 80% rule for missing value imputation, sum normalization, removal of QC samples with RSD > 30%, and log10 transformation. PCA and OPLS-DA analyses were performed using the R package ropls. Model stability was assessed through 7-fold cross-validation. Significantly different metabolites were identified based on VIP > 1 in the OPLS-DA model and p < 0.05 in Student’s t-tests. Finally, pathway annotation of differential metabolites was performed using the KEGG database, followed by pathway enrichment analysis with the Python scipy.stats package. Fisher’s exact test was applied to identify relevant biological pathways.
3.3 Statistical analysis
All data analyses were conducted on the Majorbio Cloud Platform.1 Alpha diversity analysis: The mothur software (Schloss et al., 2009) was used to calculate Alpha diversity indices (e.g., Chao 1, Shannon), and the Wilcoxon rank-sum test was applied to analyze differences in Alpha diversity across groups. Microbial community structure analysis: Principal Coordinate Analysis (PCoA) based on the Bray-Curtis distance algorithm, combined with the PERMANOVA non-parametric test, was used to analyze the similarity and differences in microbial community structure among samples. Screening of differentially abundant bacterial taxa: Linear Discriminant Analysis Effect Size (LEfSe) analysis (Barberán et al., 2012) (with thresholds: LDA > 2, p < 0.05) was performed to identify bacterial taxa with significant differences in abundance between groups. Impact of clinical indicators: Distance-based Redundancy Analysis (db-RDA) was used to investigate the influence of clinical indicators on gut bacterial community structure; linear regression analysis was employed to evaluate the effect of key clinical indicators on microbial Alpha diversity indices. Correlation network analysis: Species were selected for correlation network analysis [80] based on Spearman correlation analysis (with thresholds: |r| > 0.6, p < 0.05). Differences among multiple groups were analyzed using the Kruskal-Wallis test, while comparisons between two groups (CeD-CDFH, SCeD-CDFH, SCeD-CDF) employed Student’s t-test. Differences were considered statistically significant at p < 0.05. Differential metabolite analysis within each subgroup was screened using p-values and Variable Importance Projection (VIP) scores, defining metabolites with p < 0.05 and VIP > 1 as differentially altered. All significantly altered metabolites or bacterial species were incorporated into a random forest model, with highly important microbes and metabolites used to construct diagnostic models. Receiver operating characteristic (ROC) curves were plotted using R software packages, and area under the curve (AUC) was calculated to evaluate predictive model performance. Pearson correlation analysis was employed to assess correlations between differential metabolites and differential microbial communities, with analyses conducted at the genus level.
4 Results
4.1 CeD-induced gut microbiota alterations based on 16S rDNA data
For 16S rDNA sequencing, the generated sequences were clustered at the operational taxonomic unit (OTU) level with 97% similarity to reveal the composition of the gut microbiota. The Shannon diversity rarefaction curve tended to flatten (Figure 1A), indicating that the amount of sequencing data was appropriate and reasonable for representing the microbial community. In general, both the Shannon index and Chao index of the CeD group were lower than those of the CDFH group (Figures 1B,C). After dividing the disease group into different subtypes, the Sobs index of the SCeD group showed that the species richness of the SCeD group was lower than that of the other two groups (Supplementary Figures S1B,C). There was no significant difference in the Shannon index between the SCeD group and the CDF group, but both were significantly lower than that of the CDFH group (p < 0.05) (Figure 1D), which indicated that the species diversity of the disease groups was lower. The results of the Simpson index were consistent with those of the Shannon index. There was a significant difference in the Chao index between the SCeD group and the CDF group, with the SCeD group being lower than the CDF group (p < 0.05) (Figure 1E). Regarding the microbiota β-diversity, at the species and genus levels, there were certain differences in the principal coordinate analysis (PCoA) between the CeD group and the CDFH group (Figures 1F,G); there were significant differences in PCoA among the SCeD, CDF, and CDFH groups (Figures 1H,I).
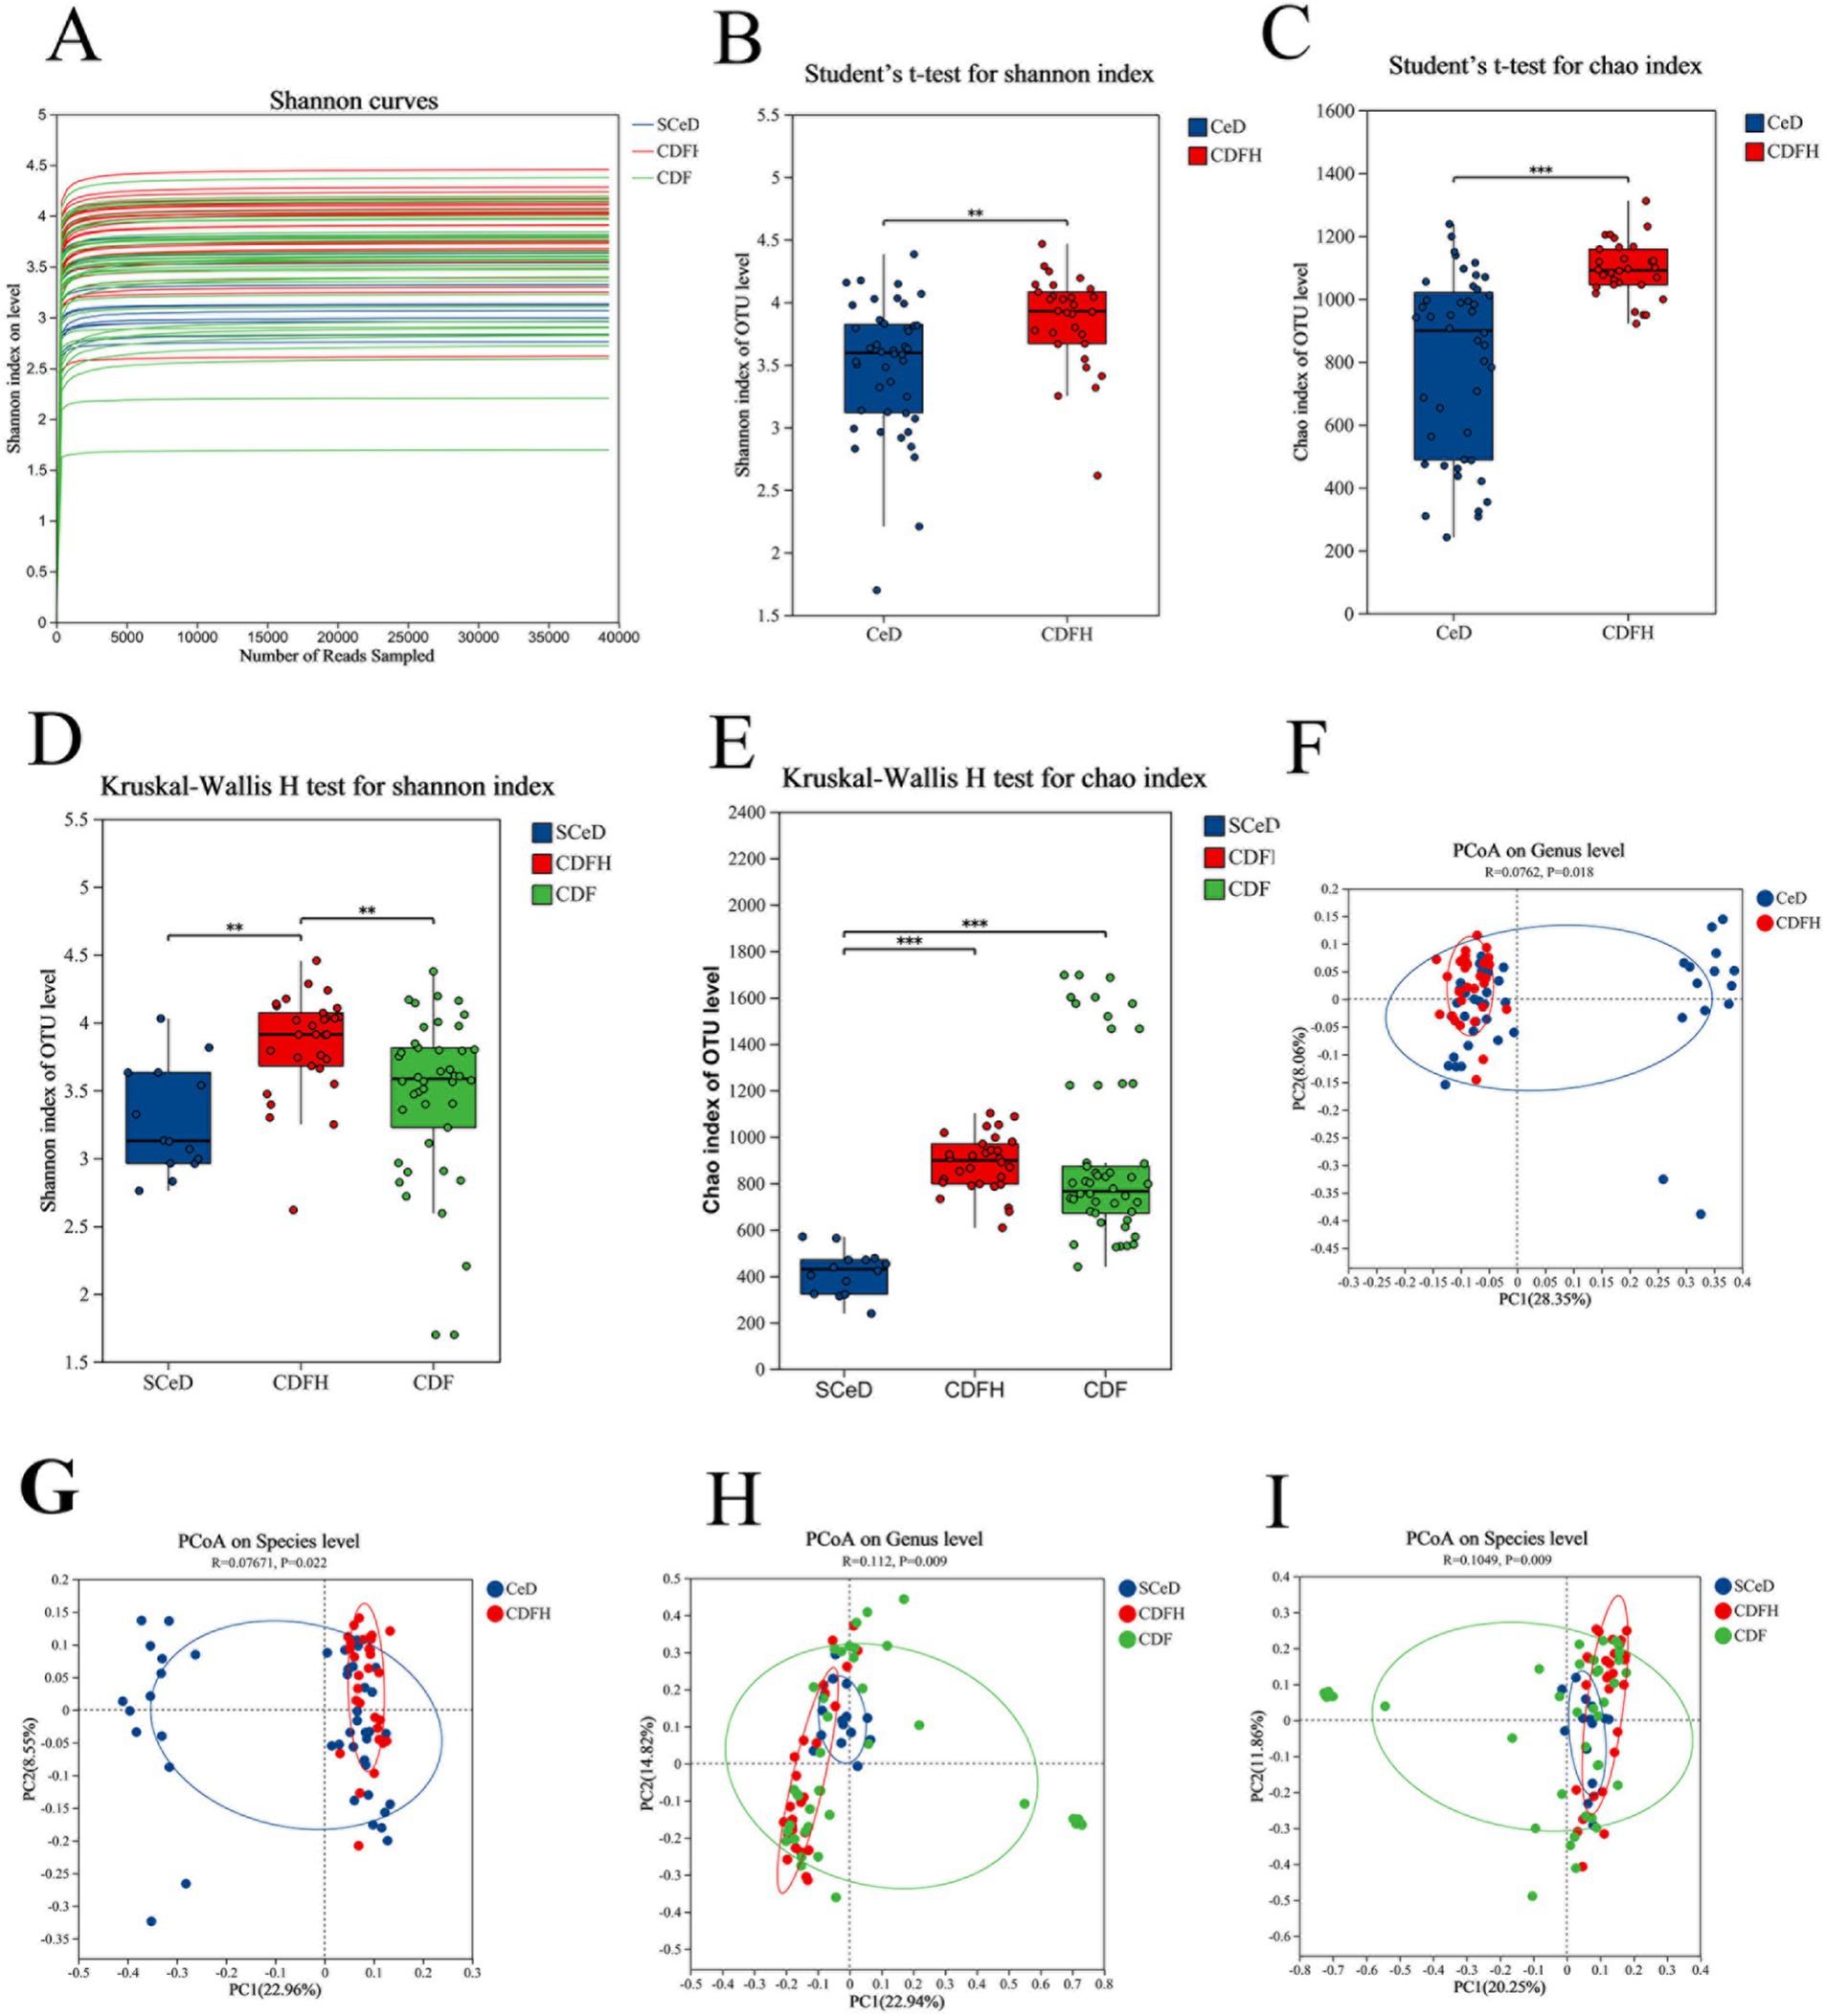
Figure 1. α-diversity and β-diversity. (A) Shannon diversity rarefaction curve. (B) Shannon index of the CeD group and CDFH group. (C) Chao index of the CeD group and CDFH group. (D) Shannon index of the SCeD group, CDF group, and CDFH group. (E) Chao index of the SCeD group, CDF group, and CDFH group. (F) β-diversity of the CeD group and CDFH group at the genus level. (G) β-diversity of the CeD group and CDFH group at the species level. (H) β-diversity of the SCeD group, CDF group, and CDFH group at the genus level. (I) β-diversity of the SCeD group, CDF group, and CDFH group at the species level.
We compared the relative abundance of gut microbiota at the phylum and genus levels between the CeD group (CDF group and SCeD group) and the CDFH group. At the phylum level, compared with CDFH, the CeD group exhibited lower abundance of Bacillota and Bacteroidota, while showing higher abundance of Actinomycetota and Pseudomonadota (Figure 2A). At the genus level, compared with CDFH, the CeD group exhibited lower abundances of Bacteroides, Faecalibacterium, Blautia, Agathobacter, and Alistipes; while Segatella and Bifidobacterium showed higher abundances (Figure 2B).
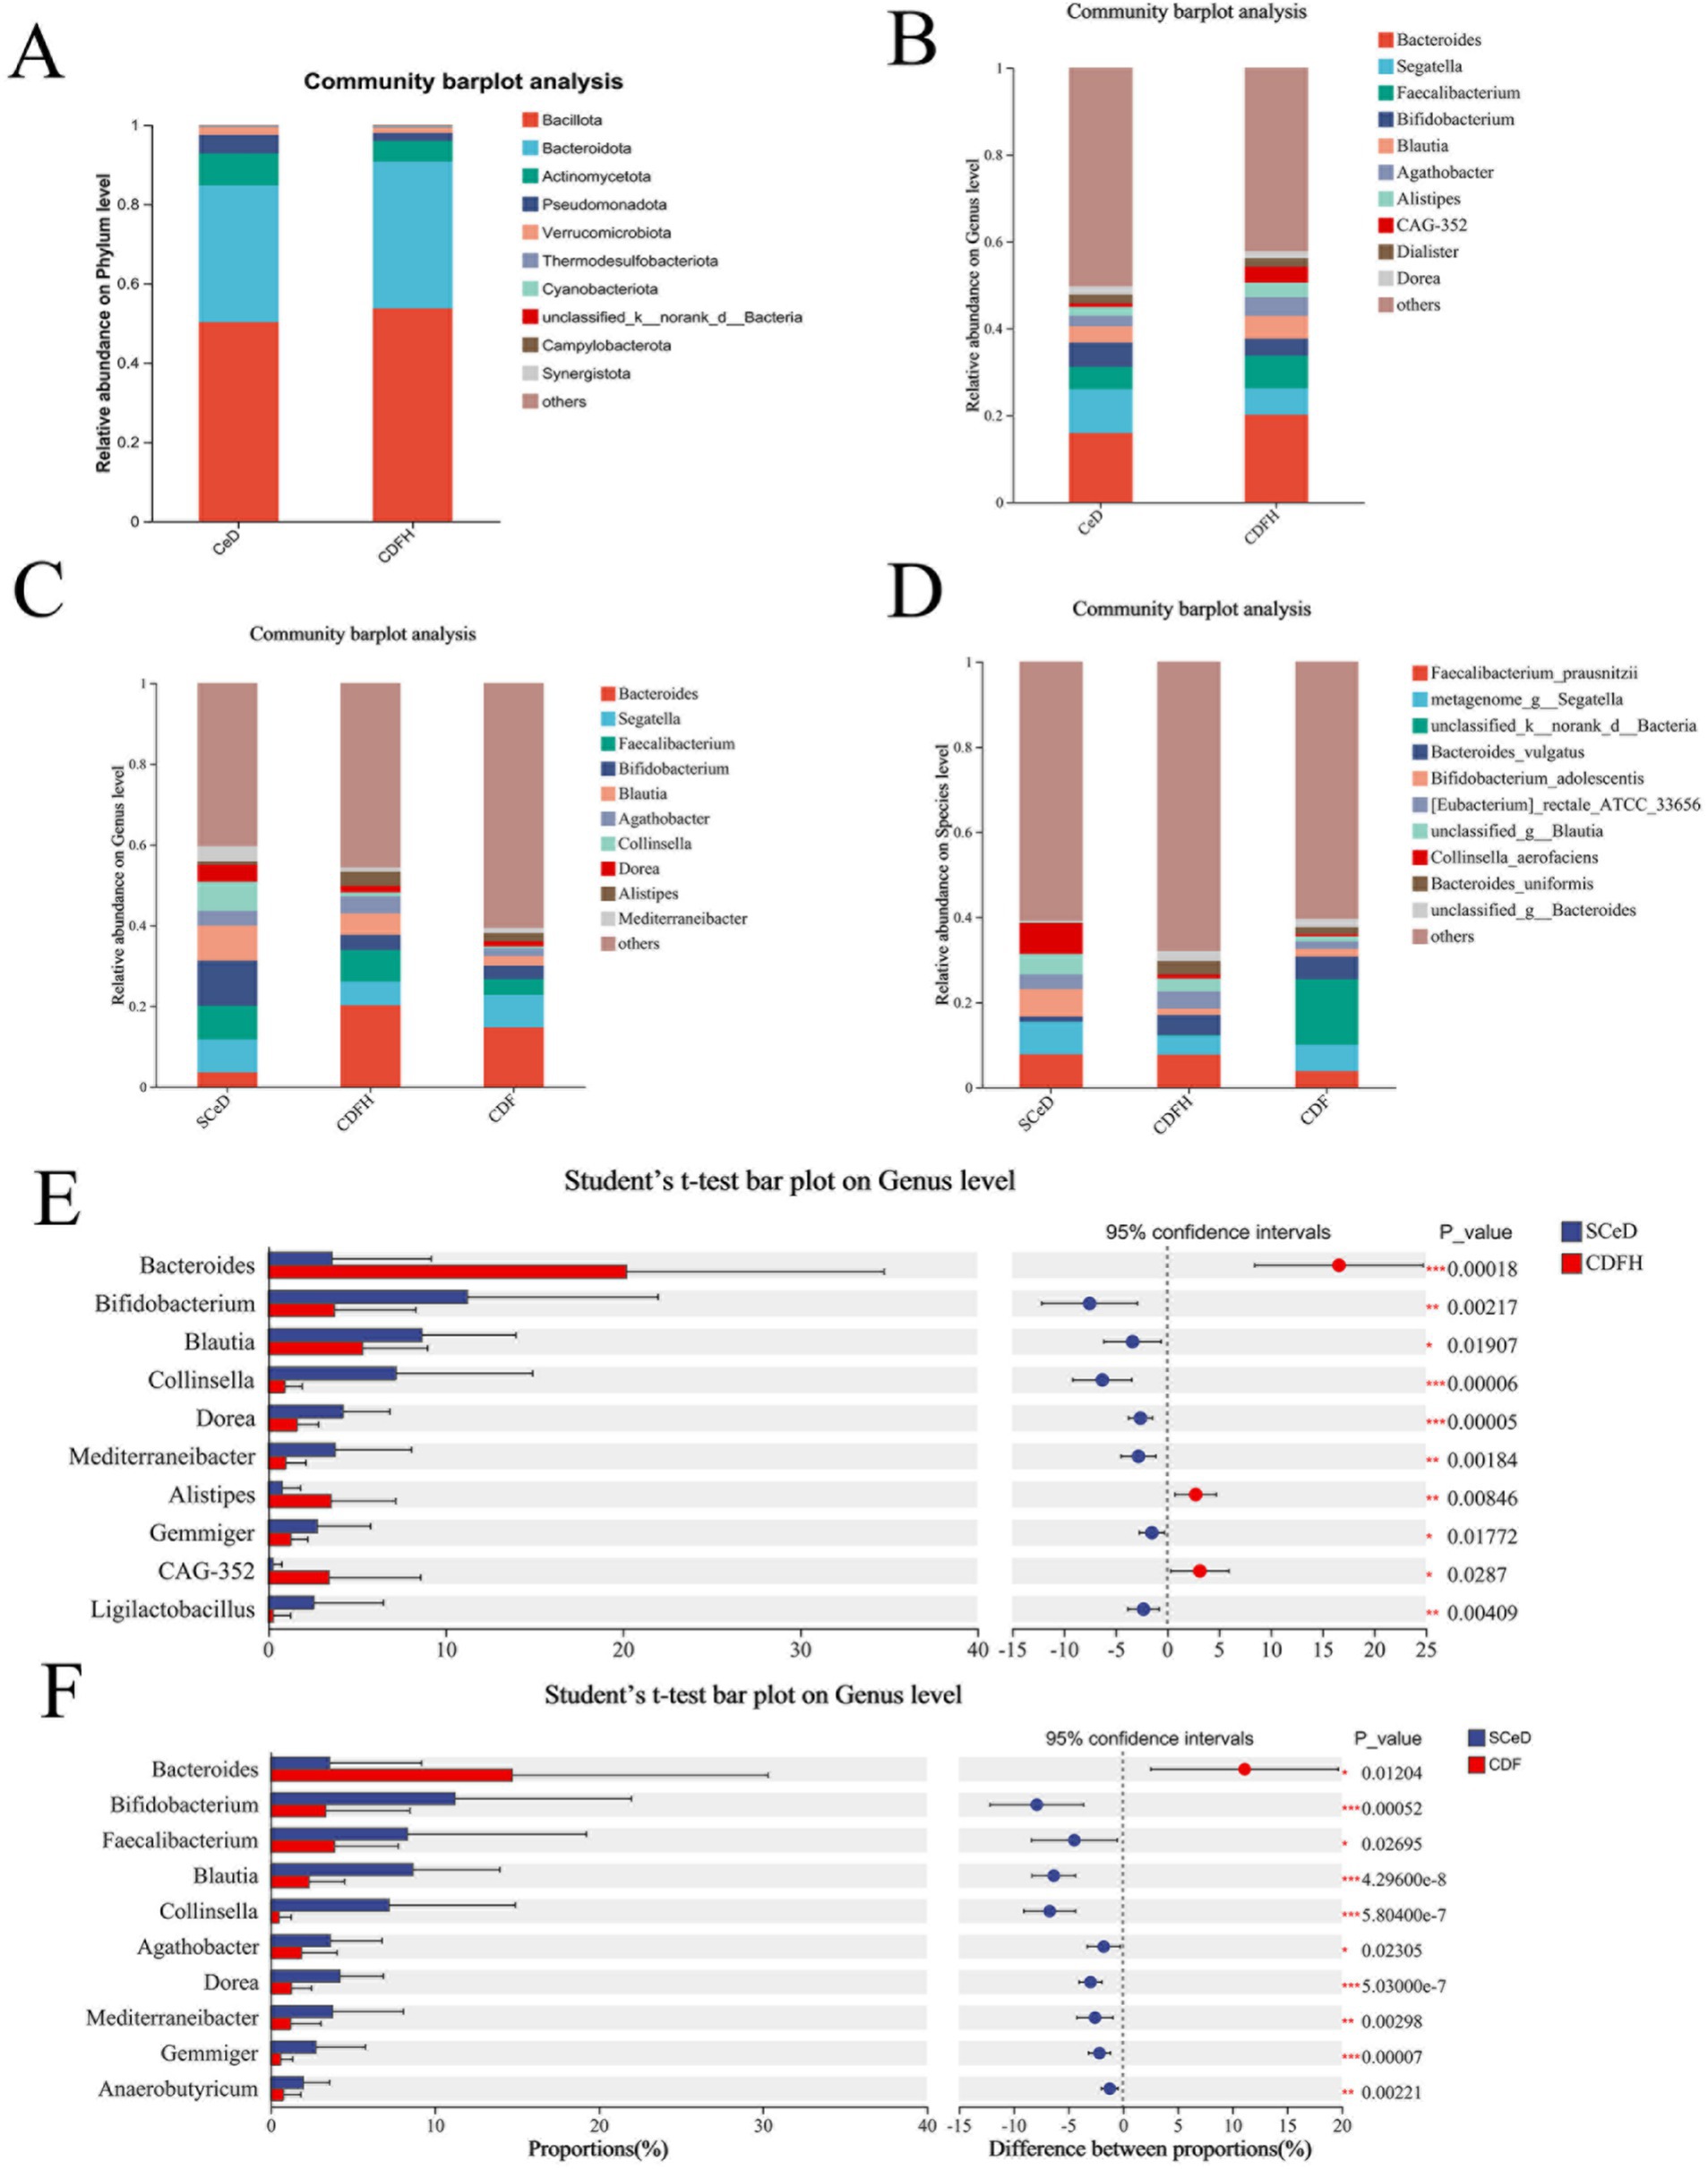
Figure 2. Microbial composition. (A) Phylum-level composition of the CeD group and CDFH group. (B) Genus-level composition of CeD and CDFH groups. (C) Phylum-level composition of SCeD, CDF, and CDFH groups. (D) Genus-level composition of SCeD, CDF, and CDFH groups. (E) Genus-level differential analysis between SCeD and CDFH groups. (F) Genus-level differential analysis between SCeD and CDF groups.
To understand the relative abundance of microbiota in different types of CeD patients, we compared the abundance differences of gut microbiota at the phylum and genus levels among the SCeD, CDF, and CDFH groups. At the phylum level (Figure 2C), Bacillota exhibited the highest relative abundance across all three sample groups. Beyond Bacillota, Actinomycetota showed the highest abundance in the SCeD group. While Bacteroidetota dominated in CDF. At the genus level (Figure 2D), Bacteroides and Faecalibacterium exhibited high abundance in the CDFH group, suggesting strong adaptability and competitiveness in this environment. In the SCeD group, Bifidobacterium, Blautia, and Faecalibacterium were highly abundant. In the CDF group, Bacteroides and Segatella were highly abundant.
To identify microorganisms exhibiting significant differences between the two groups, we performed analysis using Student’s t-test. The results are shown in the figure. Compared to the CDFH group (Supplementary Figure S2), the CeD group exhibited higher abundances of Mediterranei-bacter, Streptococcus, and Lactobacillus species, while Bacteroides, Agathobacter, Alistipes, and others were lower than in the CDFH group. Compared to the CDFH group (Figure 2E), the SCeD group exhibited significantly lower levels of Bacteroides, Alistipes, and CAG-352; conversely, the SCeD group showed significantly higher levels of Bifidobacterium, Blautia, Collinsella, Dorea, Mediterraneibacter, Gemmiger, and Lactobacillus compared to the CDFH group (p < 0.05). Compared with the CDF group (Figure 2F), the SCeD group showed significantly lower levels of Bacteroides (p < 0.05) and significantly higher levels of Bifidobacterium, Faecalibacterium, Blautia, Collinsella, Agathobacter, Dorea, Mediterraneibacter, Gemmiger, and Anaerobutyricum (p < 0.05).
4.2 Metabolomics analysis results
4.2.1 Metabolites significantly altered during the development of CeD and its subtypes
Metabolite characteristics among the groups are shown in Supplementary Figure S3. There were 1,543 shared metabolites among the CDFH, CDF, and SCeD groups; the number of unique metabolites in each group was 435, 92, and 4,170, respectively. There were both shared and differential metabolites among the groups, with specific details provided in Supplementary Tables. The partial least squares discriminant analysis (PLS-DA) model of the CeD and CDFH groups indicated differences in metabolites between the two groups (Figure 3A). The volcano plot showed that under the conditions of p < 0.05 and VIP > 1, there were 1,690 differentially expressed metabolites (96 upregulated and 1,594 downregulated) (Figure 3C). Through KEGG analysis, the differential metabolites were mainly enriched in pathways such as Steroid hormone biosynthesis, Retinol metabolism, and Neuroactive ligand-receptor interaction (Figure 3E), suggesting that these key metabolic functions are abnormal in CeD patients. The PLS-DA model of the SCeD and CDFH groups revealed significant differences in metabolites between the two groups (Figure 3B). The volcano plot showed that under the conditions of p < 0.05 and VIP > 1, there were 1,897 differentially expressed metabolites (308 upregulated and 1,589 downregulated) (Figure 3D). KEGG analysis indicated that these differential metabolites were mainly enriched in pathways including Steroid hormone biosynthesis, Primary bile acid biosynthesis, and Tryptophan metabolism (Figure 3F), suggesting that compared with the CDFH group, these key metabolic functions are abnormal in SCeD patients. These analyses indicate that Steroid hormone biosynthesis may play an important role in the development of CeD.
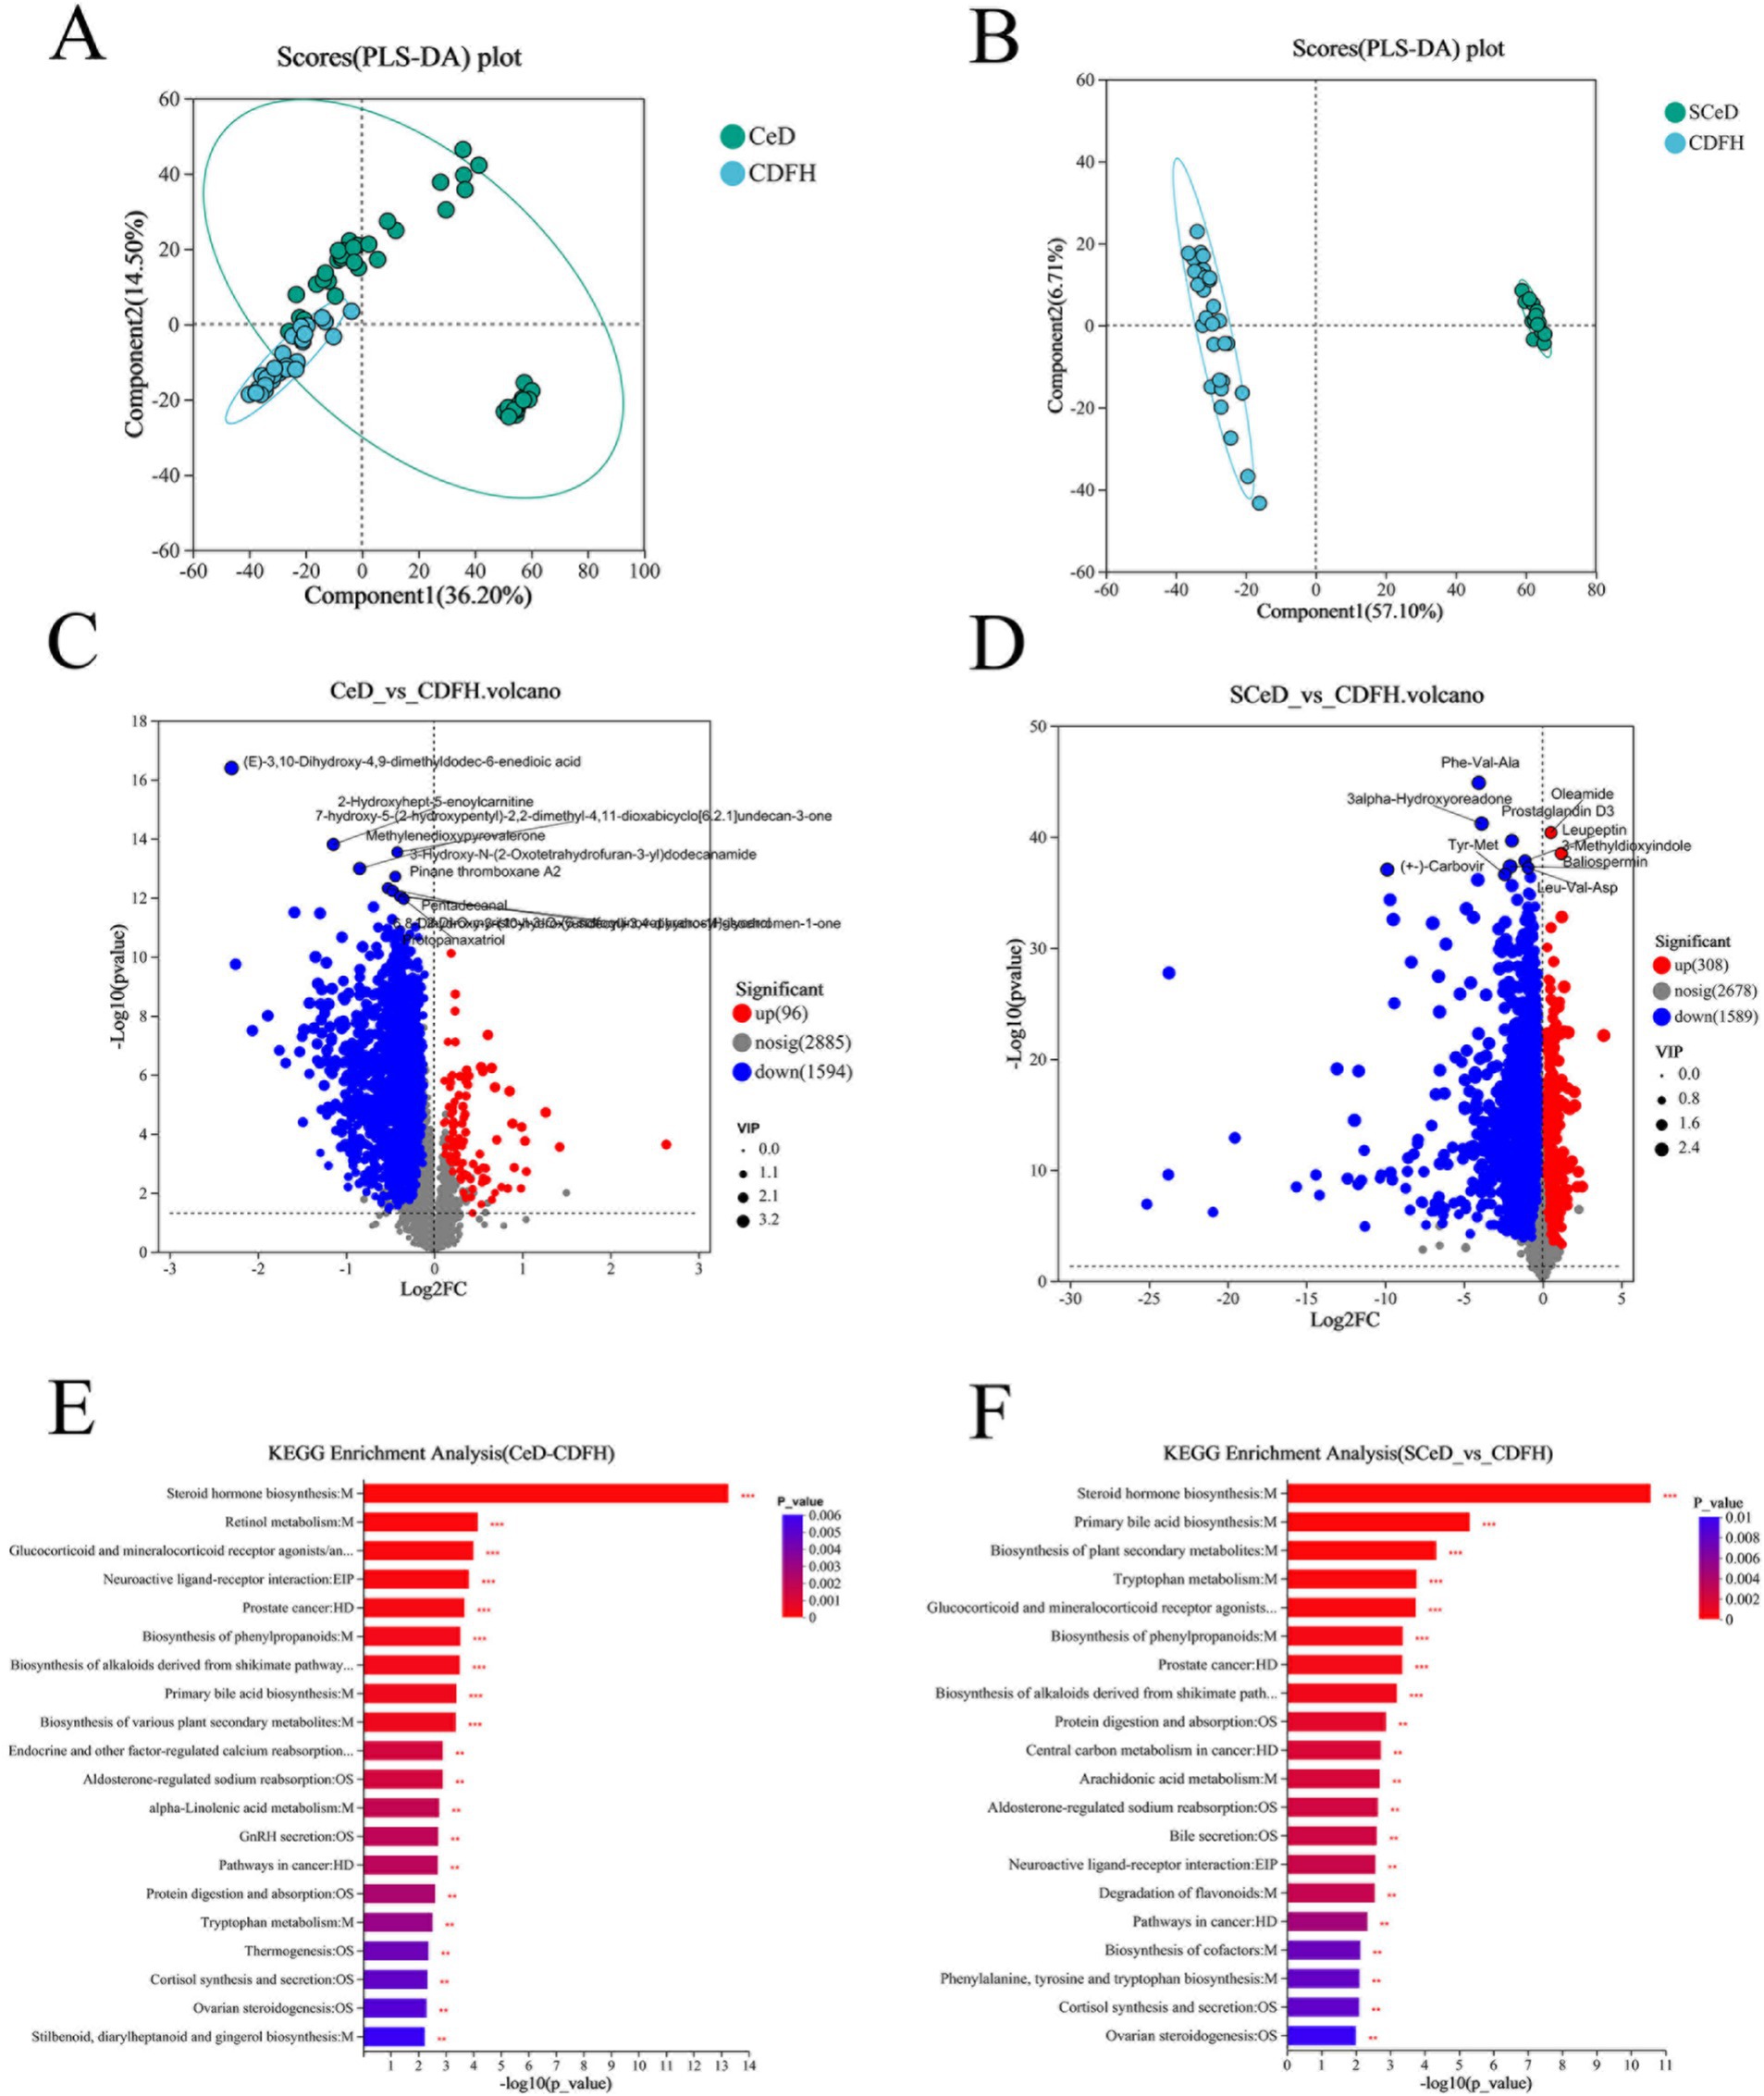
Figure 3. Metabolite changes in CeD patients. (A) PLS-DA scores of the CeD group vs. the CDFH group. (B) PLS-DA scores of the SCeD group vs. the CDFH group. (C) Volcano plot of differential metabolites between the CeD group and the CDFH group. (D) Volcano plot of differential metabolites between the SCeD group and the CDFH group. (E) KEGG enrichment analysis of differential metabolites between the CeD group and the CDFH group. (F) KEGG enrichment analysis of differential metabolites between the SCeD group and the CDFH group.
The x-axis represents the fold change value of metabolite expression difference between the two groups, i.e., log2FC; the y-axis represents the statistical test value of the difference in metabolite expression level change, i.e., −log10(p_value). The higher the value, the more significant the expression difference.
4.2.2 Relationship between different types of CeD and metabolites
The PLS-DA model results for the SCeD and CDF groups revealed significant differences in metabolites between the two groups (Figure 4A). Under the conditions of p < 0.05 and VIP > 1, 1,835 differentially expressed metabolites were identified (599 upregulated and 1,236 downregulated) (Figure 4B). KEGG analysis revealed that differentially expressed metabolites were primarily enriched in pathways including Tryptophan metabolism, Biosynthesis of plant secondary metabolites, Biosynthesis of alkaloids derived from shikimate pathway, and Degradation of flavonoids (Figure 4C). Compared to the CDF group, 6-methyl-5-nitroquinoline (FC = 15.8745), Nb-p-coumaroyltryptamine (FC = 11.9082), 2-oxo-3-phenylpropanoate (FC = 9.0352), and 4-hydroxy-5-(phenyl)-valeric acid-O-sulfate (FC = 7.4546) were significantly upregulated in the SCeD group with large fold changes (Figure 4D).
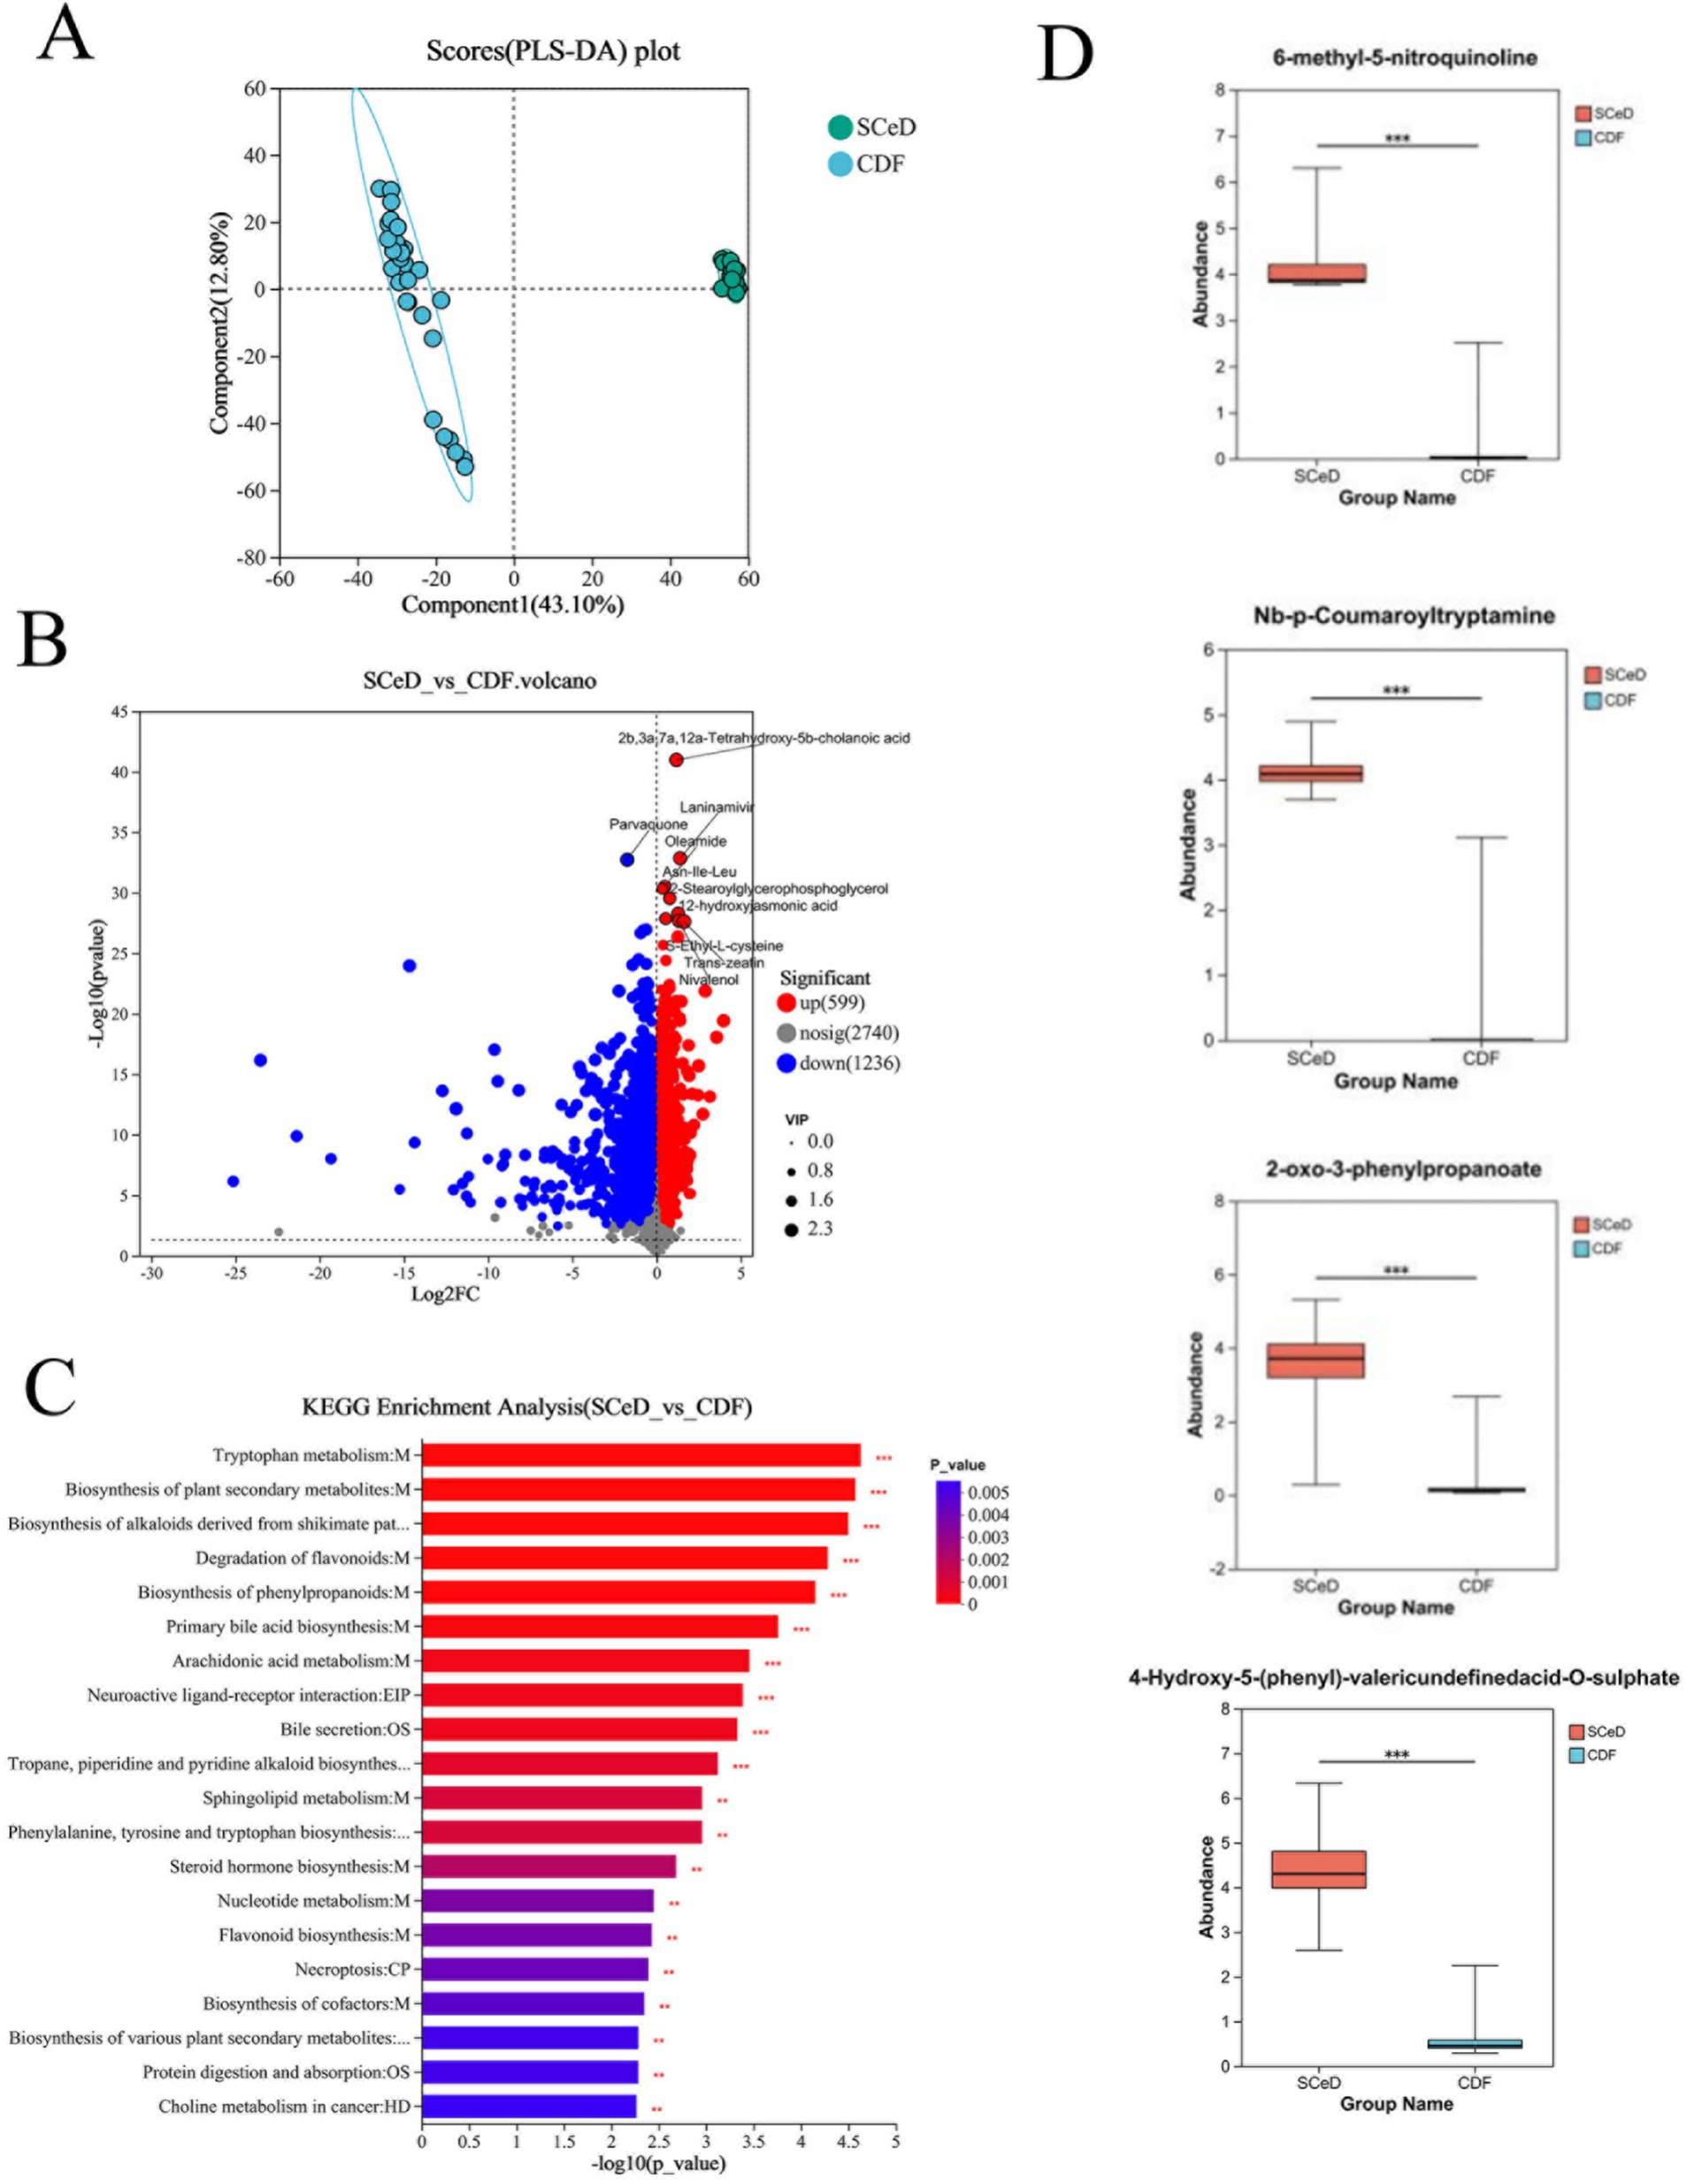
Figure 4. Differences in metabolite types between CeD groups. (A) PLS-DA scores for SCeD and CDF groups. (B) Volcano plot of differential metabolites between SCeD and CDF groups. (C) KEGG analysis of differential metabolites between SCeD and CDF groups. (D) Top four differential metabolites with the highest fold change in SCeD relative to CDF groups.
4.3 Construction of diagnostic models for CeD and SCeD based on differential microorganisms and metabolites
We developed a diagnostic model for CeD (SCeD and CDF) based on differential microorganisms and metabolites. To investigate the diagnostic value of microorganisms in CeD, we employed the random forest model to identify candidate microbial taxa for achieving the optimal AUC value. Through feature selection with 10-fold cross-validation, we ultimately selected five candidate microbial taxa to construct the diagnostic model for CeD (AUC = 0.84, Figures 5A,B), indicating that these five taxa hold potential as diagnostic biomarkers for CeD. To investigate the diagnostic value of metabolites for CeD, we selected the top 7 differential metabolites (ranked by species importance) based on the random forest model to construct a diagnostic model for CeD. Each of these 7 differential metabolites individually exhibited high diagnostic value for CeD (AUC ≥ 0.85, see Supplementary Figure S4 for details), and the diagnostic model built by combining these 7 differential metabolites achieved an AUC of 0.96 (Figures 5C,D). In addition, we constructed a combined diagnostic model based on both differential microorganisms and differential metabolites, which significantly improved the diagnostic value for CeD (AUC = 0.98, Supplementary Figure S5). These results indicate that the CeD diagnostic models constructed based on either differential microorganisms or metabolites both have good diagnostic value. However, the current sample size is limited, and their diagnostic efficacy has not been validated in larger-scale, more diverse clinical cohorts. Therefore, these models are not yet ready for direct application in clinical testing.
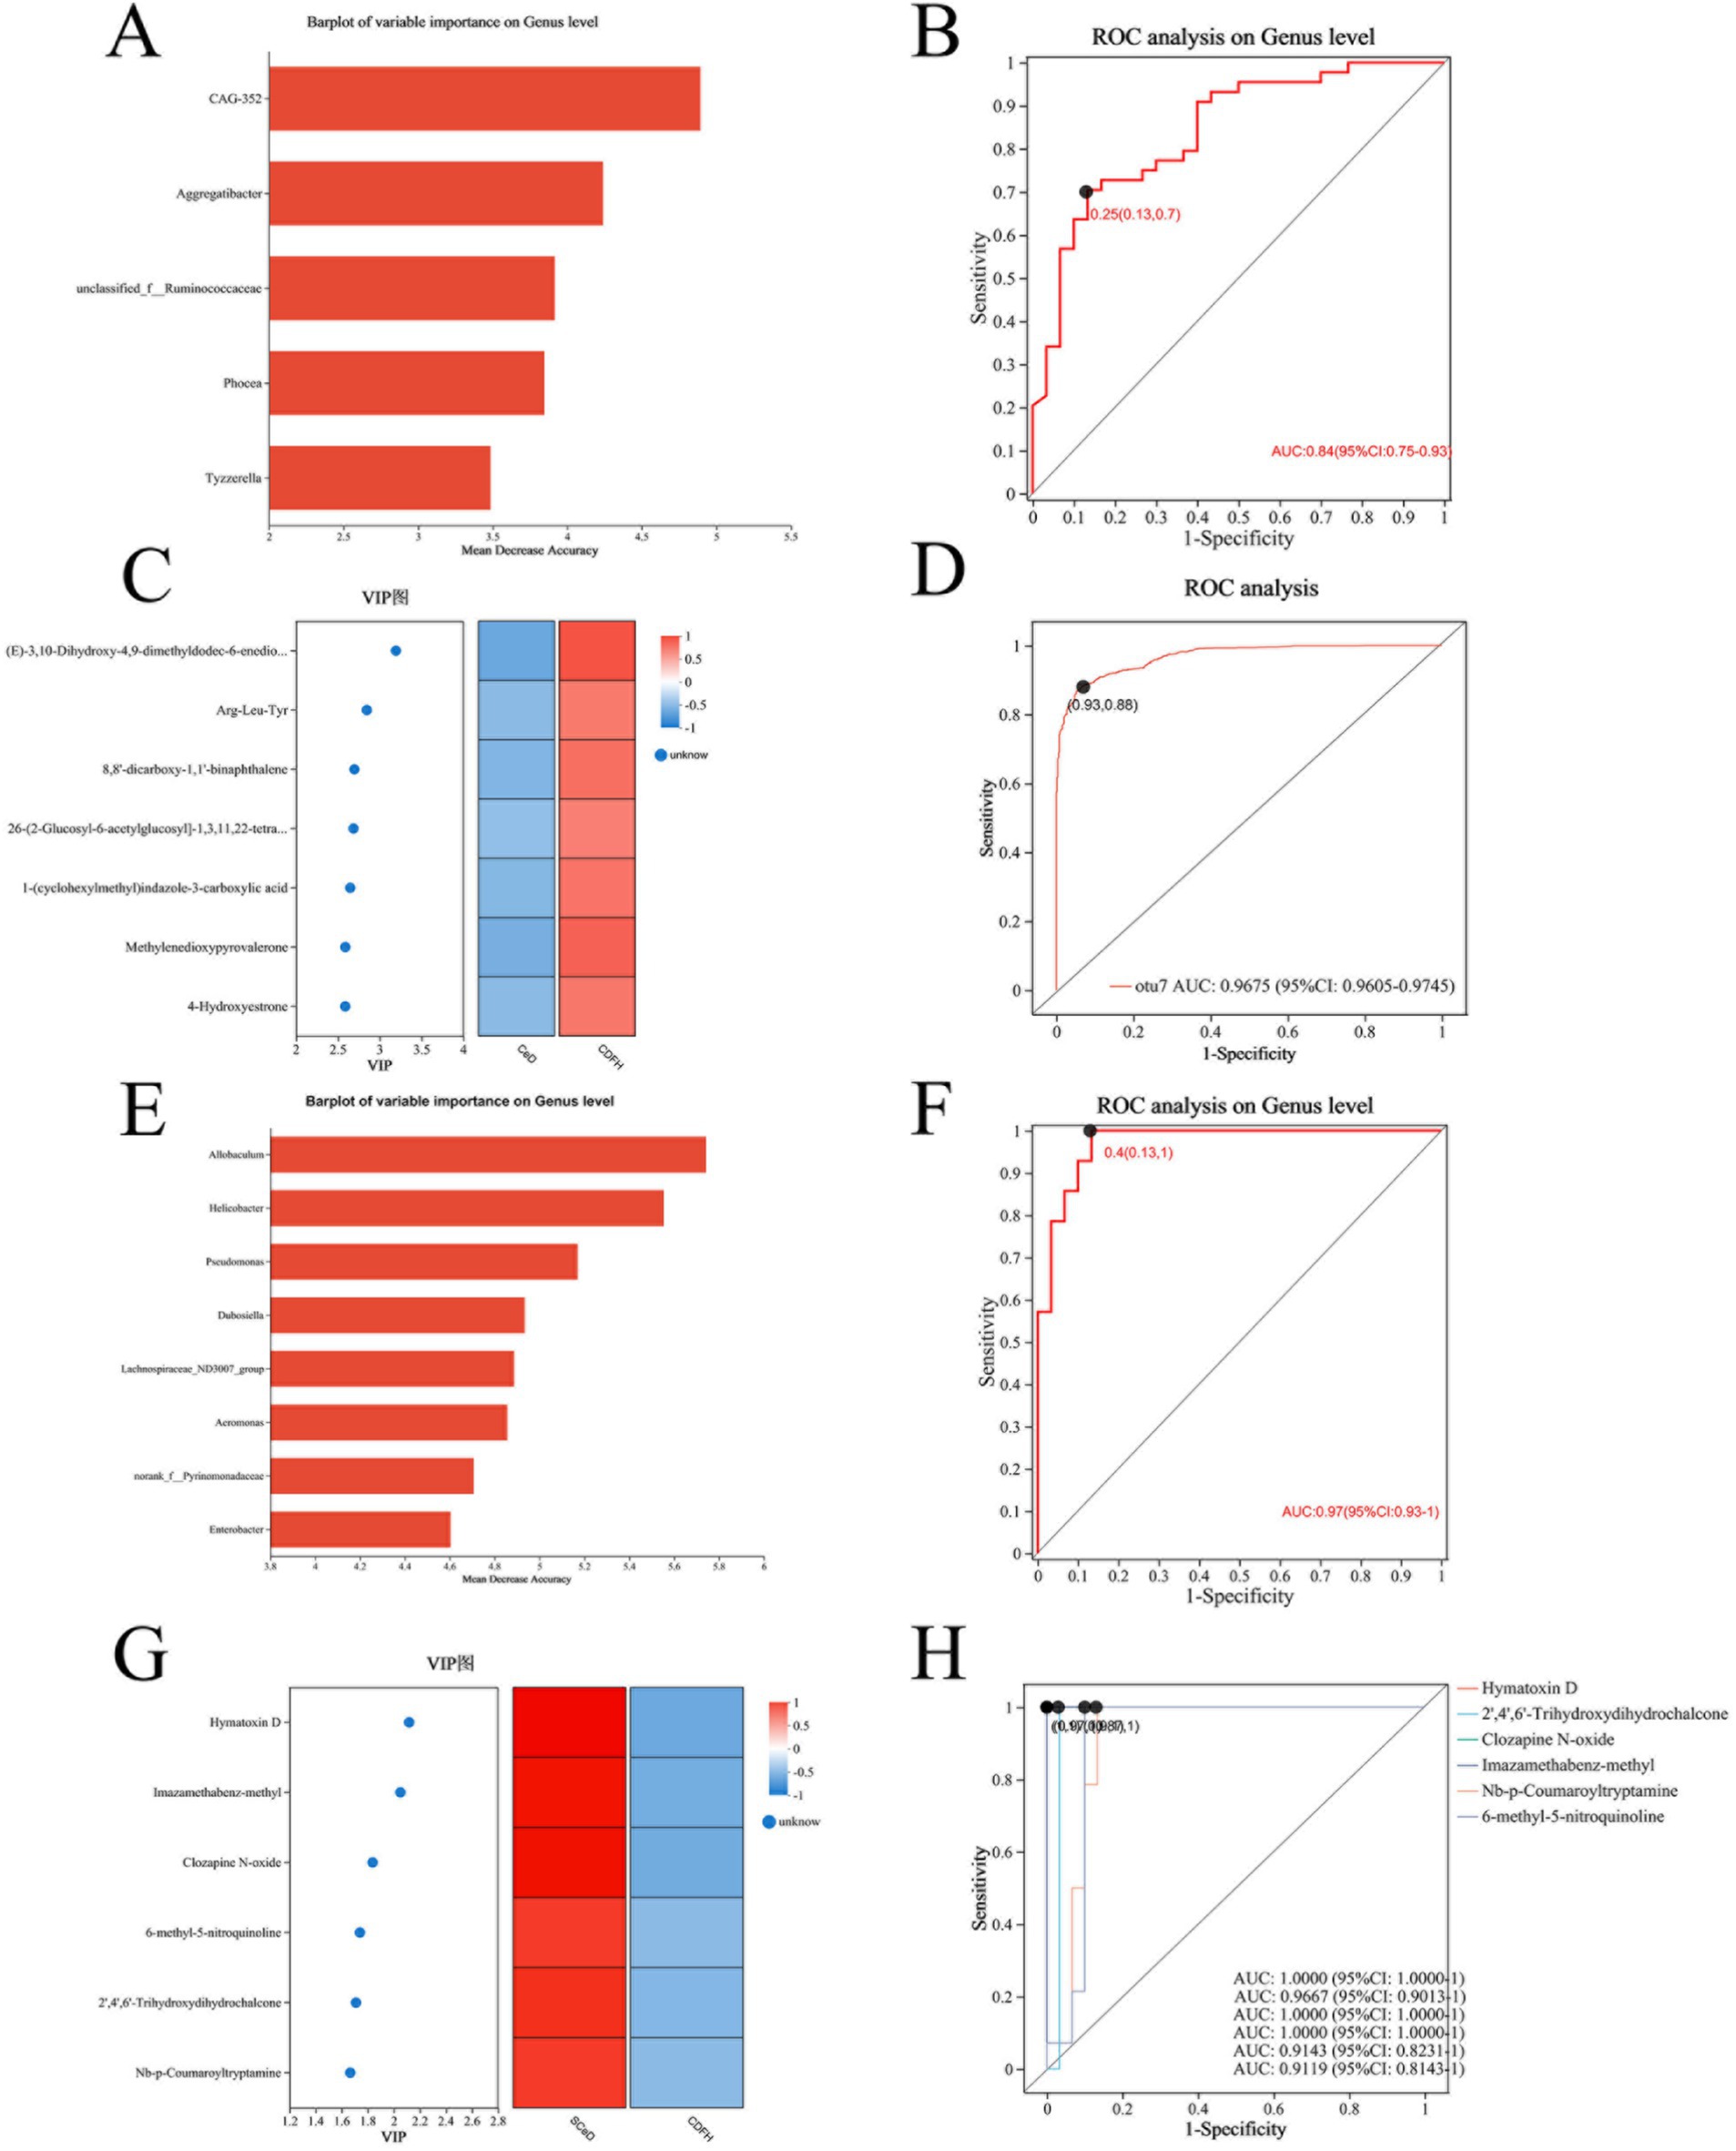
Figure 5. Diagnostic Models Based on Differential Microorganisms and Metabolites. (A) Top 5 differential microorganisms (ranked by importance) between the CeD group and CDFH group. (B) ROC curve of the 5 differential microorganisms for CeD. (C) Top 7 differential metabolites between the CeD group and CDFH group. (D) ROC curve of the 7 differential metabolites for CeD. (E) Top 8 differential microorganisms (ranked by importance) between the SCeD group and CDFH group. (F) ROC curve of the 8 differential microorganisms for SCeD. (G) Top 6 differential metabolites between the SCeD group and CDFH group. (H) ROC curve of the 6 differential metabolites for SCeD.
To explore the diagnostic ability of differential microorganisms and differential metabolites for SCeD, we performed random forest regression analysis based on differential microorganisms and used the top 8 microorganisms (ranked by importance) to establish a diagnostic model. The combined diagnostic model constructed based on these 8 microorganisms achieved an AUC of 0.97 (Figures 5E,F), indicating excellent diagnostic efficacy of this model—i.e., these 8 microorganisms have the potential to serve as potential biomarkers for SCeD. Furthermore, based on the VIP values of differential metabolites between the two groups, we selected the top 6 metabolites (ranked by VIP values) to establish a diagnostic model (AUC ≥ 0.9, Figures 5G,H). The AUC values of Hymatoxin D, 2′,4′,6′-Trihydroxydihydrochalcone, Clozapine N-oxide, Imazamethabenz-methyl, Nb-p-Coumaroyltryptamine, and 6-methyl-5-nitroquinoline were 1, 0.9667, 1, 1, 0.9143, and 0.9119, respectively. The results indicated that these metabolites may have the ability to distinguish between SCeD and CDFH. In conclusion, these differential microorganisms and metabolites exhibit good discriminatory potential for the SCeD group.
4.4 Correlation analysis of differential microorganisms and differential metabolites
Given the significant differences in microbial and metabolite levels across subgroups, and considering that combining these factors enhances diagnostic performance, analyzing correlations between microorganisms and metabolites is of great significance. Spearman correlation analysis revealed correlations between the top 20 differentially abundant microorganisms and metabolites, as shown in Figure 6. Correlation analysis between CeD and CDFH groups revealed that Bacteroides and Alistipes were positively correlated with Docosa-4,7,10,13,16,19-hexaenoic acid ethyl ester, Tetracosahexaenoic acid, and 3-Ketocholanic Acid; and negatively correlated with N-Acetylcadaverine, Lauryldiethanolamine, and Farnesyl acetone (Figure 6A). Spearman correlation analysis between the SCeD group and CDFH group revealed consistent relationships between Bacteroides and CAG-352 with metabolites: both showed significant positive correlations with multiple metabolites including Vaccenic acid, 3-Ketocholanic Acid, and Docosa-4,7,10,13,16,19-hexaenoic acid ethyl ester; while negatively correlated with Lauryldiethanolamine, Xanthine, and L-Isoleucine. Bifidobacterium, Collinsella, and Dorea showed positive correlations with Indoline and Lauryldiethanolamine, and negative correlations with Mesobilirubinogen, Vaccenic acid, and St (28:1_o_s) (Figure 6B). In both SCeD and CDF groups, Bacteroides showed positive correlations with Mesobilirubinogen, Cholesterol sulfate, and Tetracosahexaenoic acid; and negative correlations with Docosahexaenoic acid ethyl ester, L-Isoleucine, and Lauryldiethanolamine. Microorganisms such as Collinsella, Dorea, and Gemmiger were positively correlated with Docosahexaenoic acid ethyl ester, L-Isoleucine, and Lauryldiethanolamine; negatively correlated with 14-Methylpentadecanoic acid, Docosa-4,7,10,13,16,19-hexaenoic acid ethyl ester, and Tetracosahexaenoic acid (Figure 6C).
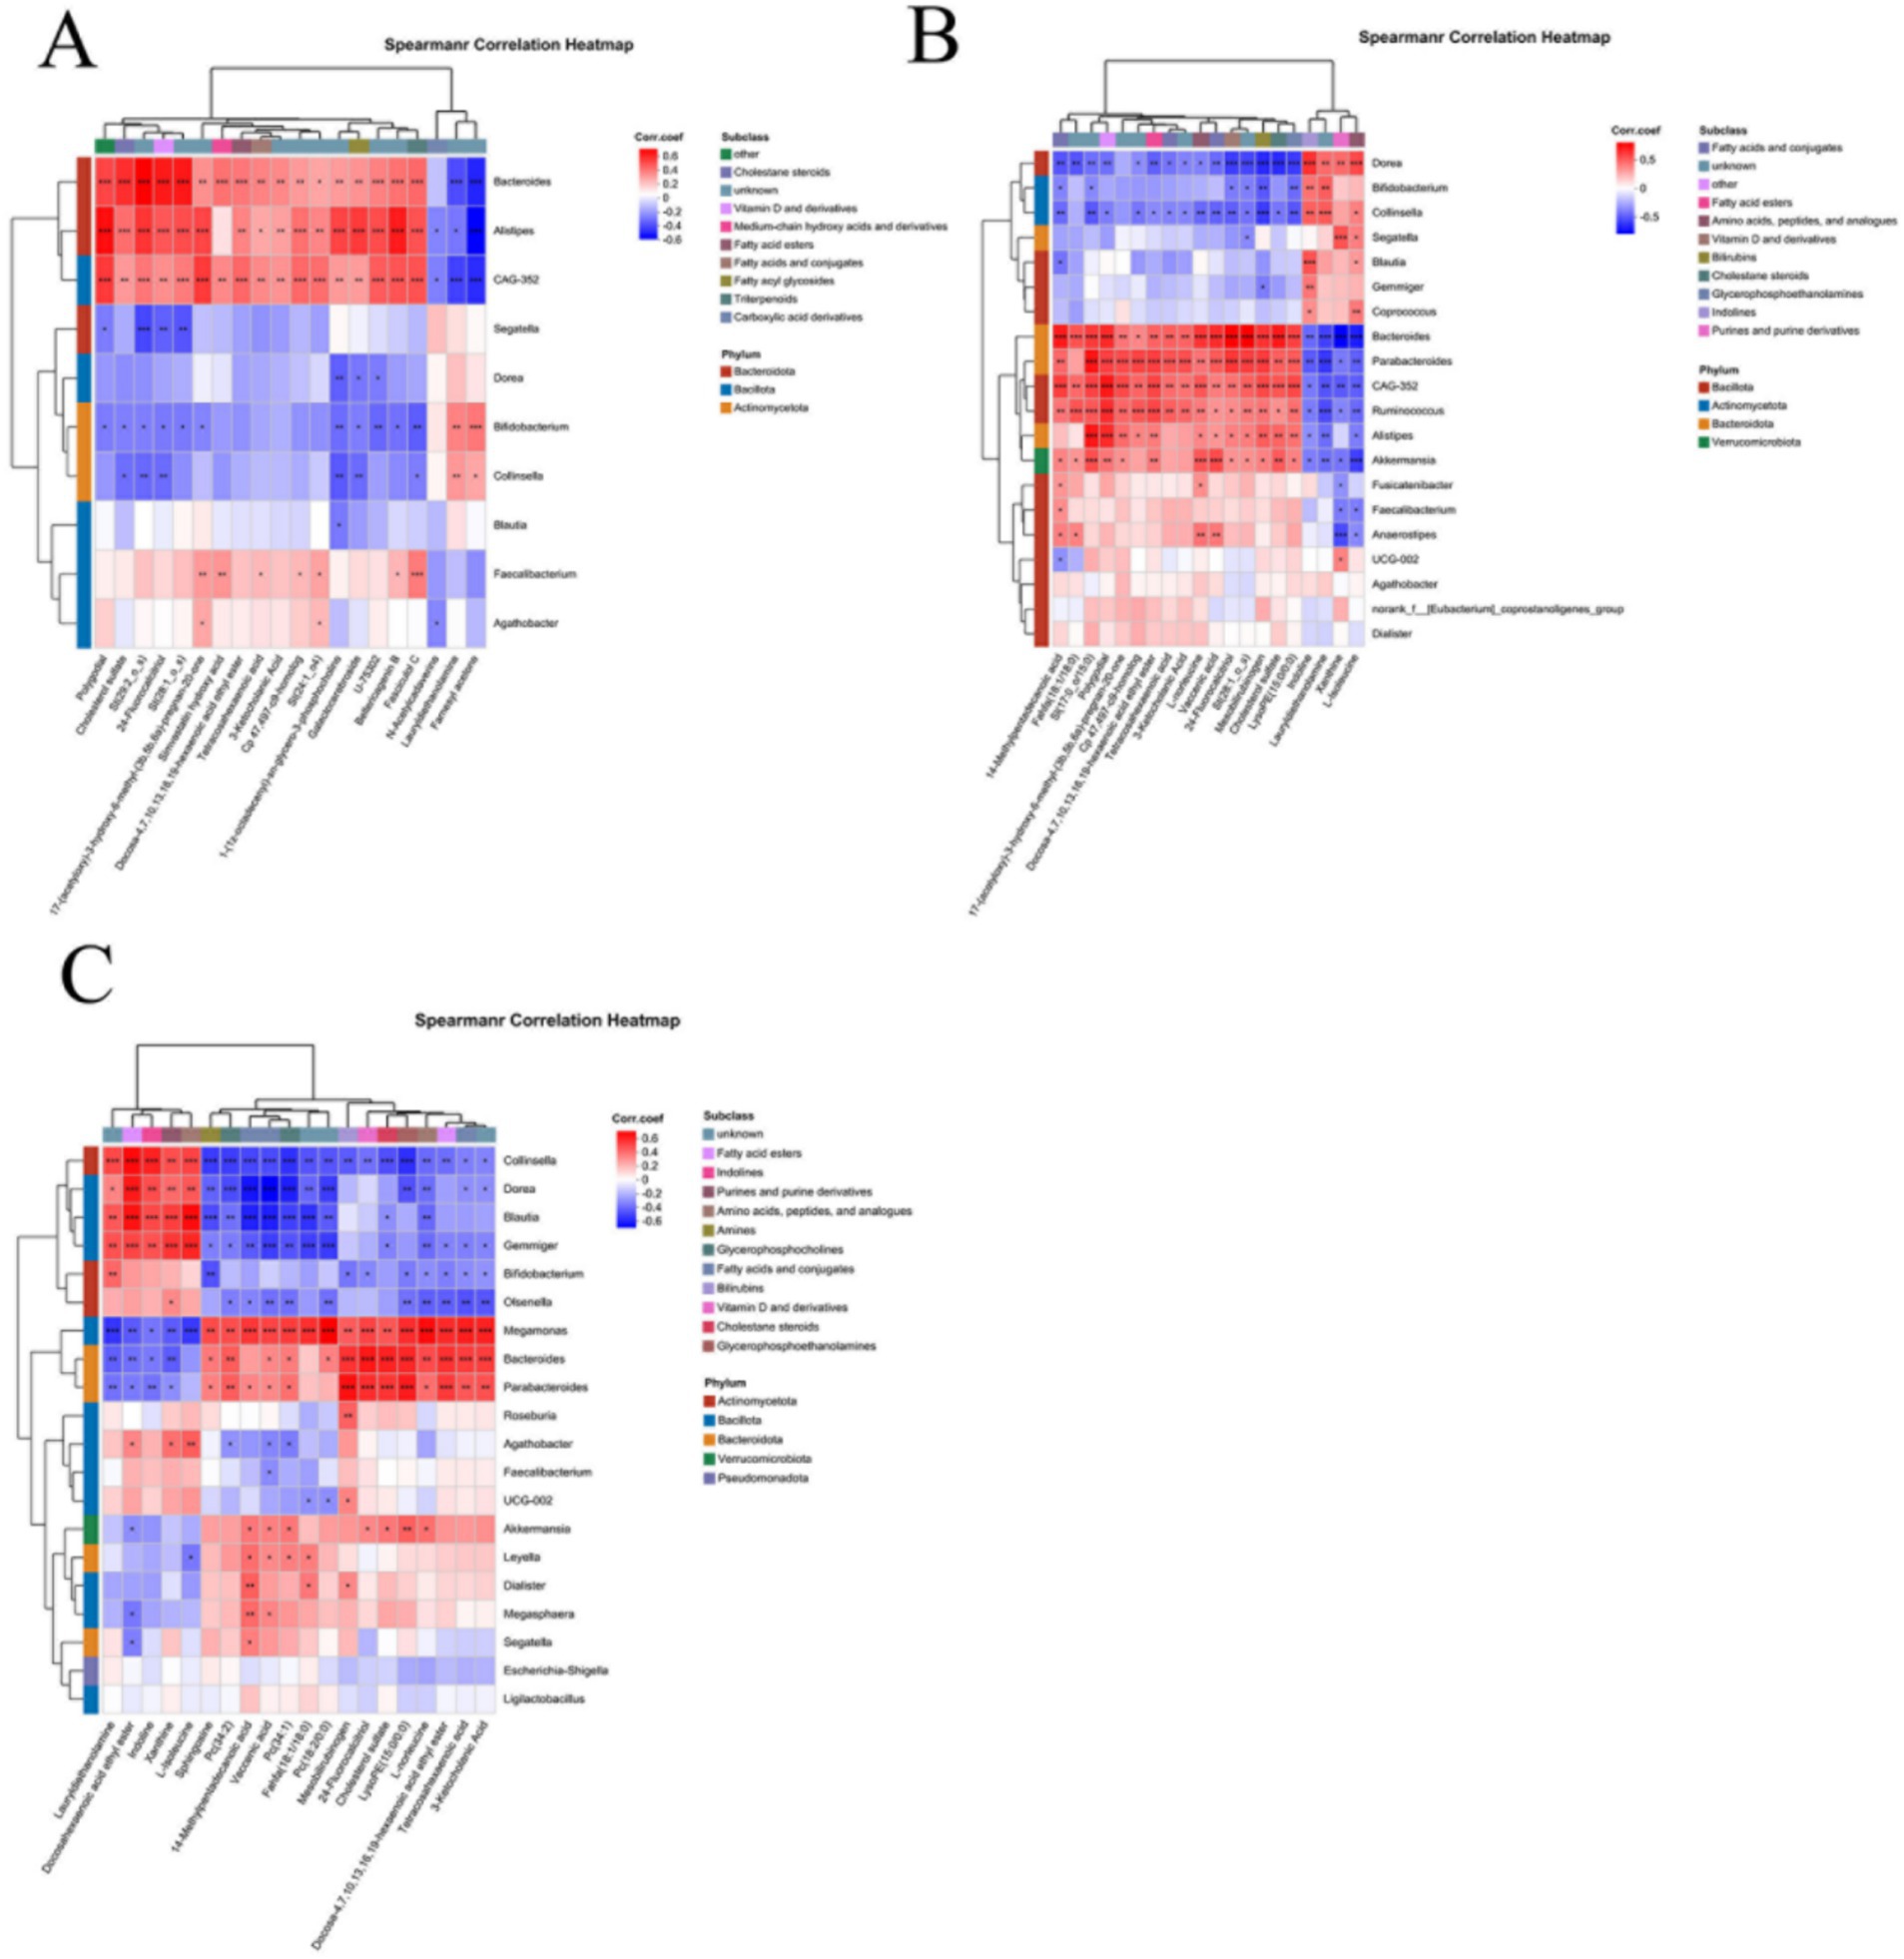
Figure 6. Correlation analysis of differential microbes and differential metabolites. (A) Correlation between CeD and CDFH groups. (B) Correlation between SCeD and CDFH groups. (C) Correlation between SCeD and CDF groups.
5 Discussion
In this study, we analyzed 16 s rDNA sequencing and LC–MS data from 74 fecal samples and identified differences in various microorganisms and metabolites across comparative groups. Integrated multi-omics analysis revealed specific microbes and metabolites associated with the occurrence and symptoms of CeD. The multi-omics integration approach helped uncover biologically relevant pathways in CeD, while machine learning enabled the identification of multiple biomarkers capable of effectively distinguishing the SCeD group from the CDFH group. Furthermore, our results demonstrated differences in microorganisms and metabolites between the symptomatic CeD group (CDF) and the asymptomatic CeD group (SCeD), indicating the important role of microbes and metabolites in driving CeD symptoms.
At the phylum level, Firmicutes accounted for the highest proportion across all groups, which is consistent with previous CeD studies reporting Firmicutes as the dominant phylum in fecal microbiota (Constante et al., 2022). Apart from Firmicutes, the SCeD group showed a higher proportion of Actinobacteria. Actinobacteria are Gram-positive bacteria widely distributed in nature and exhibit a dual functional nature. Bifidobacteria, representative probiotics within this phylum, can protect the intestine by modulating immune responses and enhancing the intestinal barrier (Al-Sadi et al., 2021; Zhou et al., 2024). However, the genus Actinomyces constitutes 55–68% of Actinobacteria and, along with its related metabolites, plays a pathogenic role in genitourinary tract infections and actinomycosis (Gajdács and Urbán, 2020; Könönen and Wade, 2015). Additionally, one study reported elevated levels of Actinobacteria in cancer groups of unknown primary origin (Dorobisz et al., 2024). Another study indicated that CeD patients had relatively higher proportions of Firmicutes and Actinobacteria compared to treated subjects [68]. These findings suggest that Actinobacteria may be associated with the development and progression of CeD.
At the genus level, compared with the CDFH group, the CeD group exhibited lower abundances of Bacteroides, Faecalibacterium, Blautia, Agathobacter, and Alistipes, and higher abundances of Segatella and Bifidobacterium. The change in Bacteroides abundance was consistent with the findings of a previous study (Di Biase et al., 2021). Studies have shown that Bacteroides can enhance intestinal barrier function, regulate immunity, and modulate inflammation by producing short-chain fatty acids (SCFAs) (Brown et al., 2019); thus, immune dysregulation and intestinal barrier dysfunction in CeD patients may be closely associated with Bacteroides. However, other studies have indicated that Bacteroides dominates the duodenal microbiota in active CeD (Lupu et al., 2023). Such discrepancies among different studies may be closely related to disease status and sample type. The changes in Faecalibacterium and Blautia were also consistent with previous research, showing a significant decrease in their abundances in CeD (Shi et al., 2022). Agathobacter abundance was higher in groups with high genetic risk (HLA DQ2/DQ8 positive) and positive serum antibodies, while Alistipes abundance was higher in non-high-risk groups (Aguayo-Patrón et al., 2023). Additionally, studies have reported that Agathobacter—a genus that produces SCFAs—is reduced in CeD (Jing et al., 2023), which is consistent with the results of our study. The mechanism underlying the role of Segatella in CeD remains unclear. However, studies have shown that Segatella abundance is increased in rheumatoid arthritis (RA), and its potential role in the pathogenesis of RA may involve stimulating helper T cell (Th) 17 populations and inducing the production of Th17 cell-related cytokines (IL-6 and IL-23) (Korzeniowska et al., 2024). IL-6, IL-23, and Th17 cells have also been reported in CeD-related studies (Fryk et al., 2024). Therefore, the presence of CeD-related inflammatory factors may be associated with Segatella.
Compared with the CDFH group, the SCeD group exhibited significantly lower abundances of Bacteroides, Alistipes, and CAG-352, and significantly higher abundances of genera including Bifidobacterium, Blautia, Collinsella, Dorea, Mediterraneibacter, Gemmiger, and Ligilactobacillus. Since no detailed reports on the microbiota of SCeD patients have been published previously, we can only provide a possible explanation for the development of SCeD based on the inherent functions of the bacteria themselves. Some bacteria with anti-inflammatory effects (Blautia, Gemmiger) were more abundant in the SCeD group; it is hypothesized that the microbiota may compensate for the host’s physiological imbalance by increasing probiotics, thereby alleviating the occurrence of symptoms (Chandrasekaran et al., 2024). Studies have shown that the abundance of Bacteroides is lower in patients with inflammatory bowel disease (IBD) (Zhou and Zhi, 2016), and supplementation with Bacteroides thetaiotaomicron and its inactivated form can alleviate colitis by inhibiting the activation of macrophages (Yinhe et al., 2024). Research indicates that insufficient dietary fiber intake may lead to the overgrowth of Collinsella, alter the overall fermentation pattern of the gut microbiota, and exert potential adverse effects on the host’s metabolic and inflammatory health (Gomez-Arango et al., 2018). However, other studies have shown that ursodeoxycholic acid produced by Collinsella can inhibit cytokine storm syndrome and prevent COVID-19 infection (Hirayama et al., 2021). It is evident that Collinsella plays different roles in different diseases; it may exert a beneficial effect in SCeD, and further research is needed to confirm this. Studies have reported that Mediterraneibacter is enriched in fecal samples from mice with polycystic ovary syndrome (PCOS), as well as in samples from patients with irritable bowel syndrome (IBS) and colorectal polyps (Huang F. et al., 2024; Intarajak et al., 2024; Jagare et al., 2023). The abundance of Escherichia-Shigella is increased in various diseases, such as chronic pancreatitis, pancreatic ductal adenocarcinoma (PDAC), autism spectrum disorder (ASD), and inflammatory bowel disease (IBD) (Chen et al., 2024; Hong et al., 2024; Valenzuela-Zamora et al., 2022). In conclusion, the development and specificity of SCeD may be the result of interactions among multiple microorganisms. However, the complex and diverse interactions require support from more basic experiments.
Compared with the CDF group, the SCeD group exhibited a significantly lower abundance of Bacteroides, and significantly higher abundances of Bifidobacterium, Faecalibacterium, Blautia, Collinsella, Agathobacter, Dorea, Mediterraneibacter, Gemmiger, and Anaerobutyricum. This corresponds with findings from other studies indicating that Bacteroides is associated with inflammation, while Bifidobacterium and Faecalibacterium possess anti-inflammatory properties (Charlet et al., 2020; Huang Y. et al., 2024; Quévrain et al., 2016). The abundances of Faecalibacterium and Agathobacter were significantly higher in the SCeD group than in the CDF group. Studies have shown that butyrate— a fermentation product of Faecalibacterium prausnitzii, a key member of the Faecalibacterium genus—exerts anti-inflammatory effects via the NOD2-mediated signaling pathway. It promotes the expression of anti-inflammatory cytokines (e.g., IL-10 and IFN-γ), inhibits the expression of pro-inflammatory cytokines (e.g., IL-12), and exerts a protective effect on the intestinal mucosa (Touch et al., 2022). Furthermore, our analysis at the species level revealed that the abundance of Faecalibacterium prausnitzii was significantly higher in the SCeD group than in the CDF group. Therefore, the high abundance of Faecalibacterium prausnitzii may inhibit pro-inflammatory cytokine expression, promote anti-inflammatory cytokine expression, and enhance immune responses—thereby preventing the development of relevant clinical symptoms in SCeD patients. Studies have reported that Agathobacter and its metabolic product butyrate can alleviate neuroinflammation induced by Alzheimer’s disease (AD) by regulating the NF-κB signaling pathway (Lv et al., 2024). Additionally, earlier studies have identified NF-κB as a potential molecular target for regulating inflammatory responses in celiac disease (CeD) (Maiuri et al., 2003). In conclusion, the increased abundances of Faecalibacterium and Agathobacter may be important contributing factors to the absence of clinical symptoms in SCeD patients. The results of this sequencing data will provide a certain theoretical basis for subsequent experiments.
In metabolomic studies, it has been found that changes in metabolites are associated with a variety of diseases (Yuan et al., 2024), such as inflammatory bowel disease (IBD), type 1 diabetes mellitus (T1DM), and systemic lupus erythematosus (SLE) (Huang et al., 2022; Li et al., 2024; Vich Vila et al., 2023; Zeng et al., 2022); however, there are relatively few metabolomic studies on SCeD. In the present study, through LC–MS analysis, we found that the SCeD group exhibits unique metabolic profiles compared with the CDFH group and CeD group. Compared with the CDFH group, 1,897 metabolites were differentially expressed in the SCeD group (p < 0.05, VIP > 1). Through KEGG analysis, these differential metabolites were mainly enriched in pathways such as Steroid hormone biosynthesis, Primary bile acid biosynthesis, and Tryptophan metabolism. Under the conditions of p < 0.05 and VIP > 2, there were 44 differentially expressed metabolites (4 upregulated and 40 downregulated). The four upregulated metabolites—Tetrahydrodeoxycortisol, Hymatoxin D, Imazamethabenz-methyl, and Ile-Asp-may play a role in the development and progression of SCeD.
Compared with the CDF group, a total of 1,835 metabolites were differentially expressed between the SCeD group and the CDF group (p < 0.05, VIP > 1). Through KEGG analysis, these differential metabolites were mainly enriched in pathways such as Tryptophan metabolism, Biosynthesis of plant secondary metabolites, Biosynthesis of alkaloids derived from the shikimate pathway, and Degradation of flavonoids. Existing studies have shown that tryptophan metabolism is altered in CeD patients, and the score of the Gastrointestinal Symptom Rating Scale (GSRS) was also significantly reduced after tryptophan intervention (Asgari et al., 2025). In our study, the abundance of (+/−)-Tryptophan in the SCeD group was higher than that in the CDF group. Additionally, studies have indicated that tryptophan metabolites regulate intestinal barrier function via the aryl hydrocarbon receptor (AhR) (Lamas et al., 2020). Furthermore, research has suggested that tryptophan has the potential to treat CeD by regulating immune responses (Asgari et al., 2025). This also provides certain evidence supporting the role of tryptophan metabolism in the clinical symptoms of CeD. Combined with the microbial findings, flavonoids can be converted into short-chain fatty acids (SCFAs) by a variety of bacteria, and the converted SCFAs improve the intestinal barrier through anti-inflammatory effects (Al-Khayri et al., 2022; Liu et al., 2021). Compared with the CDF group, the abundances of 6-methyl-5-nitroquinoline, Nb-p-Coumaroyltryptamine, 2-oxo-3-phenylpropanoate, and 4-Hydroxy-5-(phenyl)-valeric acid-O-sulfate were higher in the SCeD group.6-methyl-5-nitroquinoline contains a quinoline structure and may be associated with the aryl hydrocarbon receptor (AhR) pathway. AhR is a transcription factor that can be activated by a variety of ligands; activated AhR can promote the differentiation of regulatory T cells (Treg cells), and Treg cells possess immunosuppressive functions that can alleviate inflammatory responses (Zeng et al., 2022). 4-Hydroxy-5-(phenyl)-valeric acid-O-sulfate is a compound related to flavan-3-ol metabolism. Some studies have shown that flavan-3-ols and their metabolites have anti-inflammatory activity (Yang Q. et al., 2022). Multiple studies have demonstrated that changes in microorganisms and metabolites can protect the intestinal barrier by regulating the inflammatory state (Gilsenan et al., 2024; Li S. et al., 2023).
Based on the random forest model, we found that differential microorganisms and differential metabolites not only exhibited excellent diagnostic performance for CeD (the microbial-based model achieved an AUC of 0.84, the metabolite-based model an AUC of 0.96, and the combined model of differential microorganisms and metabolites an AUC of 0.98) but also showed good diagnostic performance for SCeD (the microbial-based model achieved an AUC of 0.97, and the metabolite-based model an AUC ≥ 0.9). However, given the small sample size in our study, their diagnostic efficacy (e.g., sensitivity and specificity) still needs to be validated in larger-scale and more diverse clinical cohorts, and the models are not yet ready for direct application in clinical testing. Nevertheless, this also suggests that microorganisms and metabolites have the potential to serve as diagnostic biomarkers for SCeD. Multiple studies have indicated that changes in fecal metabolites are associated with gut microbiota during disease progression, such as in ulcerative colitis (UC), metabolic-associated fatty liver disease (MAFLD), and primary Sjögren’s syndrome (pSS) (Yang et al., 2022a,b; Yang et al., 2021). In this study, via Spearman correlation analysis, we identified a certain correlation between differential microorganisms and differential metabolites.
This study also has certain limitations. First, the sample size included in the study is small, with only 14 cases in the SCeD group, which is insufficient to fully reflect the changes in gut microbiota and metabolites in SCeD patients. Future studies should expand the sample size of SCeD patients to explain the unique gut microbiota and metabolic characteristics of these patients.
Second, CeD is a heterogeneous disease, encompassing classic CeD, atypical CeD, and SCeD. In this study, we only compared the differences in microbiota and metabolites between the CDF group and the SCeD group, while the gut microbiota and metabolomic characteristics of other CeD subtypes were not reflected. Additionally, gut microbiota and metabolomic results are influenced by factors such as environment, diet, and geography. All patients included in this study were from Xinjiang, China, and Xinjiang has its unique geographical and dietary environments—this may result in the lack of generalizability of the study’s findings. In the future, larger-sample longitudinal studies can be conducted, with the incorporation of dietary data, to validate the current research results and control for confounding variables.
6 Conclusion
We detected the microbiota and metabolites in fecal samples from SCeD patients using 16S rDNA sequencing and liquid chromatography-mass spectrometry (LC–MS). The results showed that there were differences in microbiota and metabolites between the CeD group (including SCeD and CDF) and the CDFH group, between the SCeD group and the CDFH group, and between the SCeD group and the CDF group. In addition, correlation analysis revealed a correlation between changes in differential microorganisms and differential metabolites across different groups. In this study, we found that both the composition and abundance of gut microbiota and metabolites in CeD patients had changed. Patients with different CeD subtypes (SCeD and CDF) exhibited unique fecal microbiota and metabolite characteristics. Therefore, changes in microorganisms and metabolites not only participate in the development of CeD but also are associated with different subtypes of CeD. In conclusion, the pathogenesis of different CeD subtypes may involve a “host-microbe-metabolite” trinity interaction network. Based on machine learning, a random forest model can be established using differential microorganisms and metabolites between the SCeD group and the CDFH group, serving as a diagnostic tool for SCeD. Additionally, modulating the differential microorganisms and metabolites across groups can act as a new entry point for studying the mechanism of CeD and an adjunctive approach for its treatment.
Data availability statement
The data presented in the study are deposited in the NCBI repository (https://www.ncbi.nlm.nih.gov/), The accession number for the typical celiac disease group and healthy control group is PRJNA890948, and the accession number for asymptomatic celiac disease is PRJNA1354235.
Ethics statement
The studies involving humans were approved by Ethics Committee of Xinjiang Uygur Autonomous Region People’s Hospital (ethical approval number KY202203110 67). The studies were conducted in accordance with the local legislation and institutional requirements. The participants provided their written informed consent to participate in this study.
Author contributions
SY: Conceptualization, Writing – original draft. SX: Data curation, Writing – review & editing. NL: Writing – review & editing, Data curation. TS: Writing – review & editing, Methodology. YF: Methodology, Writing – review & editing. MM: Formal analysis, Writing – review & editing. AM: Writing – review & editing, Formal analysis. HH: Writing – review & editing, Formal analysis. FG: Writing – review & editing, Conceptualization, Supervision.
Funding
The author(s) declare that financial support was received for the research and/or publication of this article. This work was supported by the National Natural Science Foundation of China (82260116), Xinjiang Uygur Autonomous Region Natural Science Foundation (2022D01C831).
Acknowledgments
We thank all medical staff and technicians who agreed to participate in this study.
Conflict of interest
The authors declare that the research was conducted in the absence of any commercial or financial relationships that could be construed as a potential conflict of interest.
Generative AI statement
The authors declare that no Gen AI was used in the creation of this manuscript.
Any alternative text (alt text) provided alongside figures in this article has been generated by Frontiers with the support of artificial intelligence and reasonable efforts have been made to ensure accuracy, including review by the authors wherever possible. If you identify any issues, please contact us.
Publisher’s note
All claims expressed in this article are solely those of the authors and do not necessarily represent those of their affiliated organizations, or those of the publisher, the editors and the reviewers. Any product that may be evaluated in this article, or claim that may be made by its manufacturer, is not guaranteed or endorsed by the publisher.
Supplementary material
The Supplementary material for this article can be found online at: https://www.frontiersin.org/articles/10.3389/fmicb.2025.1636007/full#supplementary-material
Footnotes
References
Acharya, B., Tofthagen, M., Maciej-Hulme, M. L., Suissa, M. R., and Karlsson, N. G. (2024). Limited support for a direct connection between prebiotics and intestinal permeability - a systematic review. Glycoconj. J. 41, 323–342. doi: 10.1007/s10719-024-10165-8
Aguayo-Patrón, S. V., Trujillo-Rivera, O. A., Cornejo-Granados, F., Ochoa-Leyva, A., and Calderón de la Barca, A. M. (2023). HLA-haplotypes influence microbiota structure in northwestern Mexican schoolchildren predisposed for celiac disease or type 1 diabetes. Microorganisms 11:1412. doi: 10.3390/microorganisms11061412
Aljada, B., Zohni, A., and El-Matary, W. (2021). The gluten-free diet for celiac disease and beyond. Nutrients 13:3993. doi: 10.3390/nu13113993
Al-Khayri, J. M., Sahana, G. R., Nagella, P., Joseph, B. V., Alessa, F. M., and Al-Mssallem, M. Q. (2022). Flavonoids as potential anti-inflammatory molecules: a review. Molecules 27:2901. doi: 10.3390/molecules27092901
Al-Sadi, R., Dharmaprakash, V., Nighot, P., Guo, S., Nighot, M., Do, T., et al. (2021). Bifidobacterium bifidum enhances the intestinal epithelial tight junction barrier and protects against intestinal inflammation by targeting the toll-like Receptor-2 pathway in an NF-κB-independent manner. Int. J. Mol. Sci. 22:8070. doi: 10.3390/ijms22158070
Asgari, F., Nikzamir, A., Baghaei, K., Masotti, A., and Rostami-Nejad, M. (2025). Investigating the therapeutic potential of tryptophan and vitamin a in modulating immune responses in celiac disease: an experimental study. Naunyn Schmiedeberg's Arch. Pharmacol. 398, 12585–12598. doi: 10.1007/s00210-025-04089-9
Bai, J. C., and Ciacci, C. (2017). World gastroenterology organisation global guidelines: celiac disease february 2017. J. Clin. Gastroenterol. 51, 755–768. doi: 10.1097/mcg.0000000000000919
Barberán, A., Bates, S. T., Casamayor, E. O., and Fierer, N. (2012). Using network analysis to explore co-occurrence patterns in soil microbial communities. ISME J. 6, 343–351. doi: 10.1038/ismej.2011.119
Bascuñán, K. A., Araya, M., Rodríguez, J. M., Roncoroni, L., Elli, L., Alvarez, J., et al. (2025). Interplay of n-3 polyunsaturated fatty acids, intestinal inflammation, and gut microbiota in celiac disease pathogenesis. Nutrients 17:621. doi: 10.3390/nu17040621
Belei, O., Jugănaru, I., Basaca, D. G., Munteanu, A. I., and Mărginean, O. (2023). The role of intestinal microbiota in celiac disease and further therapeutic perspectives. Life (Basel) 13:2039. doi: 10.3390/life13102039
Brown, E. M., Ke, X., Hitchcock, D., Jeanfavre, S., Avila-Pacheco, J., Nakata, T., et al. (2019). Bacteroides-derived sphingolipids are critical for maintaining intestinal homeostasis and symbiosis. Cell Host Microbe 25, 668–680.e667. doi: 10.1016/j.chom.2019.04.002
Catassi, G., Lener, E., Grattagliano, M. M., Motuz, S., Zavarella, M. A., Bibbò, S., et al. (2024). The role of microbiome in the development of gluten-related disorders. Best Pract. Res. Clin. Gastroenterol. 72:101951. doi: 10.1016/j.bpg.2024.101951
Catassi, C., Verdu, E. F., Bai, J. C., and Lionetti, E. (2022). Coeliac disease. Lancet 399, 2413–2426. doi: 10.1016/s0140-6736(22)00794-2
Chandrasekaran, P., Weiskirchen, S., and Weiskirchen, R. (2024). Effects of probiotics on gut microbiota: An overview. Int. J. Mol. Sci. 25:6022. doi: 10.3390/ijms25116022
Charlet, R., Bortolus, C., Sendid, B., and Jawhara, S. (2020). Bacteroides thetaiotaomicron and Lactobacillus johnsonii modulate intestinal inflammation and eliminate fungi via enzymatic hydrolysis of the fungal cell wall. Sci. Rep. 10:11510. doi: 10.1038/s41598-020-68214-9
Chen, W., Wang, D., Deng, X., Zhang, H., Dong, D., Su, T., et al. (2024). Bile acid profiling as an effective biomarker for staging in pediatric inflammatory bowel disease. Gut Microbes 16:2323231. doi: 10.1080/19490976.2024.2323231
Chen, S., Zhou, Y., Chen, Y., and Gu, J. (2018). fastp: an ultra-fast all-in-one FASTQ preprocessor. Bioinformatics 34, i884–i890. doi: 10.1093/bioinformatics/bty560
Constante, M., Libertucci, J., Galipeau, H. J., Szamosi, J. C., Rueda, G., Miranda, P. M., et al. (2022). Biogeographic variation and functional pathways of the gut microbiota in celiac disease. Gastroenterology 163, 1351–1363.e15. doi: 10.1053/j.gastro.2022.06.088
Di Biase, A. R., Marasco, G., Ravaioli, F., Dajti, E., Colecchia, L., Righi, B., et al. (2021). Gut microbiota signatures and clinical manifestations in celiac disease children at onset: a pilot study. J. Gastroenterol. Hepatol. 36, 446–454. doi: 10.1111/jgh.15183
Dorobisz, K., Dorobisz, T., and Pazdro-Zastawny, K. (2024). Assessment of prognostic factors, clinical features including the microbiome, and treatment outcomes in patients with Cancer of unknown primary site. Cancers (Basel) 16:3416. doi: 10.3390/cancers16193416
Douglas, G. M., Maffei, V. J., Zaneveld, J. R., Yurgel, S. N., Brown, J. R., Taylor, C. M., et al. (2020). PICRUSt2 for prediction of metagenome functions. Nat. Biotechnol. 38, 685–688. doi: 10.1038/s41587-020-0548-6
Edgar, R. C. (2013). UPARSE: highly accurate OTU sequences from microbial amplicon reads. Nat. Methods 10, 996–998. doi: 10.1038/nmeth.2604
Fan, Y., Xu, C., Xie, L., Wang, Y., Zhu, S., An, J., et al. (2022). Abnormal bile acid metabolism is an important feature of gut microbiota and fecal metabolites in patients with slow transit constipation. Front. Cell. Infect. Microbiol. 12:956528. doi: 10.3389/fcimb.2022.956528
Fryk, E., Wilsson, Å., Tompa, A., Jansson, P. A., and Faresjö, M. (2024). Galectin-1 correlates with inflammatory markers and T regulatory cells in children with type 1 diabetes and/or celiac disease. Clin. Exp. Immunol. 215, 240–250. doi: 10.1093/cei/uxad131
Gajdács, M., and Urbán, E. (2020). The pathogenic role of Actinomyces spp. and related organisms in genitourinary infections: discoveries in the new, modern diagnostic era. Antibiotics 9:524. doi: 10.3390/antibiotics9080524
Gilsenan, S., Leong, D., Cotter, P. D., Brennan, L., and Nilaweera, K. N. (2024). Digging deep for nutrients and metabolites derived from high dietary protein intake and their potential functions in metabolic health. Nutr. Res. Rev. 1-13, 1–13. doi: 10.1017/s0954422424000374
Girdhar, K., Dogru, Y. D., Huang, Q., Yang, Y., Tolstikov, V., Raisingani, A., et al. (2023). Dynamics of the gut microbiome, IgA response, and plasma metabolome in the development of pediatric celiac disease. Microbiome 11:9. doi: 10.1186/s40168-022-01429-2
Gomez-Arango, L. F., Barrett, H. L., Wilkinson, S. A., Callaway, L. K., McIntyre, H. D., Morrison, M., et al. (2018). Low dietary fiber intake increases Collinsella abundance in the gut microbiota of overweight and obese pregnant women. Gut Microbes 9, 189–201. doi: 10.1080/19490976.2017.1406584
Gu, X., Fan, M., Zhou, Y., Zhang, Y., Wang, L., Gao, W., et al. (2024). Intestinal endogenous metabolites affect neuroinflammation in 5×FAD mice by mediating "gut-brain" axis and the intervention with Chinese medicine. Alzheimer's Res Ther 16:222. doi: 10.1186/s13195-024-01587-5
Gupta, Y., Ernst, A. L., Vorobyev, A., Beltsiou, F., Zillikens, D., Bieber, K., et al. (2023). Impact of diet and host genetics on the murine intestinal mycobiome. Nat. Commun. 14:834. doi: 10.1038/s41467-023-36479-z
Han, E. J., Ahn, J. S., Choi, Y. J., Kim, D. H., and Chung, H. J. (2025). Changes in gut microbiota according to disease severity in a lupus mouse model. Int. J. Mol. Sci. 26:1006. doi: 10.3390/ijms26031006
Hirayama, M., Nishiwaki, H., Hamaguchi, T., Ito, M., Ueyama, J., Maeda, T., et al. (2021). Intestinal Collinsella may mitigate infection and exacerbation of COVID-19 by producing ursodeoxycholate. PLoS One 16:e0260451. doi: 10.1371/journal.pone.0260451
Hong, J., Fu, Y., Chen, X., Zhang, Y., Li, X., Li, T., et al. (2024). Gut microbiome changes associated with chronic pancreatitis and pancreatic cancer: a systematic review and meta-analysis. Int. J. Surg. 110, 5781–5794. doi: 10.1097/js9.0000000000001724
Huang, F., Deng, Y., Zhou, M., Tang, R., Zhang, P., and Chen, R. (2024). Fecal microbiota transplantation from patients with polycystic ovary syndrome induces metabolic disorders and ovarian dysfunction in germ-free mice. BMC Microbiol. 24:364. doi: 10.1186/s12866-024-03513-z
Huang, Y., Lu, Z., Liu, F., Lane, J. A., Chen, J., Huang, Q., et al. (2024). Osteopontin associated Bifidobacterium bifidum microencapsulation modulates infant fecal fermentation and gut microbiota development. Food Res. Int. 197:115211. doi: 10.1016/j.foodres.2024.115211
Huang, C., Yi, P., Zhu, M., Zhou, W., Zhang, B., Yi, X., et al. (2022). Safety and efficacy of fecal microbiota transplantation for treatment of systemic lupus erythematosus: An EXPLORER trial. J. Autoimmun. 130:102844. doi: 10.1016/j.jaut.2022.102844
Intarajak, T., Udomchaiprasertkul, W., Khoiri, A. N., Sutheeworapong, S., Kusonmano, K., Kittichotirat, W., et al. (2024). Distinct gut microbiomes in Thai patients with colorectal polyps. World J. Gastroenterol. 30, 3336–3355. doi: 10.3748/wjg.v30.i27.3336
Jagare, L., Rozenberga, M., Silamikelis, I., Ansone, L., Elbere, I., Briviba, M., et al. (2023). Metatranscriptome analysis of blood in healthy individuals and irritable bowel syndrome patients. J. Med. Microbiol. 72:001719. doi: 10.1099/jmm.0.001719
Jing, Y., Yang, D., Bai, F., Wang, Q., Zhang, C., Yan, Y., et al. (2023). Spinal cord injury-induced gut dysbiosis influences neurological recovery partly through short-chain fatty acids. NPJ Biofilms Microbiomes 9:99. doi: 10.1038/s41522-023-00466-5
Kelley, K., Dogru, D., Huang, Q., Yang, Y., Palm, N. W., Altindis, E., et al. (2025). Children who develop celiac disease are predicted to exhibit distinct metabolic pathways among their gut microbiota years before diagnosis. Microbiol. Spectr. 13:e0146824. doi: 10.1128/spectrum.01468-24
Koh, A., and Bäckhed, F. (2020). From association to causality: the role of the gut microbiota and its functional products on host metabolism. Mol. Cell 78, 584–596. doi: 10.1016/j.molcel.2020.03.005
Könönen, E., and Wade, W. G. (2015). Actinomyces and related organisms in human infections. Clin. Microbiol. Rev. 28, 419–442. doi: 10.1128/cmr.00100-14
Korzeniowska, A., Daca, A., Szarecka, M., Bykowska, M., Witkowski, J., and Bryl, E. (2024). Differences in salivary cytokinome and pathogen load between rheumatoid arthritis and other rheumatic disease patients. Int. J. Mol. Sci. 26:197. doi: 10.3390/ijms26010197
Lamas, B., Hernandez-Galan, L., Galipeau, H. J., Constante, M., Clarizio, A., Jury, J., et al. (2020). Aryl hydrocarbon receptor ligand production by the gut microbiota is decreased in celiac disease leading to intestinal inflammation. Sci. Transl. Med. 12:eaba0624. doi: 10.1126/scitranslmed.aba0624
Laurikka, P., Kivelä, L., Kurppa, K., and Kaukinen, K. (2022). Review article: systemic consequences of coeliac disease. Aliment. Pharmacol. Ther. 56, S64–s72. doi: 10.1111/apt.16912
Lebwohl, B., and Rubio-Tapia, A. (2021). Epidemiology, presentation, and diagnosis of celiac disease. Gastroenterology 160, 63–75. doi: 10.1053/j.gastro.2020.06.098
Li, H., Liu, S., Chen, H., Zhou, L., Chen, B., Wang, M., et al. (2024). Gut dysbiosis contributes to SCFAs reduction-associated adipose tissue macrophage polarization in gestational diabetes mellitus. Life Sci. 350:122744. doi: 10.1016/j.lfs.2024.122744
Li, H., Liu, C., Huang, S., Wang, X., Cao, M., Gu, T., et al. (2023). Multi-omics analyses demonstrate the modulating role of gut microbiota on the associations of unbalanced dietary intake with gastrointestinal symptoms in children with autism spectrum disorder. Gut Microbes 15:2281350. doi: 10.1080/19490976.2023.2281350
Li, S., Wen, X., Yang, X., Wang, L., Gao, K., Liang, X., et al. (2023). Glutamine protects intestinal immunity through microbial metabolites rather than microbiota. Int. Immunopharmacol. 124:110832. doi: 10.1016/j.intimp.2023.110832
Liu, P., Wang, Y., Yang, G., Zhang, Q., Meng, L., Xin, Y., et al. (2021). The role of short-chain fatty acids in intestinal barrier function, inflammation, oxidative stress, and colonic carcinogenesis. Pharmacol. Res. 165:105420. doi: 10.1016/j.phrs.2021.105420
Lupu, V. V., Trandafir, L. M., Raileanu, A. A., Mihai, C. M., Morariu, I. D., Starcea, I. M., et al. (2023). Advances in understanding the human gut microbiota and its implication in pediatric celiac disease-a narrative review. Nutrients 15:2499. doi: 10.3390/nu15112499
Lv, X., Zhan, L., Ye, T., Xie, H., Chen, Z., Lin, Y., et al. (2024). Gut commensal Agathobacter rectalis alleviates microglia-mediated neuroinflammation against pathogenesis of Alzheimer disease. iScience 27:111116. doi: 10.1016/j.isci.2024.111116
Magoč, T., and Salzberg, S. L. (2011). FLASH: fast length adjustment of short reads to improve genome assemblies. Bioinformatics 27, 2957–2963. doi: 10.1093/bioinformatics/btr507
Maiuri, M. C., De Stefano, D., Mele, G., Fecarotta, S., Greco, L., Troncone, R., et al. (2003). Nuclear factor kappa B is activated in small intestinal mucosa of celiac patients. J. Mol. Med. (Berl) 81, 373–379. doi: 10.1007/s00109-003-0440-0
Makharia, G. K., Singh, P., Catassi, C., Sanders, D. S., Leffler, D., Ali, R. A. R., et al. (2022). The global burden of coeliac disease: opportunities and challenges. Nat. Rev. Gastroenterol. Hepatol. 19, 313–327. doi: 10.1038/s41575-021-00552-z
Marascio, N., Scarlata, G. G. M., Romeo, F., Cicino, C., Trecarichi, E. M., Quirino, A., et al. (2023). The role of gut microbiota in the clinical outcome of septic patients: state of the art and future perspectives. Int. J. Mol. Sci. 24:9307. doi: 10.3390/ijms24119307
Peng, X., Ed-Dra, A., Song, Y., Elbediwi, M., Nambiar, R. B., Zhou, X., et al. (2022). Lacticaseibacillus rhamnosus alleviates intestinal inflammation and promotes microbiota-mediated protection against Salmonella fatal infections. Front. Immunol. 13:973224. doi: 10.3389/fimmu.2022.973224
Quévrain, E., Maubert, M. A., Michon, C., Chain, F., Marquant, R., Tailhades, J., et al. (2016). Identification of an anti-inflammatory protein from Faecalibacterium prausnitzii, a commensal bacterium deficient in Crohn's disease. Gut 65, 415–425. doi: 10.1136/gutjnl-2014-307649
Rostami-Nejad, M., Asri, N., Bakhtiari, S., Khalkhal, E., Maleki, S., Rezaei-Tavirani, M., et al. (2024). Metabolomics and lipidomics signature in celiac disease: a narrative review. Clin. Exp. Med. 24:34. doi: 10.1007/s10238-024-01295-2
Rubio-Tapia, A., Hill, I. D., Semrad, C., Kelly, C. P., Greer, K. B., Limketkai, B. N., et al. (2023). American College of Gastroenterology guidelines update: diagnosis and management of celiac disease. Am. J. Gastroenterol. 118, 59–76. doi: 10.14309/ajg.0000000000002075
Schloss, P. D., Westcott, S. L., Ryabin, T., Hall, J. R., Hartmann, M., Hollister, E. B., et al. (2009). Introducing mothur: open-source, platform-independent, community-supported software for describing and comparing microbial communities. Appl. Environ. Microbiol. 75, 7537–7541. doi: 10.1128/aem.01541-09
Shi, T., Feng, Y., Liu, W., Liu, H., Li, T., Wang, M., et al. (2022). Characteristics of gut microbiota and fecal metabolomes in patients with celiac disease in Northwest China. Front. Microbiol. 13:1020977. doi: 10.3389/fmicb.2022.1020977
Touch, S., Godefroy, E., Rolhion, N., Danne, C., Oeuvray, C., Straube, M., et al. (2022). Human CD4+CD8α+ Tregs induced by Faecalibacterium prausnitzii protect against intestinal inflammation. JCI Insight 7:e154722. doi: 10.1172/jci.insight.154722
Vacca, M., Porrelli, A., Calabrese, F. M., Lippolis, T., Iacobellis, I., Celano, G., et al. (2022). How metabolomics provides novel insights on celiac disease and gluten-free diet: a narrative review. Front. Microbiol. 13:859467. doi: 10.3389/fmicb.2022.859467
Valenzuela-Zamora, A. F., Ramírez-Valenzuela, D. G., and Ramos-Jiménez, A. (2022). Food selectivity and its implications associated with gastrointestinal disorders in children with autism Spectrum disorders. Nutrients 14:2660. doi: 10.3390/nu14132660
Vich Vila, A., Hu, S., Andreu-Sánchez, S., Collij, V., Jansen, B. H., Augustijn, H. E., et al. (2023). Faecal metabolome and its determinants in inflammatory bowel disease. Gut 72, 1472–1485. doi: 10.1136/gutjnl-2022-328048
Yang, L., Dai, Y., He, H., Liu, Z., Liao, S., Zhang, Y., et al. (2022a). Integrative analysis of gut microbiota and fecal metabolites in metabolic associated fatty liver disease patients. Front. Microbiol. 13:969757. doi: 10.3389/fmicb.2022.969757
Yang, Z. H., Liu, F., Zhu, X. R., Suo, F. Y., Jia, Z. J., and Yao, S. K. (2021). Altered profiles of fecal bile acids correlate with gut microbiota and inflammatory responses in patients with ulcerative colitis. World J. Gastroenterol. 27, 3609–3629. doi: 10.3748/wjg.v27.i24.3609
Yang, Q., Wang, Z., Hor, C. H. H., Xiao, H., Bian, Z., and Wang, J. J. (2022). Asymmetric synthesis of flavanols via cu-catalyzed kinetic resolution of chromenes and their anti-inflammatory activity. Sci. Adv. 8:eabm9603. doi: 10.1126/sciadv.abm9603
Yang, L., Xiang, Z., Zou, J., Zhang, Y., Ni, Y., and Yang, J. (2022b). Comprehensive analysis of the relationships between the gut microbiota and fecal metabolome in individuals with primary Sjogren's syndrome by 16S rRNA sequencing and LC-MS-based metabolomics. Front. Immunol. 13:874021. doi: 10.3389/fimmu.2022.874021
Yinhe, S., Lixiang, L., Yan, L., Xiang, G., Yanqing, L., and Xiuli, Z. (2024). Bacteroides thetaiotaomicron and its inactivated bacteria ameliorate colitis by inhibiting macrophage activation. Clin. Res. Hepatol. Gastroenterol. 48:102276. doi: 10.1016/j.clinre.2023.102276
Yuan, X., Yang, P., Hu, J., Cai, D., Hu, B., Rui, G., et al. (2024). Causal association between plasma metabolites and diverse autoimmune diseases: a two-sample bidirectional mendelian randomization study. Front. Immunol. 15:1437688. doi: 10.3389/fimmu.2024.1437688
Zeng, L., Deng, Y., Yang, K., Chen, J., He, Q., and Chen, H. (2022). Safety and efficacy of fecal microbiota transplantation for autoimmune diseases and autoinflammatory diseases: a systematic review and meta-analysis. Front. Immunol. 13:944387. doi: 10.3389/fimmu.2022.944387
Zhao, X., Hu, X., Han, J., Yin, R., Zhang, S., and Liu, H. (2023). Gut mycobiome: a "black box" of gut microbiome-host interactions. WIREs Mech. Dis. 15:e1611. doi: 10.1002/wsbm.1611
Zhao, H., Zhou, X., Song, Y., Zhao, W., Sun, Z., Zhu, J., et al. (2025). Multi-omics analyses identify gut microbiota-fecal metabolites-brain-cognition pathways in the Alzheimer's disease continuum. Alzheimer's Res Ther 17:36. doi: 10.1186/s13195-025-01683-0
Zhou, P., Chen, C., Patil, S., and Dong, S. (2024). Unveiling the therapeutic symphony of probiotics, prebiotics, and postbiotics in gut-immune harmony. Front. Nutr. 11:1355542. doi: 10.3389/fnut.2024.1355542
Keywords: asymptomatic celiac disease, classic celiac disease, microbiota, metabolites, diagnostic markers
Citation: Yao S, Xue S, Li N, Shi T, Feng Y, Maimaiti M, Maimaitireyimu A, Halike H and Gao F (2025) Integrated analysis of fecal microbiota and metabolomics reveals unique characteristics of asymptomatic and classic celiac disease. Front. Microbiol. 16:1636007. doi: 10.3389/fmicb.2025.1636007
Edited by:
Xiaolun Sun, University of Arkansas, United StatesReviewed by:
Saeed Mohammadi, University of Nizwa, OmanGiuseppe Guido Maria Scarlata, University Magna Graecia of Catanzaro, Italy
Copyright © 2025 Yao, Xue, Li, Shi, Feng, Maimaiti, Maimaitireyimu, Halike and Gao. This is an open-access article distributed under the terms of the Creative Commons Attribution License (CC BY). The use, distribution or reproduction in other forums is permitted, provided the original author(s) and the copyright owner(s) are credited and that the original publication in this journal is cited, in accordance with accepted academic practice. No use, distribution or reproduction is permitted which does not comply with these terms.
*Correspondence: Feng Gao, eGpnZkBzaW5hLmNvbQ==