 Eva Hejduková
 Ekaterina Pushkareva
 Jana Kvíderová
 Burkhard Becker
 Josef Elster
- 1Department of Ecology, Faculty of Science, Charles University, Prague, Czechia
- 2Department of Phycology, Institute of Botany, Czech Academy of Sciences, Trebon, Czechia
- 3Institute for Plant Sciences, Faculty of Mathematics and Natural Sciences, University of Cologne, Cologne, Germany
- 4Centre for Polar Ecology, Faculty of Science, University of South Bohemia, České Budějovice, Czechia
- 5Centre for Biology, Geosciences and the Environment, Faculty of Education, University of West Bohemia, Pilsen, Czechia
Introduction: Biological soil crusts, found in arid and semi-arid areas worldwide, play a crucial role in the carbon cycle. This study analyzed biocrusts from three different altitudes in Svalbard (High Arctic) in 2022–2024.
Methods and results: Monitoring of microclimatic parameters, including irradiance, humidity, air, and soil temperature, revealed unexpected extremes at the lowest elevation site. Molecular methods were used to determine the diversity of microalgae, revealing the presence of Trebouxiophyceae and Chlorophyceae as the dominant eukaryotic algal groups. Among the cyanobacteria, the dominant taxonomical groups were Nostocales, Pseudanabaenales, and Oscillatoriales. Measured photosynthetic activity was largely driven by irradiance across the different seasons and locations. Higher maximum quantum yield (FV/FM) values (approximately 0.6) were measured at lower irradiance levels (< 100 μmol m−2 s−1). Photosynthetic activity was observed in early October 2022, and diurnal changes were even noticeable at subzero temperatures in late October 2023, with the low irradiance curve being mirrored by the development of FV/FM. Furthermore, thawed biocrusts in winter exhibited the ability to rapidly restore photosynthetic activity, which was also supported by the expression of photosynthesis-related genes. Metatranscriptomic analysis revealed that the differential gene expression observed for the D1, RbcS, Ohp1, and ELIP proteins suggests that light stress-induced photoinhibition plays a major role in biocrusts, particularly in winter.
Conclusion: The biocrusts can remain active for extended periods and provide carbon fixation during times when tundra plants primarily engage in respiration, making them very important for the polar environment.
1 Introduction
Biological soil crusts (biocrusts) are communities of microscopic (cyanobacteria, algae, fungi, bacteria) and macroscopic (lichens, mosses, liverworts) organisms living on or within the uppermost millimeters of the soil surface, forming a compact layer. Biocrusts are important for maintaining the health and resilience of terrestrial ecosystems, as they stabilize soil, enhance soil fertility, and influence local hydrological cycles (Evans and Johansen, 1999; Bowker et al., 2008; Lichner et al., 2013; Bu et al., 2014; Williams et al., 2017; Gharemahmudli et al., 2024). Despite the importance of biocrusts and soil microalgae, their field of study is relatively recent and is currently experiencing a surge in interest (Joseph and Ray, 2024). However, studies in the polar regions remain limited, and our understanding of the seasonal and diurnal photosynthetic activity of biocrusts is incomplete.
In the polar regions, including both the Arctic and Antarctic, biocrusts create patchy or continuous cover that is dominated by bryophytes, lichens, eukaryotic algae, and prokaryotic cyanobacteria (Pushkareva et al., 2015; Williams et al., 2017; Weber et al., 2022), and a large number of species have been identified using molecular techniques such as metabarcoding and metagenomics (Rippin et al., 2018a; Pushkareva et al., 2022, 2023). Specifically, High Arctic polar desert crusts are often dominated by eukaryotic algae and cyanobacteria (Belnap and Lange, 2003; Pushkareva et al., 2015, 2017, 2023). Naturally, the species composition of biocrusts in polar environments changes during different succession stages of soil development and/or due to the type and chemical composition of the substrate (Pushkareva et al., 2015, 2022, 2023; Pessi et al., 2019). In the context of global warming and climate change, it is likely that temperatures will increase significantly (Huntington et al., 2005; Meredith et al., 2019), which may boost microbial activity and diversity. However, extreme conditions such as heatwaves, rain-on-snow events, drought, or flooding can disrupt these communities (Aransiola et al., 2024; Bååth and Kritzberg, 2024). This could potentially alter the composition of biocrusts, as a previous study of a warm desert suggested, which led to a decrease in the abundance of cyanobacteria (Steven et al., 2015).
In polar ecosystems, microbial communities face numerous challenges, including limitations in their capacity for photosynthesis, growth, and reproduction. These challenges involve intense solar radiation during summer (including damaging UV radiation), extended periods of prolonged darkness in winter, low nutrient supply, periods of desiccation, and freezing temperatures (Thomas et al., 2008; Pichrtová et al., 2020). Therefore, microorganisms have developed physiological and molecular adaptations to survive and thrive in such harsh environments (Morgan-Kiss et al., 2006; De Maayer et al., 2014; Pichrtová et al., 2020). For example, polar algae and cyanobacteria are resistant to abiotic stresses such as freezing, desiccation, UV light, and nitrogen starvation (Davey, 1989; Hawes, 1992; Šabacká and Elster, 2006; Elster et al., 2008; Tashyreva and Elster, 2015; Holzinger et al., 2018; Hejduková and Nedbalová, 2021; Hejduková et al., 2024). Remarkably, some of them tolerate extremely low temperatures (−40 °C and lower) or even −196 °C, the temperature of liquid nitrogen (Šabacká and Elster, 2006; Elster et al., 2008; Hejduková et al., 2019, 2024).
Ecological studies of polar algae and cyanobacteria mainly focus on their annual development, morphology, and/or survival mechanisms (Pichrtová et al., 2016; Tashyreva and Elster, 2016; Hejduková et al., 2020) but have not investigated photosynthetic performance in detail. The photosynthetic activity of algae and cyanobacteria from polar and alpine biocrusts has been rarely studied, and mostly under laboratory conditions (Karsten et al., 2010; Karsten and Holzinger, 2012). As a result, understanding of in situ photosynthetic processes in the polar regions is limited to two biocrust studies focusing on the summer growing season in Svalbard (Sehnal et al., 2014; Pushkareva et al., 2017). In these studies, irradiance appeared to be the main controlling factor of photosynthetic activity, making changes in seasonal and diel dynamics a major environmental parameter. A thorough investigation is necessary to understand the seasonal and diurnal dynamics that have yet to be explored.
This study compares in situ diurnal changes in photosynthetic activity of biological soil crusts during summer and autumn 2022–2023 at three localities at different altitudes in Svalbard (High Arctic). Additionally, winter-frozen samples collected in March 2023 and 2024 were thawed “ex situ” and photosynthetic activity was monitored to explore the recovery from the dormant winter state. We hypothesized that photosynthetic activity reflects the influence of diurnal and seasonal changes in environmental factors such as light availability and temperature. The abundance and diversity of microbial phototrophs, including microalgae (the term microalgae in the text refers to eukaryotic algae and prokaryotic cyanobacteria unless further specified), lichenized microalgae, and moss development stages and their photosynthesis-related gene transcripts were also evaluated in relation to environmental factors.
2 Material and methods
2.1 Study sites description
For this study, three experimental sites were established in the vicinity of Longyearbyen, West Spitsbergen (Svalbard archipelago, High Arctic), in August 2022 (Figures 1, 2). A description of the studied sites and their microbial community composition is present in Pushkareva et al. (2024b). In summary, Site 1 was located in the Bjørndalen valley, and two other sites were on the slopes of the Breinosa Mountain in the vicinity of Mine 7 (Site 2) and the Kjell Henriksen Observatory (Site 3; Figure 1, Supplementary material S1). Areas with a minimum of 80% cover of biological soil crust were chosen for the sampling; however, sparse vegetation was also present (Supplementary material S2). The biocrusts differed macroscopically between the sites (Figure 2). The biocrusts of the lowest elevated Site 1 were better developed compared to the others, with a relatively high diversity of mosses present. It was surrounded by tundra vegetation and the presence of a long-lasting snow cover (snow bed), restricting the growth and distribution of vascular plants. The characteristics of the higher elevated biocrusts at Sites 2 and 3 were different. In the close surroundings, there was only very poor tundra with low cover of vascular plants. Site 2 was represented by a dark, highly compact, and homogeneous crust cover. The biocrust at Site 3 differed from Site 2 by the greater occurrence of lichens. An overview of additional geographic, vegetation, and geological characteristics (Major and Nagy, 1972; Dallmann et al., 2001; Piepjohn et al., 2012) is presented in Supplementary material S1.
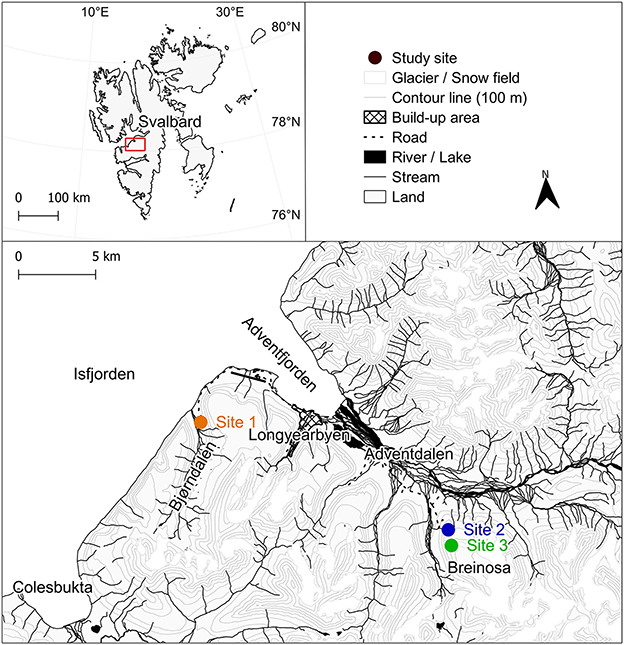
Figure 1. The Svalbard region, with the area of West Spitsbergen (Svalbard archipelago) highlighted. A detailed map illustrating the study sites located near Longyearbyen. Map source: Kartdata Svalbard (Norwegian Polar Institute, 2014).
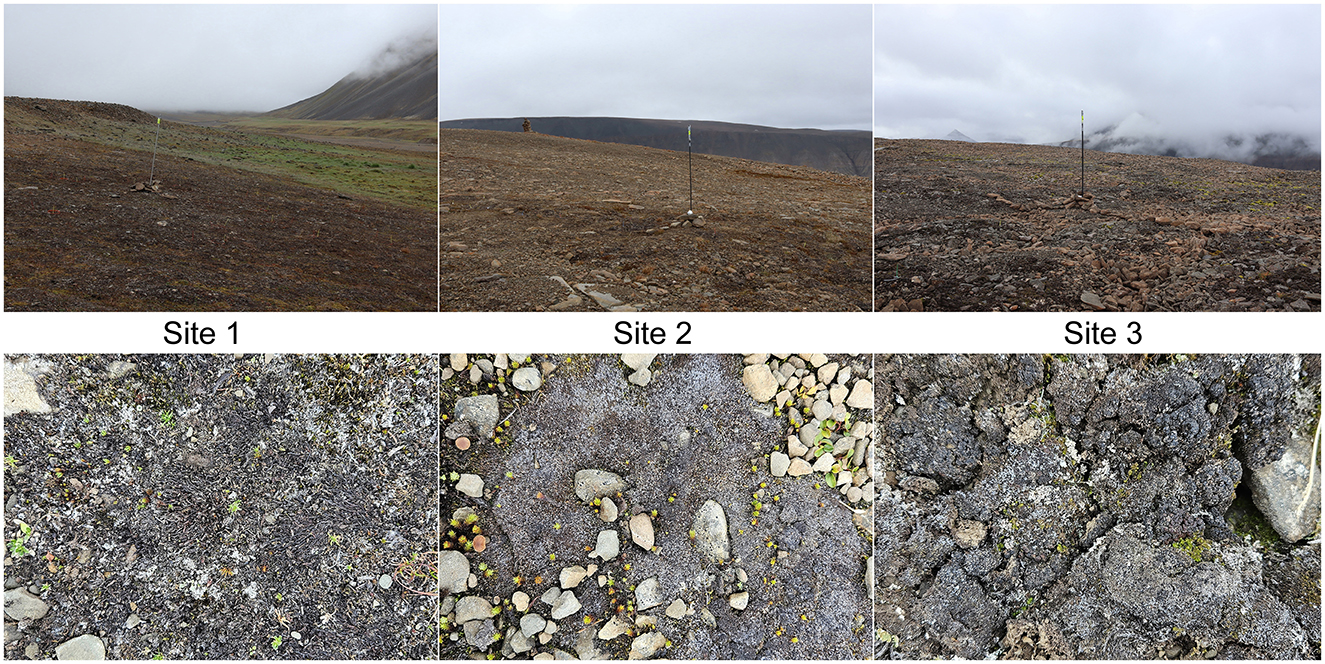
Figure 2. Photographs of the studied sites with detailed images of the biological soil crusts.
2.2 Microclimate data collection
The climate of West Spitsbergen is classified according to the Köppen–Geiger climate system as semi-arid polar tundra (Førland et al., 1997; Peel et al., 2007). Norwegian Meteorological Institute (2023) reported that in the period 2010–2020, the average annual precipitation (at the Svalbard Airport meteorological station) was 221 mm, with maxima in August and minima in May. According to the temperatures measured from 2017 to 2022 at Svalbard Airport (Norwegian Meteorological Institute, 2023) and in Advent valley (Adventdalen), provided by the University Centre in Svalbard (UNIS Weather Stations, 2023), the coldest month is March, with an average temperature of −13 °C (average minima of −26 °C), and the warmest is July, with an average temperature of 8 °C (average maxima of 15 °C). The mean air temperature exceeds 0 °C for about 4 months, from the beginning of June until the end of September. Daylight is not available from the end of October to the middle of February.
To provide information on the environment, a series of basic parameters were measured at each site at 1-h intervals throughout the study period. Minikin Tie and later QTHi dataloggers (Environmental Measuring Systems, Brno, Czech Republic) were employed to monitor temperature, photosynthetically active radiation (PAR, in the range of 400–700 nm), and air humidity at a height of 120–160 cm above ground. The MicroLog T3 dataloggers were used in conjunction with three soil temperature sensors Pt1000/8 (Environmental Measuring Systems, Brno, Czech Republic) to record the soil temperature at a depth of 2–5 cm below ground. Due to logistical reasons, the PAR and humidity dataloggers were permanently installed later, with Sites 1 and 2 in March 2023 and Site 3 in June 2023. Therefore, the data on relative humidity at Site 3 for the first year of study were obtained from the Breinosa weather station (UNIS Weather Stations, 2023), situated next to the original site.
2.3 Sampling for metagenomics and metatranscriptomic analyses
Biocrust samples, each 2 cm deep to match the thickness of the biological soil crust, were collected using a sterile laboratory spoon on 5, 6, 8/8/2022, 3/10/2022, 23/3/2023, and 13/8/2023. To preserve RNAs for molecular analyses, 1 g of the biocrust was placed into a cryotube with 2 ml of LifeGuard Soil Preservation Solution (Qiagen, Germantown, MD, USA). In March 2023, all sites were covered in frozen snow, and thus, only samples from Site 1 could be retrieved. Five replicates were collected for each of the analyses. The samples were kept at −20 °C and transported frozen to the laboratories of the Institute for Plant Sciences at the University of Cologne (Germany).
2.4 In situ photosynthetic activity measurement
In situ photosynthetic activity of the biocrusts and its variation over the day was studied both in summer and autumn in 2022 and 2023. To measure the same area, the biocrusts from the localities were carefully transferred into 15-cm-diameter Petri dishes and plastic bowls perforated at the bottom in advance and placed back in their original location (Supplementary material S2). Three to four bowls and dishes were randomly established within the area of each site as replicates. For comparison between sites, only Petri dish data were used, and for evaluation of Site 1, both bowls and dishes were included in analyses, unless further specified.
In the summer seasons, measurements were performed at the three study sites for 24 h in 6-h intervals at each site on 9–10/8/2022 and 5–6/8/2023. In autumn, measurements were taken on 4/10/2022 and 23/10/2023 for 7 and 4.5 h in intervals of 4 and 1.5 h, respectively. Only Site 1 was measured for photosynthetic activity in the autumn period, as Site 2 and Site 3 could not be measured due to frozen snow cover at the higher elevations.
In the field, photosynthetic activity was measured at eight random spots per dish/bowl (a total of 32–48 spots per site) using a hand-held FluorPen FP-100 fluorometer (Photon Systems Instruments, Drásov, Czech Republic). Photosynthetic activity was measured using the OJIP protocol after 15 min of dark acclimation. The maximum quantum yield of the photosystem II (φPo ~ FV/FM) was determined according to Strasser et al. (2000, 2004):
where F0 is the minimum fluorescence at the beginning of the OJIP measurement and FM is the maximum fluorescence reached during the OJIP transient.
Moreover, the OJIP protocol evaluates various parameters, including the following measured and calculated parameters used for further data analyses on photosynthesis performance: M0, VI, VJ, ψET2o, φET2o, φDo, /RC, /RC, /RC, /RC. Their physiological meanings, adopted from Stirbet et al. (1998) and Strasser et al. (2004), are listed in Supplementary material S3.
Additionally, the maximum possible relative electron transport rate (rETRmax), which is a raw proxy of the maximum capacity of photosynthetic activity, was calculated using computed values of FV/FM, actual irradiance (PAR), and a factor of 0.5 reflecting the partitioning of energy between photosystems (Maxwell and Johnson, 2000) as:
2.5 Ex situ recovery of photosynthetic activity after winter biocrust thawing
Furthermore, ex situ photosynthetic activity of the thawed biocrusts was measured in the winter season at the end of March in 2023 (23–31/3/2023) and 2024 (25–31/3/2023). Four additional bowls were established at Site 1 as previously described. The biocrusts were extracted from the frozen soil, protected from light, and allowed to thaw slowly at a temperature of 4 °C for a period of approximately 24–36 h. Once the spots free of ice and snow had emerged, the crusts were placed at 15 °C and 26 μmol m−2 s−1, and the effective quantum yield of photosystem II (ΦPSII) was measured at 5-min intervals on three spots by Monitoring Pen MP-100 fluorometer (Photon Systems Instruments, Drásov, Czech Republic) per bowl/biocrust (a total of 12 spots) at the same time for the period of 1 h when stable ΦPSII was reached. The ΦPSII was calculated as follows (Roháček et al., 2008):
where FS is the steady-state fluorescence in light and is the maximum fluorescence after a saturation pulse in light.
After the measurements, the biocrusts were returned to their original location and covered in snow. The identical cycle of thawing and measurement of the biocrusts was repeated after 4 days.
2.6 Metagenomic and metatranscriptomic analyses
Comprehensive community profiles of prokaryotic and eukaryotic taxa from the same samples have been reported in Pushkareva et al. (2024b). In the present study, we therefore focus exclusively on functional genes related to photosynthesis. The molecular analyses were performed as described in Pushkareva et al. (2024b). In summary, DNA extraction was performed using the DNeasy PowerSoil Pro Kit (Qiagen, Germantown, MD, USA) according to the manufacturer's instructions. RNA extraction was performed using the NucleoBond RNA Soil Mini Kit (Macherey-Nagel, Germany). Metagenomic and metatranscriptomic sequencing was conducted at the Cologne Centre for Genomics (Cologne, Germany) using the NovaSeq6000 sequencing system (PE150). Of the samples collected in October 2022, only five were sequenced (two replicates from Site 1, one replicate from Site 2, and two replicates from Site 3). Across all samples, 90%−95% of raw reads survived quality filtering. For the assemblies, contigs and transcripts shorter than 500 bp were discarded. Sequences are available in the Sequence Read Archive under the project numbers PRJNA1124630 and PRJNA1172564 for metagenomics and metatranscriptomics, respectively.
2.7 Data analyses
Fluorescence data were retrieved by FluorPen 1.1.2.6 software (Photon Systems Instruments, Drásov, Czech Republic). If one or more of the OJIP parameters were out of the range defined in Supplementary material S3, the computed values were excluded from the analyses. Fluorescence performance was correlated to environmental data and differences among the sites or between seasons were tested using unpaired t-tests or one-way ANOVA with post hoc comparisons using Tukey's multiple comparison test. PCA was run to summarize the variability within the FV/FM values and other non-photochemical parameters of fluorescence: M0, VI, VJ, ψET2o, φET2o, φDo, /RC, /RC, /RC, /RC. The effects of site, sampling season, air temperature, soil temperature, and irradiance were tested using RDA with a Monte Carlo permutation test to show statistical significance. Prior to running the PCA and RDA, the data were standardized across species (mean variance standardization).
Bioinformatic analyses were performed in OmicsBox software (v3.3.1) as described in Pushkareva et al. (2024b). The rRNAs were separated from both quality-filtered datasets using SortMeRNA (Kopylova et al., 2012), and the remaining reads were separately assembled de novo using MEGAHIT (v1.2.8, Li et al., 2015). Taxonomic assignment of 16S and 18S rRNAs retrieved from the metagenomic dataset was performed using the Silva database (v138.1) available at the SILVAngs analysis platform. The sequences assigned to cyanobacteria and algae were then retrieved to calculate relative abundance. Moreover, the transcripts and metagenomic contigs were quantified using the RSEM software package (v1.3.3, Li and Dewey, 2011) and aligned to NCBI Blast searches (E × 10). Additionally, Gene Ontology mapping and annotations were performed (Götz et al., 2008). Subsequently, the photosynthesis-related genes were retrieved for further analysis.
The influence of environmental parameters on photosynthesis-related genes was tested. A principal component analysis (PCA) was performed to summarize the variability within the relative transcript activity of photosynthesis-related genes. To test the effect of site and sampling season (Aug22 × Oct22 × Mar23 × Aug23), redundancy analysis (RDA) with a Monte Carlo permutation test to show statistical significance was used. Prior to running the PCA and RDA, the data were standardized across species (mean variance standardization). The impact of site, sampling season, and their interaction on photosynthesis-related transcripts represented by the fragments per kilobase of transcript per million fragments sequenced (FPKM) numbers was tested using two-factor ANOVA.
Statistical analyses were performed using R 4.4.1 (R Core Team, Vienna, Austria), Statistica 14.0 (TIBCO Software, San Ramon, CA, USA), or GraphPad Prism 5.03 (GraphPad Software, La Jolla, CA, USA). The ordination analyses were performed in Canoco 5.01 (Biometris, Wageningen, Netherlands, Ter Braak and Šmilauer, 2012). The environmental measurement data were processed with the Mini32 program (Environmental Measuring Systems, Brno, Czech Republic). For further visualization of the data, the following software was used: QGIS 3.28 (Quantum GIS Geographic Information System, London, UK), GraphPad Prism 5.03 (GraphPad Software, La Jolla, CA, USA), SigmaPlot 14.0 (Grafiti, Palo Alto, CA, USA), Zoner Photo Studio 16 (Zoner Software, Brno, Czech Republic), and Inkscape 1.1 (Software Freedom Conservancy, New York, NY, USA).
3 Results
3.1 Temperature, relative humidity, and irradiance
The mean daily values of air and soil temperature, relative air humidity, and PAR from 6/8/2022 to 24/10/2023 are presented in Figure 3, and their statistical significance of differences among the three study sites is shown in Table 1. An overview of microclimate data, including monthly means, minimum, and maximum values, is presented in Supplementary material S4 and in Pushkareva et al. (2024b).
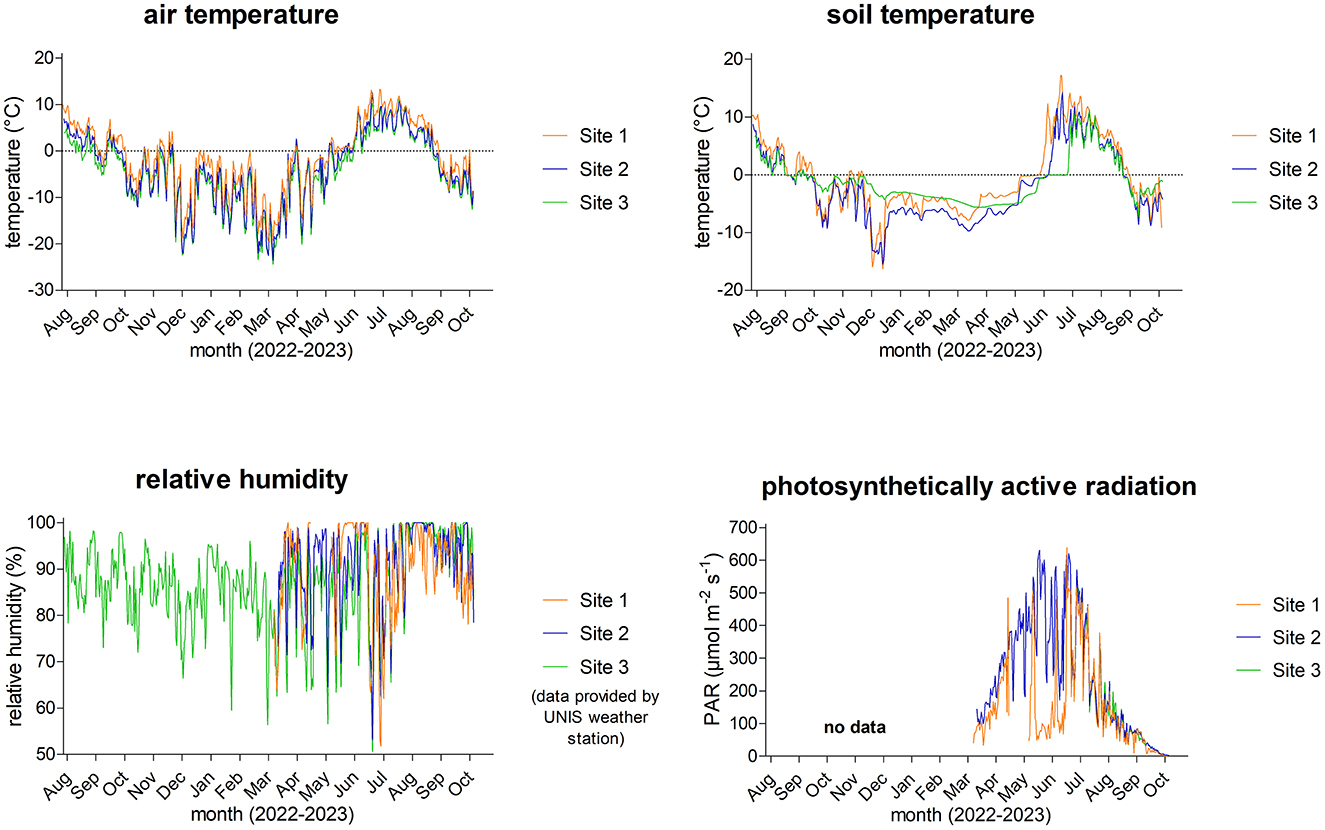
Figure 3. Diel averages of air and soil temperatures, relative humidity, and photosynthetically active radiation (PAR) from 6/8/2022 to 24/10/2023.
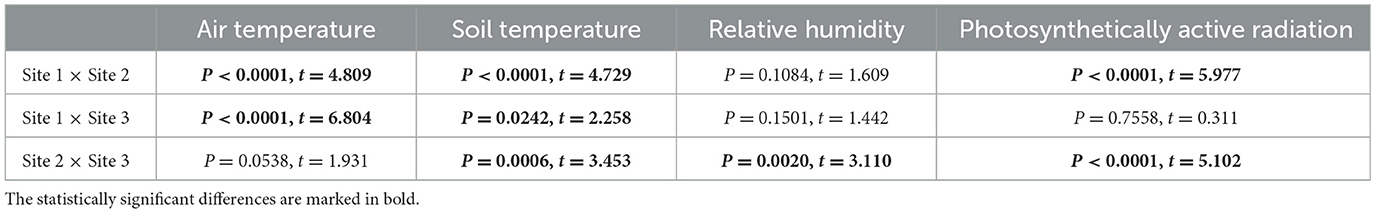
Table 1. The statistical significance (unpaired t-tests; n = 442) of the parameters monitored between the three study sites from 6/8/2022 to 24/10/2023.
The daily mean air temperature at Site 1 ranged from −19.5 °C (March 2023) to 13.3 °C (July 2023); at Site 2, from −23.5 °C (March 2023) to 12.5 °C (July 2023); and at Site 3, from −24.4 °C (March 2023) to 11.1 °C (August 2023). The lowest air temperature of −26.9 °C was measured on 21/3/2023 at Site 3, and the air temperature rose to 16.3 °C on 5/7/2023 at Site 1. Regarding the soil temperature at Site 1, the lowest daily mean was −16.2 °C (December 2022) and the highest was 17.1 °C (July 2023); at Site 2, it ranged from −15.4 °C (December 2022) to 14.2 °C (July 2023); and at Site 3, from −7.2 °C (September 2023) to 11.2 °C (July 2023). The lowest soil temperature reached −17.4 °C on 25/12/2022 and the highest was 24.5 °C on 5/7/2023, both measured at Site 1, making it surprisingly the most extreme site. The air and soil temperatures positively correlated at all three sites: P < 0.0001, r = 0.9060 (Site 1), r = 0.8688 (Site 2), r = 0.7340 (Site 3), n = 442. The air temperature was significantly higher at Site 1 than at Sites 2 and 3, where the air temperatures were comparable. On the other hand, all sites differed significantly in soil temperature (Table 1).
During the study period, the mean relative humidity of the air exceeded 80%. As seen in Figure 3, daily means varied between 50 and 100%. The highest variation in relative humidity and daily minimum values were observed from the beginning of January to the beginning of July. Unfortunately, the air humidity dataloggers were not installed at the very beginning of the field study at Sites 1 and 2; therefore, some data for Sites 1 and 2 are missing. Nevertheless, the relative humidity differed significantly at Sites 2 and 3, but both sites were comparable to Site 1 (Table 1).
The seasonal variation of photosynthetically active radiation day averages ranged from 0 to about 640 μmol m−2 s−1, which can be expected from such a geographic location due to changes in the solar elevation angle and the Earth–Sun distance throughout the year (Figure 3). The highest intensity reached 1,699 μmol m−2 s−1 and was measured on 29/4/2023 at Site 1. Similarly to relative humidity sensors, the irradiance sensors were additionally installed only for the 2023 summer season, and unfortunately, some issues appeared at Site 1, as extremely low levels of intensity and continuous 100% relative humidity were measured for most of May. Surprisingly, PAR was similar at the more geographically distant Sites 1 and 3, while it was significantly different between geographically nearby Sites 2 and 3. A significant difference was also observed between Sites 1 and 2 (Table 1).
3.2 Diversity of algae and cyanobacteria
The composition of the microalgal community was determined using the rRNA reads present in the metagenomic data set published by Pushkareva et al. (2024b) (Figure 4). Statistical comparison of dominant algal classes and cyanobacterial orders across the study sites based on the number of 16S or 18S rRNA reads is listed in Supplementary material S5.
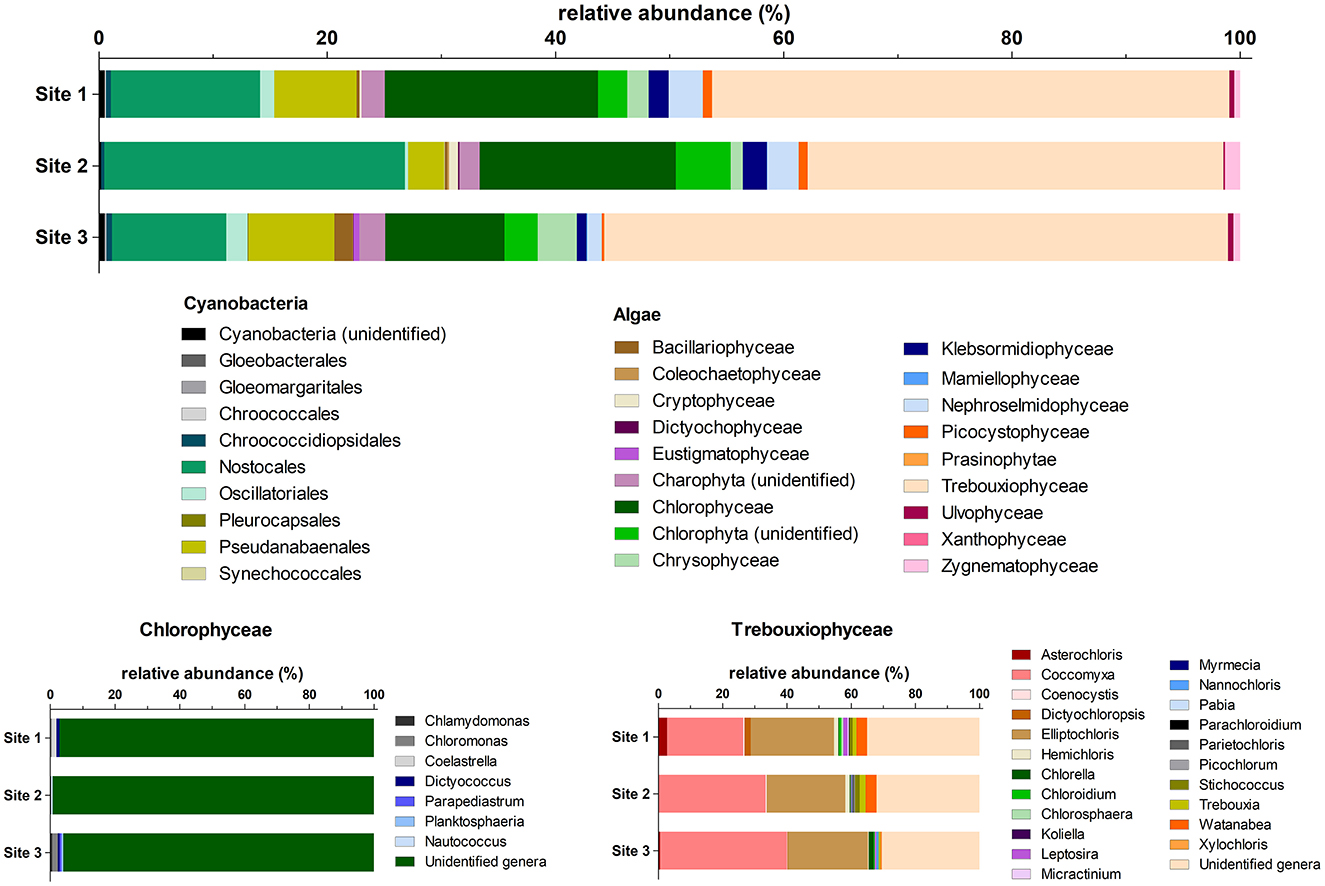
Figure 4. Relative abundances (based on the number of 16S or 18S rRNA reads extracted from the metagenomic dataset, n = 5) of dominant algal classes and cyanobacteria orders per study site, with Chlorophycean and Treuboxiophycean genera shown below.
Trebouxiophyceae dominated the community of eukaryotic algae (52%−69% of algal reads; Figure 4). A total of 22 trebouxiophyte genera were identified, and most reads for this class belonged to Coccomyxa (14%−27% of algal reads), Elliptochloris (13%−17% of algal reads), and unclassified Trebouxiophyceae (17%−21% of algal reads). Chlorophyceae constituted 13%−25% of algal reads, but most reads (96%−99% of algal reads) could not be identified to the genus level. Furthermore, Xanthophyceae were detected only at Site 2, while Eustigmatophyceae were detected only at Site 3. Additionally, Site 3 had a more diverse community of Bacillariophyceae (5 identified genera), Chlorophyceae (five identified genera), Chrysophyceae (eight identified genera), and Trebouxiophyceae (17 identified genera) compared to the other sites. A significant effect of the algal classes was revealed (two-way ANOVA, P < 0.0001, F = 141.4, n = 5), along with a significant group × site interaction (P = 0.0028, F = 1.925, n = 5). The site effect was not significant. The only groups that differed significantly among the sites were Chlorophyceae (one-way ANOVA, P = 0.0464, F = 4.009, n = 5) and Eustigmatophyceae (one-way ANOVA, P = 0.0060, F = 8.067, n = 5).
Regarding cyanobacteria, the most dominant groups were Nostocales (49%−87% of cyanobacterial reads) with 12 identified genera and Pseudanabaenales (10%−37% of cyanobacterial reads) involving 13 genera. Gloeobacterales, Gloeomargaritales, and Pleurocapsales were identified only at Site 3, and Synechococcales were identified at Site 2. Similar to algal relative abundances, the cyanobacterial orders significantly differed (two-way ANOVA, P < 0.0001, F = 110.5, n = 5), as did the interaction between group and site (P < 0.0001, F = 3.773, n = 5). The site effect alone was not significant. Nostocales were the only group that differed significantly among the sites (one-way ANOVA, P = 0.0262, F = 5.008, n = 5).
3.3 In situ photosynthetic activity
The in situ photosynthetic activity, expressed as maximum quantum yield (FV/FM) and maximum possible relative electron transport rate (rETRmax), along with environmental data, was measured in August and October in 2022 and 2023 for one diel cycle (five “time points” indicating measurements in August 2022 and 2023, three “time points” in October 2022, and four in October 2023). While the summer measurements were performed at all experimental sites, the autumn measurements were performed only at Site 1 because a deep layer of frozen snow was already present at Sites 2 and 3.
The diel means of FV/FM and rETRmax in both years were comparable, and the differences in biocrust photosynthetic activity among the studied sites in summer were found to be significant only for FV/FM in 2022 [Table 2; one-way ANOVA, P < 0.0001, F = 34.00, n(Site1) = 14, n(Site2) = 19, n(Site3) = 20]. Contrary to the similarity in photosynthetic activity among the experimental sites, the air temperature in 2022 (Supplementary material S6; one-way ANOVA, P < 0.0001, F = 98.59, n = 29) and 2023 (Supplementary material S6; one-way ANOVA, P = 0.0013, F = 7.176, n = 29), soil temperature in 2022 (Supplementary material S6; one-way ANOVA, P < 0.0001, F = 26.22, n = 29), and the relative humidity in 2023 (Supplementary material S6; one-way ANOVA, P = 0.0005, F = 8.258, n = 29) significantly differed between the sites during the period of photosynthetic measurements in August.
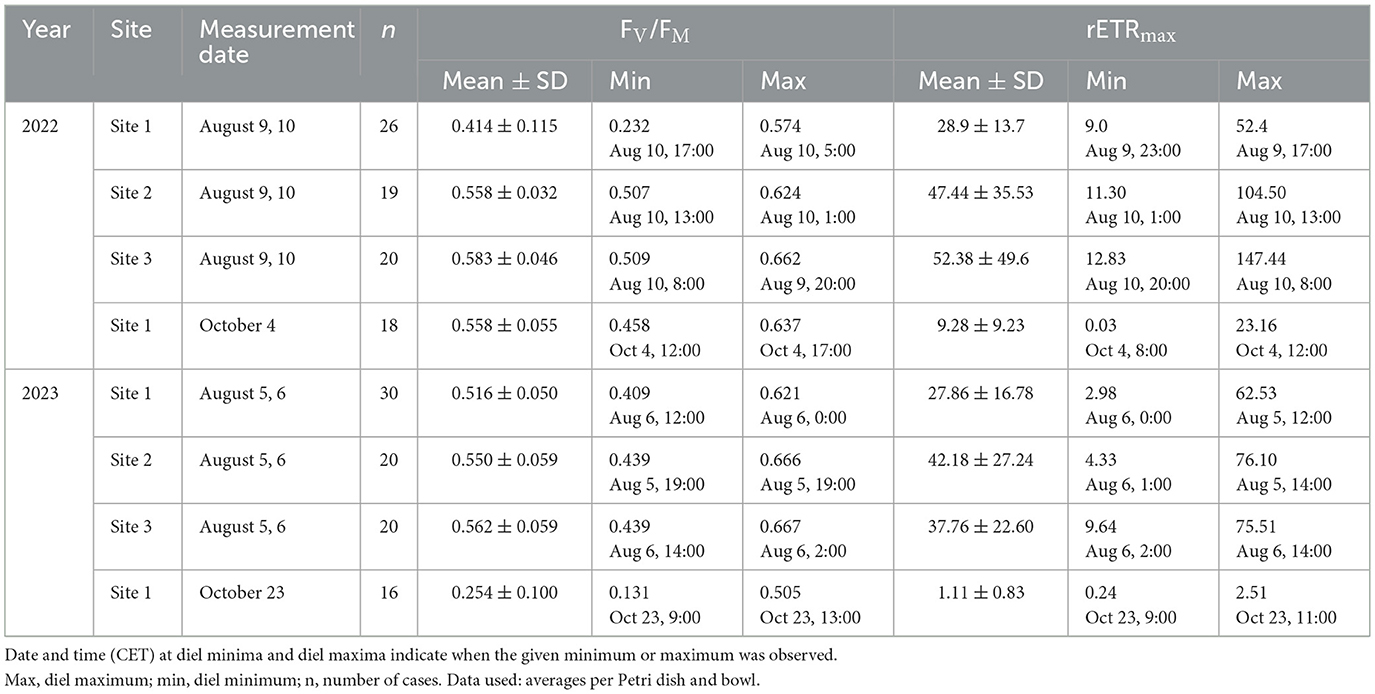
Table 2. The diel mean (± standard deviation), minimum, and maximum values of maximum quantum yield (FV/FM) and maximum possible relative electron transfer rate (rETRmax).
In contrast to summer, the autumn measurements of biological soil crust were performed for two subsequent years (2022 and 2023, both in October) only at Site 1. In general, the values of FV/FM measured at the beginning of October 2022 were higher than those in late October 2023, indicating more serious stress encountered in the field in 2023 [Table 2, Supplementary material S6; unpaired t-tests, P < 0.0001, t = 11.17, n(Oct22) = 18, n(Oct23) = 16]. Contrary to 2022, the values of rETRmax were lower and more stable in 2023 [Table 2, Supplementary material S6; unpaired t-test, P = 0.0013, t = 3.520, n(Oct22) = 18, n(Oct23) = 16]. Naturally, the measured environmental data also differed significantly: air temperature (unpaired t-test, P < 0.0001, t = 13.77, n = 6), soil temperature (unpaired t-test, P < 0.0001, t = 28.45, n = 6), and irradiance (unpaired t-test, P = 0.0048, t = 3.345, n = 6).
The comparison of the photosynthetic activity of the biocrust among the seasons, performed at Site 1 only, revealed significant differences in both the FV/FM [Figure 5; Kruskal–Wallis ANOVA, P < 0.0001, H = 47.02, n(Aug22) = 26, n(Oct22) = 18, n(Aug23) = 30, n(Oct23) = 16] and the rETRmax values [Figure 5; Kruskal–Wallis ANOVA, P < 0.0001, H = 49.43, n(Aug22) = 26, n(Oct22) = 18, n(Aug23) = 30, n(Oct23) = 16]. FV/FM differed significantly between all pairs of measurements, with the exception of the beginning of October 2022 and August 2023 when similar and maximum FV/FM values were observed. In August 2022, wide variation in FV/FM occurred, while minimum values of FV/FM were recorded in October 2023 (Figure 5). Significant seasonal variation (summer × autumn) in rETRmax was observed, with maxima during the summer season and minima in autumn. No significance was demonstrated within the two autumn and summer datasets (Figure 5).
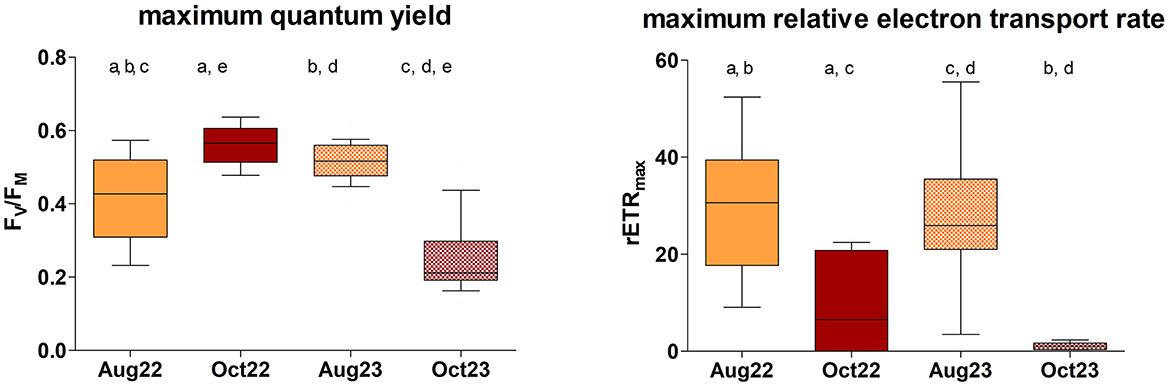
Figure 5. The seasonal comparison of biological soil crust photosynthetic activity (FV/FM and rETRmax) at Site 1. Significant pairs are indicated by letters above [n(Aug22) = 26, n(Oct22) = 18, n(Aug23) = 30, n(Oct23) = 16]. Line: median; box: first and third quartiles; whiskers: 10–90 percentile.
3.4 Diel changes in photosynthetic activity
Despite continuous light during the polar summer, profound changes in PAR occurred, leading to the observation of diel cycles at Site 1. Most of the diel changes in “time point” mean values for FV/FM ranged from 0.273 to 0.525 and from 0.486 to 0.566 in August 2022 and August 2023, respectively, and were statistically significant (Figure 6, Supplementary material S6). These values were comparable between the years. Similarly, significant changes in the mean value for rETRmax were observed in the range of 9.43 to 49.70 and 3.47 to 53.56 in August 2022 and August 2023, respectively (Figure 6, Supplementary material S6), again being comparable between the years. Although the maximum mean values of FV/FM were reached around local midnight and early in the morning, the maximum hours mean value for rETRmax occurred around local midday in both summer seasons (Figure 6, Supplementary material S6).
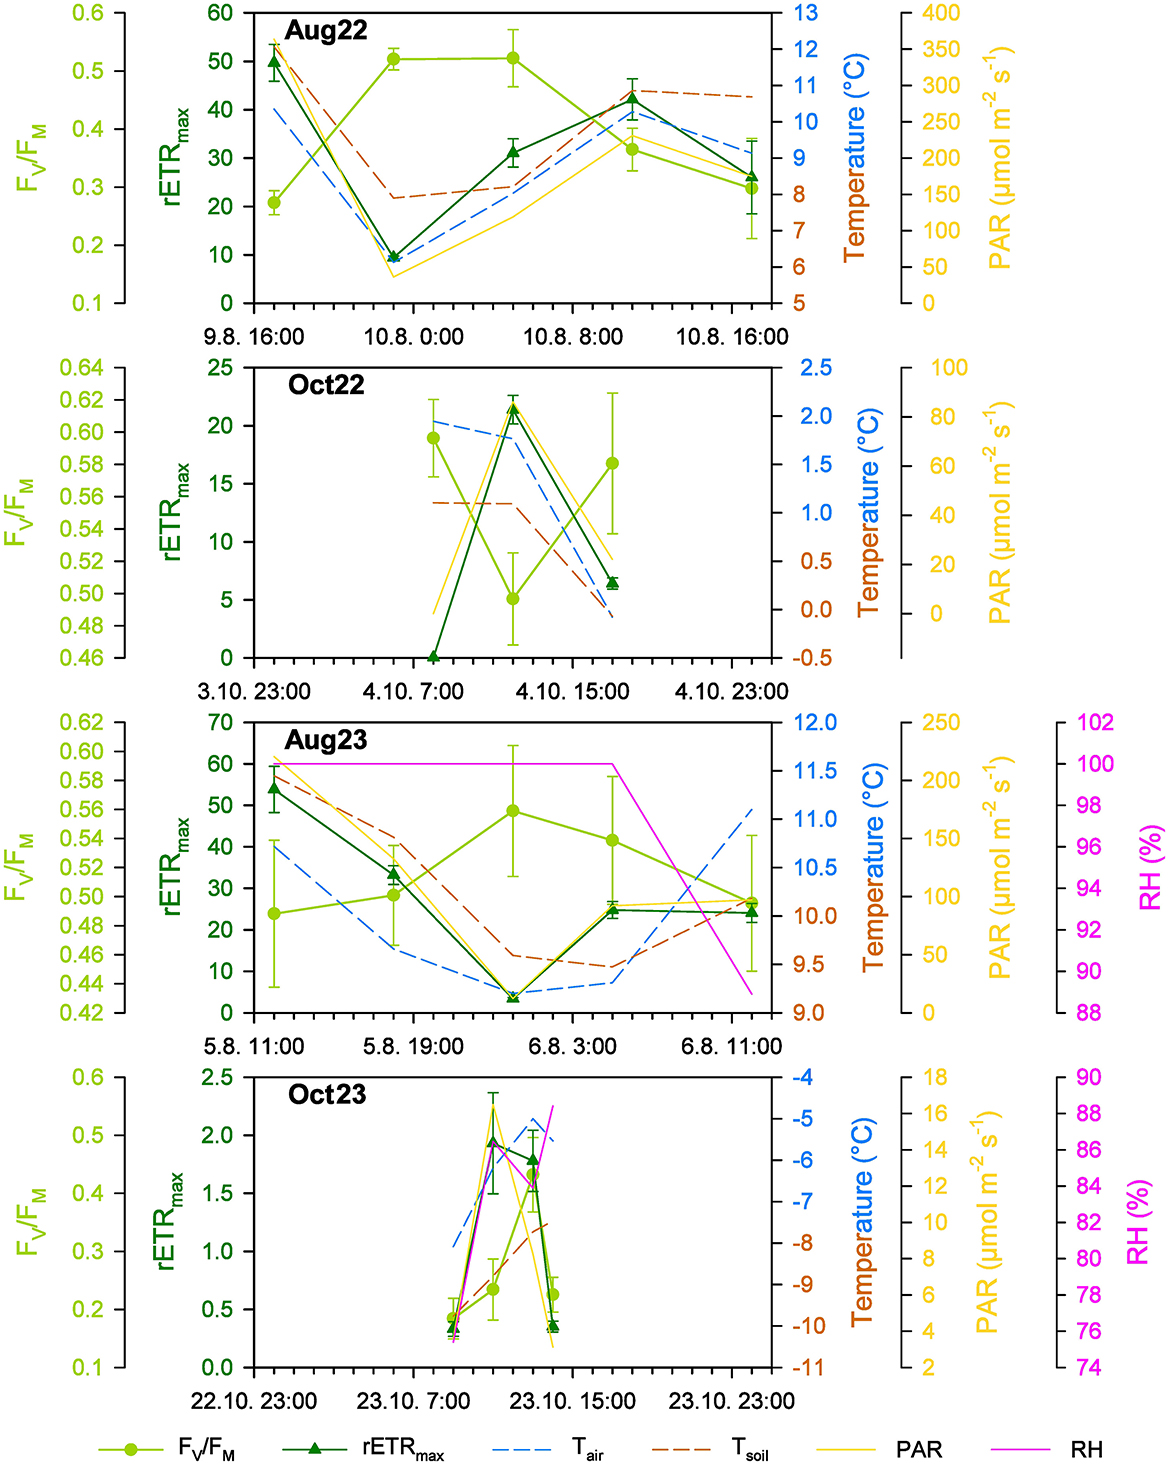
Figure 6. The diel changes of the photosynthetic (FV/FM and rETRmax; mean ± SD, for n refer to Supplementary material S6) and environmental parameters (air and soil temperature, Tair, Tsoil; photosynthetically active radiation, PAR; relative humidity, RH) at Site 1 in the studied periods in summer (Aug) and autumn (Oct) 2022 (22) and 2023 (23).
In autumn, the light period lasted 9 h 40 min on October 4, 2022, and only 3 h 34 min on October 23, 2023. The “time point” mean FV/FM was significantly higher in 2022 indicating more stressful conditions in 2023 (Figure 6, Supplementary material S6; unpaired t-test, P = 0.0100, t = 4.036, n(Oct22) = 3, n(Oct23) = 4). Despite low irradiances, especially in 2023, the diel cycles of photosynthetic activity were observed. The mean FV/FM in the range of 0.496 to 0.597 in early October 2022 was even higher than in summer (Figure 6, Supplementary material S6), while in late October 2023, the mean FV/FM dropped much lower, to 0.188–0.436 (Figure 6, Supplementary material S6). The mean rETRmax of 0.03–21.35 in early October 2022 was reduced to approximately one-third in comparison to the summer values (Figure 6, Table 2, Supplementary material S6) and in late October 2023, the photosynthetic activity was almost negligible, with mean rETRmax between 0.34 and 1.99 (Figure 6, Supplementary material S6). In early October 2022, the diel course of “time point” mean values of FV/FM and rETRmax and their response to PAR changes were similar to summer (Figure 6, Supplementary material S6), while in late October 2023, the mean FV/FM remained low in the local morning while rETRmax reached its maximum. At local midday, higher FV/FM and rETRmax means were observed than in the local early morning and in the local evening (Figure 6, Supplementary material S6).
The diel cycles measured at Sites 2 and 3 in summer revealed a similar response as at Site 1, i.e., maximum “time point” mean FV/FM around local midnight and maximum “time point” mean rETRmax around local midday (Supplementary materials S6, S7). At Site 2, the mean FV/FM remained stable during the day, spanning from 0.545 to 0.605 and from 0.524 to 0.607 in August 2022 and August 2023, respectively, being slightly higher than at Site 1 (Supplementary materials S6, S7; unpaired t-test, P = 0.0085, t = 2.956, n = 10) and comparable to Site 3. The “time point” mean rETRmax reached its maximum around local midday likewise at Sites 1 and 3 (2022: 11.77–97.96 and 2023: 4.85–71.35; Supplementary materials S6, S7). While the mean rETRmax minima at Site 2 were comparable to Site 1, the maximum values were higher than at Site 1 and comparable or only slightly than at Site 3 (Supplementary materials S6, S7). Likewise, the “time point” mean FV/FM values at Site 3 of 0.529–0.628 and 0.470–0.631 in August 2022 and August 2023, respectively, were higher than at Site 1 at the comparable “time point” (Supplementary materials S6, S7; unpaired t-test, P = 0.0074, t = 3.015, n = 10) as well as the mean rETRmax in ranges of 13.55–139.51 and 10.22–70.67 in August 2022 and August 2023, respectively; however, this was not significant (Supplementary materials S6, S7).
3.5 Effects of environmental parameters on photosynthetic activity
No statistically significant correlations were found among air or soil temperature, relative humidity, and photosynthetic activity expressed as FV/FM and rETRmax except for positive correlations of air temperature and rETRmax at Sites 1 and 3 in August 2022, and a negative correlation of soil temperature and FV/FM at Site 1 in August 2022 and 2023 (Supplementary material S8). If significant, negative correlations of FV/FM and irradiance were found. Strong significant positive correlations of rETRmax and irradiances were found. Interestingly, the only significant relationship for autumn measurements was found for rETRmax and irradiances in October 2022.
3.6 OJIP fluorescence parameters
At all three sites, positive correlations were found between soil and air temperature, stronger at Sites 1 and 3 than at Site 2. None or weak positive correlations of PAR to temperatures were found (Figure 7).
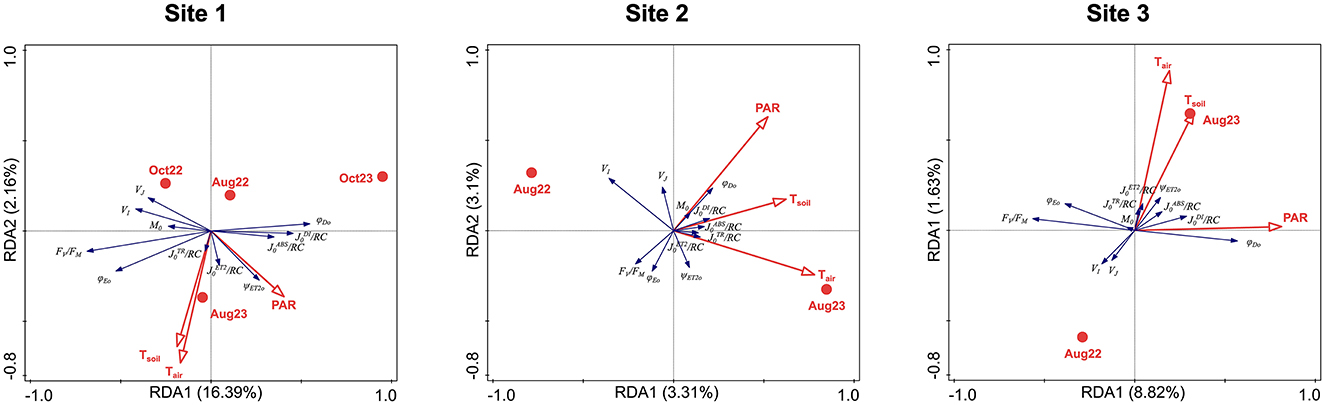
Figure 7. RDA analyses showing the correlation among photosynthetic parameters (explained variables: FV/FM, M0, VI, VJ, ψET2o, φET2o, φDo, /RC, /RC, /RC, /RC; blue arrows) and the environmental data (explaining variables: sampling season, PAR, air and soil temperature; red symbols and arrows) for all the study sites. Total variation 5,247 (Site 1)/2,398 (Site 2)/3,080 (Site 3), explanatory variables account for 19.26%/6.79%/11.19%. Monte Carlo permutation test results: P = 0.002/P = 0.006/P = 0.002, pseudo-F = 15.4/1.8/6.7 (first axis); P = 0.002/P = 0.02/P = 0.002, pseudo-F = 18.7/3.9/8.7 (all axes).
At Site 1, the temperatures and PAR increased to measurement in August 2023. The responses of OJIP parameters differed from Sites 2 and 3, as the October measurements were included in the RDA analysis. The /RC, /RC, and ψET2o were positively related to air and soil temperatures and PAR. The parameters indicating increased energy dissipation, φDio, /RC, and /RC, were related to harsh conditions in October 2023. An opposite reaction was observed in photochemistry-related parameters FV/FM, M0, and φET2o. The parameters VJ and VI were positively related to October 2023. The seasons (Aug × Oct) and years appeared to contribute significantly to data variation, since the explained variation was much higher at Site 1 (Figure 7).
At Site 2, the air and soil temperatures increased in August 2023, and the PAR remained independent of the year of measurement and was rather positively correlated to soil temperature. The ψET2o and all fluxes through the active reaction center, /RC, J0TR/RC, /RC, and /RC, were strongly positively related to air and soil temperatures, while M0 and φDIo were strongly positively related to PAR. A weaker positive correlation was found between VJ and PAR. The FV/FM and φET2o were negatively related to PAR. The VI was strongly negatively related to Tair while it was independent of PAR and inclined toward measurement in August 2022 (Figure 7).
Like at Site 2, the Tair and Tsoil raised toward August 2023 at Site 3, but they were more positively correlated. Contrary to Site 2, the relation of PAR was almost independent of both temperatures and the year of the measurements, but it was slightly positively related to the August 2023 measurement. The /RC, /RC, and ψET2o were strongly positively related to increased temperatures in August 2023, while VJ and VI were negatively related and inclined toward August 2022. The /RC was positively correlated with temperatures and PAR. The parameters related to energy dissipation, φDio, /RC, and /RC, increased with higher PAR; an opposite reaction was observed in photochemistry-related parameters, FV/FM, M0, and φET2o (Figure 7).
3.7 Ex situ recovery of photosynthetic activity after winter biocrust thawing
Ex situ recovery of photosynthetic activity after winter biocrust thawing measurements was performed on samples collected at Site 1 at the end of March 2023 and 2024. In both seasons, the effective quantum yields (ΦPSII) exhibited a gradual increase during the first hour following both thawing cycles, with a rapid increase phase within the first 20–35 min of exposure, followed by a steady state later on (Figure 8, Supplementary material S9). The maximum measured ΦPSII value reached 0.68 in the first cycle in 2023, while the lowest value was 0.01 in 2024. A notable divergence between the two thawing cycles was observed in both years (unpaired t-test; 2023: P = 0.0120, t = 2.718, n = 12, 2024: P < 0.0001, t = 8.792, n = 12). A significant difference was observed between the 2 years only regarding the development of the first thawing (unpaired t-test; P < 0.0001, t = 12.70, n = 12).
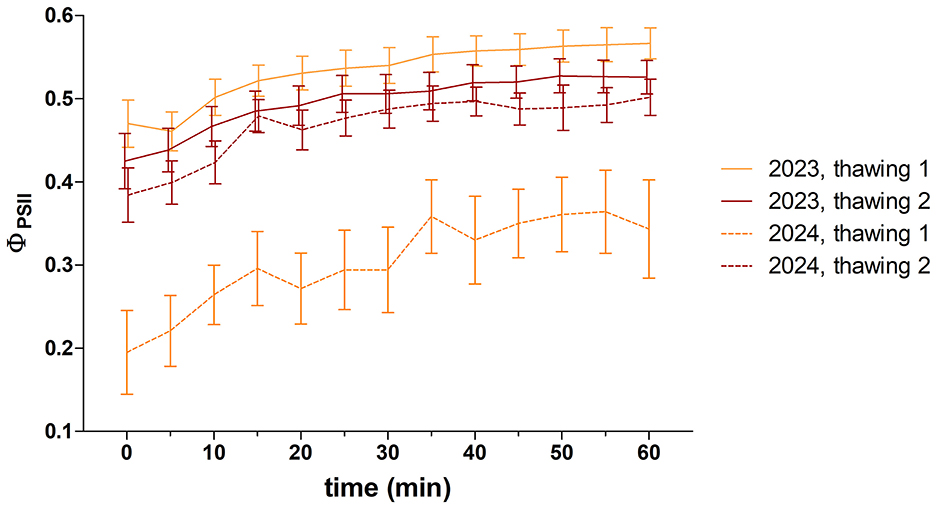
Figure 8. Effective quantum yield of photosystem II (ΦPSII; mean ± SEM, n = 12) of biocrusts at Site 1 immediately after the thawing cycles in winter (March) 2023 and 2024.
3.8 Expression of photosynthesis-related genes
Metatranscriptomic analyses were used to test whether biocrusts acclimate to the different seasons or to the environments of the three sites by differential gene expression. In this study, photosystem II (PSII)-related genes and some other photosynthesis or stress-related genes such as oxygen-evolving enhancer proteins (OEEs: PsbO, PsbP, PsbQ), RuBisCO small subunit (RbcS), early light-induced proteins (ELIPs), Cor413pm1, and Ohp1 were studied (Supplementary material S10) at all three experimental sites in August 2022 and 2023, and October 2022. In March 2023, the samples were collected at Site 1 only.
The PsbA (D1 protein-coding) and RuBisCO small subunit (RbcS) were the most abundant transcripts at the three sites and in all seasons, followed by the other three PSII core subunits: PsbD (D2 protein-coding), PsbC, and PsbB. All other transcripts showed much lower relative activity (Figure 9). The PSII core subunits (PsbA, PsbB, PsbC, and PsbD), four minor PSII subunits (PsbH, PsbL, PsbT, and PsbZ), three of the OEEs (PsbO, PsbP, and PsbQ), two of the light-harvesting complex (LhcA and LhcB), two involved in PSII assembly (Ycf48 and Ohp1), and Elip showed differential gene expression at different sites and times of the year, as well as RbcS. The expression level of RbcS decreased dramatically in March, while the relative activity of the PsbA transcript was maximal in this season (Figure 9). In particular, the PsbA expression was also higher for all three sites in August 2023 compared to August 2022 (Figure 9).
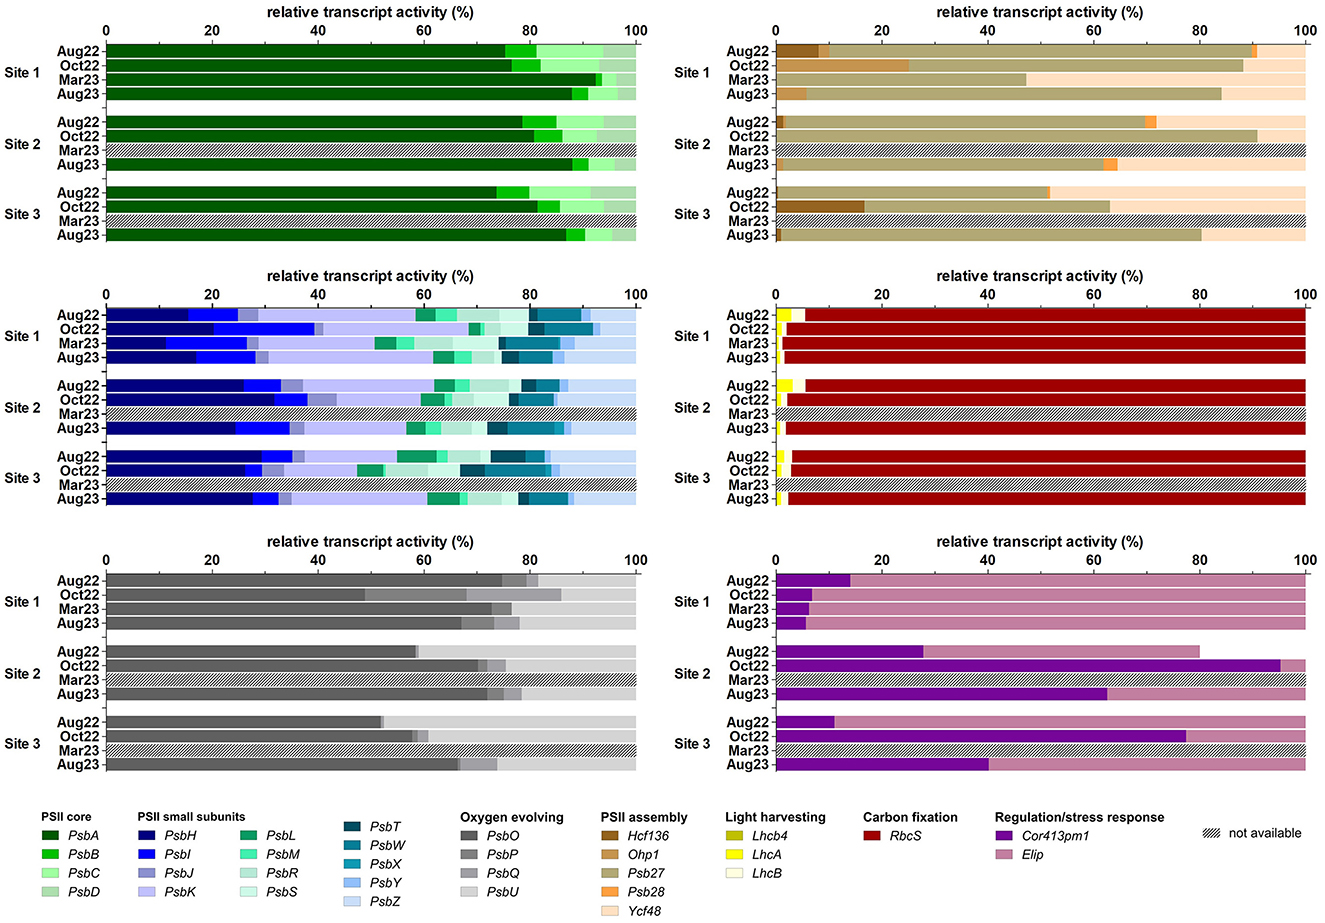
Figure 9. Relative transcript activity of photosynthesis-related genes (expressed as a percentage of FPKM, fragments per kilobase of transcript per million fragments sequenced) per study site and sampling season. n(Aug22) = 5, n(Oct22) = 2, n(Mar23, Aug23) = 4.
Of the 32 analyzed genes, the expression of 25 transcripts was significantly affected by season and/or the sites and their interactions (Figure 9, Supplementary material S11). The effects of site were significant only in the expression of the PSII small subunit gene PsbT and the PSII assembly-involved gene Ycf48. Gene expression of more transcripts was affected only by season, namely the PSII small subunit genes PsbI, PsbJ, PsbK, PsbM, PsbR, PsbS, PsbW, and PsbY, and the oxygen-evolving complex gene PsbO. The effects of season and site were significant in all PSII core genes, in the PSII small subunit genes PsbH and PsbZ, the light-harvesting complex genes LhcA and LhcB, and RbcS. The season and the interaction site × season were significant for the expression of the oxygen-evolving complex gene PsbQ. Finally, site, season, and the site × season interaction were important for the expression of the PSII small subunit gene PsbL, the oxygen-evolving complex gene PsbP, and the PSII assembly-involved gene Ohp1. In contrast, no significant differences in gene expression were observed in the PSII small subunit gene PsbX, the oxygen-evolving complex genes PsbU, the light-harvesting complex gene Lhcb4, the PSII assembly-involved genes Psb27, Psb28, and Hcf136, and the desiccation marker Cor413pm1 (Supplementary material S11).
The sampling season explained a significant part of the variation, 31.31% (RDA, Monte Carlo permutation test; first axis pseudo-F = 3.2, P = 0.002; all axes pseudo-F = 4.7, P = 0.002; n = 35). The effect of site was weaker and explained 11.47% of the variation (RDA, Monte Carlo permutation test; first axis pseudo-F = 1.5, P = 0.006; all axes pseudo-F = 2.1, P = 0.006; n = 35). When individual sampling sites were considered, the RDA revealed distinct gene expression during individual seasons at each site (Supplementary material S12).
Nevertheless, some general trends in gene expression occurred at all experimental sites. The opposite increase in the expression of PSII core genes PsbA, PsbD, PsbC, and PsbB was detected, with PsbA being more expressed under more severe conditions, especially at Site 1 in March 2023 and at Site 2 in August 2023. At Site 3, the expression of PSII core genes PsbD, PsbC, and PsbB increased in August 2022, while the increase in PsbA showed a weak trend toward October 2022 and August 2023. The expression of PSII core genes PsbD, PsbC, and PsbB was positively correlated with the majority of small PSII subunits, with the exception of PsbX, which was more positively correlated with PsbA. The light-harvesting complex genes LhcA, LhcB, and Lhcb4 tended to increase in August 2022, and their expression was accompanied by an increase in the expression of the PSII small subunit PsbK as well as the expression of Elip.
However, different trends were observed between sites, probably due to the absence of March as the most severe conditions at Sites 2 and 3. The expression of the PSII small subunit PsbS increased toward October 2022 at Sites 2 and 3, contrary to Site 1, where this gene was more expressed in August 2022. The expression of the PSII small subunits PsbX and PsbW was also closely related at Sites 2 and 3, but this trend was not seen at Site 1. Finally, the expression of all oxygen-evolving complex genes was tightly related at Site 1 in October 2023, while at Sites 2 and 3, maximum expression of these genes occurred in August. The genes PsbO and PsbU were more expressed in August 2022, and the genes PsbQ and PsbP were more expressed in August 2023. The regulation of PSII assembly via Ycf48 was more prominent at Site 1 in October 2023, whereas it was more expressed at Sites 2 and 3 in August 2022. The gene Cor413pm1 was expressed more at Site 1 in August 2023, while at Sites 2 and 3, it was expressed in October 2022 and August 2023. At Sites 1 and 2, the expression of RbcS was correlated with October 2022, contrasting with Site 3, where increased expression was related to August. Surprisingly, no transcripts of the PSII assembly regulation gene Ohp1 were detected at Site 3 (Supplementary material S12).
4 Discussion
4.1 Microclimate data
In general, the microclimate data obtained in this study did not differ from the average numbers for the Svalbard region (Láska et al., 2012; Norwegian Meteorological Institute, 2023; UNIS Weather Stations, 2023). According to the air temperature data, the coldest and warmest months (March and July, respectively) exhibited similar patterns and did not differ between the localities.
Regarding the soil temperature data, ground temperature data from nearby Petunia Bay were similarly shown to be the lowest in the “spring” months (April 2009 and March 2010) (Láska et al., 2012). However, according to the measured soil temperature data in this study, the coldest month was December 2022, probably due to a low level or absence of snow cover, which could act as thermal insulation, uncoupling air temperature fluctuations from ground temperatures (Davey et al., 1992; Fahnestock et al., 1998; Morgner et al., 2010). Early and deep snow accumulation may even protect microbial populations from extreme and harmful freezing conditions and potentially allow them to maintain some level of activity during winter in comparison to areas with delayed snow cover (Fahnestock et al., 1998; Morgner et al., 2010). Site 1, the lowest elevation site where snow probably accumulated later in winter, showed unexpectedly extreme conditions with the lowest soil temperatures and high variability measured.
Site 2 appeared to be more humid than Site 3, which could be caused by the presence of clouds at this elevation (personal observation). However, this observation was not supported by the irradiance data.
4.2 Diversity of algae and cyanobacteria
Microbial phototrophs are essential for the process of photosynthesis, contributing a substantial portion of the Earth's oxygen and aiding in the maintenance of atmospheric gas equilibrium. Photosynthetic microorganisms function as the main primary producers in the most extreme polar regions (Borowitzka et al., 2016; Pichrtová et al., 2020). This investigation corroborates preceding discoveries related to the community compositions of algae and cyanobacteria in analogous biocrusts present in polar or alpine environments, as detected through light microscopy (Čapková et al., 2016; Weber et al., 2016; Borchhardt et al., 2017b,a) or examined using molecular data (Rippin et al., 2018a,b; Pushkareva et al., 2024a). The diversity of microbial phototrophs in polar regions may be influenced by various environmental factors. For instance, the composition appears to be affected by the altitudinal gradient (Kotas et al., 2018), and different substrate types or snow cover dynamics further support distinct microbial communities (Zinger et al., 2009; Savaglia et al., 2024). However, the investigated sites did not differ in terms of community composition, and the bedrock and soil composition, such as sandstones and siltstones, and soil types of silt loam and loam were relatively similar; the slight differences observed in species diversity may reflect subtle adaptations to local environmental conditions.
Detected eukaryotic algae, according to molecular analyses, mainly belong to the Trebouxiophyceae and Chlorophyceae groups, which appear to be typical inhabitants of biocrusts in Svalbard (Borchhardt et al., 2017a; Rippin et al., 2018a). Interestingly, the same dominant groups are reported from Maritime Antarctica, where, in contrast, an abundance of Ulvophyceae (Pushkareva et al., 2024a) and Bacillariophyceae (Borchhardt et al., 2017b) are reported. However, several Icelandic biocrusts also showed even higher volumes of algae and a dominance of diatoms according to biovolume data (Pushkareva et al., 2021).
While the majority of microalgal taxa identified in polar biocrusts are presumed to be chloroplast-bearing and photosynthetically active, we acknowledge the presence of a few groups that may lack functional plastids. Based on current literature, the occurrence of chloroplast-lacking representatives in polar biocrusts appears limited. Nonetheless, some non-photosynthetic chrysophytes have been reported in polar soils. For instance, Spumella was found in all samples analyzed by Rippin et al. (2018b), marking the first such observation in polar biocrusts. In our dataset, we also detected several non-photosynthetic chrysophytes: Oikomonas was present in one out of 15 samples (maximum of two reads, < 1% of algal reads), Paraphysomonas in three samples (maximum of five reads, < 3%), and Spumella in nine samples (0–6 reads, < 4%). These taxa are known to be heterotrophic and plastid-lacking or to possess highly reduced plastids. Their low read abundance in our samples suggests that, while present, their contribution to phototrophic processes in biocrusts is likely minimal.
The cyanobacterial community data indicated a prevalence of filamentous groups belonging to the Nostocales, Pseudanabaenales, and Oscillatoriales, which is consistent with earlier findings from Arctic and Antarctic biocrusts (Rippin et al., 2018b; Pushkareva et al., 2024a). Filamentous cyanobacteria represent a characteristic group inhabiting polar terrestrial environments, showing high resistance to stressful conditions such as freezing or desiccation (Davey, 1989; Hawes, 1992; Šabacká and Elster, 2006; Tashyreva and Elster, 2016).
4.3 Photosynthetic activity
In this study, the photosynthetic activity of biological soil crust in the High Arctic was evaluated using variable chlorophyll fluorescence measurement techniques, which are widely used for the evaluation of various stress and stress tolerance determinations of plants and microalgae (Büchel and Wilhelm, 1993; Maxwell and Johnson, 2000; Consalvey et al., 2005; Yadav et al., 2023). Our observations confirmed diel periodical changes in photosynthetic activity, which is in agreement with previous findings measured on algal communities (Kvíderová et al., 2019), lichens (Sehnal et al., 2014), and even biocrusts in the Arctic (Sehnal et al., 2014; Pushkareva et al., 2017) or other arid and semi-arid temperate regions (Lan et al., 2012; Wu et al., 2013). However, a detailed comparison of the FV/FM values could be complicated by different approaches in studies. First of all, FV/FM was measured on biocrusts after 15 min of dark acclimation, but in other studies, the parameter could also be measured after shorter acclimation (e.g., only 8 min) (Wu et al., 2013), longer (more than 20 min) (Lan et al., 2012) or even without any dark acclimation, presented as the effective quantum yield ΦPSII (Sehnal et al., 2014), depending on research tasks, experimental design, fluorescence measurement protocol used and evaluated organisms/consortia. However, from a comparison between 15-min dark acclimated FV/FM and ΦPSII values without dark acclimation, the results showed a strong positive correlation (Pushkareva et al., 2017).
More than the duration of the dark adaptation period, the FV/FM could be affected by stresses encountered in situ. Previous studies have shown that a decrease in photosynthetic activity can result from damage to the photosynthetic apparatus caused by freezing, irradiance, and/or desiccation (Davey, 1989; Hawes, 1992; Remias et al., 2018; Yoshida et al., 2020). The highest observed FV/FM value in our measurements was 0.63, which is much higher than the highest value of 0.47 measured previously in a similar type of Svalbard biocrust from Petunia Bay in Svalbard (Pushkareva et al., 2017) and slightly lower than the 0.7 reached in another similar study conducted idem (Sehnal et al., 2014), indicating relatively good physiological performance at all sites in summer. Surprisingly, similar values were detected even at Site 1 in early October 2022 when the environmental conditions were deteriorating, indicating a good physiological state of photosynthetic microorganisms at near-zero temperatures and in low light. Contrary, in late October 2023, the stress conditions were more severe and led to a significant decrease in FV/FM. Regardless of the different FV/FM values in autumn in both years, the rETRmax was greatly reduced due to extremely low light conditions. Furthermore, a relation to water availability was previously suggested (Sehnal et al., 2014). However, in our study, the influence of relative humidity could not be confirmed due to the small number of available data. Temperature has also been reported to play a role in cold environments. The increase in temperature caused a decrease in quantum yields in biocrusts (Sehnal et al., 2014; Pushkareva et al., 2017) and minor effects of temperature were reported from tidal flats dominated by Vaucheria sp. (Kvíderová et al., 2019). However, in this study, FV/FM and temperature significantly correlated only at Site 1. Interestingly, the highest mean values of FV/FM were observed at the beginning of October, which is in agreement with the temperature and irradiance influence mentioned above. Detailed measurements focused on estimating the compensation irradiance, i.e., when photosynthesis is equal to respiration, should be performed to determine if the actual irradiance is sufficient for net primary production. Therefore, photophysiological data can provide valuable insights into the tolerance limits of algae and could be used for better predictions of primary productivity in polar ecosystems.
Above abiotic conditions, the results could depend on dominant organisms. The measured maxima among different unstressed groups of algae vary: for example, diatoms reached 0.6 while the chlorophyte maximum was 0.8 (Büchel and Wilhelm, 1993). Since the polar biological crusts are not homogeneous due to different nanoclimatic, edaphic, and orographic conditions, there should be spots with different prevailing microorganisms. Considering the signal integration from the whole during the fluorometer measurements, FV/FM could be lower due to the inclusion of cyanobacteria-rich crusts or non-photosynthetic areas like bare soil. Fluorescence imaging cameras should reveal this hidden physiological variability, and multispectral/hyperspectral images could be used for the determination of the crust types (e.g., Rodríguez-Caballero et al., 2014). Furthermore, it has been suggested in the literature that the increase in photosynthetic activity in biocrusts could be related to the level of succession (Gypser et al., 2016; Pushkareva et al., 2017).
The selected OJIP parameters responded to seasonal changes. In mild conditions, the parameters related to photochemical quenching increased. In more stressful conditions, the parameters reflecting non-photochemical energy dissipation rose, reflecting thus damage to the photosynthetic apparatus and an increased need to get rid of the excess of light energy (Roháček et al., 2008). The decreased number of active reaction centers led to increased energy fluxes in less favorable conditions. It has previously been shown that the diurnal courses of some OJIP parameters (mostly fluxes per active reaction centers) significantly correlated with temperature and varied between different types of biocrusts (Pushkareva et al., 2017). This agrees with the results of ordination analyses in this study, where site appeared to be the most influential.
For both seasons of the year, photosynthetic activity mostly followed the irradiance changes, to which FV/FM negatively and rETRmax positively correlated. In the summer cycles, the maximum FV/FM was observed around midnight and the “night” hours when lower irradiances were encountered, while the maximum rETRmax was detected around noon and “day” hours, potentially indicating only low photoinhibition. Such midday depression of FV/FM or ΦPSII was also previously detected in polar (Sehnal et al., 2014; Pushkareva et al., 2017) and temperate desert biocrusts (Lan et al., 2012; Wu et al., 2013), but this depression does not always lead to a reduction in photosynthetic performance in mid-day or early afternoon, which was observed by biocrusts (Pushkareva et al., 2017).
4.4 Recovery of photosynthetic activity after winter biocrust thawing
The rapid increase in quantum yield observed in thawed biocrusts during the winter season indicates that they possess the capacity to restore photosynthetic activity at a rapid rate following the attainment of optimal environmental conditions. Similarly, it has previously been reported that polar cryptogams (mosses and lichens) can recover their photosynthetic activity in a matter of minutes or hours (Schlensog et al., 2004). The rapid recovery of photosynthetic activity is probably crucial for survival in unstable polar environments.
Surprisingly, the results of photosynthetic activity measured in late October (23/10/2023) indicated biocrust activity even at subzero temperatures. The values were naturally low due to the stressful conditions typical of the Arctic autumn environment. However, differences in the daily cycle remained evident. Cyanobacteria and algae have already been shown to perform photosynthetic activity at temperatures down to −7 °C (Davey, 1989), and general soil respiration activity has been evidenced at −12 °C (Elberling, 2007). Polar cryptogams, such as lichens, have been demonstrated to retain their activity at subzero temperatures (Kappen et al., 1996; Hájek et al., 2016, 2021; Barták et al., 2021), even at −17 °C (Kappen et al., 1996). However, the spring and autumn months are likely to be the most significant periods for their primary production (Schroeter et al., 1995), given that their continued existence is contingent upon water availability (Kappen et al., 1990; Hovenden et al., 1994; Laguna-Defior et al., 2016). Vascular plants at high latitudes exhibit high freezing tolerance; however, in contrast, they are not actively photosynthesizing during the winter, resulting in a relatively short vegetative season (Kappen, 1993; Laurila et al., 2001; Arndal et al., 2009). Although polar biocrusts exhibit lower photosynthetic rates compared to vascular plants, they may benefit from a more consistent water supply from the soil, in contrast to lichens. This, together with their ability to quickly restore photosynthetic activity, allows them to serve as crucial contributors to carbon fixation during periods of inactivity for other organisms, thus underscoring their role within polar ecosystems.
4.5 Photosynthesis-related genes
Data for photosynthesis-related transcripts indicate that photosynthesis-related genes are expressed in biocrusts throughout the year, even in March. This suggests that biocrusts are always ready to engage in photosynthetic activity, even during the winter months, although at reduced levels compared to other seasons. The results are also consistent with the photosynthetic activity observed in the biocrusts during the autumn monitoring period and immediately after thawing in the winter experiment. In winter, photosynthesis was probably driven by the availability of ambient light during the sampling process, which appeared sufficient to stimulate metabolic processes despite extreme cold. In fact, the soil samples taken during the sampling period were frozen. Therefore, the observed transcriptome probably reflects the levels present when the biocrust samples were last frozen before March. It should be noted that the microbial communities within these biocrusts have been shown to be permanently well prepared to cope with the extreme environment of the Arctic (Pushkareva et al., 2024b). To investigate this further, we employed the cold shock marker Cor413pm1 (Hu et al., 2021), which we could detect in all samples. No significant changes in the expression levels among sites or seasons were observed in biocrusts, supporting the earlier results of Pushkareva et al. (2024b). However, a closer look at the metatranscriptomic data revealed that the biocrusts still needed to acclimate to the different seasons and locations. The expression levels of PsbA and RbcS changed dramatically, especially in the March samples, suggesting strong photoinhibition by photodamage that led to increased PsbA turnover (Andersson and Aro, 2001; Mulo et al., 2012), which is reflected in our transcriptomic data. In Chlamydomonas, acclimation to high light suppressed RbcL expression temporarily (Shapira et al., 1997), suggesting that the observed decrease of RbcS might be due to acclimation to light. The need to acclimate to light during winter is also supported by the seasonal regulation of Ohp1 and ELIP proteins, which have been shown to be important during light acclimation (Adamska, 1997; Jansson et al., 2000). Why other proteins of PSII also show differential gene expression related to site and season is currently not clear. Clearly, more studies on this interesting phenomenon are needed to solve these questions.
4.6 Photosynthetic activity and gene expression
The variable chlorophyll fluorescence originates predominantly in PSII (Krause and Weis, 1991). Therefore, any changes in PSII function or structure could be reflected in the fluorescence signal, and vice versa, changes in fluorescence parameters could precede any observable damage and/or stress response (Solovchenko et al., 2022). The summer season should be less stressful than winter; therefore, increased photochemical quenching, reflected especially by an increase in FV/FM and φET2o should be expected. Since summer is also the main growth season in the Polar Regions, there is a high demand for the synthesis of new PSIIs as well. Indeed, higher FV/FM and φET2o were observed in summer, especially in August 2022, accompanied by high levels of transcripts for PSII core proteins PsbD, PsbC, and PsbB, the majority of minor subunits, oxygen-evolving complex proteins, and light-harvesting complex proteins. In more stressful conditions, in autumn and winter, and to some extent even in August 2023, increased non-photochemical quenching expressed as φDo, and hence a decline in photochemical quenching, indicating stress conditions, was observed. Increased PsbA expression, indicating rapid protein turnover due to its damage, was detected as well (Giardi et al., 1997). Increased expression of PsbS, a small PSII subunit participating in non-photochemical quenching (Morosinotto and Bassi, 2014), and PsbX, involved in the binding and/or turnover of quinones at the QB site of PSII to maintain efficient electron transport, also confirmed stress conditions (Biswas and Eaton-Rye, 2022). Although electron transport remains functional even in sub-zero temperatures (Davey, 1989), low temperatures lead to a delay in the rates of electron transfer in PSII, resulting in photooxidative damage (Pospíšil, 2016). A high amount of PsbA transcripts was indeed detected (see discussion above), and in the case of fluorescence parameters, low FV/FM and φET2o together with increased φDo, should be observed. The VJ should be increased due to the delay in electron transport to QB, and the time to reach maximum fluorescence should be longer. More detailed fluorescence protocols, including quenching analysis and rapid light curves, should be implemented together with transcriptome analysis to reveal the interplay between energetic metabolism and gene expression, especially in extreme conditions.
5 Conclusion
The findings of this study indicate that diurnal variation in the photosynthetic activity of biological soil crusts at three sites, which exhibited a relatively comparable microbial phototrophic composition, is mainly influenced by irradiance during the summer and autumn seasons of 2022–2023. No significant differences were observed in the diurnal variation of photosynthetic activity between the sites. Of particular interest is the markedly elevated level of activity observed in the initial days of October 2022, which persisted at temperatures below zero in the latter days of October 2023. Furthermore, winter-thawed biocrusts exhibited the capacity to restore photosynthesis rapidly following thawing. These findings are also supported by the metagenomic and metatranscriptomic data of microbial phototrophs and photosynthesis-related genes and provide valuable information on the behavior of the studied organisms and emphasize the importance of environmental factors such as temperature and irradiance in influencing their activity levels.
Data availability statement
The original contributions presented in the study are included in the article/Supplementary material, further inquiries can be directed to the corresponding author.
Author contributions
EH: Data curation, Formal analysis, Investigation, Methodology, Visualization, Writing – original draft, Writing – review & editing, Project administration. EP: Formal analysis, Investigation, Methodology, Writing – review & editing. JK: Methodology, Visualization, Writing – review & editing. BB: Conceptualization, Funding acquisition, Methodology, Writing – review & editing. JE: Conceptualization, Funding acquisition, Methodology, Writing – review & editing.
Funding
The author(s) declare that financial support was received for the research and/or publication of this article. The project was supported by the Grant Agency of the Czech Republic (22-08680L), the Institute of Botany of the Czech Academy of Sciences (RVO67985939), the Charles University Research Centre program (UNCE/24/SCI/006), and by the German Research Foundation (BE1779/25).
Acknowledgments
The authors would like to thank the Czech Arctic Research Station of the University of South Bohemia in České Budějovice for providing their facilities in Svalbard. Alžběta Paterová, Elisa Frank, Anastasiia Kolomiiets, Oleksandr Bren, and Paul Geroldinger are acknowledged for field assistance, and Viktorie Brožová for help with the determination of vegetation. Jana Kvíderová is grateful for support from the University of West Bohemia. Tyler J. Kohler is thanked for proofreading the manuscript.
Conflict of interest
The authors declare that the research was conducted in the absence of any commercial or financial relationships that could be construed as a potential conflict of interest.
Generative AI statement
The author(s) declare that no Gen AI was used in the creation of this manuscript.
Any alternative text (alt text) provided alongside figures in this article has been generated by Frontiers with the support of artificial intelligence and reasonable efforts have been made to ensure accuracy, including review by the authors wherever possible. If you identify any issues, please contact us.
Publisher's note
All claims expressed in this article are solely those of the authors and do not necessarily represent those of their affiliated organizations, or those of the publisher, the editors and the reviewers. Any product that may be evaluated in this article, or claim that may be made by its manufacturer, is not guaranteed or endorsed by the publisher.
Supplementary material
The Supplementary Material for this article can be found online at: https://www.frontiersin.org/articles/10.3389/fmicb.2025.1684649/full#supplementary-material
References
Adamska, I. (1997). ELIPs – light-induced stress proteins. Physiol. Plant. 100, 794–805. doi: 10.1111/j.1399-3054.1997.tb00006.x
Andersson, B., and Aro, E.-M. (2001). “Photodamage and D1 protein turnover in photosystem II,” in Regulation of Photosynthesis. Advances in Photosynthesis and Respiration, eds. E.-M. Aro and B. Andersson (Dordrecht: Springer), 377–393. doi: 10.1007/0-306-48148-0_22
Aransiola, S. A., Atta, H. I., and Maddela, N. R. (2024). Soil Microbiome in Green Technology Sustainability. Cham: Springer.
Arndal, M., Illeris, L., Michelsen, A., Albert, K., Tamstorf, M., Hansen, B., et al. (2009). Seasonal variation in gross ecosystem production, plant biomass, and carbon and nitrogen pools in five high arctic vegetation types. Arct. Antarct. Alp. Res. 41, 164–173. doi: 10.1657/1938-4246-41.2.164
Bååth, E., and Kritzberg, E. S. (2024). Temperature adaptation of aquatic bacterial community growth is faster in response to rising than to falling temperature. Microb. Ecol. 87. doi: 10.1007/s00248-024-02353-8
Barták, M., Hájek, J., Orekhova, A., Villagra, J., Marín, C., Palfner, G., et al. (2021). Inhibition of primary photosynthesis in desiccating antarctic lichens differing in their photobionts, thallus morphology, and spectral properties. Microorganisms 9:818. doi: 10.3390/microorganisms9040818
Belnap, J., and Lange, O. L. (2003). Biological Soil Crusts: Structure, Function, and Management. Cham: Springer. doi: 10.1007/978-3-642-56475-8
Biswas, S., and Eaton-Rye, J. J. (2022). PsbX maintains efficient electron transport in Photosystem II and reduces susceptibility to high light in Synechocystis sp. PCC 6803. Biochim. Biophys. Acta Bioenerg. 1863:148519. doi: 10.1016/j.bbabio.2021.148519
Borchhardt, N., Baum, C., Mikhailyuk, T., and Karsten, U. (2017a). Biological soil crusts of Arctic Svalbard - water availability as potential controlling factor for microalgal biodiversity. Front. Microbiol. 8:1485. doi: 10.3389/fmicb.2017.01485
Borchhardt, N., Schiefelbein, U., Abarca, N., Boy, J., Mikhailyuk, T., Sipman, H. J. M., et al. (2017b). Diversity of algae and lichens in biological soil crusts of Ardley and King George islands, Antarctica. Antarct. Sci. 29, 229–237. doi: 10.1017/S0954102016000638
Borowitzka, M. A., Beardall, J., and Raven, J. A. (2016). The Physiology of Microalgae. Cham: Springer. doi: 10.1007/978-3-319-24945-2
Bowker, M. A., Belnap, J., Bala Chaudhary, V., and Johnson, N. C. (2008). Revisiting classic water erosion models in drylands: the strong impact of biological soil crusts. Soil Biol. Biochem. 40, 2309–2316. doi: 10.1016/j.soilbio.2008.05.008
Bu, C., Wu, S., and Yang, K. (2014). Effects of physical soil crusts on infiltration and splash erosion in three typical Chinese soils. Int. J. Sediment Res. 29, 491–501. doi: 10.1016/S1001-6279(14)60062-7
Büchel, C., and Wilhelm, C. (1993). In vivo analysis of slow chlorophyll fluorescence induction kinetics in algae: progress, problems and perspectives. Photochem. Photobiol. 58, 137–148. doi: 10.1111/j.1751-1097.1993.tb04915.x
Čapková, K., Hauer, T., Reháková, K., and DoleŽal, J. (2016). Some like it high! Phylogenetic diversity of high-elevation cyanobacterial community from biological soil crusts of Western Himalaya. Microb. Ecol. 71, 113–123. doi: 10.1007/s00248-015-0694-4
Consalvey, M., Perkins, R. G., Paterson, D. M., and Underwood, G. J. C. (2005). PAM fluorescence: a beginners guide for benthic diatomists. Diatom Res. 20, 1–22. doi: 10.1080/0269249X.2005.9705619
Dallmann, W., Kjærnet, T., and Nøttvedt, A. (2001). Geological Map of Svalbard 1:100000 Sheet C9G Adventdalen. Geological Map of Svalbard. Tromsø: Norwegien Polar Institute.
Davey, M. C. (1989). The effects of freezing and desiccation on photosynthesis and survival of terrestrial Antarctic algae and cyanobacteria. Polar Biol. 10, 29–36. doi: 10.1007/BF00238287
Davey, M. C., Pickup, J., and Block, W. (1992). Temperature variation and its biological significance in fellfield habitats on a maritime Antarctic island. Antarct. Sci. 4, 383–388. doi: 10.1017/S0954102092000567
De Maayer, P., Anderson, D., Cary, C., and Cowan, D. A. (2014). Some like it cold: understanding the survival strategies of psychrophiles. EMBO Rep. 15, 508–517. doi: 10.1002/embr.201338170
Elberling, B. (2007). Annual soil CO2 effluxes in the High Arctic: the role of snow thickness and vegetation type. Soil Biol. Biochem. 39, 646–654. doi: 10.1016/j.soilbio.2006.09.017
Elster, J., Degma, P., Kováčik, L., Valentová, L., Šramková, K., Batista Pereira, A., et al. (2008). Freezing and desiccation injury resistance in the filamentous green alga Klebsormidium from the Antarctic, Arctic and Slovakia. Biologia 63, 843–851. doi: 10.2478/s11756-008-0111-2
Evans, R. D., and Johansen, J. R. (1999). Microbiotic crusts and ecosystem processes. CRC Crit. Rev. Plant Sci. 18, 183–225. doi: 10.1080/07352689991309199
Fahnestock, J. T., Jones, M. H., Brooks, P. D., Walker, D. A., and Welker, J. M. (1998). Winter and early spring CO2 efflux from tundra communities of northern Alaska. J. Geophys. Res.-Atmos. 103, 29023–29027. doi: 10.1029/98JD00805
Førland, E. J., Hanssen-Bauer, I., and Nordli, P. Ø. (1997). Climate statistics and longterm series of temperature and precipitation at Svalbard and Jan Mayen. DNMI Klima 21:73. doi: 10.2166/nh.1997.0002
Gharemahmudli, S., Sadeghi, S. H., and Najafinejad, A. (2024). The potential of soil endemic microorganisms in ameliorating the physicochemical properties of soil subjected to a freeze-thaw cycle. Pedobiologia 106:150988. doi: 10.1016/j.pedobi.2024.150988
Giardi, M. T., Masojídek, J., and Godde, D. (1997). Effects of abiotic stresses on the turnover of the D1 reaction centre II protein. Physiol. Plant. 101, 635–642. doi: 10.1111/j.1399-3054.1997.tb01048.x
Götz, S., García-Gómez, J. M., Terol, J., Williams, T. D., Nagaraj, S. H., Nueda, M. J., et al. (2008). High-throughput functional annotation and data mining with the Blast2GO suite. Nucleic Acids Res. 36, 3420–3435. doi: 10.1093/nar/gkn176
Gypser, S., Herppich, W. B., Fischer, T., Lange, P., and Veste, M. (2016). Photosynthetic characteristics and their spatial variance on biological soil crusts covering initial soils of post-mining sites in Lower Lusatia, NE Germany. Flora: Morphol. Distrib. Funct. Ecol. Plants 220, 103–116. doi: 10.1016/j.flora.2016.02.012
Hájek, J., Barták, M., Hazdrová, J., and Forbelská, M. (2016). Sensitivity of photosynthetic processes to freezing temperature in extremophilic lichens evaluated by linear cooling and chlorophyll fluorescence. Cryobiology 73, 329–334. doi: 10.1016/j.cryobiol.2016.10.002
Hájek, J., Hojdová, A., Trnková, K., Váczi, P., Bednaríková, M., Barták, M., et al. (2021). Responses of thallus anatomy and chlorophyll fluorescence-based photosynthetic characteristics of two antarctic species of genus usnea to low temperature. Photosynthetica 59, 95–105. doi: 10.32615/ps.2021.002
Hawes, I. (1990). Effects of freezing and thawing on a species of Zygnema (Chlorophyta) from the Antarctic. Phycologia 29:326–31. doi: 10.2216/i0031-8884-29-3-326.1
Hejduková, E., Elster, J., and Nedbalová, L. (2020). Annual cycle of freshwater diatoms in the High Arctic revealed by multiparameter fluorescent staining. Microb. Ecol. 80, 559–572. doi: 10.1007/s00248-020-01521-w
Hejduková, E., Kollár, J., and Nedbalová, L. (2024). Freezing stress tolerance of benthic freshwater diatoms from the genus Pinnularia: comparison of strains from polar, alpine, and temperate habitats. J. Phycol. 60, 1105–1120. doi: 10.1111/jpy.13486
Hejduková, E., and Nedbalová, L. (2021). Experimental freezing of freshwater pennate diatoms from polar habitats. Protoplasma 258, 1213–1229. doi: 10.1007/s00709-021-01648-8
Hejduková, E., Pinseel, E., Vanormelingen, P., Nedbalová, L., Elster, J., Vyverman, W., et al. (2019). Tolerance of pennate diatoms (Bacillariophyceae) to experimental freezing: comparison of polar and temperate strains. Phycologia 58, 382–392. doi: 10.1080/00318884.2019.1591835
Holzinger, A., Albert, A., Aigner, S., Uhl, J., Schmitt-Kopplin, P., Trumhová, K., et al. (2018). Arctic, Antarctic, and temperate green algae Zygnema spp. under UV-B stress: vegetative cells perform better than pre-akinetes. Protoplasma 255, 1239–1252. doi: 10.1007/s00709-018-1225-1
Hovenden, M. J., Jackson, A. E., and Seppelt, R. D. (1994). Field photosynthetic activity of lichens in the Windmill Islands oasis, Wilkes Land, continental Antarctica. Physiol. Plant. 90, 567–576. doi: 10.1111/j.1399-3054.1994.tb08816.x
Hu, X., Liu, J., Liu, E., Qiao, K., Gong, S., Wang, J., et al. (2021). Arabidopsis cold-regulated plasma membrane protein Cor413pm1 is a regulator of ABA response. Biochem. Biophys. Res. Commun. 561, 88–92. doi: 10.1016/j.bbrc.2021.05.032
Huntington, H., Weller, G., Bush, E., Callaghan, T. V., Kattsov, V. M., Nuttall, M., et al. (2005). “Arctic climate: past and present,” in Arctic Climate Impact Assessment, eds C. Symon, L. Arris, and B. Heal (New York, NY: Cambridge University Press), 21–60
Jansson, S., Andersson, J., Kim, S. J., and Jackowski, G. (2000). An Arabidopsis thaliana protein homologous to cyanobacterial high-light-inducible proteins. Plant Mol. Biol. 42, 345–351. doi: 10.1023/A:1006365213954
Joseph, J., and Ray, J. G. (2024). A critical review of soil algae as a crucial soil biological component of high ecological and economic significance. J. Phycol. 60, 229–253. doi: 10.1111/jpy.13444
Kappen, L. (1993). Plant activity under snow and ice, with particular reference to lichens. Arctic 46, 297–302. doi: 10.14430/arctic1356
Kappen, L., Meyer, M., and Bölter, M. (1990). Ecological and physiological investigations in continental antarctic cryptogams. Flora 184, 209–220. doi: 10.1016/S0367-2530(17)31612-2
Kappen, L., Schroeter, B., Scheidegger, C., Sommerkorn, M., and Hestmark, G. (1996). Cold resistance and metabolic activity of lichens below 0°C. Adv. Space Res. 18, 119–128. doi: 10.1016/0273-1177(96)00007-5
Karsten, U., and Holzinger, A. (2012). Light, temperature, and desiccation effects on photosynthetic activity, and drought-induced ultrastructural changes in the green alga Klebsormidium dissectum (Streptophyta) from a high alpine soil crust. Microb. Ecol. 63, 51–63. doi: 10.1007/s00248-011-9924-6
Karsten, U., Lütz, C., and Holzinger, A. (2010). Ecophysiological performance of the aeroterrestrial green alga Klebsormidium crenulatum (Klebsormidiophyceae, Streptophyta) isolated from an alpine soil crust with an emphasis on desiccation stress. J. Phycol. 46, 1187–1197. doi: 10.1111/j.1529-8817.2010.00921.x
Kopylova, E., Noé, L., and Touzet, H. (2012). SortMeRNA: fast and accurate filtering of ribosomal RNAs in metatranscriptomic data. Bioinformatics 28, 3211–3217. doi: 10.1093/bioinformatics/bts611
Kotas, P., Šantručková, H., Elster, J., and Kaštovská, E. (2018). Soil microbial biomass, activity and community composition along altitudinal gradients in the High Arctic (Billefjorden, Svalbard). Biogeosciences 15, 1879–1894. doi: 10.5194/bg-15-1879-2018
Krause, G. H., and Weis, E. (1991). Chlorophyll fluorescence and photosynthesis: the basics. Annu. Rev. Plant Physiol. Plant Mol. Biol. 42, 313–349. doi: 10.1146/annurev.pp.42.060191.001525
Kvíderová, J., Souquieres, C. E., and Elster, J. (2019). Ecophysiology of photosynthesis of Vaucheria sp. mats in a Svalbard tidal flat. Polar Sci. 21, 172–185. doi: 10.1016/j.polar.2018.11.006
Laguna-Defior, C., Pintado, A., Green, T. G. A., Blanquer, J. M., and Sancho, L. G. (2016). Distributional and ecophysiological study on the Antarctic lichens species pair Usnea antarctica/Usnea aurantiaco-atra. Polar Biol. 39, 1183–1195. doi: 10.1007/s00300-015-1832-7
Lan, S., Wu, L., Zhang, D., and Hu, C. (2012). Composition of photosynthetic organisms and diurnal changes of photosynthetic efficiency in algae and moss crusts. Plant Soil 351, 325–336. doi: 10.1007/s11104-011-0966-9
Láska, K., Witoszová, D., and Prošek, P. (2012). Weather patterns of the coastal zone of Petuniabukta, central Spitsbergen in the period 2008–2010. Pol. Polar Res. 33, 297–318. doi: 10.2478/v10183-012-0025-0
Laurila, T., Soegaard, H., Lloyd, C. R., Aurela, M., Tuovinen, J. P., Nordstroem, C., et al. (2001). Seasonal variations of net CO2 exchange in European Arctic ecosystems. Theor. Appl. Climatol. 70, 183–201. doi: 10.1007/s007040170014
Li, B., and Dewey, C. N. (2011). RSEM: Accurate transcript quantification from RNA-Seq data with or without a reference genome. BMC Bioinformatics 12, 1–16. doi: 10.1186/1471-2105-12-323
Li, D., Liu, C.-M., Luo, R., Sadakane, K., and Lam, T.-W. (2015). MEGAHIT: an ultra-fast single-node solution for large and complex metagenomics assembly via succinct de Bruijn graph. Bioinformatics 31, 1674–1676. doi: 10.1093/bioinformatics/btv033
Lichner, L., Hallett, P. D., Drongová, Z., Czachor, H., Kovacik, L., Mataix-Solera, J., et al. (2013). Algae influence the hydrophysical parameters of a sandy soil. Catena 108, 58–68. doi: 10.1016/j.catena.2012.02.016
Maxwell, K., and Johnson, G. N. (2000). Chlorophyll fluorescence – a practical guide. J. Exp. Bot. 51, 659–668. doi: 10.1093/jexbot/51.345.659
Meredith, M., Mackintosh, A., Melbourne-Thomas, J., Muelbert, M. M. C., Ottersen, G., Pritchard, H., et al. (2019). “Polar regions,” in The Ocean and Cryosphere in a Changing Climate, eds. H.-O. Pörtner, D. C. Roberts, V. Masson-Delmotte, P. Zhai, M. Tignor, E. Poloczanska, K. Mintenbeck, A. Alegría, M. Nicolai, A. Okem, J. Petzold, B. Rama, and N. M. Weyer (Monaco: Intergovernmental Panel on Climate Change), 203–320.
Morgan-Kiss, R. M., Priscu, J. C., Pocock, T., Gudynaite-Savitch, L., and Huner, N. P. A. (2006). Adaptation and acclimation of photosynthetic microorganisms to permanently cold environments. Microbiol. Mol. Biol. Rev. 70, 222–252. doi: 10.1128/MMBR.70.1.222-252.2006
Morgner, E., Elberling, B., Strebel, D., and Cooper, E. J. (2010). The importance of winter in annual ecosystem respiration in the High Arctic: effects of snow depth in two vegetation types. Polar Res. 29, 58–74. doi: 10.1111/j.1751-8369.2010.00151.x
Morosinotto, T., and Bassi, R. (2014). “Molecular mechanisms for activation of non-photochemical fluorescence quenching: from unicellular algae to mosses and higher plants,” in Non-Photochemical Quenching and Energy Dissipation in Plants, Algae and Cyanobacteria, eds. B. Demmig-Adams, G. Garab, W. Adams III, and Govindjee (Dordrecht: Springer), 315–331. doi: 10.1007/978-94-017-9032-1_14
Mulo, P., Sakurai, I., and Aro, E. M. (2012). Strategies for psbA gene expression in cyanobacteria, green algae and higher plants: from transcription to PSII repair. Biochim. Biophys. Acta Bioenerg. 1817, 247–257. doi: 10.1016/j.bbabio.2011.04.011
Norwegian Meteorological Institute (2023). Observations and Weather Statistics. Available online at: https://seklima.met.no/observations/ (accessed January 10, 2022).
Norwegian Polar Institute (2014). Kartdata Svalbard 1:250 000 (S250 Kartdata). Available online at: https://data.npolar.no/dataset/ (accessed October 10, 2019)
Peel, M. C., Finlayson, B. L., and McMahon, T. A. (2007). Updated world map of the Köppen-Geiger climate classification. Hydrol. Earth Syst. Sci. 4, 439–473. doi: 10.5194/hess-11-1633-2007
Pessi, I. S., Pushkareva, E., Lara, Y., Borderie, F., Wilmotte, A., Elster, J., et al. (2019). Marked succession of cyanobacterial communities following glacier retreat in the High Arctic. Microb. Ecol. 77, 136–147. doi: 10.1007/s00248-018-1203-3
Pichrtová, M., Hájek, T., and Elster, J. (2016). Annual development of mat-forming conjugating green algae Zygnema spp. in hydro-terrestrial habitats in the Arctic. Polar Biol. 39, 1653–1662. doi: 10.1007/s00300-016-1889-y
Pichrtová, M., Hejduková, E., Nedbalová, L., and Elster, J. (2020). “How to survive winter? adaptation and acclimation strategies of eukaryotic algae in polar terrestrial ecosystems,” in Life in Extreme Environments: Insights in Biological Capability, eds. G. di Prisco, H. G. Edwards, J. Elster, and A. H. Huiskes (Cambridge: Cambridge University Press), 101–125. doi: 10.1017/9781108683319.008
Piepjohn, K., Stange, R., Jochmann, M., and Hübner, C. (2012). The Geology of Longyearbyen. Longyearbyen: Longyearbyen feltbiologiske forening.
Pospíšil, P. (2016). Production of reactive oxygen species by photosystem II as a response to light and temperature stress. Front. Plant Sci. 7, 1–12. doi: 10.3389/fpls.2016.01950
Pushkareva, E., Baumann, K., Van, A. T., Mikhailyuk, T., Baum, C., Hrynkiewicz, K., et al. (2021). Diversity of microbial phototrophs and heterotrophs in Icelandic biocrusts and their role in phosphorus-rich Andosols. Geoderma 386:114905. doi: 10.1016/j.geoderma.2020.114905
Pushkareva, E., Elster, J., and Becker, B. (2023). Metagenomic analysis of antarctic biocrusts unveils a rich range of cold-shock proteins. Microorganisms 11, 1–5. doi: 10.3390/microorganisms11081932
Pushkareva, E., Elster, J., Holzinger, A., Niedzwiedz, S., and Becker, B. (2022). Biocrusts from Iceland and Svalbard: does microbial community composition differ substantially? Front. Microbiol. 13:1048522. doi: 10.3389/fmicb.2022.1048522
Pushkareva, E., Elster, J., Kudoh, S., Imura, S., and Becker, B. (2024a). Microbial community composition of terrestrial habitats in East Antarctica with a focus on microphototrophs. Front. Microbiol. 14:1323148. doi: 10.3389/fmicb.2023.1323148
Pushkareva, E., Hejduková, E., Elster, J., and Becker, B. (2024b). Microbial response to seasonal variation in Arctic biocrusts with a focus on fungi and cyanobacteria. Environ. Res. 263:120110. doi: 10.1016/j.envres.2024.120110
Pushkareva, E., Kvíderová, J., Šimek, M., and Elster, J. (2017). Nitrogen fixation and diurnal changes of photosynthetic activity in Arctic soil crusts at different development stage. Eur. J. Soil Biol. 79, 21–30. doi: 10.1016/j.ejsobi.2017.02.002
Pushkareva, E., Pessi, I. S., Wilmotte, A., and Elster, J. (2015). Cyanobacterial community composition in Arctic soil crusts at different stages of development. FEMS Microbiol. Ecol. 91, 1–10. doi: 10.1093/femsec/fiv143
Remias, D., Procházková, L., Holzinger, A., and Nedbalová, L. (2018). Ecology, cytology and phylogeny of the snow alga Scotiella cryophila K-1 (Chlamydomonadales, Chlorophyta) from the Austrian Alps. Phycologia 57, 581–592. doi: 10.2216/18-45.1
Rippin, M., Borchhardt, N., Williams, L., Colesie, C., Jung, P., Büdel, B., et al. (2018a). Genus richness of microalgae and cyanobacteria in biological soil crusts from Svalbard and Livingston Island: morphological versus molecular approaches. Polar Biol. 41, 909–923. doi: 10.1007/s00300-018-2252-2
Rippin, M., Lange, S., Sausen, N., and Becker, B. (2018b). Biodiversity of biological soil crusts from the Polar Regions revealed by metabarcoding. FEMS Microbiol. Ecol. 94, 1–15. doi: 10.1093/femsec/fiy036
Rodríguez-Caballero, E., Escribano, P., and Cantón, Y. (2014). Advanced image processing methods as a tool to map and quantify different types of biological soil crust. ISPRS J. Photogramm. Remote Sens. 90, 59–67. doi: 10.1016/j.isprsjprs.2014.02.002
Roháček, K., Soukupová, J., and Barták, M. (2008). “Chlorophyll fluorescence: a wonderful tool to study plant physiology and plant stress,” in Plant Cell Compartments - Selected Topics, ed. B. Schoefs (Kerala: Research Signpost), 41–104
Šabacká, M., and Elster, J. (2006). Response of cyanobacteria and algae from Antarctic wetland habitats to freezing and desiccation stress. Polar Biol. 30, 31–37. doi: 10.1007/s00300-006-0156-z
Savaglia, V., Lambrechts, S., Tytgat, B., Vanhellemont, Q., Elster, J., Willems, A., et al. (2024). Geology defines microbiome structure and composition in nunataks and valleys of the Sør Rondane Mountains, East Antarctica. Front. Microbiol. 15:1316633. doi: 10.3389/fmicb.2024.1316633
Schlensog, M., Pannewitz, S., Green, T. G. A., and Schroeter, B. (2004). Metabolic recovery of continental antarctic cryptogams after winter. Polar Biol. 27, 399–408. doi: 10.1007/s00300-004-0606-4
Schroeter, B., Olech, M., Kappenld, L., and Heitland, W. (1995). Ecophysiological investigations of Usnea antarctica in the maritime Antarctic. 1. Annual microclimatic conditions and potential primary production. Antarct. Sci. 7, 251–260. doi: 10.1017/S0954102095000356
Sehnal, L., Barták, M., and Váczi, P. (2014). Diurnal changes in photosynthetic activity of the biological soil crust and lichen: effects of abiotic factors (Petuniabukta, Svalbard). Czech Polar Rep. 4, 158–167. doi: 10.5817/CPR2014-2-16
Shapira, M., Lers, A., Heifetz, P. B., Irihimovitz, V., Osmond, C. B., Gillham, N. W., et al. (1997). Differential regulation of chloroplast gene expression in Chlamydomonas reinhardtii during photoacclimation: light stress transiently suppresses synthesis of the Rubisco LSU protein while enhancing synthesis of the PS II D1 protein. Plant Mol. Biol. 33:1001. doi: 10.1023/A:1005814800641
Solovchenko, A., Lukyanov, A., Vasilieva, S., and Lobakova, E. (2022). Chlorophyll fluorescence as a valuable multitool for microalgal biotechnology. Biophys. Rev. 14, 973–983. doi: 10.1007/s12551-022-00951-9
Steven, B., Kuske, C. R., Gallegos-graves, L. V., and Reed, S. C. (2015). Climate change and physical disturbance manipulations result in distinct biological soil crust communities. Appl. Environ. Microbiol. 81, 7448–7459. doi: 10.1128/AEM.01443-15
Stirbet, A., Govindjee, Strasser, B. J., and Strasser, R. J. (1998). Chlorophyll a fluorescence induction in higher plants: modelling and numerical simulation. J. Theor. Biol. 193, 131–151. doi: 10.1006/jtbi.1998.0692
Strasser, R. J., Srivastava, A., and Tsimilli-Michael, M. (2000). “The fluorescence transient as a tool to characterize and screen photosynthetic samples,” in Probing Photosynthesis: Mechanism, Regulation and Adaptation, eds. M. Yunus, U. Pathre, and P. Mohanty (London: Taylor and Francis), 445–483.
Strasser, R. J., Tsimilli-Michael, M., and Srivastava, A. (2004). “Analysis of the chlorophyll a fluorescence transient,” in Chlorophyll a Fluorescence. Advances in Photosynthesis and Respiration, eds. G. C. Papageorgiou, and Govindjee (Dordrecht: Springer), 321–362. doi: 10.1007/978-1-4020-3218-9_12
Tashyreva, D., and Elster, J. (2015). Effect of nitrogen starvation on desiccation tolerance of Arctic Microcoleus strains (cyanobacteria). Front. Microbiol. 6:278. doi: 10.3389/fmicb.2015.00278
Tashyreva, D., and Elster, J. (2016). Annual cycles of two cyanobacterial mat communities in hydro-terrestrial habitats of the High Arctic. Microb. Ecol. 71, 887–900. doi: 10.1007/s00248-016-0732-x
Ter Braak, C. J. F., and Šmilauer, P. (2012). Canoco Reference Manual And User's Guide: Software for Ordination, Version 5.0. Ithaca, NY: Microcomputer Power.
Thomas, D. N., Fogg, G. E., Convey, P., Fritsen, C. H., Gili, J.-M., Gradinger, R., et al. (2008). “Stress, adaptation, and survival in polar regions,” in The Biology of Polar Regions, eds. D. N. Thomas, G. E. Fogg, P. Convey, C. H. Fritsen, J.-M. Gili, R. Gradinger, et al. (New York, NY: Oxford University Press), 28–52. doi: 10.1093/acprof:oso/9780199298112.003.0002
UNIS Weather Stations (2023). Adventdalen Weather Station Datasets. Available online at: https://www.unis.no/resources/weather-stations/ (accessed January 10, 2022).
Weber, B., Belnap, J., Büdel, B., Antoninka, A. J., Barger, N. N., Chaudhary, V. B., et al. (2022). What is a biocrust? A refined, contemporary definition for a broadening research community. Biol. Rev. 97, 1768–1785. doi: 10.1111/brv.12862
Weber, B., Büdel, B., and Belnap, J. (2016). Cyanobacteria and Algae of Biological Soil Crusts: Biological Soil Crusts: An Organizing Principle in Drylands. Cham: Springer. doi: 10.1007/978-3-319-30214-0
Williams, L., Borchhardt, N., Colesie, C., Baum, C., Komsic-Buchmann, K., Rippin, M., et al. (2017). Biological soil crusts of Arctic Svalbard and of Livingston Island, Antarctica. Polar Biol. 40, 399–411. doi: 10.1007/s00300-016-1967-1
Wu, L., Zhang, G., Lan, S., Zhang, D., and Hu, C. (2013). Microstructures and photosynthetic diurnal changes in the different types of lichen soil crusts. Eur. J. Soil Biol. 59, 48–53. doi: 10.1016/j.ejsobi.2013.10.001
Yadav, P., Singh, R. P., Alodaini, H. A., Hatamleh, A. A., Santoyo, G., Kumar, A., et al. (2023). Impact of dehydration on the physiochemical properties of Nostoc calcicola BOT1 and its untargeted metabolic profiling through UHPLC-HRMS. Front. Plant Sci. 14, 1–22. doi: 10.3389/fpls.2023.1147390
Yoshida, K., Seger, A., Kennedy, F., McMinn, A., and Suzuki, K. (2020). Freezing, melting, and light stress on the photophysiology of ice algae: ex situ incubation of the ice algal diatom Fragilariopsis cylindrus (Bacillariophyceae) using an ice tank. J. Phycol. 56, 1323–1338. doi: 10.1111/jpy.13036
Keywords: Arctic, biological soil crust, cyanobacteria, diurnal cycle, microalgae, photosynthetic activity
Citation: Hejduková E, Pushkareva E, Kvíderová J, Becker B and Elster J (2025) Summer and autumn photosynthetic activity in High Arctic biological soil crusts and their winter recovery. Front. Microbiol. 16:1684649. doi: 10.3389/fmicb.2025.1684649
Received: 12 August 2025; Accepted: 31 October 2025;
Published: 26 November 2025.
Edited by:
Edgardo Donati, National University of La Plata, ArgentinaReviewed by:
Angelica Casanova-Katny, Universidad Católica de Temuco, ChileNikita Martynenko, Severtsov Institute of Ecology and Evolution (RAS), Russia
Copyright © 2025 Hejduková, Pushkareva, Kvíderová, Becker and Elster. This is an open-access article distributed under the terms of the Creative Commons Attribution License (CC BY). The use, distribution or reproduction in other forums is permitted, provided the original author(s) and the copyright owner(s) are credited and that the original publication in this journal is cited, in accordance with accepted academic practice. No use, distribution or reproduction is permitted which does not comply with these terms.
*Correspondence: Eva Hejduková, ZXZhLmhlamR1a292YUBuYXR1ci5jdW5pLmN6