 Jean-Jacques Lemaire1*
 Antonio De Salles2Guillaume Coll1Youssef El Ouadih1
 Rémi Chaix1
 Jérôme Coste1
 Franck Durif3Nikos Makris4
 Ron Kikinis4,5,6
- 1Service de Neurochirurgie, CHU Clermont-Ferrand, Université Clermont Auvergne, Centre National de la Recherche Scientifique, Engineering School SIGMA Clermont, Clermont-Ferrand, France
- 2Department of Neurosurgery, Radiation Oncology, HCOR Neuroscience, São Paulo, Brazil
- 3Service de Neurologie, Centre National de la Recherche Scientifique, CHU Clermont-Ferrand, Université Clermont Auvergne, Engineering School SIGMA Clermont, Clermont-Ferrand, France
- 4Surgical Planning Laboratory, Center for Morphometric Analysis, A. Martinos Center for Biomedical Imaging, Harvard Medical School, Massachusetts General Hospital, Brigham and Women's Hospital, Boston, MA, United States
- 5Robert Greenes Distinguished Director of Biomedical Informatics, Brigham and Women's Hospital, Boston, MA, United States
- 6Computer Science Department, Fraunhofer MEVIS, University of Bremen, Bremen, Germany
Mastering detailed anatomy of the human deep brain in clinical neurosciences is challenging. Although numerous pioneering works have gathered a large dataset of structural and topographic information, it is still difficult to transfer this knowledge into practice, even with advanced magnetic resonance imaging techniques. Thus, classical histological atlases continue to be used to identify structures for stereotactic targeting in functional neurosurgery. Physicians mainly use these atlases as a template co-registered with the patient's brain. However, it is possible to directly identify stereotactic targets on MRI scans, enabling personalized targeting. In order to help clinicians directly identify deep brain structures relevant to present and future medical applications, we built a volumetric MRI atlas of the deep brain (MDBA) on a large scale (infra millimetric). Twelve hypothalamic, 39 subthalamic, 36 telencephalic, and 32 thalamic structures were identified, contoured, and labeled. Nineteen coronal, 18 axial, and 15 sagittal MRI plates were created. Although primarily designed for direct labeling, the anatomic space was also subdivided in twelfths of AC-PC distance, leading to proportional scaling in the coronal, axial, and sagittal planes. This extensive work is now available to clinicians and neuroscientists, offering another representation of the human deep brain ([https://hal.archives-ouvertes.fr/] [hal-02116633]). The atlas may also be used by computer scientists who are interested in deciphering the topography of this complex region.
Introduction
The term “deep brain” (DB) describes the combination of subcortical structures including the mesencephalon. It is anatomically a highly complex region with clinical importance in a number of diseases. Several specialized atlases have been created to orient deep brain interventions. The atlases of the human deep brain most used in clinical neurosurgery relies on histological studies (1–4). They are both, anatomic books, and stereotactic atlases. They are co-registerable with patient brains through landmarks; such as the widely used anterior (AC) and posterior (PC) white commissures. Other proportional grid systems derived from landmarks, are also still largely used (5, 6). These atlases provide probabilistic coordinates of structural related functional targets. Rigid registration of an atlas to a patient's brain MRI refines the quality of probabilistic targeting (7). This approach is called indirect stereotactic identification of structures (2), because the structures of interest were not directly visible before the existence of the MRI.
The deep brain geometry limited variability coupled with the relative facility to construct proportional diagrams made the indirect visualization approach used worldwide in stereotactic and functional neurosurgery, including radiosurgery (8). Yet an increasing number of surgical teams transitioned to use both, MRI landmarks and/or directly visualization of targeted structures for implantation of DB stimulation (DBS) (9–15). We proposed direct targeting of pallidal structures visualized on MRI without the use of AC-PC referencing (16), and since used this approach routinely (17).
Recent advances of MRI technologies have resulted in a dramatic increase in both, spatial resolution and contrast resolution, consequently the ability to identify clinically relevant structures in the deep brain. Our group begun to manually segmenting the DB using ex vivo high field MRI in the early 2000's (18). Because of its complex architecture, it took over 10 years to comprehensively label the majority of relevant structures. We reported intermediate stages of this atlas over the years (19–22). Herein we present a clinical MRI Deep Brain Atlas (MDBA) built from a unique anatomic specimen offering for the first time the most advanced version with detailed volumetric representation. Though mainly developed to identify structures of the deep brain on MRI for neurosurgical practices, it also offers to neuroscientists another representation of the topographic organization of the deep brain.
Materials and Methods
Specimen, Raw Image Data, and Initial Contouring of Structures
The brain specimen was obtained from a 65 year-old male subject who died of non-neurological cause. It was studied following our institutional rules and guidelines. After long term fixation in 10% formaldehyde, a block measuring about 60-mm in each direction was scanned at 4.7 Tesla (Bruker, Ettlingen, Germany) with a 3D T1-weighted spin echo sequence (about 14 h of acquisition), resulting in 250 μm isotropic voxels (2563 matrix). The image data was initially manually contoured and labeled using a neurosurgical software (Iplan, BrainLab, Munich, Germany). MRI cartography and labeling relied on the analysis of different signals and patterns of the deep brain structures (19). The signal intensity of a voxel reflects the microarchitecture, i.e., cell density, and anisotropy of bundles of axons (the higher number of anisotropic bundles, the lower signal), as well as the cells contents, notably the ferromagnetic load of neurons (the higher ferromagnetic charge, the lower signal). In addition, at the resolution available in our data set, the common separation of brain tissue into white and gray matters is not binary in the deep brain. For instance, at large scale (centimetric) the thalamus is made of gray matter; at small scale (millimetric) the thalamus is made of gray matter nuclei such as the ventromedial posterior nucleus, of white fascicles such as the mammillothalamic fascicle, and of mixed structures such as intralaminar nuclei or the reticular nucleus crossed by numerous white matter fibers. The cartography was performed structure by structure, starting from the most readily identifiable ones, such as the subthalamic nucleus. In parallel to the progressive mapping of the 4.7-Tesla data set, the updated version was tested in clinical practice for direct targeting in functional neurosurgery as an neuroanatomic aid (23, 24). The different nuclei of the hypothalamus were parcellated into different structures according to proportional topography and structural connectivity (21, 25).
Building of the MRI Deep Brain Atlas
The objects, i.e., the anatomic structures, were exported as surface (stl format) from the surgical software. Surfaces were transformed in binary maps for voxel-based representation and co-registered with a modified MRI data set (Thermo Scientific™ Amira™, v 6.4, Hillsboro, OR, USA). The raw image data set were realigned along AC-PC line, slices being resampled accordingly; leading to a new image data set of 0.125 × 0.125 × 0.256 mm3 voxels (512 × 512 × 256 matrix; 8-bit grayscale ranging from 0 to 255). The resampled MRI images were cleaned (removed of cerebrospinal-fluid spaces, vessels and nerves of the subarachnoid space; Photoshop CC, Adobe, San Jose, CA, USA,) and then filtered (unsharp masking and sigmoid intensity remapping; 16-bit grayscale; Thermo Scientific™ Amira™, v 6.4, Hillsboro, OR, USA). All imported objects were manually re-segmented accounting to the new high geometric resolution and highest contrast between adjacent structures using multi-objects contouring tools (Thermo Scientific™ Amira™, v 6.4, Hillsboro, OR, USA) (Figure 1A). Contours of unnamed structures were identified and labeled during this process (Figure 1B). A unique color (HSV color model) was attributed to each object. The surface representation of voxel objects was smoothed with a Gaussian filter (Thermo Scientific™ Amira™, v 6.4, Hillsboro, OR, USA) (Figure 1C).
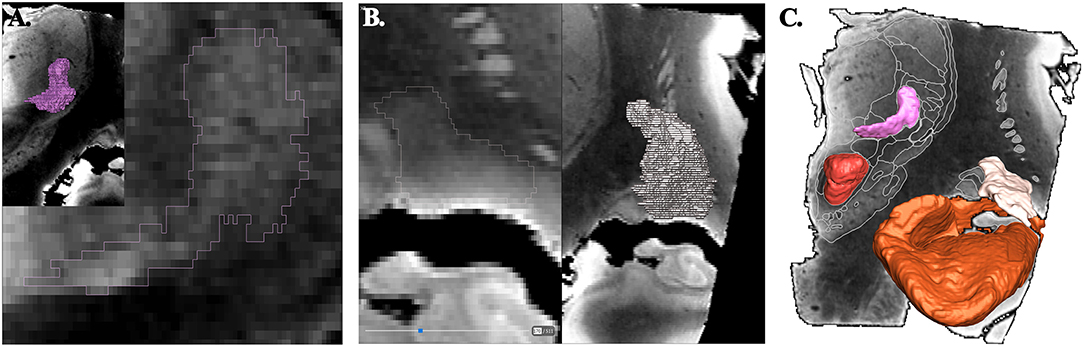
Figure 1. Principle of contouring and voxel objects (frontal view; coronal slices). (A) ventrocaudal medial nucleus of thalamus (pink). (B) retrolenticular-reticularoïd zone (light beige). (C) smoothed surfaces of voxel objects, ventrocaudal medial nucleus of thalamus, retrolenticular-reticularoïd zone, red nucleus (red), and hippocampal formation (light brown).
Labeling of Structures
The structures were labeled according to clinically known classical names (1, 2, 26–37) and ontologies (38–40). These structures were essentially nuclear, i.e., where neuronal bodies are concentrated; in addition, small white matter fascicles embedded were included (e.g., thalamic fascicle), but we did not label the large capsule fascicles, namely the internal, external and extreme capsules. Complementary information, such as homonyms and French names were also added. Acronyms were created to reduce the text size of labels on plates. Structures not precisely identified or still unnamed were detailed and labeled according to the location and the aspect on MRI. For instance: (i) the retrolenticular reticularoid zone was observed laterally to the area or zone of Wernicke, hence in a retrolenticular position, Because of its reticular appearance (low signal intensity) it was named reticularoid (Figure 2); (ii) the subthalamic tegmental field covered the historical Forel's H field, and was segregated into anterior, dorsal, medial, lateral and central zones; (iii) the area of reticular appearance, i.e., with an apparent low density of cells, which is placed posteriorly and below the pallidum, was named the posterior subpallidal area. The information is available as Supplementary Table.
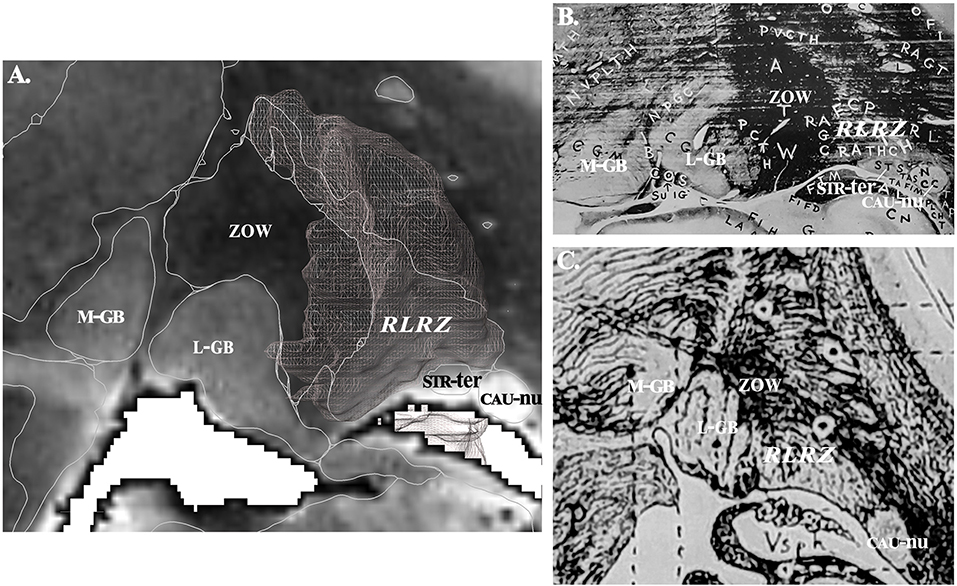
Figure 2. (A) Contouring and labeling of the retrolenticular reticularoid zone (RLRZ; the voxel object is overlaid) on MRI slice (see MDBA plate 10); medial geniculate body, M-GB; lateral geniculate body, L-GB; stria terminalis, STR-ter; caudate nucleus, CAU-nu. (B) Same region according to Riley (36); the RLRZ is visible (histologic preparation) but not identified. (C) Same region according to Dejerine (26); the RLRZ is visible (artist drawing) but not identified.
The structures were also specified according to four subregions of the deep brain, although these subdivisions are still not formally set (33, 40), namely the hypothalamus, the thalamus, the subthalamus or prethalamus and the telencephalon (Supplementary Table). The labeling was not fully extensive, as we focused on structures identifiable on MRI for the thalamus, subthalamus, and telencephalon, or inferred from diagrams for the hypothalamus (e.g., the suprachiasmatic and supraoptic nuclei were not separated).
MDBA Plates
For each MRI slice and related maps, structural (MRI slice) and topographic (maps) data were distributed on a double page or plate.
Topographic maps were created from cross sections of objects intersecting with cutting planes (Thermo Scientific™ Amira™, v 6.4, Hillsboro, OR, USA), displaying colored surface and contours of structures overlaid on MRI slices (Figure 3). The MRI slices were not scaled, as they were assumed to be used for direct comparison with patient MRI datasets. Furthermore, the aspect of signal of structures is very similar to that observed in images routinely used in clinical practice, even if the latter have a lower spatial resolution, which is supramillimetric. The contours of structures were overlaid (white line) on each MRI slice, facilitating the identification of structures on the patients' individual imagery. The contrast of each MRI slice was enhanced by automatic adjustment of tones (Photoshop CC, Adobe, San Jose, CA, USA), in a slice by slice fashion, minimizing heterogeneity of signals due to the presence of extremely high (white) and low (black) values within the volume of acquisition (a legacy of the original MRI acquisition).
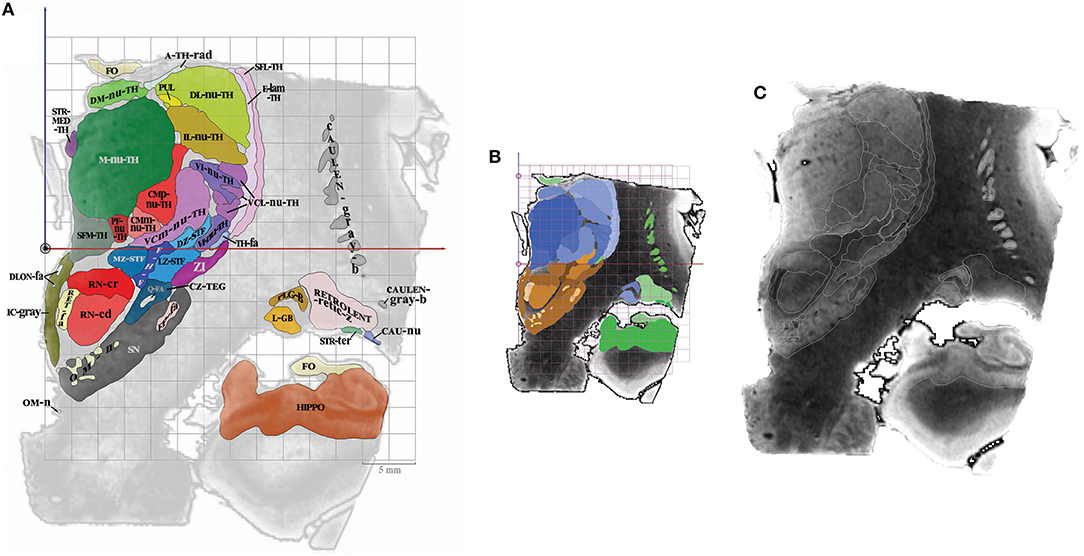
Figure 3. (A) Colored surfaces and acronyms, plate CR8 (millimeter scale), the ACPC line is depicted as a black circle. (B) Same plate, colors are specified according to subregions (proportional and millimeter scales); thalamus (blue gradation), subthalamus (brown gradation) and telencephalon (green gradation). (C) Same plate, MRI slice and white contours of structures (no scale).
The anatomic space, scaled in millimeters and oriented along vertical and horizontal AC-PC plans, was subdivided in twelfth of AC-PC distance according to Guiot et al. (5), Benabid et al. (6), leading to proportional scaling in the coronal (C), axial (A), and sagittal (S) planes (Figure 4). AC-PC distance was rounded to 27 mm; 1/12th of AC-PC was rounded to 2.25 mm; the midpoint between AC and PC (MI) was rounded to 13.5 mm. The height of the thalamus was 18 mm. The proportional grid system numbers were used to name the slices and related maps. Hence, for one unique location in a plane, both absolute (overlay of absolute millimeter distance grid) and relative (overlay of proportional distance grid) positions were available. Three particular sections served as reference positions. The axial section going through the AC-PC horizontal plane was named A0-AC-PC; sections above that plane were named superior (AS), and below, inferior (AI). The coronal section going through AC (perpendicular to AC-PC horizontal plane) was named C0-AC. All plates in front of AC were named CF, whereas the ones located posteriorly (or rear) to AC were named CR; at the MI point, the coronal section was named CR6-MI (the 6th coronal plane posterior to AC); at PC, CR12-PC (the 12th coronal plane posterior to AC). The sagittal section going through the vertical AC-PC plane was named S0-ACPC.
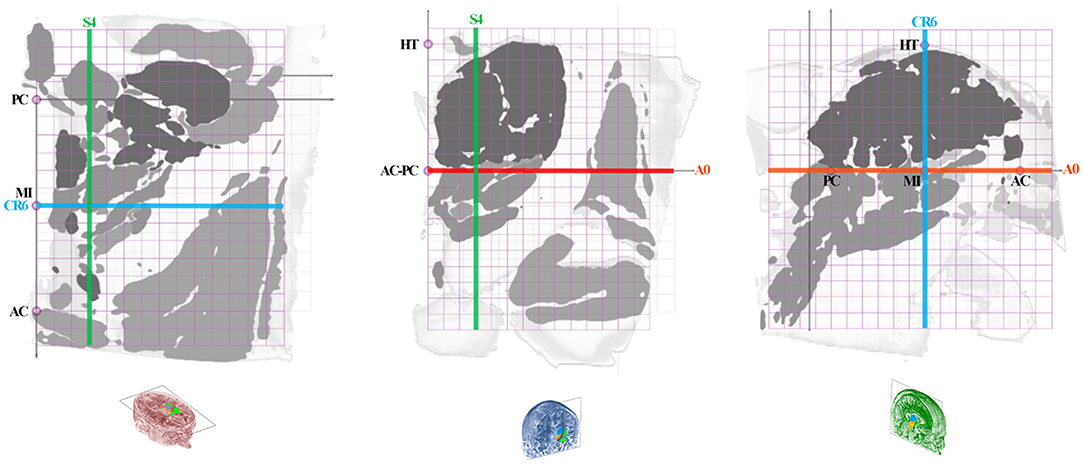
Figure 4. Position of slices (colored lines: axial, red; coronal, blue; sagittal, green) on the axial ACPC plan (A0-ACPC; left row), coronal MI plan (CR6-MI; intermediate row) and 9-mm lateral sagittal plan (S4; right row); proportional grid (purple) in 12th of ACPC distance; HT, thalamus height.
On each plate whatever the orientation, one MRI slice and related position graphs and maps, were arranged for localization and comparison purposes. The relative position of any given MRI slice and related maps was overlaid on proportional grids on A0-ACPC, CR6-MI, or S4, according to its orientation. Two related maps of the MRI slice were displayed: the first is the map of structures at the specific location with the contours and labels (acronyms), on which is overlaid a millimetric grid (absolute location); the second map is made of the same structures but colored according to the four subregions, including the overlay of a proportional grid as well. This second map was colored using luminance gradients of the specific color of the subregion as follows. The hypothalamus was colored in yellow, the thalamus in blue, the subthalamus in brown, and the telencephalon in green.
Results
Twelve hypothalamic, 39 subthalamic, 36 telencephalic and 32 thalamic structures were identified, contoured and labeled (n = 119; Supplementary Table). Nineteen coronal, 18 axial, and 15 sagittal MRI plates were created (n = 52; Table 1). The acronyms were classified in alphabetic order by subregion. The 52 plates generated for this study can be found in the https://hal.archives-ouvertes.fr/ [hal-02116633].
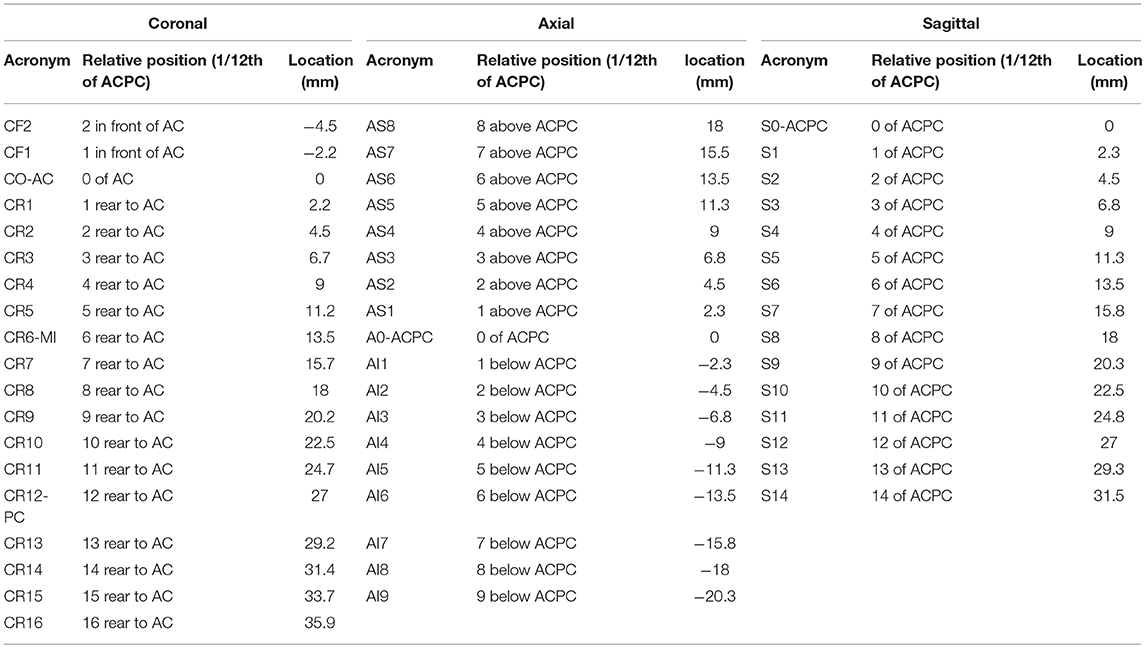
Table 1. MDBA plates.
Discussion
The MDBA with 119 structures and 52 plates provides an extensive 3D MRI structural analysis of the human deep brain mainly for clinical applications, but also researchers interested in direct visual identification of neuroanatomical structures. The simple principle of cartography from reconstructed slices of one anatomic specimen without destruction of tissue greatly facilitates the 3D structural analysis, which is also dramatically improved by high spatial resolution with infra millimetric voxels. Although the result of parcellation according to T1-weighted contrast harvested a lot of data, further approaches using others MRI contrast, such as inversion-recovery sequences, or multimodal imaging with DTI, should refine the information.
The large scale maps of MDBA with 250-μm side voxels is compatible with the recent human DTI data sets with isotropic voxels of 400 μm (41) up to 60 μm (42), as well as with high resolution probabilistic atlases (43, 44) and could help in the labeling process of the deep brain. Indeed the MDBA gives high level of structural details of white and gray matter structures substantially enhancing the current structural knowledge within this region. Although it can be used both at the individual level and in series, it is intrinsically a detailed data set of a unique specimen which must interpreted in this strict context as a topological descriptor of the deep brain architecture. Anyway this topological descriptor, could be the support of advanced probabilistic atlases enabling to integrate the variability, still not mastered, of the deep brain, through large cohorts of subjects.
Our approach has shown that it is feasible to identify the details of individual MRI anatomy. Whereas, the atlas-with proportional scales is still largely used for stereotactic targeting, nevertheless there must be kept in mind such unsolved issues as inhomogeneity of ontologies, weak cross-correspondences between atlases (45) and between set of slices within atlases questions (20). On the other hand it can be assumed that machine learning approaches (46) could significantly enhance these anatomical uncertainties, therefore dramatically change paradigms to solve these challenges. This is expected as the learning databases are rapidly becoming stronger. For instance the MDBA could be used in the work flow of learning methods including decision-based approaches whether supervised or not (47–49) to interpret the results. In the interim, the MDBA can assist significantly those who are willing to better master the deep brain architecture, which is particularly important for clinicians implanting devices in the deep brain. In this latter condition, practitioners can use the atlas like classical histological atlases from the proportional grid plates, and at the same time they can adjust or specify directly the targets from the MRI plates. Furthermore, the MDBA is of considerable value to study injured and deformed brains as indirect methods are unreliable due to the hampered landmarks in the injured brain (50). The MDBA also improves scientific knowledge of the deep brain structural aspect as revealed by current MRI. In this sense, it fuels the panoply of MRI-based brain atlases used for research and clinical purposes, notably in computer science (see e.g., https://en.wikibooks.org/wiki/SPM/Atlases). Furthermore, the MDBA creates a link to pioneering data (see Supplementary Table), which otherwise would remain into oblivion. Moreover, the MDBA serves as a new tool in the continuous effort of mastering the structural and functional anatomy of the human brain using either direct or indirect methods of cartography. Last but not least, it can also be used for teaching, learning and training purposes, taking advantage of current publicly available free website-based programs (https://www.openanatomy.org/).
Data Availability
One dataset generated for this study can be found in the [https://hal.archives-ouvertes.fr/] [hal-02116633].
Author Contributions
J-JL designed and realized the MDBA and wrote the first draft of the manuscript. AD contributed substantially to the interpretation of anatomical data of the MDBA and wrote sections of the manuscript. GC, YE, RC, JC, and FD contributed substantially to the interpretation of anatomical data of the MDBA. NM and RK contributed to the conception the work and wrote sections of the manuscript. All authors contributed to manuscript revision, read and approved the submitted version.
Funding
NIH grants P41 EB015902, P41 EB015898, and U24 CA180918 to RK.
Conflict of Interest Statement
The authors declare that the research was conducted in the absence of any commercial or financial relationships that could be construed as a potential conflict of interest.
Acknowledgments
We deeply thank all who contributed and aided during this long term work.
Supplementary Material
The Supplementary Material for this article can be found online at: https://www.frontiersin.org/articles/10.3389/fneur.2019.00851/full#supplementary-material
References
1. Schaltenbrand G, Wahren W. Atlas for Stereotaxy of the Human Brain. Stuttgart, NY: Thieme (1977).
2. Talairach J, David M, Tournoux P, Corredor H, Kvasina. Atlas D'anatomie Stéréotaxique. Repérage Radiologique Indirect Des Noyaux Gris Centraux Des Régions Mésencéphalo-Sous-Optiques et Hypothalamiques de l'homme. Paris: Masson et Cie (1957).
4. Yelnik J, Bardinet E, Dormont D, Malandain G, Ourselin S, Tandé D, et al. A three-dimensional, histological and deformable atlas of the human basal ganglia. I. atlas construction based on immunohistochemical and MRI data. NeuroImage. (2007) 34:618–638. doi: 10.1016/j.neuroimage.2006.09.026
5. Guiot G, Derome P, Trigo JC. Intention tremor: the best indication for stereotaxic surgery. La Presse Med. (1967) 75:2513–8.
6. Benabid AL, Koudsie A, Benazzouz A, Le Bas JF, Pollak P. Imaging of subthalamic nucleus and ventralis intermedius of the thalamus. Mov Disord. (2002) 17 (Suppl 3):S123–9. doi: 10.1002/mds.10153
7. Bardinet E, Bhattacharjee M, Dormont D, Pidoux B, Malandain G, Schüpbach M, et al. A three-dimensional histological atlas of the human basal ganglia. II. atlas deformation strategy and evaluation in deep brain stimulation for Parkinson disease. J Neurosurg. (2009) 110:208–19. doi: 10.3171/2008.3.17469
8. Tuleasca C, Najdenovska E, Régis J, Witjas T, Girard N, Champoudry J, et al. Ventrolateral motor thalamus abnormal connectivity in essential tremor before and after thalamotomy: a resting-state functional magnetic resonance imaging study. World Neurosurg. (2018) 113:e453–64. doi: 10.1093/neuros/nyy303.210
9. Brunenberg EJ, Moeskops P, Backes WH, Pollo C, Cammoun L, Vilanova A, et al. Structural and resting state functional connectivity of the subthalamic nucleus: identification of motor STN parts and the hyperdirect pathway. PLoS ONE. (2012) 7:e39061. doi: 10.1371/journal.pone.0039061
10. Cho ZH, Min HK, Oh SH, Han JY, Park CW, Chi JG, et al. Direct visualization of deep brain stimulation targets in Parkinson Disease with the use of 7-tesla magnetic resonance imaging. J Neurosurg. (2010) 113:639–47. doi: 10.3171/2010.3.JNS091385
11. Cho ZH, Min HK, Oh SH, Han JY, Park CW, Chi JG, et al. Evaluating indirect subthalamic nucleus targeting with validated 3-tesla magnetic resonance imaging. Stereotact Funct Neurosurg. (2014) 92:337–45. doi: 10.1159/000366286
12. Lefranc M, Derrey S, Merle P, Tir M, Constans JM, Montpellier D, et al. High-resolution 3-dimensional T2*-weighted angiography (HR 3-D SWAN): an optimized 3-T magnetic resonance imaging sequence for targeting the subthalamic nucleus. Neurosurgery. (2014) 74:615–26. doi: 10.1227/NEU.0000000000000319
13. O'Gorman RL, Shmueli K, Ashkan K, Samuel M, Lythgoe DJ, Shahidiani A, et al. Optimal MRI methods for direct stereotactic targeting of the subthalamic nucleus and globus pallidus. Eur. Radiol. (2011) 21:130–6. doi: 10.1007/s00330-010-1885-5
14. Vertinsky AT, Coenen VA, Lang DJ, Kolind S, Honey CR, Li D, et al. Localization of the subthalamic nucleus: optimization with susceptibility-weighted phase MR imaging. Am J Neuroradiol. (2009) 30:1717–24. doi: 10.3174/ajnr.A1669
15. Xiao Y, Jannin P, D'Albis T, Guizard N, Haegelen C, Lalys F, et al. Investigation of morphometric variability of subthalamic nucleus, red nucleus, and substantia nigra in advanced Parkinson's disease patients using automatic segmentation and PCA-based analysis. Hum Brain Mapp. (2014) 35:4330–44. doi: 10.1002/hbm.22478
16. Lemaire JJ, Durif F, Boire JY, Debilly B, Irthum B, Chazal J. Direct stereotactic MRI location in the globus pallidus for chronic stimulation in Parkinson's disease. Acta Neurochirurgica. (1999) 141:759–65. doi: 10.1007/s007010050372
17. Zerroug A, Gabrillargues J, Coll G, Vassal F, Jean B, Chabert E, et al. Personalized mapping of the deep brain with a white matter attenuated inversion recovery (WAIR) sequence at 1.5-Tesla: experience based on a series of 156 patients. Neuro-Chirurgie. (2016) 62:183–9. doi: 10.1016/j.neuchi.2016.01.009
18. Lemaire J-J, Caire F, Bonny J-M, Kemeny J-L, Villéger A, Chazal J. Contribution of 4.7-tesla MRI in the analysis of MRI anatomy of the human subthalamic area. Acta Neurochirurgica. (2004) 146 (Suppl): 906–7.
19. Lemaire JJ, Sakka L, Ouchchane L, Caire F, Gabrillargues J, Bonny JM. Anatomy of the human thalamus based on spontaneous contrast and microscopic voxels in high-field magnetic resonance imaging. Neurosurgery. (2010) 66 (3 Suppl Operative):161–72. doi: 10.1227/01.NEU.0000365617.41061.A3
20. Lemaire JJ, Coste J, Ouchchane L, Caire F, Nuti C, Derost P, et al. Brain mapping in stereotactic surgery: a brief overview from the probabilistic targeting to the patient-based anatomic mapping. NeuroImage. (2007) 37:S109–15. doi: 10.1016/j.neuroimage.2007.05.055
21. Lemaire JJ, Nezzar H, Sakka L, Boirie Y, Fontaine D, Coste A, et al. Maps of the adult human hypothalamus. Surg Neurol Int. (2013) 4 (Suppl 3):S156–63. doi: 10.4103/2152-7806.110667
22. Fontaine D, Deudon A, Lemaire JJ, Razzouk M, Viau P, Darcourt J, et al. Symptomatic treatment of memory decline in alzheimer's disease by deep brain stimulation: a feasibility study. J Alzheimer's Dis. (2013) 34:315–23. doi: 10.3233/JAD-121579
23. Batisse-Lignier M, Rieu I, Guillet C, Pujos E, Morio B, Lemaire JJ, et al. Deep brain stimulation of the subthalamic nucleus regulates postabsorptive glucose metabolism in patients with Parkinson's disease. J Clin Endocrinol Metabol. (2013) 98:E1050–4. doi: 10.1210/jc.2012-3838
24. Ulla M, Thobois S, Lemaire JJ, Schmitt A, Derost P, Broussolle E, et al. Manic behaviour induced by deep-brain stimulation in Parkinson's disease: evidence of substantia nigra implication? J Neurol Neurosurg Psychiatry. (2006) 77:1363–66. doi: 10.1136/jnnp.2006.096628
25. Lemaire JJ, Frew AJ, McArthur D, Gorgulho AA, Alger JR, Salomon N, et al. White matter connectivity of human hypothalamus. Brain Res. (2011) 1371:43–64. doi: 10.1016/j.brainres.2010.11.072
27. Duvernoy HM, Cabanis EA, Iba-Zizen MT, Tamraz J, Guyot J. Le Cerveau Humain: Surfaces, Coupes Sériées Tridimentionelles et IRM. Paris: Springer-Verlag (1992).
28. Guillain G, Ivan B. Anatomie Topographique Du Système Nerveux Central. Paris: Masson et Cie (1926).
29. Haymaker W, Anderson, Nauta WJH. The Hypothalamus. Thomas Books. Springfield, IL: Charles C. Thomas (1969).
31. Morel A, Magnin M, Jeanmonod D. Multiarchitectonic and stereotactic atlas of the human thalamus. J Comparat Neurol. (1997) 387:588–630.3
32. Morel A, Magnin M, Jeanmonod D. Duvernoy's Atlas of the Human Brain Stem and Cerebellum. Austria: Springer Wien NewYork (2009)
33. Nieuwenhuys R, Voogd J, Huijzen C. The Human Central Nervous System. Berlin, Heidelberg, NY: Springer-Verlag (2008).
36. Riley HA. An Atlas of the Basal Ganglia, Brain Stem and Spinal Cord. Baltimore: Williams & Wilkins (1953).
37. Toni R, Malaguti A, Benfenati F, Martini L. The human hypothalamus: a morpho-functional perspective. J Endocrinol Invest. (2004) 27 (6 Suppl):73–94.
38. Terminologia Anatomica TA. (1998). Available online at: https://www.unifr.ch/ifaa/Public/EntryPage/ViewTAOnLine.html (accessed January 29, 2019)
39. BrainInfo. (2019). Available online at: http://braininfo.rprc.washington.edu/ (accessed January 29, 2019)
40. Ten Donkelaar HJ, Broman J, Neumann PE, Puelles L, Riva A, Tubbs RS, et al. FIPAT. Terminologia Neuroanatomica. FIPAT.library.dal.ca. (2017). Available online at: http://fipat.library.dal.ca/wp-content/uploads/2017/02/FIPAT-TNA-Ch1.pdf (accessed August 16, 2019)
41. Roebroeck A, Miller KL, Aggarwal M. Ex vivo diffusion MRI of the human brain: technical challenges and recent advances. NMR Biomed. (2019) 32:e3941. doi: 10.1002/nbm.3941
42. Sengupta S, Fritz FJ, Harms RL, Hildebrand S, Tse DHY, Poser BA, et al. High resolution anatomical and quantitative MRI of the entire human occipital lobe ex vivo at 9.4 T. NeuroImage. (2018) 168:162–71. doi: 10.1016/j.neuroimage.2017.03.039
43. Najdenovska E, Alemán-Gómez Y, Battistella G, Descoteaux M, Hagmann P, Jacquemont S, et al. In-vivo probabilistic atlas of human thalamic nuclei based on diffusion- weighted magnetic resonance imaging. Sci. Data. (2018) 5:180270. doi: 10.1038/sdata.2018.270
44. Pauli WM, Nili AN, Tyszka JM. A high-resolution probabilistic in vivo atlas of human subcortical brain nuclei. Sci Data. (2018) 5:180063. doi: 10.1038/sdata.2018.63
45. Mai JK, Majtanik M. Toward a common terminology for the thalamus. Front Neuroanat. (2018) 12:114. doi: 10.3389/fnana.2018.00114
46. Akkus Z, Galimzianova A, Hoogi A, Rubin DL, Erickson BJ. Deep learning for brain MRI segmentation: state of the art and future directions. J Digit Imag. (2017) 30:449–59. doi: 10.1007/s10278-017-9983-4
47. Suk HI, Lee SW, Shen D. Hierarchical feature representation and multimodal fusion with deep learning for AD/MCI diagnosis. NeuroImage. (2014) 101:569–582. doi: 10.1016/j.neuroimage.2014.06.077
48. Liu M, Zhang D, Shen D. Hierarchical fusion of features and classifier decisions for Alzheimer's disease diagnosis. Hum Brain Mapp. (2014) 35:1305–1319. doi: 10.1002/hbm.22254
49. Amoroso N, La Rocca M, Bruno S, Maggipinto T, Monaco A, Bellotti R, et al. Multiplex networks for early diagnosis of Alzheimer's disease. Front. Aging Neurosci. (2018) 10:365 doi: 10.3389/fnagi.2018.00365
Keywords: atlas, MRI, human, thalamus, hypothalamus, subthalamus, deep brain, stereotaxis
Citation: Lemaire J-J, De Salles A, Coll G, El Ouadih Y, Chaix R, Coste J, Durif F, Makris N and Kikinis R (2019) MRI Atlas of the Human Deep Brain. Front. Neurol. 10:851. doi: 10.3389/fneur.2019.00851
Received: 22 May 2019; Accepted: 23 July 2019;
Published: 27 August 2019.
Edited by:
Hans-Peter Müller, University of Ulm, GermanyReviewed by:
Kenichi Oishi, Johns Hopkins University, United StatesNicola Amoroso, University of Bari Aldo Moro, Italy
Copyright © 2019 Lemaire, De Salles, Coll, El Ouadih, Chaix, Coste, Durif, Makris and Kikinis. This is an open-access article distributed under the terms of the Creative Commons Attribution License (CC BY). The use, distribution or reproduction in other forums is permitted, provided the original author(s) and the copyright owner(s) are credited and that the original publication in this journal is cited, in accordance with accepted academic practice. No use, distribution or reproduction is permitted which does not comply with these terms.
*Correspondence: Jean-Jacques Lemaire, ampsZW1haXJlQGNodS1jbGVybW9udGZlcnJhbmQuZnI=