 Daniel Johnson1,2*†
 Antonio Ricciardi1,3†
 Wallace Brownlee1
 Baris Kanber1,3
 Ferran Prados1,3,4
 Sara Collorone1Enrico Kaden5,6
 Ahmed Toosy1,7
 Daniel C. Alexander5Claudia A. M. Gandini Wheeler-Kingshott1,8,9Olga Ciccarelli1,7
 Francesco Grussu1,10
- 1Department of Neuroinflammation, Faculty of Brain Sciences, Queen Square Multiple Sclerosis (MS) Centre, University College London (UCL) Queen Square Institute of Neurology, University College London, London, United Kingdom
- 2Addenbrooke's Hospital, Cambridge, United Kingdom
- 3Department of Medical Physics and Biomedical Engineering, Centre for Medical Image Computing, University College London, London, United Kingdom
- 4e-Health Centre, Universitat Oberta de Catalunya, Barcelona, Spain
- 5Department of Computer Science, Centre for Medical Image Computing, University College London, London, United Kingdom
- 6Great Ormond Street Institute of Child Health, University College London, London, United Kingdom
- 7National Institute for Health Research (NIHR) University College London Hospitals Biomedical Research Centre, London, United Kingdom
- 8Department of Brain and Behavioral Sciences, University of Pavia, Pavia, Italy
- 9Brain Magnetic Resonance Imaging (MRI) 3T Research Centre, Istituto di Ricovero e Cura a Carattere Scientifico (IRCCS) Mondino Foundation, Pavia, Italy
- 10Radiomics Group, Vall d'Hebron Institute of Oncology, Vall d'Hebron Barcelona Hospital Campus, Barcelona, Spain
Background: Neurite orientation dispersion and density imaging (NODDI) and the spherical mean technique (SMT) are diffusion MRI methods providing metrics with sensitivity to similar characteristics of white matter microstructure. There has been limited comparison of changes in NODDI and SMT parameters due to multiple sclerosis (MS) pathology in clinical settings.
Purpose: To compare group-wise differences between healthy controls and MS patients in NODDI and SMT metrics, investigating associations with disability and correlations with diffusion tensor imaging (DTI) metrics.
Methods: Sixty three relapsing-remitting MS patients were compared to 28 healthy controls. NODDI and SMT metrics corresponding to intracellular volume fraction (vin), orientation dispersion (ODI and ODE), diffusivity (D) (SMT only) and isotropic volume fraction (viso) (NODDI only) were calculated from diffusion MRI data, alongside DTI metrics (fractional anisotropy, FA; axial/mean/radial diffusivity, AD/MD/RD). Correlations between all pairs of MRI metrics were calculated in normal-appearing white matter (NAWM). Associations with expanded disability status scale (EDSS), controlling for age and gender, were evaluated. Patient-control differences were assessed voxel-by-voxel in MNI space controlling for age and gender at the 5% significance level, correcting for multiple comparisons. Spatial overlap of areas showing significant differences were compared using Dice coefficients.
Results: NODDI and SMT show significant associations with EDSS (standardised beta coefficient −0.34 in NAWM and −0.37 in lesions for NODDI vin; 0.38 and −0.31 for SMT ODE and vin in lesions; p < 0.05). Significant correlations in NAWM are observed between DTI and NODDI/SMT metrics. NODDI vin and SMT vin strongly correlated (r = 0.72, p < 0.05), likewise NODDI ODI and SMT ODE (r = −0.80, p < 0.05). All DTI, NODDI and SMT metrics detect widespread differences between patients and controls in NAWM (12.57% and 11.90% of MNI brain mask for SMT and NODDI vin, Dice overlap of 0.42).
Data Conclusion: SMT and NODDI detect significant differences in white matter microstructure between MS patients and controls, concurring on the direction of these changes, providing consistent descriptors of tissue microstructure that correlate with disability and show alterations beyond focal damage. Our study suggests that NODDI and SMT may play a role in monitoring MS in clinical trials and practice.
Introduction
Over the last 20 years, diffusion tensor imaging (DTI) (1) has established itself as a modality of choice for imaging the cerebral white matter (WM) with a view to gaining an understanding of its microstructure in health and disease. DTI relies on the hypothesis of Gaussian diffusion to evaluate an effective diffusion tensor for each voxel in an image, from which a number of rotationally-invariant scalar descriptors are obtained, such as fractional anisotropy (FA), a measure of diffusion direction dependence, as well as the mean diffusivity (MD) (2), quantifying the overall amount of diffusion in a voxel.
DTI is a rapid and robust technique that has proven useful to assess microstructural damage in a number of conditions (3). Nonetheless, it is limited by the assumptions that underlie its model (4). Firstly, DTI does not account for partial volume effects, an issue at boundaries between different tissue types where voxels contain a mixture of grey matter, white matter, and cerebrospinal fluid. Secondly, DTI metrics lack specificity to different neuropathological substrates. For example, in white matter, diffusivity is generally significantly larger parallel to axons rather than perpendicular to them producing a large FA. However, this anisotropy can be reduced either by a reduction in the density of axons, an increase in their orientation dispersion, or a combination of both. Lastly, the core assumption of DTI, that of Gaussian diffusion, does not necessarily hold in many areas of white matter at high b-values, due to the restriction to water movement created by cell membranes and in regions of crossing fibres.
Several multi-compartment diffusion MRI approaches have been developed in the past 15 years to increase the specificity of techniques such as DTI to key pathophysiological processes (5–11). These methods make explicit assumptions on water compartmentalisation in neural tissue to capture salient characteristics of high-order b-value dependence in diffusion-weighted signals, thus accounting for departures from Gaussian diffusion.
Two recent and widely popular such techniques include neurite orientation dispersion and density imaging (NODDI) (12) and the spherical mean technique (SMT) (13). Both can be fitted to the same, clinically feasible, multi-shell scanning protocols using clinical scanners.
NODDI fits diffusion data to a three-compartment tissue model: an intra-neurite compartment, in which diffusion is constrained except along the direction of neurites; an extra-neurite compartment, in which diffusion is Gaussian with hindered diffusion perpendicular to the direction of neurites and a CSF compartment, in which diffusion is Gaussian and isotropic. Within each voxel, the variability of neurite orientations is modelled by a Watson distribution.
SMT is another recent technique for microscopic diffusion anisotropy imaging (13) that maps microstructural tissue features not confounded by fibre crossing or orientation dispersion. In this study, we used an SMT method comprising two tissue compartments (14), i.e., an intra- and an extra-neurite compartment. This approach provides estimates of the neural diffusivity and the intra-neurite volume fraction in the presence of orientation heterogeneity. Subsequently, spherical deconvolution can be used to recover the fibre orientation distribution, from which the orientation dispersion entropy is calculated voxel-by-voxel.
Both techniques were applied to people with Multiple Sclerosis (MS). MS is a disease of the central nervous system with a complex and incompletely understood pathophysiology. It features both an inflammatory demyelinating component, which leads to discrete focal white matter lesions and a neurodegenerative component, resulting in generalised diffuse white and grey matter atrophy (15). Abnormal DTI measures are seen in both lesions and so-called normal appearing white matter (NAWM) (featuring no obvious pathology on conventional MRI scanning) (16–18). There is evidence that validates the use of NODDI in MS (19–21), which suggest that while FA might be the most sensitive metric to detect abnormalities, NODDI metrics are able to detect areas of abnormality where FA is normal (22, 23). Investigations into NODDI in MS have generally concluded that intra-neurite volume fraction decreases in both lesions and NAWM (20, 21, 24) whilst findings on orientation dispersion vary (23, 24). Considering SMT, differences between lesions and NAWM in MS patients but not between NAWM and healthy WM in controls in similar anatomical locations were reported in the brain (25), and abnormalities were also detected in the NAWM of the MS cervical spinal cord (26).
Notably, SMT and NODDI provide metrics with similar biological interpretations that can be obtained from similar diffusion-weighted MRI data. They are promising biomarkers in MS and have the potential of increasing the capacity of MRI to detect MS pathology. Here, for the first time to the authors' knowledge, we directly compare NODDI and SMT metrics in a real clinical setting by analysing the same data, acquired with a multi-shell diffusion weighted MRI protocol, and investigating the ability of NODDI and SMT to detect abnormalities in patients with relapsing-remitting (RR) MS compared with healthy controls, as well as their association to physical disability. Our results are informative for the community and elucidate whether (i) NODDI and SMT detect changes in similar locations and that these approaches point toward the same biological alterations; (ii) are the results derived by the two techniques sufficiently similar as to allow direct cross-comparison; or (iii) are there differences precluding this or potentially highlighting an advantage to one or other method in detecting group differences between MS patients and controls.
Methods
Participants
This is a retrospective analysis using data previously acquired, and reported in full elsewhere (27). Sixty-three patients with RRMS (48 female, 76%) and 28 heathy controls (19 female, 68%) were recruited. Mean ages were 47 (SD ± 7.6) years for patients and 35.1 (±10.2) for healthy controls. For RRMS patients, mean disease duration at the time of assessment was 14.6 years (SD ± 2.4) and Expanded Disability Status Scores ranged from 0 to 6.5, with a median score of 2. All subjects provided written informed consent and the study was approved by the institutional Research Ethics Committee.
MR Image Acquisition
All subjects were scanned with a 3T Philips Achieva MRI system. The scanning protocol included multi-shell diffusion-weighted echo-planar imaging scans (resolution: 2.5 × 2.5 × 2.5mm3; TE = 82 ms; TR = 14 s; b = 0 and {8,15,30} directions at b = {300, 711, 2,000} s/mm2, scan time 16'34”), anatomical PD-T2 images for MS lesion outlining (multi-slice turbo spin echo; resolution: 1 × 1 × 3 mm3, TE = 19/85 ms, TR = 3,500 ms, scan time 4'01”), and volumetric T1-weighted imaging (3D turbo field echo, resolution 1 × 1 × 1 mm3, flip angle 8°, TE = 3.1 ms, TR = 6.9 ms, TI = 824 ms, scan time 6'30”).
Diffusion Metrics Evaluation
The multi-shell diffusion data were corrected for motion and eddy current distortion using the FSL eddy (28). Non-brain tissue was eliminated using co-registered T1 images using the FSL Brain Extraction Tool (https://fsl.fmrib.ox.ac.uk/fsl/fslwiki/BET). The DTI model was fitted to the diffusion data with the exclusion of the highest b-value shell to limit the contribution of non-Gaussian diffusion, using FSL dtifit. This provided the following voxel-wise metrics: Fractional Anisotropy (FA); axial/radial/mean diffusivities (AD/RD/MD).
Images were analysed using NODDI (12) to obtain maps of orientation dispersion index (ODI), isotropic volume fraction (viso) and intra-neurite volume fraction (vin-NODDI). ODI is defined as (2/π)arctan(1/κ) where κ is the width parameter of the Watson distribution describing the neurite orientation distribution. ODI therefore increases with increasing orientation dispersion. The NODDI model was fitted with the freely available Matlab Toolbox (29) (http://mig.cs.ucl.ac.uk/index.php?n=Tutorial.NODDImatlab).
Two-compartment SMT (14) analysis was performed on the same data used for NODDI with the freely available SMT fitting routines (30) (https://github.com/ekaden/smt) and provided voxel-wise intra-neurite volume fraction (vin-SMT) and neural diffusivity (D). Additionally, orientation dispersion entropy (ODE) was obtained using in-house Matlab code. ODE is defined as the Kullback-Leibler divergence of the axon orientation distribution with respect to the uniform distribution (14), implying that ODE is reduced as neurite dispersion increases. As a consequence, ODI and ODE show reversed contrast: increasing local neurite orientation variability is mapped to increasing NODDI ODI and decreasing SMT ODE values. The SMT and NODDI parameters and the main model constraints are described and summarised in Table 1. The fitting of both NODDI and SMT was performed using the same procedure (i.e., same fitting code with same constraints) across the whole brain, including lesional voxels. Among NODDI and SMT parameters, the obvious comparisons are between ODE and ODI and the SMT and NODDI intra-neurite volume fraction metrics, as such metrics are designed to capture similar characteristics of tissue microstructure. In the case of ODI and ODE the comparison is less direct with the metrics expected to be approximately inversely proportional to each other. However, as both are measures of the degree of alignment of axons within a voxel, from the perspective of identifying voxels showing a significant difference between MS patients and controls, they are adequately comparable. Finally, we point out that NODDI and SMT metrics of compartment-wise fraction (i.e., viso and vin for NODDI; vin for SMT) are inherently T2-weighted. Therefore, they technically represent signal fractions, rather than volume fractions. Nonetheless, the latter definition has become more popular in the literature and will be adopted here.
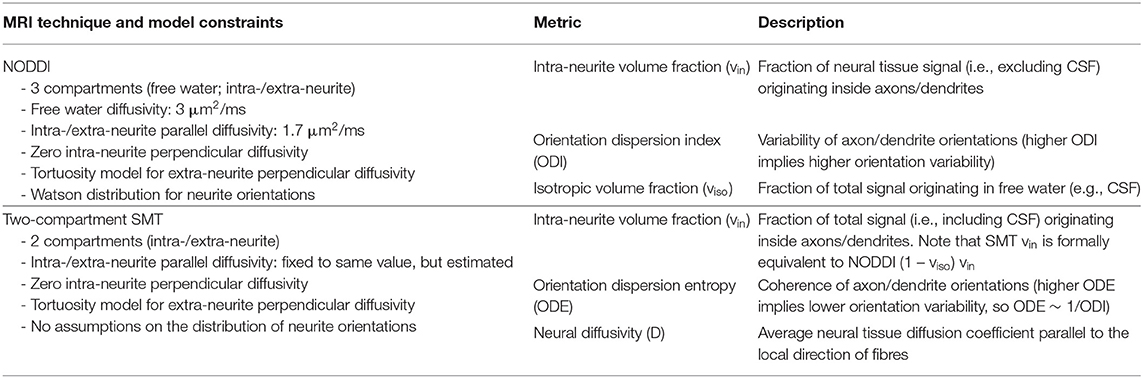
Table 1. Summary of the diffusion MRI metrics provided by the NODDI and SMT techniques, as well as overview of the constraints adopted in each of the two models.
Tissue Characterisation
Lesion masks were traced manually by a single rater (WJB) viewing PD/T2-weighted images using a semi-automated edge-finding tool (JIM6.0, Xinapse Systems, UK). Afterwards, PD/T2-weighted images and lesion masks were registered to diffusion space using affine co-registration (NiftyReg reg_aladin tool, http://cmictig.cs.ucl.ac.uk/wiki/index.php/NiftyReg). Finally, we lesion-filled the 3D T1-weighted anatomical scan of each patient, co-registered it to diffusion space using affine co-registration with NiftyReg reg_aladin and segmented the brain into different tissues with the GIF technique (31). Afterwards, we extracted mean values of NODDI and SMT metrics within each tissue type (white matter lesions, normal appearing white matter, cortical grey matter, deep grey matter) for each patient, and obtained tissue-specific distributions of all NODDI and SMT metrics.
Analysis in Standard Space
We warped all MRI metrics (DTI, NODDI, SMT), lesion masks and tissue segmentations to the standard MNI152 space (2 mm isotropic resolution; lesions resampled with nearest-neighbour interpolation. For this purpose, we co-registered non-linearly the lesion-filled T1-weighted anatomical scans to the MNI template using NiftyReg reg_f3d. Afterwards we combined such a registration transformation to that, warping diffusion data to each subject's T1-weighted scan, and resampled all parametric maps, lesion and tissue masks with NiftyReg reg_resample. Firstly, we investigated associations between all possible pairs of MRI metrics by calculating Pearson's correlation coefficients on the subject-wise WM mean values (NAWM for patients, i.e., excluding lesions).
Secondly, we investigated the association between all MRI metrics and disability, as measured by the EDSS score. We fitted the model edss = β0+ β1m+ β2age+ β3gender for each MRI metric m among FA, AD, RD, MD (DTI); viso, vin, ODI (NODDI); D, vin, ODE (SMT). The models, which consider age and gender as confounding factors, where fitted with the python statsmodel module twice for each metric: in one case using metric mean value in patients' NAWM, and in the second case using lesions' mean values.
Afterwards, we tested whether MRI metrics exhibited differences between RRMS patient and controls. For this purpose, we fitted voxel-by-voxel the model m = β0+ β1group+ β2age+ β3gender with the freely available python statsmodel module. Above, m is the generic MRI metric (FA, AD, RD, MD for DTI; viso, vin, ODI for NODDI; D, vin, ODE for SMT). The models account for age and gender as confounding factors, and were fitted excluding measurements from lesional voxels, i.e., including only normal-appearing tissue. In practise, this was achieved by excluding patients whose resampled lesion mask included a specific voxel when fitting our regression model in that voxel. The p-value maps corresponding to the coefficients β0, β1, β2, and β3 were corrected for multiple comparisons with FSL fdr. An MRI metric was considered significantly different between patients and controls in a voxel if a non-zero β1 showed a p < 0.05 (correcting for multiple comparisons).
Finally, we calculated the volume of the tissue in MNI space exhibiting statistically significant patient-control differences, and quantified the overlap among such areas for all possible pairs of MRI metrics by computing the Dice overlap coefficient (32).
Results
Examples of Lesion Segmentation
Figure 1 shows an example of lesion segmentation in one patient. Segmentation was performed on the PD-weighted/T2-weighted axial turbo spin echo scans, which demonstrate WM lesions as hyperintense as compared to the surrounding normal-appearing tissue.
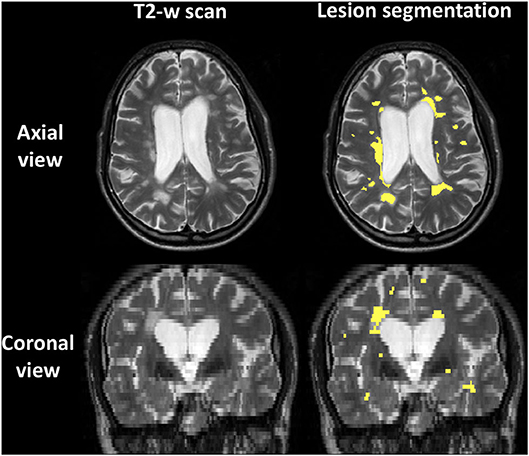
Figure 1. Example of lesion segmentation on the T2-weighted fast spin echo 2D anatomical scan of one patient. Top: axial views; bottom: coronal views. Left: scan; right: scan with lesions outlined in yellow.
Examples of Parametric Maps
An example of parametric NODDI and SMT maps from a healthy control and an RRMS patient are provided in Figures 2, 3, respectively. Visual inspection highlights known between-tissue contrasts, e.g., higher NODDI and SMT vin in WM than in GM, lower/higher NODDI ODI/SMT ODE in GM than in WM (control); hypointense lesions in both NODDI and SMT vin maps (patient).
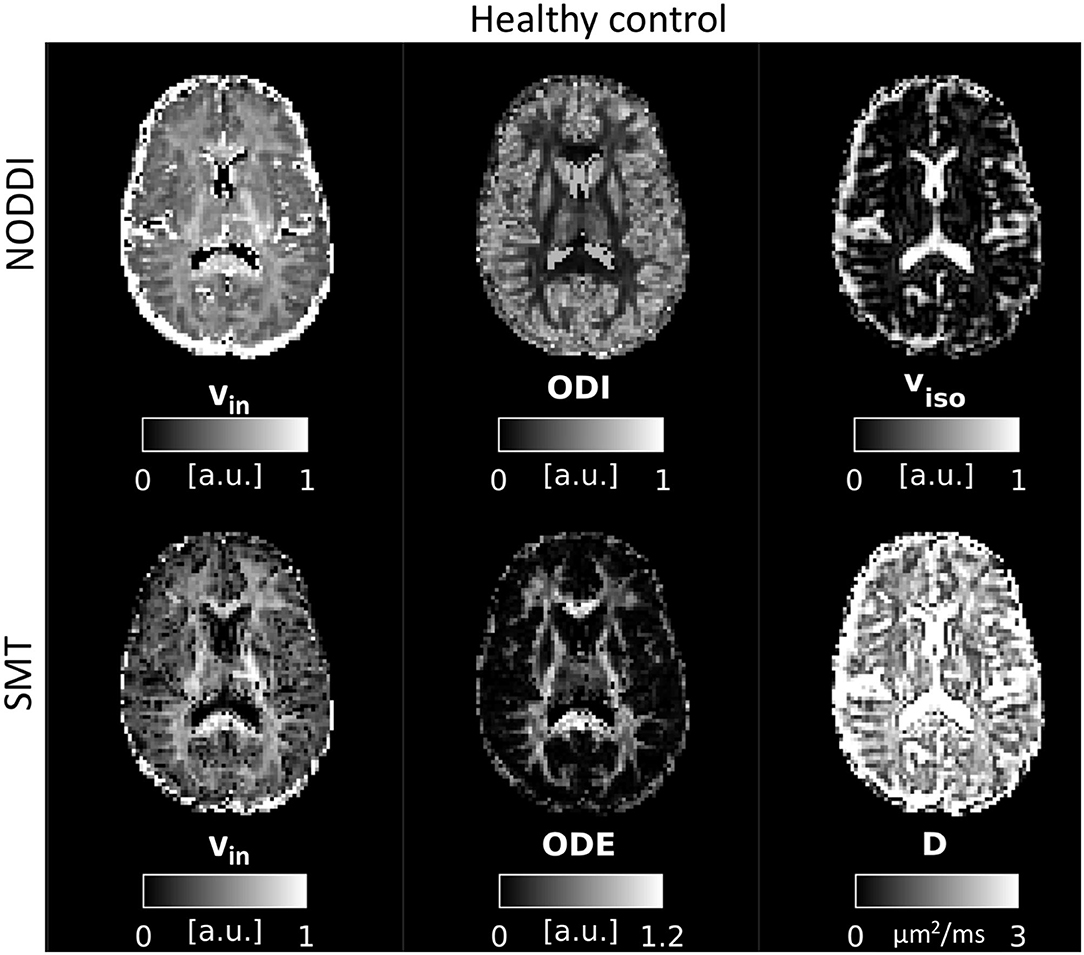
Figure 2. NODDI and SMT metrics as obtained from a healthy control. Top: NODDI (left: intra-neurite volume fraction vin; orientation dispersion index ODI; isotropic volume fraction viso); bottom: SMT (intra-neurite volume fraction vin; orientation dispersion entropy ODE; neural diffusivity D).
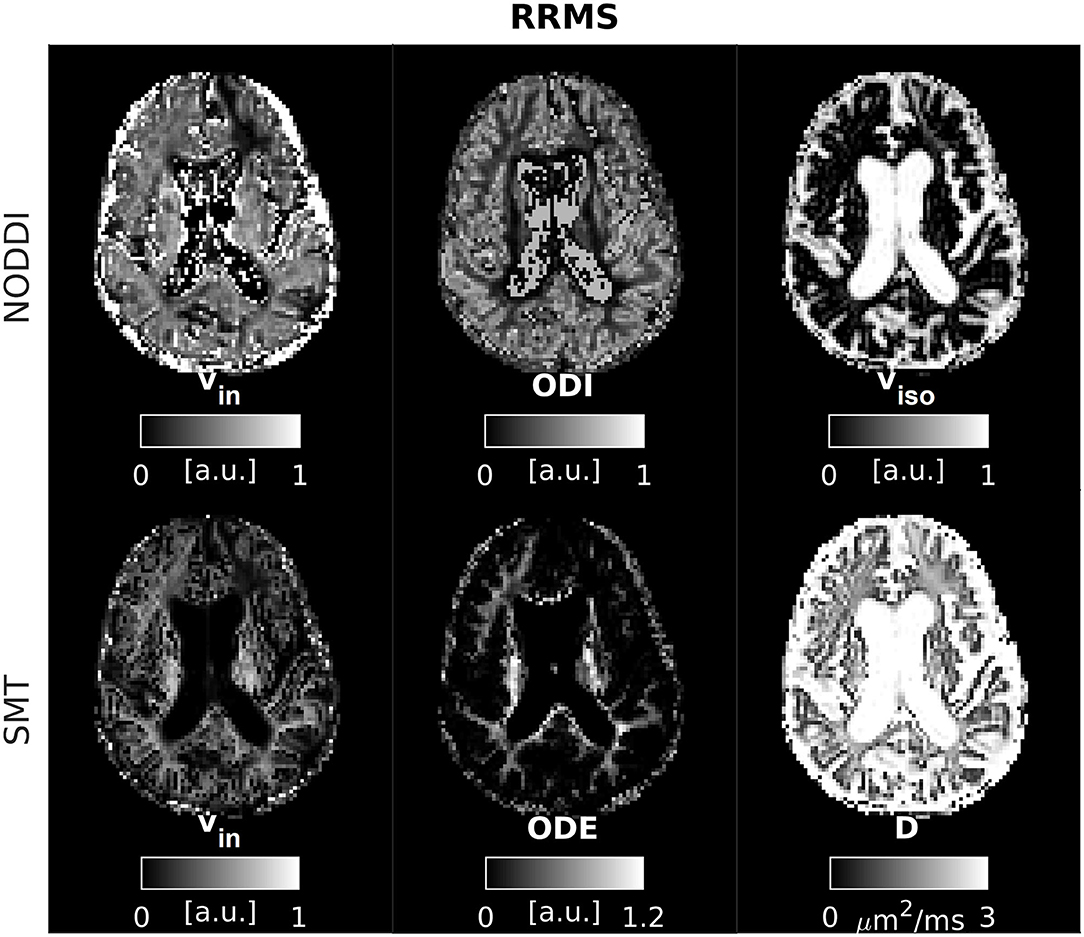
Figure 3. NODDI and SMT metrics as obtained from an MS patient. Top: NODDI (left: intra-neurite volume fraction vin; orientation dispersion index ODI; isotropic volume fraction viso); bottom: SMT (intra-neurite volume fraction vin; orientation dispersion entropy ODE; neural diffusivity D).
Tissue-Specific Distributions and Correlations
Supplementary Figure 1 shows tissue-specific distributions of all NODDI and SMT metrics. Between-tissue contrasts are apparent in all metrics, and agree well with previously reported numerical values (21, 25). NODDI vin and NODDI (1 – viso)vin show similar between-tissue contrasts as compared to SMT vin, while NODDI ODI show between-tissue contrasts that follow opposite directions as compared to SMT ODE. Numerical values of both NODDI vin and NODDI (1 – viso)vin are qualitatively higher than SMT vin in all tissues.
Figure 4 shows correlations between all possible pairs of MRI metrics, as evaluated on WM values (WM for controls, NAWM for patients, i.e., excluding lesions). NODDI and SMT metrics exhibit strong correlations with DTI indices, as well as with themselves. For example, NODDI viso is positively associated with all DTI diffusivities and with SMT neural tissue diffusivity D. NODDI vin is positively associated with FA and negatively associated with DTI AD, RD MD, while the opposite holds for ODI. For SMT, D is positively associated to NODDI viso, while both SMT ODE and viso are positively associated with DTI FA and negatively with DTI diffusivities. The strongest correlation for NODDI vin is with SMT vin (r = 0.72, p < 0.05), with NODDI vin also being the strongest correlate for SMT vin. The strongest correlates of NODDI ODI are DTI FA and SMT ODE (r = −0.83 with FA and r = −0.80 with ODE, p < 0.05). FA and NODDI ODI are the strongest correlates of SMT ODE (r = −0.78 with FA and r = −0.80 with ODE, p < 0.05).
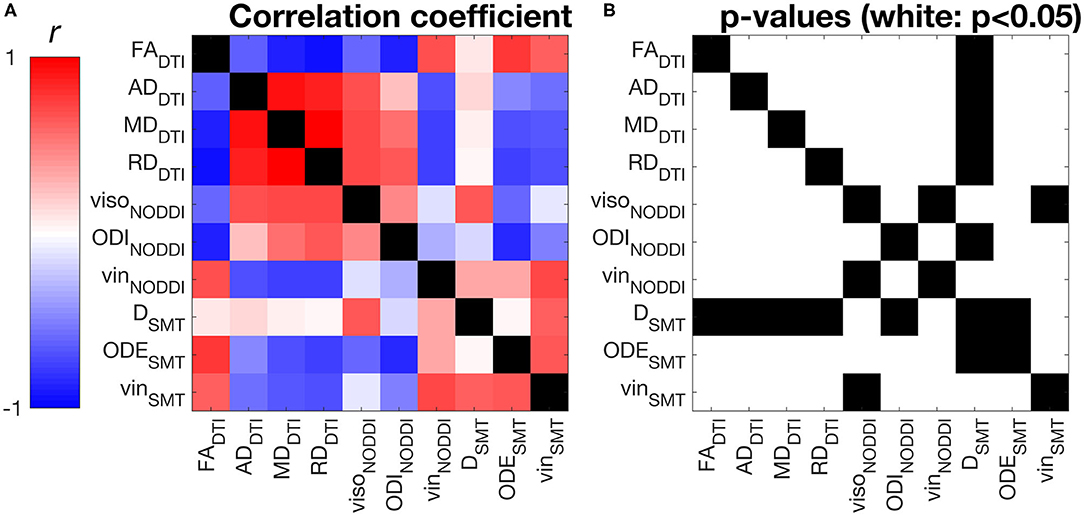
Figure 4. Pearson's linear correlation among all possible pairs of MRI metrics from DTI, NODDI and SMT. (A) correlation values illustrated as a 2D symmetric matrix (note its symmetry with respect to the diagonal) and calculated using the normal-appearing white matter (NAWM) mean values of the metrics (white matter for controls). (B) statistically significant correlations, highlighted in white (p < 0.05).
Association With Disability
Table 2 shows the association between EDSS and DTI, NODDI and SMT metric mean values in NAWM and within lesional WM. The table reports standardised coefficients, which are therefore comparable across metrics (the closer to 1 in absolute value, the stronger the association with EDSS). In NAWM, we observe significant associations for DTI metrics (negative association for FA; positive association for diffusivities) and NODDI (negative association for vin). In lesions, similar results are seen for DTI (negative association for FA; positive association for MD and RD) and NODDI (negative association for vin), while in this case also observe associations for SMT (positive association for ODE, negative for vin). DTI indices show the strongest association with EDSS in both NAWM and lesional WM.
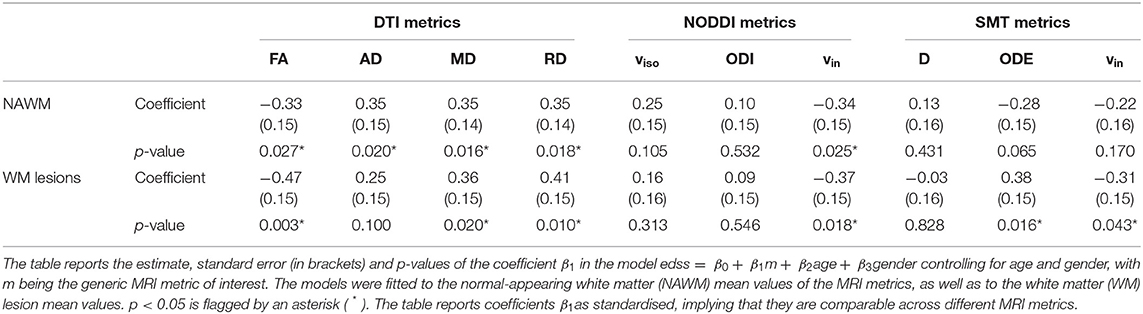
Table 2. Association between EDSS and DTI, NODDI and SMT metrics as obtained from linear regression models.
Group Comparison
Figure 5 shows the results of the voxel-wise patient-control comparison in MNI space. The figure illustrates voxels where significant differences between patients and controls are detected, colouring them according to the sign of the difference. Patient-control differences are observed mainly at the level of cerebral WM, although some scattered voxels are also observed in GM and in the cerebellum. For DTI, it is seen that FA is in general reduced in patients compared to controls, while AD, RD and MD are generally increased, although in some regions small clusters of decreased diffusivities are also seen. Both increases and decreases of NODDI viso and ODI and SMT D and ODE are seen, while both NODDI vin and SMT vin show extensive, widespread reductions in patients compared to controls.
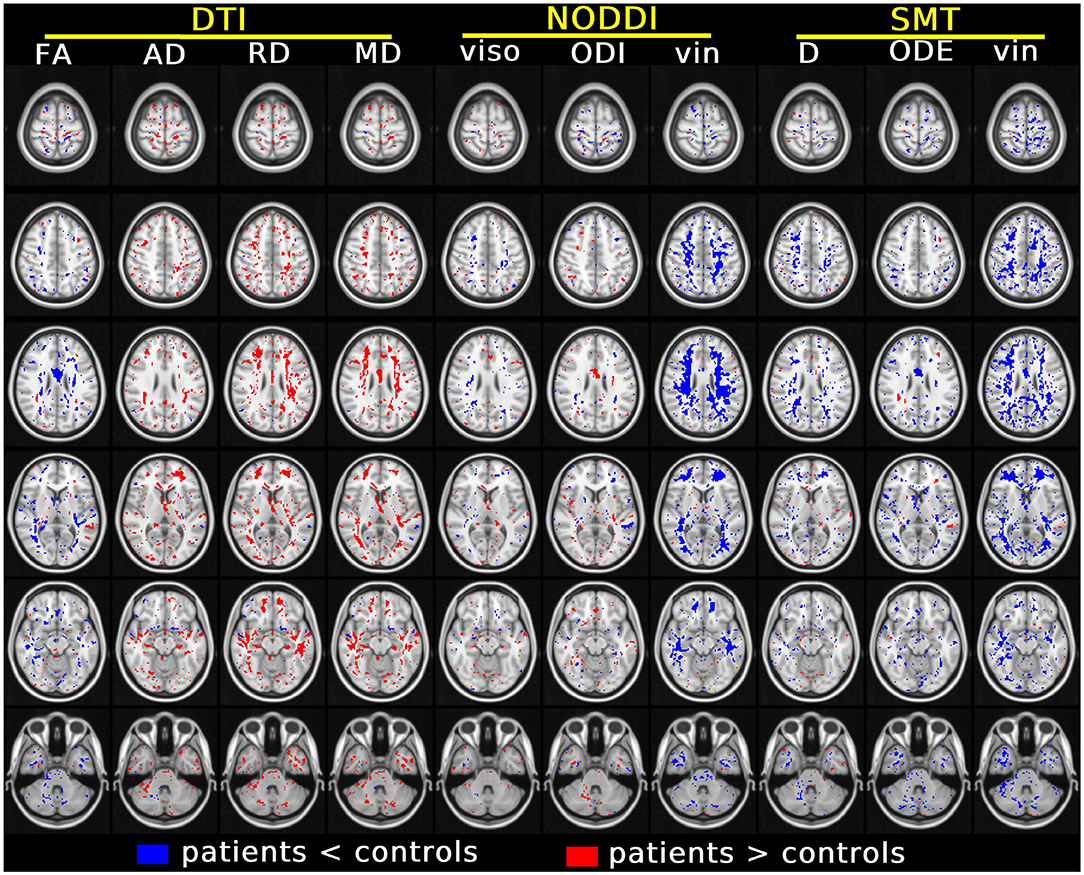
Figure 5. Results of the voxel-wise group comparison performed in MNI space. The figure visualises voxels at six different axial levels where a specific MRI metric from DTI, NODDI and SMT differs significantly between patients and controls (blue/red: metric from patients smaller/larger than controls). The model used for this comparison, in the form of m = β0 + β1group + β2age + β3gender with m being the generic MRI metric, adjusts for age and gender. In each MNI voxel, the model was fitted excluding measurements from focal lesions (i.e., including only normal-appearing tissues). A threshold of p < 0.05, correcting for multiple comparisons with the FSL fdr tool, was chosen for statistical significance. The figure shows voxels where β1 is statistically different from 0.
Table 3 reports the volume of the tissue in MNI space where significant patient-control differences were detected for all MRI metrics. The three metrics that detect differences in the largest portions of tissue are SMT vin (229.8 ml) and NODDI vin (217.5 ml) and DTI RD (141.5 ml). The three metrics that detect differences in the least volume of tissue are instead SMT ODE (87.4 ml), NODDI ODI (67.1 ml) and, above all, NODDI viso (62.0 ml).
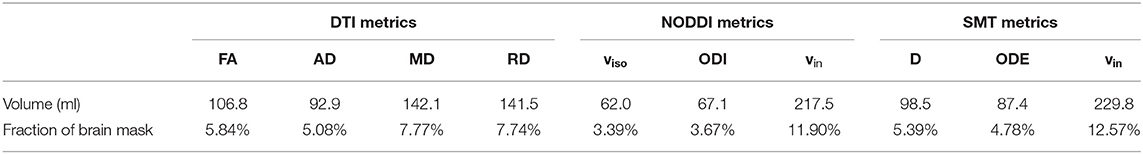
Table 3. Volume of tissue in MNI space exhibiting statistically significant differences between patients and controls for all MRI metrics (DTI, NODDI, and SMT).
Finally, Table 4 reports the spatial overlap of the areas where significant differences are detected, considering all possible pairs of MRI metrics. The largest overlap is seen for DTI FA and MD (0.71). For NODDI vin, the largest overlap is seen with SMT vin (0.42), while for SMT vin the largest overlap is the NODDI vin. For NODDI ODI, the largest overlaps are with DTI FA (0.36) and SMT ODE (0.31). Findings were similar for SMT ODE (overlap of 0.40 with FA and 0.31 with ODI). NODDI viso and SMT D are each the other's largest overlap (0.42).
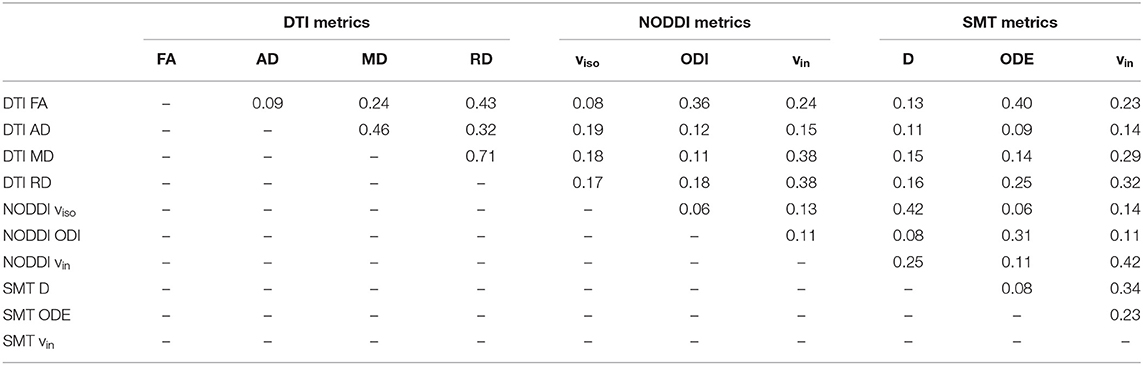
Table 4. Extent of the spatial overlap, measured by the Dice coefficient (0: no overlap; 1: full overlap), among areas exhibiting statistically significant patient-control differences for all MRI metrics (DTI, NODDI, and SMT).
Discussion
Summary
We have investigated the ability of two diffusion MRI-based techniques, NODDI and two-compartment SMT, to detect group differences between relapsing remitting MS and healthy controls as well as the association of their metrics to EDSS, a measure of physical disability. NODDI and SMT provide metrics with similar biological interpretation, obtained in different ways (i.e., different model assumptions and different parameter estimation approaches). To our knowledge this is the first time that the two techniques have been compared directly on the same MRI data acquired on a 3T clinical scanner in healthy controls and patients with MS.
Our main findings are that both NODDI and SMT detected differences in microstructure between MS patients and healthy controls. The two techniques provide metrics with similar biophysical interpretation that correlate strongly with each other. They generally concur on the nature of alterations seen to MS pointing toward similar pathological changes. Interestingly, SMT detected significant difference in patients vs. controls comparisons in a slightly higher proportion of voxels as compared to NODDI. Finally, the two techniques provide metrics that show an association to physical disability when evaluated across NAWM tissue (NODDI vin) and lesional WM (NODDI vin and SMT ODE and vin).
DTI Results
In this study we have considered DTI indices, namely FA, AD, RD and MD, as these provide a well-established reference to which the performance of NODDI and SMT can be compared. Our results concur with DTI's known sensitivity to MS pathology. DTI metrics reveal widespread differences in normal-appearing tissues between patients and controls, and show the strongest association to EDSS. All DTI diffusivities (e.g., AD, RD and MD) generally show an increase in patients compared to controls. This is in line with recent literature. For instance, in (19) increased DTI axial diffusivity ex vivo was seen, which was driven by a strong demyelination as seen in histology. In (33) increases in AD was seen in MS lesions as compared to corresponding healthy tissue in controls, while in (34) both increases and decreases of AD in the same cohort of MS patients were observed, compared to healthy controls.
NODDI Results
Our data is generally consistent with previous findings. For intra-neurite volume fraction vin, our results point toward reduction in this metric in both lesions and NAWM in RRMS patients compared with healthy controls. Such reductions are consistent with previous findings (20, 21, 23, 24), and may be indicative of diffuse axonal loss as well as secondary demyelination (19).
We also report changes in ODI in both NAWM and within lesions. Previous studies reported both increases and decreases of ODI in lesions (20, 23, 24). A possible explanation for such mixed results rests in the observation that studies reporting a decrease have either looked at lesions individually, comparing with healthy controls at the same anatomical location or may have been limited by smaller sample sizes. In addition, T2-hyperintense lesions possess pathological heterogeneity, ranging from active inflammation displaying gadolinium-enhancement, to T1-hypointense “black holes” and therefore have different underlying tissue microstructures. Here we detect changes in ODI that go in both directions (i.e., both increased and decreased ODI values as compared to controls). This suggests that in MS pathology it is possible that neurites can become either more coherently aligned or more dispersed as compared to healthy tissue, possibly reflecting different pathological mechanisms.
SMT Results and Comparison
Previous SMT work has focussed on intra-neurite volume fraction only and has reported reductions in white matter lesions in both the cervical spine (26) and cerebral white matter (25). A reduction in intra-neurite volume fraction in NAWM compared with healthy controls is seen in the cervical spine (26) but not in cerebral NAWM (25). We generally concur with these findings, although the discrepancy over intra-neurite volume fraction in NAWM may arise from differences between a region-of-interest (ROI) based approach, confined to the internal capsule, compared with our whole-brain, voxel-wise evaluation. Quantitative values of NODDI intra-neurite volume fraction vin appear qualitatively higher than SMT vin (Supplementary Figure 1). A similar trend is observed even after correcting NODDI vin for isotropic water partial volume (which is not modelled in SMT), i.e., when comparing regional values of NODDI (1 – viso)vin with SMT vin.
We observe increases and decreases in ODE that concur with the direction of the change of NODDI ODI (albeit with opposite sign, given the different metric definition). This finding gives confidence about the potential existence of multiple patterns of alteration of neurite fibre dispersion in MS, being observed in two independent techniques (NODDI and SMT).
Group Comparison
We compared values of all MRI metrics from DTI, NODDI and SMT between patients and controls in MNI space, excluding lesional voxels (i.e., considering only normal-appearing tissue). Our results demonstrate that all of DTI, NODDI and SMT detect widespread differences in normal-appearing tissue between the cohorts, implying that these techniques may play a role in the assessment of MS damage beyond focal lesions.
NODDI and SMT detect group-wise differences between MS patients and controls that go in the same direction and point toward the same underlying pathophysiological features. Our results also show that SMT detected alterations in a slightly larger portion of the brain compared to equivalent NODDI-derived metrics. We speculate that this difference may arise from the lower number of model assumptions in SMT compared with NODDI (e.g., no fixed value for average neural diffusivity; no fixed form for the neurite orientation distribution), or could be a secondary effect due to the lack of a third isotropic diffusion compartment in the signal model, which can capture several sources of local free water contamination. Moreover, our analysis shows that both increases and decreases in dispersion metrics (i.e., NODDI ODI and SMT ODE), NODDI isotropic volume fraction viso and SMT neural diffusivity D can be observed in MS patients compared with healthy controls.
Areas of increased viso and D in MS patients may be a secondary effect of atrophy, particularly where adjacent to CSF spaces, resulting from partial volume effects occurring more frequently in patients. Decreased SMT D is in general not mirrored by DTI diffusivities (AD, RD and MD). DTI diffusivities are known to be influenced by the underlying dispersion of neural fibres, and effect that by construction should be less strong on SMT D (as fibre dispersion effects are captured by SMT ODE). This implies that that D may capture alterations in diffusivity that are unconfounded by changes in orientation dispersion, unlike DTI diffusivities. Nonetheless, both SMT D and NODDI viso should be interpreted with considerable care. Estimating the intrinsic diffusivity of neural tissue is known to be a challenging task, and viso is known to be poorly reproducible and confounded by relaxation effects, being heavily T2-weighted (35), which may explain the high viso (up to 0.2) seen here in control WM. Finally, it should be remembered that NODDI and SMT are likely to exhibit different susceptibility to noise given their very different fitting strategies. This may affect the estimation of metrics such as viso and D. In future, we plan to employ computer simulation to characterise extensively the susceptibility to noise of the two techniques. Moreover, we remark that extensive histological validation based on multiple stainings in health and disease will be required for metrics such as NODDI viso and SMT D to elucidate the relationship with the underlying pathophysiology, given the lack of a direct, histological counterpart.
Importantly, it should be noted that in our case-control comparison, classes were slightly imbalanced (i.e., our cohort features approximately twice as many patients as controls). Tests show that the differences detected in this study are greatly preserved after matching the two group sizes by downsampling the patient group (Supplementary Figure 2). This confirms that the conclusions of this paper still hold despite the imbalance of our data set. In future, we will aim for a control group that more closely matches the characteristics of the patients' group.
Association With Disability
Having established the presence of group differences between MS patients and controls, we investigated the relationship between NODDI and SMT metrics and physical disability, as measured by the EDSS score. We used a linear regression model, adjusting for age and gender, to study the association between mean values of NODDI and SMT metrics obtained from NAWM and lesional tissue in standard MNI space. We detect a significant association between NODDI vin in NAWM and EDSS. We also detect a significant association between SMT vin and ODE mean values in WM lesions and EDSS. These results suggest that novel multi-shell multi-compartment models (e.g., NODDI and SMT) may be able to detect early, widespread alteration in axonal density and/or myelination (note that vin is sensitive to both) that play a crucial role in disability accumulation. Moreover, they may also be able to give new insight into the microstructural characteristics of existing focal damage, potentially providing useful information in practise settings to aid in stratifying patients, potentially and guiding treatment selection and prognosis. Our NODDI and SMT findings agree with previous literature, with a number of studies having reported the potential of microstructural diffusion MRI techniques to detect MS pathology and association to disability beyond focal damage (36, 37). They are also confirmed by DTI metrics, which exhibit strong associations with physical disability in our RRMS cohort (somewhat stronger than NODDI and SMT). All in all, our results point toward the utility of diffusion imaging in the MS clinic alongside routine anatomical imaging, which is crucial for accurate MS lesion detection. Lesion distribution heterogeneity may carry important clinical information per se, and could therefore provide descriptors of MS pathology that are complementary to the diffusion metrics focus of this study.
Diffusion MRI Metrics Correlation
In this study we have investigated the correlation among all possible pairs of diffusion MRI metrics considered in this study (DTI, NODDI and SMT metrics). The analysis shows that indices of intra-neurite volume fractions vin, derived independently from NODDI and SMT, correlate strongly with each other (Figure 4). Considering orientation dispersion metrics, it should be noted that NODDI ODI and SMT ODE measure different features of the underlying neurite orientation distributions, and therefore are not modelling the same physical quantity (Figure 4). Nonetheless, qualitative inspection of tissue-specific distributions (Supplementary Figure 1) and correlation analyses show that the information provided by ODI and ODE mirror each other. The two metrics appear approximately inversely proportional to each other and exhibit a strong negative linear correlation. Overall, our comparison suggests that NODDI and SMT metrics carry very similar information and are therefore likely to offer highly comparable descriptions of the underling tissue microstructure.
Moreover, our correlation analysis also demonstrates that NODDI and SMT are strongly correlated to DTI indices (e.g., strong, positive correlation between DTI FA and both NODDI vin and SMT vin; negative/positive correlation between DTI FA and NODDI ODI/SMT ODE). This finding can be understood by noting that metrics provided by multi-compartmental techniques such as NODDI and SMT are not only sensitive to the non-Gaussian characteristics of the diffusion process (emphasised at high b-value), but also to the Gaussian characteristics, i.e., on the diffusion tensor and on its metrics (e.g., FA, AD, RD and MD) (38). Nonetheless, we remark that methods such as NODDI and SMT aim to disentangle the different pathophysiological processes that underlying the observed changes in diffusion tensor characteristics (e.g., is a change in FA driven by a change in axonal density, axonal orientation configuration or both?), striving to improve the biological specificity of diffusion MRI.
Limitations
Firstly, we acknowledge that while both NODDI and SMT may be able to detect alterations due to microstructural pathology, they both provide estimates of neuronal tissue properties that are subject to biases, and therefore should be always interpreted with care (39, 40), especially in grey matter, where model biases and inaccuracies are the strongest (39, 41).
Secondly, our healthy control group was also not age-matched to the patient group, with a mean difference of around 10 years. In studies on the effects of increasing age on WM microstructure, widespread reductions in FA are observed to occur from early adulthood (42, 43). As both increases in orientation dispersion and reductions in intra-neurite volume can cause reductions in FA, this effect represents a potential confounding factor in this study. For this reason, we have included age as a regressor in all our MS-control comparisons and EDSS regressions (i.e., for all DTI, NODDI and SMT metrics), and made sure to report differences that appear to be statistically independent of age (Table 2 and Figure 5). Nonetheless, we acknowledge that further, non-linear effects may persist and influence our results (44, 45).
Finally, we acknowledge that several other different models could have been included in this comparison. We justify our choice of focussing on NODDI by pointing out that it is one of the most popular models for clinically feasible neurite density and morphology mapping, with a considerable literature establishing its use in MS (20, 21, 46). Similarly, SMT has been previously used in MS (25, 47) measures similar biophysical features and offers theoretical methodological advantages over NODDI. It is therefore scientifically relevant to investigate how its metrics relate to NODDI in the context of MS, at least in this first, exploratory comparison. Results from this study inform MS neurologists about the agreement of such popular techniques, providing them with useful information to interpret results that use either of the two techniques. In future, we plan to include additional techniques in similar comparisons (e.g., DKI, map-MRI).
Conclusions
To conclude, both NODDI and SMT detect white matter microstructural differences between MS patients and controls, showing alterations in indices representing the underlying density and orientation dispersion of neurites that correlate with disability. Importantly, NODDI and SMT metrics with similar biophysical interpretation are strongly correlated among each other, and provide results that go in the same direction, giving confidence to the comparability of findings between studies using these two techniques.
Data Availability Statement
The raw data supporting the conclusions of this article will be made available by the authors, without undue reservation.
Ethics Statement
The study was reviewed and approved by NHS Health Research Authority, NRES Committee London - City Road & Hampstead, References: 135700-CIS2014 (13/LO/1413), 13/0231-CIS2013 (13/LO/1762). The patients/participants provided their written informed consent to participate in this study.
Author Contributions
DJ: data analysis and experiment design. AR: data analysis/presentation and editor. WB and SC: image preparation, editor, and data acquisition. BK and FP: image preparation, editor, and data analysis. EK, AT, and DA: editor and experiment design. CG and OC: supervisor, senior editor, and experiment design. FG: data analysis/presentation, editor, and experiment design. All authors contributed to the article and approved the submitted version.
Funding
This study has received funding under the European Union's Horizon 2020 research and innovation programme under grant agreement No. 634541 (CDS-QuaMRI) and 666992. This study has also received support from the Engineering and Physical Sciences Research Council (EPSRC R006032/1, M020533/1, G007748, I027084, N018702), Spinal Research (UK), Wings for Life (Austria), Craig H. Neilsen Foundation (USA) for INSPIRED and UK Multiple Sclerosis Society (grants 892/08 and 77/2017). This study was supported by the National Institute for Health Research University College London Hospitals Biomedical Research Centre. FP was supported by a Guarantors of Brain post-doctoral non-clinical fellowship. AT was supported by an MRC grant (MR/S026088/1). EK was supported from the NIHR Great Ormond Street Hospital Biomedical Research Centre. FG was currently supported by the investigator-initiated PREdICT study at the Vall d'Hebron Institute of Oncology (Barcelona), funded by AstraZeneca and CRIS Cancer Foundation. AstraZeneca was not involved in the study design, collection, analysis, interpretation of data, the writing of this article or the decision to submit it for publication.
Conflict of Interest
FG is employed by the Vall d'Hebron Institute of Oncology (Barcelona, Spain) in a study funded by AstraZeneca (PREdICT). AstraZeneca was not involved in the study design, collection, analysis, interpretation of data, the writing of this article or the decision to submit it for publication.
The remaining authors declare that the research was conducted in the absence of any commercial or financial relationships that could be construed as a potential conflict of interest.
Supplementary Material
The Supplementary Material for this article can be found online at: https://www.frontiersin.org/articles/10.3389/fneur.2021.662855/full#supplementary-material
References
1. Basser PJ, Mattiello J, LeBihan D. MR diffusion tensor spectroscopy and imaging. Biophys J. (1994) 66:259–67. doi: 10.1016/S0006-3495(94)80775-1
2. O'Donnell LJ, Westin C-F. An introduction to diffusion tensor image analysis. Neurosurg Clin N Am. (2011) 22:185–96. doi: 10.1016/j.nec.2010.12.004
3. Goveas J, O'Dwyer L, Mascalchi M, Cosottini M, Diciotti S, De Santis S, et al. Diffusion-MRI in neurodegenerative disorders. Magn Reson Imaging. (2015) 33:853–76. doi: 10.1016/j.mri.2015.04.006
4. Farquharson S, Tournier J-D, Calamante F, Fabinyi G, Schneider-Kolsky M, Jackson GD, et al. White matter fiber tractography: why we need to move beyond DTI. J Neurosurg JNS. (2013) 118:1367–77. doi: 10.3171/2013.2.JNS121294
5. Assaf Y, Basser PJ. Composite hindered and restricted model of diffusion (CHARMED) MR imaging of the human brain. Neuroimage. (2005) 27:48–58. doi: 10.1016/j.neuroimage.2005.03.042
6. Fieremans E, Jensen JH, Helpern JA. White matter characterization with diffusional kurtosis imaging. Neuroimage. (2011) 58:177–88. doi: 10.1016/j.neuroimage.2011.06.006
7. Jensen JH, Helpern JA, Ramani A, Lu H, Kaczynski K. Diffusional kurtosis imaging: the quantification of non-gaussian water diffusion by means of magnetic resonance imaging. Magn Reson Med. (2005) 53:1432–40. doi: 10.1002/mrm.20508
8. Jespersen SN, Bjarkam CR, Nyengaard JR, Chakravarty MM, Hansen B, Vosegaard T, et al. Neurite density from magnetic resonance diffusion measurements at ultrahigh field: comparison with light microscopy and electron microscopy. Neuroimage. (2010) 49:205–16. doi: 10.1016/j.neuroimage.2009.08.053
9. Novikov DS, Veraart J, Jelescu IO, Fieremans E. Rotationally-invariant mapping of scalar and orientational metrics of neuronal microstructure with diffusion MRI. Neuroimage. (2018) 174:518–38. doi: 10.1016/j.neuroimage.2018.03.006
10. Ning L, Gagoski B, Szczepankiewicz F, Westin C, Rathi Y. Joint relaxation-diffusion imaging moments to probe neurite microstructure. IEEE Trans Med Imaging. (2020) 39:668–77. doi: 10.1109/TMI.2019.2933982
11. Lampinen B, Szczepankiewicz F, Mårtensson J, van Westen D, Hansson O, Westin C-F, et al. Towards unconstrained compartment modeling in white matter using diffusion-relaxation MRI with tensor-valued diffusion encoding. Magn Reson Med. (2020) 84:1605–23. doi: 10.1002/mrm.28216
12. Zhang H, Schneider T, Wheeler-Kingshott CA, Alexander DC. NODDI: practical in vivo neurite orientation dispersion and density imaging of the human brain. Neuroimage. (2012) 61:1000–16. doi: 10.1016/j.neuroimage.2012.03.072
13. Kaden E, Kruggel F, Alexander DC. Quantitative mapping of the per-axon diffusion coefficients in brain white matter. Magn Reson Med. (2016) 75:1752–63. doi: 10.1002/mrm.25734
14. Kaden E, Kelm ND, Carson RP, Does MD, Alexander DC. Multi-compartment microscopic diffusion imaging. Neuroimage. (2016) 139:346–59. doi: 10.1016/j.neuroimage.2016.06.002
15. Kamm CP, Uitdehaag BM, Polman CH. Multiple sclerosis: current knowledge and future outlook. Eur Neurol. (2014) 72:132–41. doi: 10.1159/000360528
16. Tóth E, Szabó N, Csete G, Király A, Faragó P, Spisák T, et al. Gray matter atrophy is primarily related to demyelination of lesions in multiple sclerosis: a diffusion tensor imaging MRI study. Front Neuroanat. (2017) 11:23. doi: 10.3389/fnana.2017.00023
17. Sbardella E, Tona F, Petsas N, Pantano P. DTI measurements in multiple sclerosis: evaluation of brain damage and clinical implications. Mult Scler Int. (2013) 2013:671730. doi: 10.1155/2013/671730
18. Roosendaal SD, Geurts JJG, Vrenken H, Hulst HE, Cover KS, Castelijns JA, et al. Regional DTI differences in multiple sclerosis patients. Neuroimage. (2009) 44:1397–403. doi: 10.1016/j.neuroimage.2008.10.026
19. Grussu F, Schneider T, Tur C, Yates RL, Tachrount M, Ianus A, et al. Neurite dispersion: a new marker of multiple sclerosis spinal cord pathology? Ann Clin Transl Neurol. (2017) 4:663–79. doi: 10.1002/acn3.445
20. Granberg T, Fan Q, Treaba CA, Ouellette R, Herranz E, Mangeat G, et al. In vivo characterization of cortical and white matter neuroaxonal pathology in early multiple sclerosis. Brain. (2017) 140:2912–26. doi: 10.1093/brain/awx247
21. Collorone S, Cawley N, Grussu F, Prados F, Tona F, Calvi A, et al. Reduced neurite density in the brain and cervical spinal cord in relapsing–remitting multiple sclerosis: a NODDI study. Mult Scler J. (2020) 26:1647–57. doi: 10.1177/1352458519885107
22. Timmers I, Roebroeck A, Bastiani M, Jansma B, Rubio-Gozalbo E, Zhang H. Assessing microstructural substrates of white matter abnormalities: a comparative study using DTI and NODDI. PLoS ONE. (2016) 11:e0167884. doi: 10.1371/journal.pone.0167884
23. Schneider T, Brownlee W, Zhang H, Ciccarelli O, Miller DH, Wheeler-Kingshott CG. Sensitivity of multi-shell NODDI to multiple sclerosis white matter changes: a pilot study. Funct Neurol. (2017) 32:97–101. doi: 10.11138/FNeur/2017.32.2.097
24. De Santis S, Bastiani M, Droby A, Kolber P, Zipp F, Pracht E, et al. Characterizing microstructural tissue properties in multiple sclerosis with diffusion MRI at 7T and 3T: the impact of the experimental design. Neuroscience. (2019) 403:17–26. doi: 10.1016/j.neuroscience.2018.03.048
25. Bagnato F, Franco G, Li H, Kaden E, Ye F, Fan R, et al. Probing axons using multi-compartmental diffusion in multiple sclerosis. Ann Clin Transl Neurol. (2019) 6:1595–605. doi: 10.1002/acn3.50836
26. By S, Xu J, Box BA, Bagnato FR, Smith SA. Multi-compartmental diffusion characterization of the human cervical spinal cord in vivo using the spherical mean technique. NMR Biomed. (2018) 31:e3894. doi: 10.1002/nbm.3894
27. Brownlee WJ, Solanky B, Prados F, Yiannakas M, Da Mota P, Riemer F, et al. Cortical grey matter sodium accumulation is associated with disability and secondary progressive disease course in relapse-onset multiple sclerosis. J Neurol Neurosurg Psychiatry. (2019) 90:755–60. doi: 10.1136/jnnp-2018-319634
28. Andersson JLR, Sotiropoulos SN. An integrated approach to correction for off-resonance effects and subject movement in diffusion MR imaging. Neuroimage. (2016) 125:1063–78. doi: 10.1016/j.neuroimage.2015.10.019
29. Microstructure Imaging Group. NODDI Matlab Toolbox. Available from: http://mig.cs.ucl.ac.uk/index.php?n=Tutorial.NODDImatlab (accessed May 29, 2021).
30. Kaden E. Spherical Mean Technique. Available from: https://github.com/ekaden/smt (accessed May 29, 2021).
31. Cardoso MJ, Modat M, Wolz R, Melbourne A, Cash D, Rueckert D, et al. Geodesic information flows: spatially-variant graphs and their application to segmentation and fusion. IEEE Trans Med Imaging. (2015) 34:1976–88. doi: 10.1109/TMI.2015.2418298
32. Dice LR. Measures of the amount of ecologic association between species. Ecology. (1945) 26:297–302. doi: 10.2307/1932409
33. Klistorner A, Wang C, Yiannikas C, Parratt J, Barton J, You Y, et al. Diffusivity in the core of chronic multiple sclerosis lesions. PLoS ONE. (2018) 13:e0194142. doi: 10.1371/journal.pone.0194142
34. Preziosa P, Rocca MA, Mesaros S, Pagani E, Stosic-Opincal T, Kacar K, et al. Intrinsic damage to the major white matter tracts in patients with different clinical phenotypes of multiple sclerosis: a voxelwise diffusion-tensor MR study. Radiology. (2011) 260:541–50. doi: 10.1148/radiol.11110315
35. Gong T, Tong Q, He H, Sun Y, Zhong J, Zhang H. MTE-NODDI: Multi-TE NODDI for disentangling non-T2-weighted signal fractions from compartment-specific T2 relaxation times. Neuroimage. (2020) 217:116906. doi: 10.1016/j.neuroimage.2020.116906
36. Ciccarelli O, Werring DJ, Wheeler–Kingshott CAM, Barker GJ, Parker GJM, Thompson AJ, et al. Investigation of MS normal-appearing brain using diffusion tensor MRI with clinical correlations. Neurology. (2001) 56:926–33. doi: 10.1212/WNL.56.7.926
37. de Kouchkovsky I, Fieremans E, Fleysher L, Herbert J, Grossman RI, Inglese M. Quantification of normal-appearing white matter tract integrity in multiple sclerosis: a diffusion kurtosis imaging study. J Neurol. (2016) 263:1146–55. doi: 10.1007/s00415-016-8118-z
38. Jespersen SN, Leigland LA, Cornea A, Kroenke CD. Determination of axonal and dendritic orientation distributions within the developing cerebral cortex by diffusion tensor imaging. IEEE Trans Med Imaging. (2012) 31:16–32. doi: 10.1109/TMI.2011.2162099
39. Lampinen B, Szczepankiewicz F, Mårtensson J, van Westen D, Sundgren PC, Nilsson M. Neurite density imaging versus imaging of microscopic anisotropy in diffusion MRI: a model comparison using spherical tensor encoding. Neuroimage. (2017) 147:517–31. doi: 10.1016/j.neuroimage.2016.11.053
40. Jelescu IO, Veraart J, Fieremans E, Novikov DS. Degeneracy in model parameter estimation for multi-compartmental diffusion in neuronal tissue. NMR Biomed. (2016) 29:33–47. doi: 10.1002/nbm.3450
41. Henriques RN, Jespersen SN, Shemesh N. Microscopic anisotropy misestimation in spherical-mean single diffusion encoding MRI. Magn Reson Med. (2019) 81:3245–61. doi: 10.1002/mrm.27606
42. Rathee R, Rallabandi VPS, Roy PK. Age-related differences in white matter integrity in healthy human brain: evidence from structural Mri and diffusion tensor imaging. Magn Reson Insights. (2016) 9:MRI.S39666. doi: 10.4137/MRI.S39666
43. Giorgio A, Santelli L, Tomassini V, Bosnell R, Smith S, De Stefano N, et al. Age-related changes in grey and white matter structure throughout adulthood. Neuroimage. (2010) 51:943–51. doi: 10.1016/j.neuroimage.2010.03.004
44. Hsu J-L, Leemans A, Bai C-H, Lee C-H, Tsai Y-F, Chiu H-C, et al. Gender differences and age-related white matter changes of the human brain: a diffusion tensor imaging study. Neuroimage. (2008) 39:566–77. doi: 10.1016/j.neuroimage.2007.09.017
45. Salat DH, Tuch DS, Greve DN, van der Kouwe AJW, Hevelone ND, Zaleta AK, et al. Age-related alterations in white matter microstructure measured by diffusion tensor imaging. Neurobiol Aging. (2005) 26:1215–27. doi: 10.1016/j.neurobiolaging.2004.09.017
46. Collorone S, Prados F, Kanber B, Cawley NM, Tur C, Grussu F, et al. Brain microstructural and metabolic alterations detected in vivo at onset of the first demyelinating event. Brain. (2021). doi: 10.1093/brain/awab043
Keywords: multiple sclerosis, spherical mean technique, neurite orientation dispersion and density imaging, MNI space, diffusion MRI, microstructure
Citation: Johnson D, Ricciardi A, Brownlee W, Kanber B, Prados F, Collorone S, Kaden E, Toosy A, Alexander DC, Gandini Wheeler-Kingshott CAM, Ciccarelli O and Grussu F (2021) Comparison of Neurite Orientation Dispersion and Density Imaging and Two-Compartment Spherical Mean Technique Parameter Maps in Multiple Sclerosis. Front. Neurol. 12:662855. doi: 10.3389/fneur.2021.662855
Received: 01 February 2021; Accepted: 17 May 2021;
Published: 14 June 2021.
Edited by:
Itamar Ronen, Leiden University Medical Center, NetherlandsReviewed by:
Henrik Lundell, Copenhagen University Hospital, DenmarkNagesh Adluru, University of Wisconsin-Madison, United States
Thijs Dhollander, Royal Children's Hospital, Australia
Copyright © 2021 Johnson, Ricciardi, Brownlee, Kanber, Prados, Collorone, Kaden, Toosy, Alexander, Gandini Wheeler-Kingshott, Ciccarelli and Grussu. This is an open-access article distributed under the terms of the Creative Commons Attribution License (CC BY). The use, distribution or reproduction in other forums is permitted, provided the original author(s) and the copyright owner(s) are credited and that the original publication in this journal is cited, in accordance with accepted academic practice. No use, distribution or reproduction is permitted which does not comply with these terms.
*Correspondence: Daniel Johnson, ZGFuaWVsLmpvaG5zb24xNkBuaHMubmV0
†These authors have contributed equally to this work