 Yurika Numata-Uematsu1
 Mitsugu Uematsu1*
 Rie Sakuraba2
 Masaki Iwasaki3,4
 Shinichiro Osawa3
 Kazutaka Jin2
 Nobukazu Nakasato2
 Shigeo Kure1
- 1Department of Pediatrics, Tohoku University School of Medicine, Sendai, Japan
- 2Department of Epileptology, Tohoku University School of Medicine, Sendai, Japan
- 3Department of Neurosurgery, Tohoku University School of Medicine, Sendai, Japan
- 4Department of Neurosurgery, National Center Hospital of Neurology and Psychiatry, Tokyo, Japan
Objective: Accurate estimation of the epileptogenic zone (EZ) is essential for favorable outcomes in epilepsy surgery. Conventional ictal electrocorticography (ECoG) onset is generally used to detect the EZ but is insufficient in achieving seizure-free outcomes. By contrast, high-frequency oscillations (HFOs) could be useful markers of the EZ. Hence, we aimed to detect the EZ using interictal spikes and investigated whether the onset area of interictal spike-related HFOs was within the EZ.
Methods: The EZ is considered to be included in the resection area among patients with seizure-free outcomes after surgery. Using a complex demodulation technique, we developed a method to determine the onset channels of interictal spike-related ripples (HFOs of 80–200 Hz) and investigated whether they are within the resection area.
Results: We retrospectively examined 12 serial patients who achieved seizure-free status after focal resection surgery. Using the method that we developed, we determined the onset channels of interictal spike-related ripples and found that for all 12 patients, they were among the resection channels. The onset frequencies of ripples were in the range of 80–150 Hz. However, the ictal onset channels (evaluated based on ictal ECoG patterns) and ripple onset channels coincided in only 3 of 12 patients.
Conclusions: Determining the onset area of interictal spike-related ripples could facilitate EZ estimation. This simple method that utilizes interictal ECoG may aid in preoperative evaluation and improve epilepsy surgery outcomes.
Introduction
The epileptogenic zone (EZ) is characterized by excessive synchronization at seizure onset (1). It is generally located within the resection region following surgery and has seizure freedom (2, 3). The identification of the EZ, including the seizure onset zone (SOZ) (4), and the complete resection thereof are essential for improving epilepsy seizure outcomes. The area with the earliest ictal electrocorticography (ECoG) change is currently used to detect the SOZ (5). However, resection of the EZ identified based on ictal ECoG patterns leads to a seizure-free outcome in only about 60% of patients who undergo epilepsy surgery (6, 7). In an effort to improve seizure outcomes, many studies have reported that brain regions with high-frequency oscillations (HFOs; >80 Hz gamma oscillation activity) during ictus are likely within the EZ (8–10). Ictal direct current shifts preceding HFOs have recently been reported to be useful for EZ detection (11, 12).
As seizures are infrequent in some cases, recording ictal events can be difficult. Further, it remains unclear whether resection of the onset foci of interictal spikes would improve surgical outcomes (13). Some studies have identified the EZ using interictal HFOs (14–16), which are reportedly more specific than spikes for localizing the SOZ and show a good correlation with postsurgical outcomes in patients with epilepsy (5, 17, 18).
Nevertheless, a recent prospective multicenter trial reported that interictal HFOs do not predict postsurgical seizure outcomes (19). Gamma activity, including HFOs, is observed in a wide range of areas in the normal brain, including the eloquent area (20). Moreover, as interictal epileptic discharges propagate, it is necessary to consider which characteristic spikes or HFOs should be analyzed. Tamilia et al. recently reported that resecting areas with interictal HFO onset improved the prognosis of epileptic seizures (21). Although that study was concerned with interictal HFOs, physiological gamma activity was not ruled out. Wang et al. also reported that HFOs occurring simultaneously with epileptic spikes could be used to exclude physiological HFOs (22). However, the degree of spike-related high-frequency power augmentation failed to differentiate between SOZ and non-SOZ (23).
In the present study, we hypothesized that the onset area of ripples (HFOs of 80–200 Hz) related to interictal spikes propagating among electrodes could facilitate the detection of the EZ. To explore this hypothesis, we developed a method to determine the onset area of interictal spike-related ripples. Then, among patients who underwent surgical resection and achieved seizure-free outcomes, we retrospectively examined the relationship between ripple onset and the resection area, including the EZ.
Materials and Methods
Between July 2011 and June 2014, we retrospectively identified patients with medically intractable epilepsy who underwent intracranial EEG monitoring and focal resective surgery within the Tohoku University Hospital Comprehensive Epilepsy Program who met the following inclusion criteria: resective surgery performed after intracranial EEG monitoring, with available postsurgical seizure outcome after 2 years, without seizure recurrence for 2 years after surgery, without previous brain surgery, and with a spike observed in the intracranial EEG. This study was approved by the Tohoku University Hospital Institutional Review Board (protocol numbers: A2017-028 and 2020-1-083). Informed consent was obtained from the patients or their guardians (for pediatric patients).
Implantation of Intracranial Electrodes
Intracranial electrodes were implanted to monitor the epileptogenic area using scalp video-EEG recording, magnetic resonance imaging (MRI), and positron emission tomography (PET). Electrodes were implanted under general anesthesia guided by a neuro-navigation system (Brainlab AG, Feldkirchen, Germany). Subdural or strip electrodes, consisting of 2.3-mm-diameter platinum disk, exposed the area at an interelectrode distance of 10 mm (Ad-Tech Medical Instrument Corporation, Racine, WI, USA). Depth electrodes were inserted using a frameless stereotactic system (VarioGuide™; Brainlab AG). Depth electrodes were cylindrical platinum contacts 1.3 mm in length and 1.1 mm in diameter (Ad-Tech Medical Instrument Corporation). All electrode contacts were spaced at intervals of 5–15 mm.
Extraoperative ECoG and EEG Recordings
Extraoperative video-ECoG recordings were obtained for 14 days using a Neurofax EEG-1200 instrument (Nihon-Koden Co., Tokyo, Japan). The sampling frequency was set at 1,000 Hz and the amplifier bandpass was at 0.08–300 Hz. For sleep staging, scalp electrodes were attached to 21 locations according to the International 10–20 system with electromyography (EMG)/electrooculography (EOG). For EMG, two electrodes were attached to the skin overlying the mentalis muscle. Two additional electrodes were attached to the left eye (upper left) and right eye (lower right) for electrooculography.
Anatomical Locations of Electrodes and Surgical Resection
Three-dimensional computed tomography (3D-CT) and three-dimensional magnetization-prepared rapid-gradient echo (3D-MPRAGE) imaging were performed before electrode implantation and on day 7 after electrode implantation. These images were co-registered by linear affine transformation using Amira version 5 (Visualization Sciences Group, Inc., Burlington, MA, USA). Postoperative 3D-MPRAGE images were co-registered with the preoperative 3D-MPRAGE image and CT scan. The area of surgical resection and the relationship to the electrode location were visualized on the fusion image. Presurgical evaluation of the SOZ and resection area was performed by multiple epileptologists and epilepsy surgeons during a case review meeting.
Markers of Interictal Spike Onset
ECoG recordings were visually reviewed to identify interictal epileptic spikes. For this analysis, ECoG segments were chosen during the non-REM sleep state without ictus to avoid contamination with motion artifacts. Periods of non-REM sleep were identified using scalp EEG, EMG, and EOG, as previously described (17).
Interictal spikes were observed in the implanted channels. Three or fewer channels were selected in which frequent typical spikes with negative peaks were observed around the suspected SOZ. In each channel and spike set, 30 or more single spikes with almost the same morphology were visually marked at the point when the negative spike emerged from the baseline (Figure 1A). To ensure that the segments of the spectral analysis contained only one spike and its related spectral changes, only spikes with a minimum interspike interval of 500 ms were selected. For this reason, channels with continuous spiking or predominantly polyspike activity were excluded.
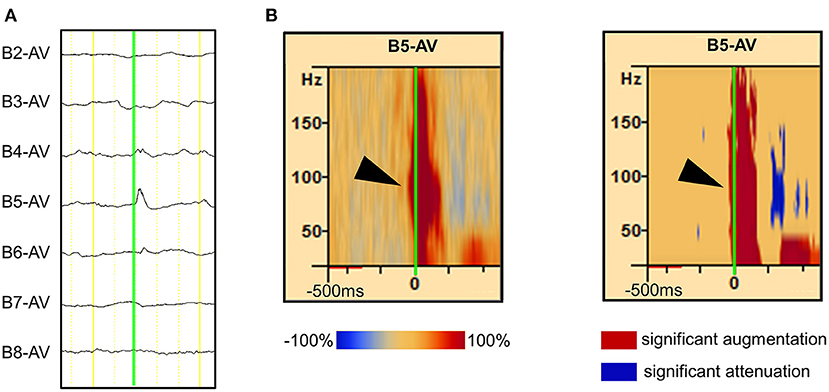
Figure 1. Detection of spike-related high-frequency oscillations (HFOs) using the BESA® software. (A) The rising edge of the negative spike is marked (green line) in the channel of interest [channel (Ch) B5 is used as an example in this figure]. More than 30 spikes were marked in the same channel. (B, left) The average HFO augmentation associated with the spikes was analyzed using BESA®. Within the square, the “percentage augmentation” of the Ch B5 spike-related HFOs relative to the reference (300–500 ms prior to the spike, red bar) is shown, ranging from −100% (blue) to +100% (red). The earliest HFO augmentation was observed between 80 and 150 Hz (arrowhead). (B, right) The blue color indicates the significant attenuation and the red color indicates the significant augmentation of amplitude in a given time–frequency bin relative to the reference period. The analysis was done using studentized bootstrap statistics. The corrected α level was set to 0.05.
Analysis of Interictal Spike-Related Gamma Activity
Visual detection of HFOs is challenging because they can have irregular amplitudes owing to the filtering of sharp epileptiform spikes (24). Generally, HFOs exhibiting at least four oscillations in the unfiltered signal, with an isolated peak in the time–frequency plane (blob), were considered as class 1 gamma activity events (Supplementary Figure 1A); and those with fewer than four oscillations or without blobs, were considered class 2 gamma activity events (Supplementary Figure 1B). In previous reports, class 2 gamma activity events were excluded because they may contain artifacts (25, 26). In the present study, class 1 gamma activity was defined as HFOs and further analyses were performed.
Each ECoG trial containing interictal spikes was transformed into the time–frequency domain using a complex demodulation technique applied using the BESA® EEG V.5.1.8 software (BESA GmbH, Gräfelfing, Germany) (27, 28). The time–frequency transformation was obtained by multiplying the time domain signal with a complex exponential, followed by a low-pass filter. The low-pass filter used here was a finite impulse response filter with a Gaussian shape, rendering the complex demodulation effectively equivalent to a Gabor transform. For each trial, an ECoG signal was assigned an amplitude (a measure proportional to the square root of the power) as a function of time and frequency for each trial. Ripples were reported to have earlier ictal augmentation than those of <80 and >200 Hz (29). We did not analyze the HFOs above 200 Hz as it would be inaccurate, since the sampling frequency of the present study was set at 1,000 Hz. Time–frequency transformation was performed for frequencies between 20 and 200 Hz and latencies between −500 and 500 ms, relative to the onset of interictal spikes in steps of 10 Hz and 5 ms, respectively. For each time–frequency bin, we calculated the percent change in amplitude (averaged across trials) relative to the mean amplitude in a reference period of 300–500 ms prior to the onset of interictal spikes (Figure 1B, left). This change in amplitude has been termed temporal spectral evolution (TSE) (30). The TSE values were subjected to statistical tests using the BESA software (31–33). First, studentized bootstrap statistics were applied to obtain an uncorrected p-value for each time–frequency bin. This test compared the amplitude in each time–frequency bin with the average amplitude in the reference time period of the corresponding frequency. Second, correction for multiple testing was applied to these uncorrected p-values, to account for the fact that the TSE values in the neighboring time bins are partially dependent. For this purpose, a modified Bonferroni correction with a corrected α level of 0.05 was used (34). In all figures, blue indicates attenuation of amplitude, and red indicates augmentation of amplitude in the corresponding time–frequency bin relative to the reference period (Figure 1B, right).
We determined the proportion of sites showing significant amplitude modulation (at least 40 Hz in width and 20 ms in duration) in each patient (35). This correction has a very low probability of a Type I error when determining cortical activation or deactivation. We acknowledge that this analysis may underestimate gamma modulations when there is a restricted frequency band (<40 Hz in width) or signals of very short duration (<20 ms). Previous studies using scalp EEG recordings revealed augmentation of narrow-range gamma-band oscillations at ~40 Hz (36), whereas event-related gamma modulations observed in intracranial ECoG studies commonly involved frequency bands up to 20 Hz in width (37, 38). In the present study using ECoG, we defined at least 40 Hz in width and 20 ms in duration as significant gamma oscillation activity, which is more reliable for analyzing EZ than 20 Hz in width and 20 ms in duration.
In this study, the selection of electrode channels, marking of spikes, and analysis of ripple onset channels were performed by researchers who have not participated in the presurgical evaluation.
Results
Patient Characteristics
We studied consecutive records of 12 of the 26 patients who satisfied the inclusion criteria and underwent intracranial EEG monitoring during this period. The remaining 14 patients were excluded due to residual seizures (12 patients), few spikes during ECoG monitoring (1 patient), and no surgical resection (1 patient). Patients who did not become seizure-free after epilepsy surgery were excluded from this study because it was presumed that the EZ was not fully included within the implanted intracranial electrodes. The patients' clinical characteristics, including age at surgery, pathological findings, location and number of implanted electrodes, number of seizure onset electrodes, number of marked spikes, number of ripple-onset electrodes, and number of resection electrodes are summarized in Table 1. Surgical resection was performed on patients aged 14–39 years (median age, 31 years). In 10 patients, an abnormal brain lesion was detected on MRI: three patients had focal cortical dysplasia (FCD), two had hippocampal atrophy, one had FCD and hippocampal atrophy, one had tuberous sclerosis, one had trauma and hippocampal atrophy, one had hippocampal atrophy and a parahippocampal cystic lesion, and one had an amygdala enlargement. The two remaining patients had no abnormal MRI findings, with or without focal hypometabolism on PET. The pathological findings of the resected specimens from the 12 patients were FCD (n = 5), FCD and hippocampal sclerosis (n = 3), cortical tuber (n = 1), hippocampal sclerosis (n = 1), oligodendroglioma (n = 1), and inflammatory changes (n = 1). Nine of the 12 patients had undergone temporal lobectomy, and eight had also undergone hippocampal resection (Supplementary Table 1).
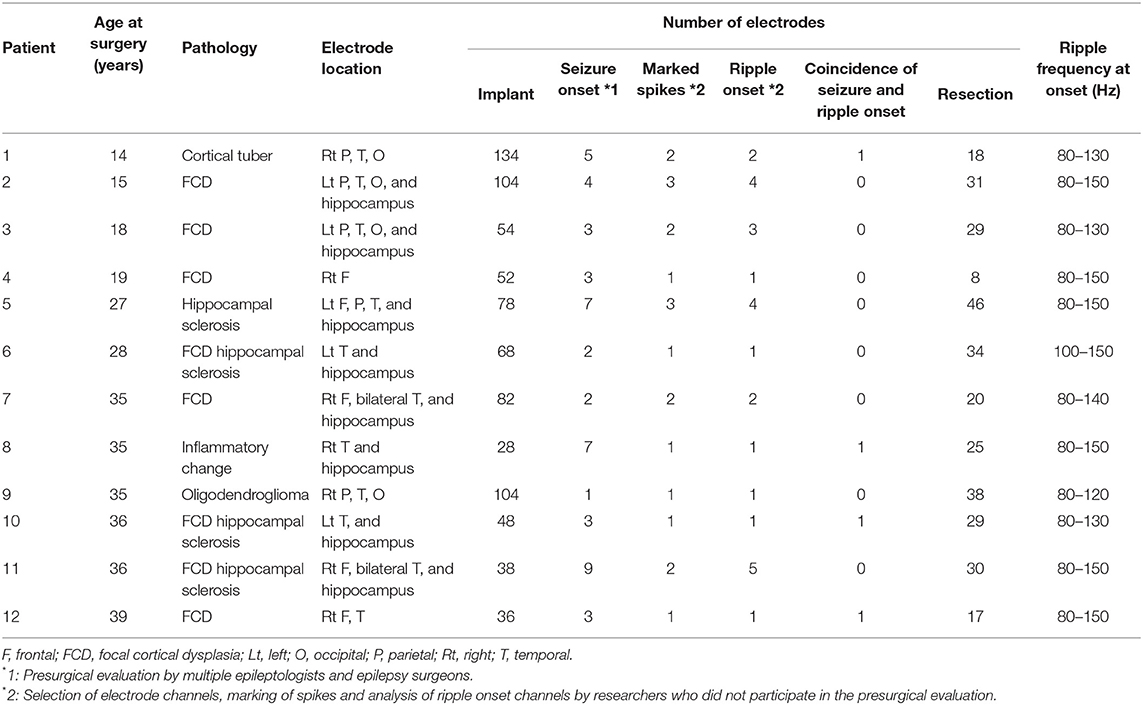
Table 1. Patients' characteristics and implanted electrodes data.
Measurement of the Gamma-Onset Channel Relative to Interictal Spikes
Interictal epileptic spikes and gamma activity propagate from the epileptic focus when epileptic excitability occurs in the EZ. First, we investigated whether the identification of onset electrodes of spike-related gamma activity using our method could be altered by the selected electrode in a spike that spreads from one focus to multiple electrodes. We placed “tags” on the rising edge of each spike propagating across multiple electrodes. Time–frequency analysis conducted using the BESA software showed that the same channel always had the shortest gamma latency (Figure 2A). This result showed that, in the case of spikes emanating from one epileptic focus, the gamma-onset channel can be accurately identified by marking any channel over which the spikes spread. According to the results of the visual analysis, the earliest HFO augmentation was mostly in the range of 80–150 Hz (Figures 1B, 2B).
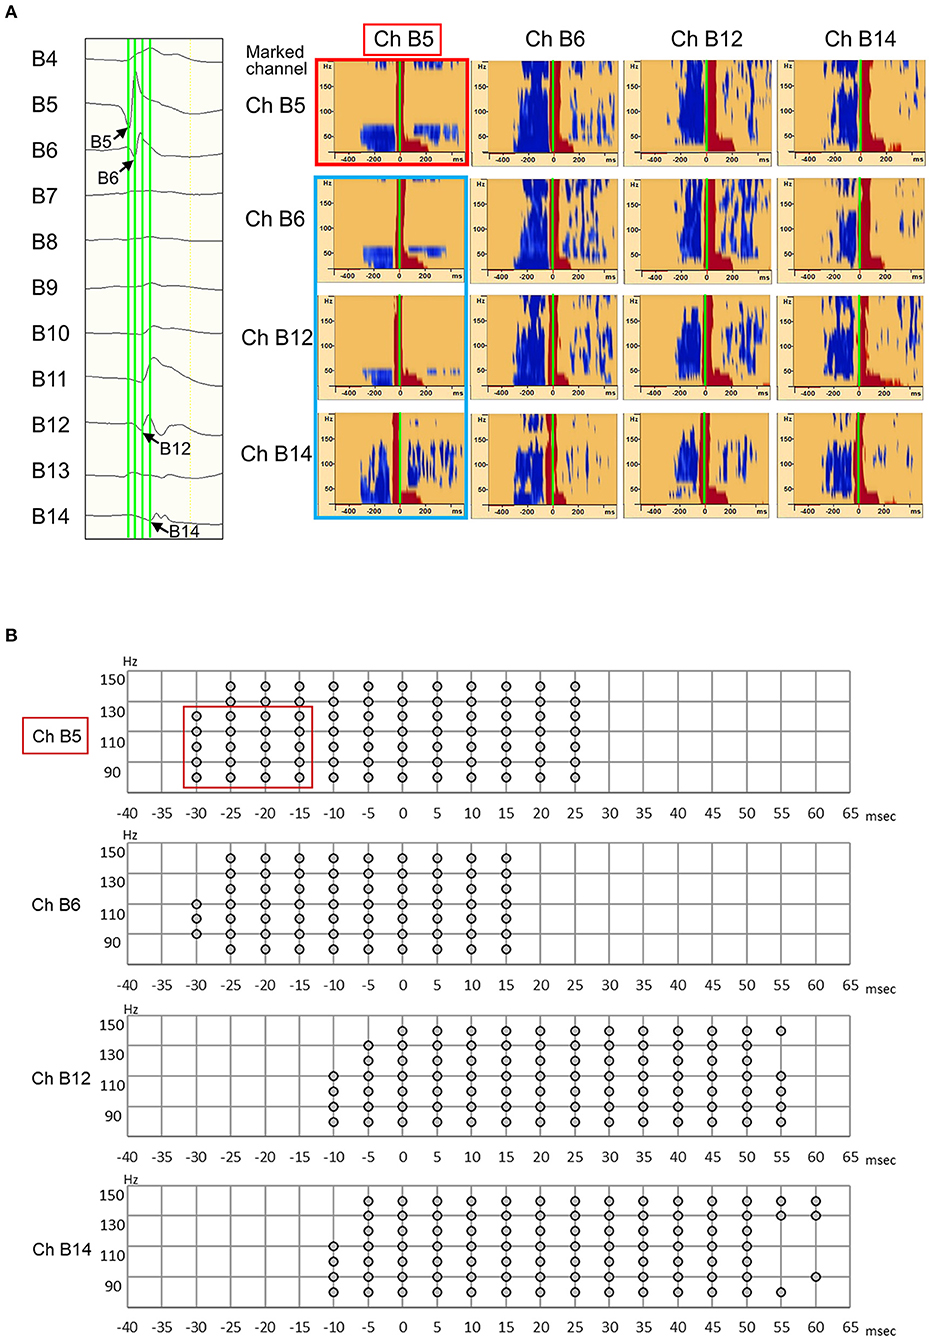
Figure 2. Illustration showing high-frequency oscillation (HFO) onset in Ch B5 for all marked channels (B5, B6, B12, and B14). (A, left) Interictal electrocorticography (ECoG) traces are shown, along with interictal spike propagation. In the enlarged ECoG trace, marks (green line) are attached to the rising edge of the Ch B5, Ch B6, Ch B12, and Ch B14 spikes. (A, right) The Ch B5, Ch B6, Ch B12, and Ch B14 spike-related HFOs are shown at the top, second from top, third from top, and at the bottom, respectively. The blue color indicates significant HFO attenuation and the red color indicates significant HFO augmentation in a given time–frequency bin relative to the reference period. At the top, the HFO onset of Ch B5 spike-related HFOs were observed as Ch B5 (red frame). In the other three channels, spike-related HFOs also have their onset in Ch B5 (blue frame). Thus, HFO onset can be accurately identified as Ch B5 by marking any channel (Ch B5, Ch B6, Ch B12, and Ch B14) over which the spikes spread. (B) Spike-related ripple onset in Ch B5. In our novel method, we defined significant HFO amplitude modulation as at least 40 Hz in width and 20 ms in duration. Spike-related ripple onset in Ch B5, with a latency of −30 ms, from 80 to 130 Hz (red frame). The spike-related ripples of Ch B6, Ch B12, and Ch B14 had a slightly longer latency than those of Ch B5.
Relationship Between Resection of Ripple Onset Channels and Epilepsy Surgery Outcomes
We investigated all implanted channels of the spike-related ripples and measured the onset of ripples in 12 patients with seizure-free outcomes after focal resection.
As an example, Patient 1 was a 14-year-old girl diagnosed with tuberous sclerosis complexes. She had a right occipital tuber and developed refractory epilepsy. During the electrocorticogram study, 134 electrodes were implanted from the right parietotemporal to the occipital area. Resection margins were independently determined based on ictal ECoG and were evaluated by several epileptologists and epilepsy surgeons. The spikes in channel 35 (Ch 35) (Figure 3A) showed different spread patterns from those in channel 39 (Ch 39) (Figure 3B). We marked the emergence of each spike from the baseline (Figures 3A,B, green line). Time–frequency plots derived from Ch 35 and Ch 39 in Patient 1 are shown in Figure 3. The onset channels of ripples determined by marking the spikes of Ch 35 and Ch 39, were denoted as Ch 35 (Figure 3A) and Ch 39 (Figure 3B), respectively. The spike-related HFOs appeared slightly before the marked spikes (Figure 3), and the onset latencies preceding the marked spikes were −10 and −15 ms in Ch 35 and Ch 39, respectively (Supplementary Table 1). In addition, gamma activity spread to the surrounding channels, with different onset latencies for each channel (Figures 3, 4). This patient appeared to have two different spike-onset channels with distinct HFO spread patterns.
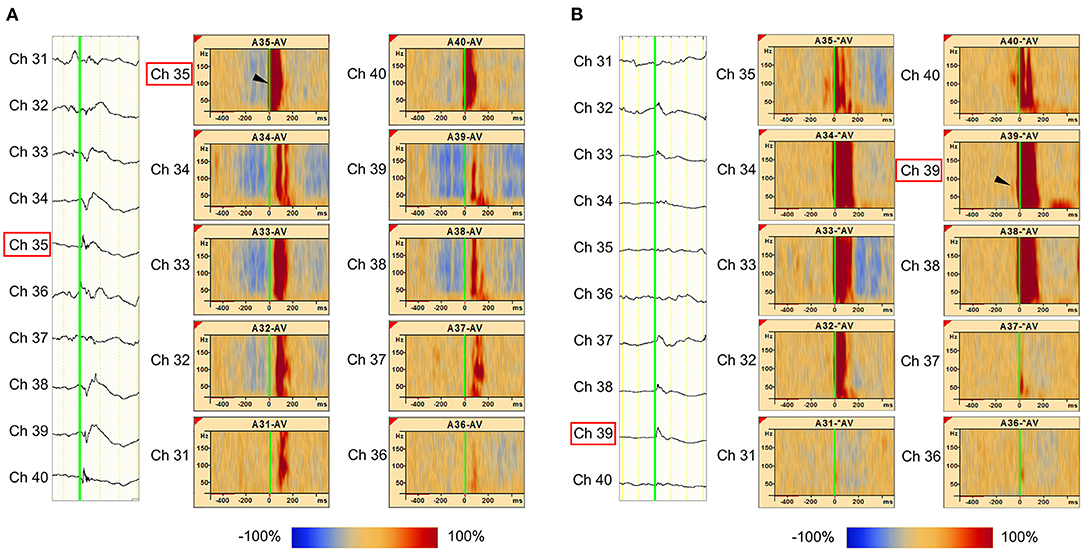
Figure 3. Marked interictal spikes and spike-related ripples in Patient 1. Green lines on the rising edge of channel A35 (Ch 35) [negative spike (A, left)] and channel A39 (Ch 39) [negative spikes (B, left)] are shown. The time–frequency plots in the square show the augmentation of ripples related to Ch 35 spikes (A, right) and Ch 39 spikes (B, right). Augmentation of ripples ranges from −100% (blue) to 100% (red) relative to the reference period (−500 to −300 ms). In the middle column of Ch 35 spike-related ripples (A), the red bands from Ch 35 to Ch 31 show a progressively longer latency, which indicates propagation of ripples across these channels. The shortest latency of the Ch 35 spikes-related ripple augmentation channel (ripple onset) was visually estimated as Ch 35 (A, arrowhead), and the Ch 39 spikes-related ripple augmentation channel (ripple onset) was estimated as Ch 39 (B, arrowhead).
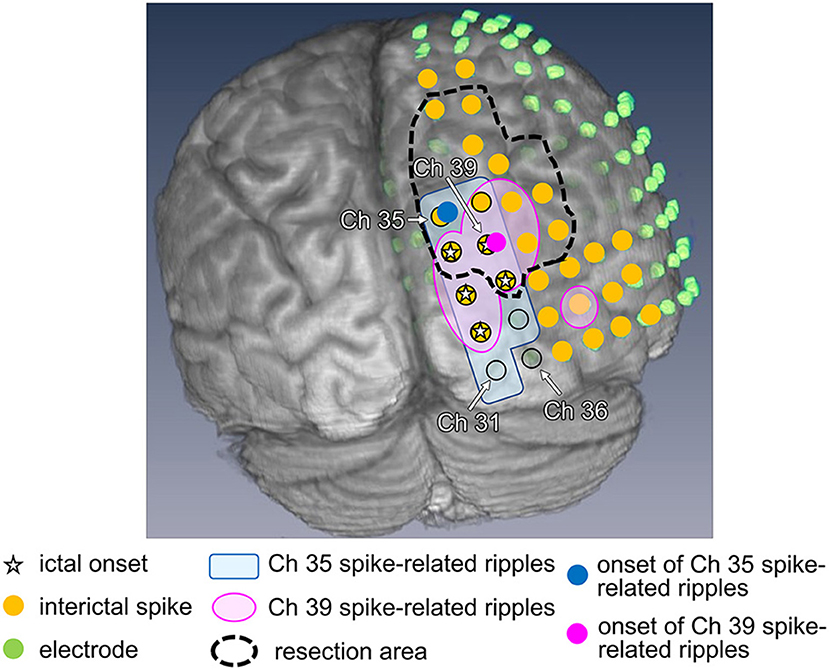
Figure 4. Ripple onset in Ch 35 and Ch 39, and other findings in Patient 1. Spike-related ripples of Ch 35 and Ch 39 (light pink and light blue, respectively), ripple onset in Ch 35 and Ch 39 (filled pink circles and filled blue circles, respectively), ictal onset (star), interictal spike (filled yellow circle), placed electrode (filled green circle), and the resection margin (black dotted line) are shown. The spike-related ripples of each channel propagated around the ictal onset area and had a narrower distribution than the spikes. Ch 35 is not estimated as the ictal onset, but rather as the ripple onset. Ch 39 was estimated as both ictal and ripple onset.
In total, 1,068 analyzed ripples with interictal spikes were identified in 12 patients. The ripple onset channels were detected using one to five electrodes (Table 1, Supplementary Table 1). The ripples modulated by interictal spikes were widely spread over multiple channels but tended to be narrower than those modulated by spikes. Ripple onset frequencies were observed in the range of 80–150 Hz, especially in the range of 100–120 Hz, in all cases (Table 1, Supplementary Table 1). The onset latencies of ripples from 150 to 200 Hz were slightly longer than those of ripples from 80 to 150 Hz. One patient (Patient 12) exhibited a ripple onset from 150 to 200 Hz that was slightly shorter than that from 80 to 150 Hz (Supplementary Table 2). The average ripple onset latency from the spike of the marked channel was −22.8 ms (−125 to 15 ms) (Supplementary Table 1). The ripple and seizure onset channels also coincided in three patients (Patients 8, 10, and 12), and the ripple onset channels were near the seizure onset channels in the other nine patients. In one patient (Patient 1), the rate of coincided distribution of the resection area and the ripple onset channels was 50% (Figure 5, Supplementary Tables 1, 3, Supplementary Figure 2). Statistical analyses of onset latency revealed that the onset channels of spike-related ripples were within the surgical resection area in all patients (Figure 5, Supplementary Figure 2).
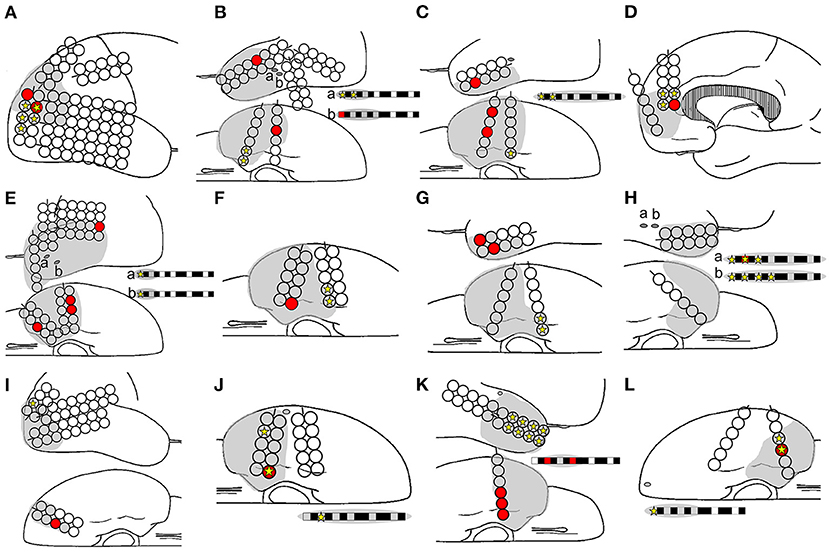
Figure 5. Relationships among ripple onset, ictal onset, and the resection area. The ripple onset electrode (filled red circle and box), ictal onset electrode (filled yellow star), and resection area (gray area) are shown. Letters (A–L) in the schema represent Patients 1–12. The ripple onset channel was within the resection area in all the patients. The ripples and ictal channels were identical for only three patients: Patients 8 (H), 10 (J), and 12 (L).
Analyses of All Marked Spikes
We first marked 1,161 spikes in 12 patients, categorizing 1,068 spikes as class 1 (ripples) and 93 spikes as class 2 (Supplementary Table 1). On a pilot basis, we examined the onset of interictal spike-related ripples and class 2 gamma activity in all patients. The latency analysis showed almost the same results as those based on ripples. All gamma-onset channels (Supplementary Table 1) were within the resection area in all 12 patients (Supplementary Figure 2).
Discussion
This study showed that all onset channels of interictal spike-related ripples were among the resection channels in 12 patients who were seizure-free after resective surgery. The ictal onset channels evaluated by ictal ECoG and the ripple onset channels were concordant in only three of the 12 patients. Therefore, our novel method based on interictal ECoG may facilitate the detection of the EZ, thus improving preoperative evaluations and epilepsy surgery outcomes.
Epileptogenic Zone Estimated by Interictal Spikes
The EZ is a theoretical concept involving the area of the cortex, which is indispensable for the generation of epileptic seizures. In actual clinical practice, it is defined as the minimal cortical area that must be resected to produce seizure freedom (39). To evaluate the EZ preoperatively, EEG waveform patterns during seizures have been compared with ictal onset patterns such as low-voltage fast-activity (6, 40), which has a seizure elimination rate of about 60% (7). Recently, the usefulness of high-gamma activity (9, 41) and ictal direct current (11, 12) during seizures using time–frequency analysis has been reported. Changes in frequency during seizures have been more recently reported to be associated with EZ, based on analysis using stereoelectroencephalography (sEEG) (2, 3). Qi et al. evaluated EZ by HFO analysis during seizure using sEEG and reported that 16 of 19 patients (84%) they evaluated were seizure-free after surgery (42).
Our results indicate that the regions of interictal ripple onset are correlated with the EZ. ECoG abnormalities are often widely distributed during interictal spikes. Several clinical studies have suggested that interictal EEG findings are important in the context of epilepsy surgery. Concerning detection of the epileptic focus based on interictal spikes, previous studies measuring spike latency during interictal seizures reported a 53–77% probability of the spike-onset zone being within the EZ (43, 44). Hufnagel et al. found that short onset latency was more useful than spike frequency in estimating seizure focus (45). Further, Khoo et al. reported that spike-onset zone analysis using EEG/functional MRI was able to predict seizure focus with more than 90% accuracy (46). Using HFOs, Tamilia et al. also reported that resection of areas including the interictal HFO onset improved the prognosis of epileptic seizures (21). However, only 20% of these HFOs were related to spikes during interictal recording. Wang et al. reported that neocortical ripples superimposed on epileptiform discharges, such as paroxysmal fast, spike, or sharp waves, are specific markers of the SOZ, although many neocortical ripples are insufficiently localized (22). Therefore, we believe that our method of investigating the onset area of interictal spike-related ripples is reasonable for analyzing pathological HFOs generated within the EZ.
Discrepancies Between Ictal Onset and Spike-Related Ripple Onset
Our results showed that the ictal and ripple onset channels completely coincided in only three of the 12 patients (rate of coincided distribution of ripple onset channels and ictal onset channels: 100%). Moreover, no common features, whether pathological or spatial, were observed among these three patients. Their pathological findings showed inflammatory changes, FCD and hippocampal sclerosis, and FCD alone. Moreover, the resected areas for these patients were the right temporal lobe and hippocampus, left temporal lobe and hippocampus, and right frontal and temporal lobes, respectively. These results did not exhibit a trend that is consistent with the other patients who did not have coinciding ictal onset channels (rate of coincided distribution of ripple onset channels and ictal onset channels: 0%). Maharathi et al. have previously described the spike origin, and have shown that EZ appears to be distinct in most cases (13). Nevertheless, we cannot definitively determine the cause of discrepancies between ictal onset and interictal spike-related ripple onset channels. In Patient 1, all interictal spike-related ripple onset channels were resected, and the patient became seizure-free; however, two of the five ictal onset electrodes assessed through ictal ECoG were not included in the resection area. Ultimately, we believe that our method of estimating the EZ from the onset of ripples using interictal ECoG could complement estimations of the EZ based on ictal ECoG.
Simple Method for Detecting Pathological Gamma Activity
Since HFOs are usually observed as physiological brain activity, especially in primary sensory areas, it is necessary to determine whether they are related to epileptic activity in order to identify the focus of epilepsy. We believe that physiological HFOs can be excluded using our method because the HFOs that they analyze are associated with spikes (22). Moreover, the reference range was set from −500 to −300 ms before the onset of spikes during sleep.
Our data showed that the frequency range of spike-related ripple onset was 80–150 Hz. The onset latencies of ripples from 150 to 200 Hz were slightly longer than those from 80 to 150 Hz among almost all the analyzed channels. Moreover, in two patients (Patients 1 and 6), ripple onset channels of 150–200 Hz were not included in the resection area. Although only one patient (Patient 12) showed that the ripple onset from 150 to 200 Hz was slightly (10 ms) shorter than that from 80 to 150 Hz, the ripple onset channels of both frequency bands were of the same channel. These results suggest that ripples of 80–150 Hz are more useful for the EZ estimation than that of 150–200 Hz. Similarly, Nariai et al. reported that ripples in the range of 80–200 Hz had shorter ictal augmentation latency than those at <80 or >200 Hz (29). High-frequency activity in the range of 80–150 Hz has been related to epileptic activity (47, 48) and pathological multiunit burst firing during neocortical ictal activity (49, 50). These reports support our results showing that ripple onset frequencies range from 80 to 150 Hz.
Approximately 92% of the spikes (1,068 of 1,161) in this study were categorized as class 1 (ripple). This rate is probably higher than previously reported (56%) (25) because the spikes analyzed in the present study were more frequent and pathological. Additional studies of both class 1 and 2 gamma activities showed almost the same results as those with class 1 gamma activity only. All of the onset channels of interictal spike-related gamma activity were among the resection channels. Burnos et al. reported that separating real HFOs from “false oscillations” produced by the filtering effect of sharp spikes did not improve the delineation of the EZ (51). Although analyses through automatic detection of HFOs using software programs have also been conducted (52), in clinical applications, checking four or more oscillations or blobs for gamma activity associated with every spike on every electrode requires a lot of time. Our pilot study also supports the notion that there may be no need to distinguish false HFOs. This finding therefore demonstrates the simplicity of clinical HFO analysis.
Limitations
This study had several limitations. First, it was retrospective and had a small sample size. Second, the propagation of gamma activity can only be observed in the part of the brain where the electrodes are located. Therefore, if there is no EZ in the area where the electrodes are located, our method cannot be used to estimate the EZ. Third, channels with spike intervals of <500 ms could not be analyzed because the reference period was set from −500 to −300 ms. Therefore, channels with very frequent spike activity could not be marked.
Conclusion
We demonstrated that short-term interictal epileptic discharge recordings may facilitate identification of the EZ, even when no seizures are recorded. Even experienced epilepsy specialists can sometimes find it difficult to determine the resection area. Many parameters, such as seizure semiology and brain MRI and PET findings, are used to evaluate the EZ and surgical margins, whereas interictal ECoG spike findings are underutilized. Based on our findings, the onset area of interictal spike-related ripples could be useful for estimating the EZ. Since long-term intracranial electrode placement can be difficult in pediatric patients, we believe this method is especially useful for children.
Data Availability Statement
The raw data supporting the conclusions of this article will be made available by the authors, without undue reservation.
Ethics Statement
This study was approved by the Tohoku University Hospital Institutional Review Board (protocol numbers: A2017-028 and 2020-1-083). Written informed consent to participate in this study was provided by the participants' legal guardian/next of kin.
Author Contributions
MU and YN-U designed the study, performed the experiments, analyzed the data, and wrote the manuscript. RS, MI, SO, and KJ performed the experiments, analyzed the data, and wrote the manuscript. NN and SK analyzed the data and wrote the manuscript. All authors contributed to the article and approved the submitted version.
Funding
This study was partially supported by a Japan epilepsy research foundation grant (2014). The funders had no involvement in the study design, the collection, analysis, and interpretation of the data, the preparation of the report, or the decision to submit the manuscript for publication.
Conflict of Interest
The authors declare that the research was conducted in the absence of any commercial or financial relationships that could be construed as a potential conflict of interest.
Publisher's Note
All claims expressed in this article are solely those of the authors and do not necessarily represent those of their affiliated organizations, or those of the publisher, the editors and the reviewers. Any product that may be evaluated in this article, or claim that may be made by its manufacturer, is not guaranteed or endorsed by the publisher.
Supplementary Material
The Supplementary Material for this article can be found online at: https://www.frontiersin.org/articles/10.3389/fneur.2021.724417/full#supplementary-material
References
1. Wendling F, Bartolomei F, Bellanger JJ, Bourien J, Chauvel P. Epileptic fast intracerebral EEG activity: evidence for spatial decorrelation at seizure onset. Brain. (2003) 126:1449–59. doi: 10.1093/brain/awg144
2. Grinenko O, Li J, Mosher JC, Wang IZ, Bulacio JC, Gonzalez-Martinez J, et al. A fingerprint of the epileptogenic zone in human epilepsies. Brain. (2018) 141:117–31. doi: 10.1093/brain/awx306
3. Gnatkovsky V, de Curtis M, Pastori C, Cardinale F, Lo Russo G, Mai R, et al. Biomarkers of epileptogenic zone defined by quantified stereo-EEG analysis. Epilepsia. (2014) 55:296–305. doi: 10.1111/epi.12507
4. Sato Y, Wong SM, Iimura Y, Ochi A, Doesburg SM, Otsubo H. Spatiotemporal changes in regularity of gamma oscillations contribute to focal ictogenesis. Sci Rep. (2017) 7:9362. doi: 10.1038/s41598-017-09931-6
5. Akiyama T, McCoy B, Go CY, Ochi A, Elliott IM, Akiyama M, et al. Focal resection of fast ripples on extraoperative intracranial EEG improves seizure outcome in pediatric epilepsy. Epilepsia. (2011) 52:1802–11. doi: 10.1111/j.1528-1167.2011.03199.x
6. Alter AS, Dhamija R, McDonough TL, Shen S, McBrian DK, Mandel AM, et al. Ictal onset patterns of subdural intracranial electroencephalogram in children: how helpful for predicting epilepsy surgery outcome? Epilepsy Res. (2019) 149:44–52. doi: 10.1016/j.eplepsyres.2018.10.008
7. Singh S, Sandy S, Wiebe S. Ictal onset on intracranial EEG: do we know it when we see it? State of the evidence. Epilepsia. (2015) 56:1629–38. doi: 10.1111/epi.13120
8. Jirsch JD, Urrestarazu E, LeVan P, Olivier A, Dubeau F, Gotman J. High-frequency oscillations during human focal seizures. Brain. (2006) 129:1593–608. doi: 10.1093/brain/awl085
9. Modur PN, Zhang S, Vitaz TW. Ictal high-frequency oscillations in neocortical epilepsy: implications for seizure localization and surgical resection. Epilepsia. (2011) 52:1792–801. doi: 10.1111/j.1528-1167.2011.03165.x
10. Zijlmans M, Jiruska P, Zelmann R, Leijten FS, Jefferys JG, Gotman J. High-frequency oscillations as a new biomarker in epilepsy. Ann Neurol. (2012) 71:169–78. doi: 10.1002/ana.22548
11. Ikeda A, Takeyama H, Bernard C, Nakatani M, Shimotake A, Daifu M, et al. Active direct current (DC) shifts and “Red slow”: two new concepts for seizure mechanisms and identification of the epileptogenic zone. Neurosci Res. (2020) 156:95–101. doi: 10.1016/j.neures.2020.01.014
12. Kanazawa K, Matsumoto R, Imamura H, Matsuhashi M, Kikuchi T, Kunieda T, et al. Intracranially recorded ictal direct current shifts may precede high frequency oscillations in human epilepsy. Clin Neurophysiol. (2015) 126:47–59. doi: 10.1016/j.clinph.2014.05.028
13. Maharathi B, Wlodarski R, Bagla S, Asano E, Hua J, Patton J, et al. Interictal spike connectivity in human epileptic neocortex. Clin Neurophysiol. (2019) 130:270–9. doi: 10.1016/j.clinph.2018.11.025
14. Lee S, Issa NP, Rose S, Tao JX, Warnke PC, Towle VL, et al. DC shifts, high frequency oscillations, ripples and fast ripples in relation to the seizure onset zone. Seizure. (2020) 77:52–8. doi: 10.1016/j.seizure.2019.05.001
15. Modur P, Miocinovic S. Interictal high-frequency oscillations (HFOs) as predictors of high frequency and conventional seizure onset zones. Epileptic Disord. (2015) 17:413–24. doi: 10.1684/epd.2015.0774
16. Sakuraba R, Iwasaki M, Okumura E, Jin K, Kakisaka Y, Kato K, et al. High frequency oscillations are less frequent but more specific to epileptogenicity during rapid eye movement sleep. Clin Neurophysiol. (2016) 127:179–86. doi: 10.1016/j.clinph.2015.05.019
17. Jacobs J, LeVan P, Chander R, Hall J, Dubeau F, Gotman J. Interictal high-frequency oscillations (80-500 Hz) are an indicator of seizure onset areas independent of spikes in the human epileptic brain. Epilepsia. (2008) 49:1893–907. doi: 10.1111/j.1528-1167.2008.01656.x
18. Roopun AK, Simonotto JD, Pierce ML, Jenkins A, Nicholson C, Schofield IS. A nonsynaptic mechanism underlying interictal discharges in human epileptic neocortex. Proc Natl Acad Sci USA. (2010) 107:338–43. doi: 10.1073/pnas.0912652107
19. Jacobs J, Wu JY, Perucca P, Zelmann R, Mader M, Dubeau F, et al. Removing high-frequency oscillations: a prospective multicenter study on seizure outcome. Neurology. (2018) 91:e1040–52. doi: 10.1212/WNL.0000000000006158
20. Alkawadri R, Gaspard N, Goncharova II, Spencer DD, Gerrard JL, Zaveri H, et al. The spatial and signal characteristics of physiologic high frequency oscillations. Epilepsia. (2014) 55:1986–95. doi: 10.1111/epi.12851
21. Tamilia E, Park EH, Percivati S, Bolton J, Taffoni F, Peters JM, et al. Surgical resection of ripple onset predicts outcome in pediatric epilepsy. Ann Neurol. (2018) 84:331–46. doi: 10.1002/ana.25295
22. Wang S, Wang IZ, Bulacio JC, Mosher JC, Gonzalez-Martinez J, Alexopoulos AV, et al. Ripple classification helps to localize the seizure-onset zone in neocortical epilepsy. Epilepsia. (2013) 54:370–6. doi: 10.1111/j.1528-1167.2012.03721.x
23. Jacobs J, Vogt C, LeVan P, Zelmann R, Gotman J, Kobayashi K. The identification of distinct high-frequency oscillations during spikes delineates the seizure onset zone better than high-frequency spectral power changes. Clin Neurophysiol. (2016) 127:129–42. doi: 10.1016/j.clinph.2015.04.053
24. Bénar CG, Chauvière L, Bartolomei F, Wendling F. Pitfalls of high-pass filtering for detecting epileptic oscillations: a technical note on “false” ripples. Clin Neurophysiol. (2010) 121:301–10. doi: 10.1016/j.clinph.2009.10.019
25. Amiri M, Lina JM, Pizzo F, Gotman J. High frequency oscillations and spikes: separating real HFOs from false oscillations. Clin Neurophysiol. (2016) 127:187–96. doi: 10.1016/j.clinph.2015.04.290
26. Burnos S, Hilfiker P, Sürücü O, Scholkmann F, Krayenbühl N, Grunwald T, et al. Human intracranial high frequency oscillations (HFOs) detected by automatic time-frequency analysis. PLoS ONE. (2014) 9:e94381. doi: 10.1371/journal.pone.0094381
27. Papp N, Ktonas P. Critical evaluation of complex demodulation techniques for the quantification of bioelectrical activity. Biomed Sci Instrum. (1977) 13:135–45.
28. Hoechstetter K, Bornfleth H, Weckesser D, Ille N, Berg P, Scherg M. BESA source coherence: a new method to study cortical oscillatory coupling. Brain Topogr. (2004) 16:233–8. doi: 10.1023/B:BRAT.0000032857.55223.5d
29. Nariai H, Nagasawa T, Juhász C, Sood S, Chugani HT, Asano E. Statistical mapping of ictal high-frequency oscillations in epileptic spasms. Epilepsia. (2011) 52:63–74. doi: 10.1111/j.1528-1167.2010.02786.x
30. Salmelin R, Hari R. Spatiotemporal characteristics of sensorimotor neuromagnetic rhythms related to thumb movement. Neuroscience. (1994) 60:537–50. doi: 10.1016/0306-4522(94)90263-1
31. Kojima K, Brown EC, Rothermel R, Carlson A, Fuerst D, Matsuzaki N, et al. Clinical significance and developmental changes of auditory-language-related gamma activity. Clin Neurophysiol. (2013) 124:857–69. doi: 10.1016/j.clinph.2012.09.031
32. Uematsu M, Matsuzaki N, Brown EC, Kojima K, Asano E. Human occipital cortices differentially exert saccadic suppression: intracranial recording in children. Neuroimage. (2013) 83:224–36. doi: 10.1016/j.neuroimage.2013.06.046
33. Wu HC, Nagasawa T, Brown EC, Juhasz C, Rothermel R, Hoechstetter K, et al. γ-oscillations modulated by picture naming and word reading: intracranial recording in epileptic patients. Clin Neurophysiol. (2011) 122:1929–42. doi: 10.1016/j.clinph.2011.03.011
34. Simes RJ. Application of statistical decision theory to treatment choices: implications for the design and analysis of clinical trials. Stat Med. (1986) 5:411–20. doi: 10.1002/sim.4780050505
35. Brown EC, Muzik O, Rothermel R, Matsuzaki N, Juhász C, Shah AK, et al. Evaluating reverse speech as a control task with language-related gamma activity on electrocorticography. Neuroimage. (2012) 60:2335–45. doi: 10.1016/j.neuroimage.2012.02.040
36. Tallon-Baudry C, Bertrand O, Delpuech C, Pernier J. Stimulus specificity of phase-locked and non-phase-locked 40 Hz visual responses in human. J Neurosci. (1996) 16:4240–9. doi: 10.1523/JNEUROSCI.16-13-04240.1996
37. Lachaux JP, Hoffmann D, Minotti L, Berthoz A, Kahane P. Intracerebral dynamics of saccade generation in the human frontal eye field and supplementary eye field. Neuroimage. (2006) 30:1302–12. doi: 10.1016/j.neuroimage.2005.11.023
38. Nagasawa T, Matsuzaki N, Juhász C, Hanazawa A, Shah A, Mittal S, et al. Occipital gamma-oscillations modulated during eye movement tasks: simultaneous eye tracking and electrocorticography recording in epileptic patients. Neuroimage. (2011) 58:1101–9. doi: 10.1016/j.neuroimage.2011.07.043
39. Rosenow F, Lüders H. Presurgical evaluation of epilepsy. Brain. (2001) 124:1683–700. doi: 10.1093/brain/124.9.1683
40. Boonyapisit K, Najm I, Klem G, Ying Z, Burrier C, LaPresto E, et al. Epileptogenicity of focal malformations due to abnormal cortical development: direct electrocorticographic–histopathologic correlations. Epilepsia. (2003) 44:69–76. doi: 10.1046/j.1528-1157.2003.08102.x
41. Weiss SA, Alvarado-Rojas C, Bragin A, Behnke E, Fields T, Fried I, et al. Ictal onset patterns of local field potentials, high frequency oscillations, and unit activity in human mesial temporal lobe epilepsy. Epilepsia. (2016) 57:111–21. doi: 10.1111/epi.13251
42. Qi L, Fan X, Tao X, Chai Q, Zhang K, Meng F, et al. Identifying the epileptogenic zone with the relative strength of high-frequency oscillation: a stereoelectroencephalography study. Front Hum Neurosci. (2020) 14:186. doi: 10.3389/fnhum.2020.00186
43. Asano E, Muzik O, Shah A, Juhász C, Chugani DC, Sood S, et al. Quantitative interictal subdural EEG analyses in children with neocortical epilepsy. Epilepsia. (2003) 44:425–34. doi: 10.1046/j.1528-1157.2003.38902.x
44. Holmes MD, Kutsy RL, Ojemann GA, Wilensky AJ, Ojemann LM. Interictal, unifocal spikes in refractory extratemporal epilepsy predict ictal origin and postsurgical outcome. Clin Neurophysiol. (2000) 111:1802–8. doi: 10.1016/S1388-2457(00)00389-8
45. Hufnagel A, Dümpelmann M, Zentner J, Schijns O, Elger CE. Clinical relevance of quantified intracranial interictal spike activity in presurgical evaluation of epilepsy. Epilepsia. (2000) 41:467–78. doi: 10.1111/j.1528-1157.2000.tb00191.x
46. Khoo HM, Hao Y, Von Ellenrieder N, Zazubovits N, Hall J, Olivier A, et al. The hemodynamic response to interictal epileptic discharges localizes the seizure-onset zone. Epilepsia. (2017) 58:811–23. doi: 10.1111/epi.13717
47. Miller KJ. Broadband spectral change: evidence for a macroscale correlate of population firing rate? J Neurosci. (2010) 30:6477–9. doi: 10.1523/JNEUROSCI.6401-09.2010
48. Einevoll GT, Kayser C, Logothetis NK, Panzeri S. Modelling and analysis of local field potentials for studying the function of cortical circuits. Nat Rev Neurosci. (2013) 14:770–85. doi: 10.1038/nrn3599
49. Eissa TL, Tryba AK, Marcuccilli CJ, Ben-Mabrouk F, Smith EH, Lew SM, et al. Multiscale aspects of generation of high-gamma activity during seizures in human neocortex. eNeuro. (2016) 3. doi: 10.1523/ENEURO.0141-15.2016
50. Weiss SA, Banks GP, McKhann GM, Goodman RR, Emerson RG, Trevelyan AJ, et al. Ictal high frequency oscillations distinguish two types of seizure territories in humans. Brain. (2013) 136:3796–808. doi: 10.1093/brain/awt276
51. Burnos S, Frauscher B, Zelmann R, Haegelen C, Sarnthein J, Gotman J. The morphology of high frequency oscillations (HFO) does not improve delineating the epileptogenic zone. Clin Neurophysiol. (2016) 127:2140–8. doi: 10.1016/j.clinph.2016.01.002
Keywords: surgery, epileptogenic zone, epilepsy, interictal, onset, spike-related ripples
Citation: Numata-Uematsu Y, Uematsu M, Sakuraba R, Iwasaki M, Osawa S, Jin K, Nakasato N and Kure S (2021) The Onset of Interictal Spike-Related Ripples Facilitates Detection of the Epileptogenic Zone. Front. Neurol. 12:724417. doi: 10.3389/fneur.2021.724417
Received: 13 June 2021; Accepted: 14 October 2021;
Published: 04 November 2021.
Edited by:
Shuang Wang, Zhejiang University, ChinaReviewed by:
Rei Enatsu, Sapporo Medical University, JapanQun Wang, Capital Medical University, China
Ziyi Chen, The First Affiliated Hospital of Sun Yat-sen University, China
Copyright © 2021 Numata-Uematsu, Uematsu, Sakuraba, Iwasaki, Osawa, Jin, Nakasato and Kure. This is an open-access article distributed under the terms of the Creative Commons Attribution License (CC BY). The use, distribution or reproduction in other forums is permitted, provided the original author(s) and the copyright owner(s) are credited and that the original publication in this journal is cited, in accordance with accepted academic practice. No use, distribution or reproduction is permitted which does not comply with these terms.
*Correspondence: Mitsugu Uematsu, dWVtYXRzdUBiazkuc28tbmV0Lm5lLmpw