 Alan Finkelstein1
 Abrar Faiyaz2
 Miriam T. Weber3
 Xing Qiu4
 Md Nasir Uddin3*
 Jianhui Zhong1,5,6
 Giovanni Schifitto2,3,6
- 1Department of Biomedical Engineering, University of Rochester, Rochester, NY, United States
- 2Department of Electrical and Computer Engineering, University of Rochester, Rochester, NY, United States
- 3Department of Neurology, University of Rochester, Rochester, NY, United States
- 4Department of Biostatistics and Computational Biology, University of Rochester, Rochester, NY, United States
- 5Department of Physics and Astronomy, University of Rochester, Rochester, NY, United States
- 6Department of Imaging Sciences, University of Rochester, Rochester, NY, United States
Background: White matter (WM) damage is a consistent finding in HIV-infected (HIV+) individuals. Previous studies have evaluated WM fiber tract-specific brain regions in HIV-associated neurocognitive disorders (HAND) using diffusion tensor imaging (DTI). However, DTI might lack an accurate biological interpretation, and the technique suffers from several limitations. Fixel-based analysis (FBA) and free water corrected DTI (fwcDTI) have recently emerged as useful techniques to quantify abnormalities in WM. Here, we sought to evaluate FBA and fwcDTI metrics between HIV+ and healthy controls (HIV−) individuals. Using machine learning classifiers, we compared the specificity of both FBA and fwcDTI metrics in their ability to distinguish between individuals with and without cognitive impairment in HIV+ individuals.
Methods: Forty-two HIV+ and 52 HIV– participants underwent MRI exam, clinical, and neuropsychological assessments. FBA metrics included fiber density (FD), fiber bundle cross section (FC), and fiber density and cross section (FDC). We also obtained fwcDTI metrics such as fractional anisotropy (FAT) and mean diffusivity (MDT). Tract-based spatial statistics (TBSS) was performed on FAT and MDT. We evaluated the correlations between MRI metrics with cognitive performance and blood markers, such as neurofilament light chain (NfL), and Tau protein. Four different binary classifiers were used to show the specificity of the MRI metrics for classifying cognitive impairment in HIV+ individuals.
Results: Whole-brain FBA showed significant reductions (up to 15%) in various fiber bundles, specifically the cerebral peduncle, posterior limb of internal capsule, middle cerebellar peduncle, and superior corona radiata. TBSS of fwcDTI metrics revealed decreased FAT in HIV+ individuals compared to HIV– individuals in areas consistent with those observed in FBA, but these were not significant. Machine learning classifiers were consistently better able to distinguish between cognitively normal patients and those with cognitive impairment when using fixel-based metrics as input features as compared to fwcDTI metrics.
Conclusion: Our findings lend support that FBA may serve as a potential in vivo biomarker for evaluating and monitoring axonal degeneration in HIV+ patients at risk for neurocognitive impairment.
Introduction
Combined antiretroviral therapy (cART) has reduced morbidity and mortality rates significantly in HIV infected (HIV+) individuals (1). However, the increased survival may be masking an increase in cognitive impairment (2), mediated by injury to the central nervous system (CNS) and disruption of the blood–brain barrier (BBB) (3). The HIV reservoir in the CNS resides primarily in microglia and perivascular macrophages, resulting in chronic neuroinflammation (4). While the small pool of infected cells in the CNS can release neurotoxic viral proteins, Tat and gp120, the larger pool of activated glia cells is responsible for the release of cytokines that can induce neuronal injury and cell death (5). HIV-associated oligodendrocyte injury results in demyelination and alterations in white matter (WM) structural integrity (6). Thus, damage to WM fibers is likely a key factor in cognitive impairment observed in HIV-associated neurocognitive disorder (HAND) (7).
MR neuroimaging studies have sought to identify potential in vivo biomarkers to investigate CNS injury in the setting of HIV infection (8). Structural and functional MRI have helped elucidate how atrophy and aberrant network topology mediate cognitive decline in HIV infection (9, 10). Nonetheless, given the well-established presence of WM alterations in HIV infection, it is paramount to further characterize WM in HAND. However, during chronic neuroinflammation, there may be contributing vasogenic edema (11), confounding the interpretation of WM lesions. Accordingly, appropriate models that accurately account for free water (FW) contamination are necessary to sufficiently evaluate WM structural integrity in HIV infection (12).
Due to its non-invasiveness, diffusion tensor imaging (DTI) has been widely used in clinical neuroimaging studies (13, 14). DTI metrics such as fractional anisotropy (FA), axial diffusivity (AD), radial diffusivity (RD), and mean diffusivity (MD) characterize the orientation and distribution of the random movements of water molecules, diffusion magnitude, diffusional directionality perpendicular to the axon, and diffusional directionality along the axon, respectively (15, 16). Previous studies have shown that FA is decreased in the posterior limb of internal capsule (PLIC), the corticospinal tract (CST), and temporal and frontoparietal WM regions, whereas RD and MD were increased in bilateral CST and temporal and frontal WM regions in HIV+ individuals (17–22). Decreased FA has also been observed in the superior longitudinal fasciculus (SLF) and was correlated with decreased memory and executive function in HIV+ subjects exhibiting HAND (23). Tract-based spatial statistics (TBSS) is a popular voxel-based method to analyze DTI metrics, which maps control and disease cohort FA images to a WM skeleton to improve correspondence between subjects (24). We have previously reported diffuse FA and MD abnormalities using TBSS in HIV+ individuals (25).
However, voxel-based measures are often contaminated by extracellular FW (12). FW contamination in the diffusion signal is due to water molecules that are not restricted by their environment, such as the cerebrospinal fluid (CSF). Edema caused by stroke (26), brain tumors (12), or neuroinflammation can also contaminate WM voxels (27, 28). Accordingly, FW contaminated voxels will fit more toward an isotropic tensor and exhibit decreased FA values, confounding the interpretation of the results. Previously, several studies have reported that FW correction enhances specificity of DTI metrics (29–32) and reduces test–retest reproducibility errors (33). However, the diffusion tensor model is limited in that it is not able to reliably model complex and crossing-fiber populations, which are present in up to 90% of WM voxels (34, 35). Furthermore, while TBSS of FW corrected FA (FAT) is likely to provide more reliable measures of WM integrity in HIV infection, it does not include orientation information.
Fixel-based analysis (FBA) is a recent technique that models individual fibers at the sub-voxel level, termed fixels, which allow tract-specific comparisons (36). FBA enables the characterization of multiple fiber populations within a voxel, circumventing interpretation issues that commonly arise with voxel-averaged measurements such as FA and MD. Moreover, FBA accounts for both macrostructural (fiber bundle) and microstructural (within voxel) changes within WM, providing a more comprehensive understanding of intra-axonal and fiber tract changes. Accordingly, FBA has been used in several neurological disorders including Parkinson's disease (37, 38), multiple sclerosis (39, 40), traumatic brain injury (41, 42), schizophrenia (42), and healthy aging (43). FBA can be used to estimate fiber density (FD) within a fiber bundle, the fiber bundle cross section (FC), or a combined measure, fiber density cross section (FDC). FD is related to the intra-axonal volume, and a corresponding decrease in FD may reflect axonal degeneration (36). However, correspondence between the apparent fiber density (AFD) and simulated intra-axonal signal fraction is improved at higher b-values (44). Accordingly, it is possible that at moderate b-values (b <2,000 s/mm2), the FOD is no longer purely representative of the intra-axonal volume (44). At moderate b-values, the DW signal contains contributions from both the intra-axonal and extra-axonal spaces, and the FD needs to be interpreted cautiously. FD or AFD is calculated from the fiber orientation distribution (FOD), which may be estimated using constrained spherical deconvolution (CSD) (45, 46), or advanced multi-tissue constrained spherical deconvolution (MT-CSD) (47), which considers different brain tissue types. By modeling gray matter (GM), WM, and CSF separately, MT-CSD accounts for FW contamination and has been shown to have better test–retest reliability than traditional DTI metrics (48). FC reflects the cross-sectional area of a fiber bundle, perpendicular to the length axis, and is derived from the Jacobian of the non-linear transformation from subject space to template space. By accounting for the orientation of the fiber bundle, FC is reflective of the number of axons within the fiber bundle, and therefore the ability to relay information (36). FDC accounts for both macroscopic and microscopic effects on fiber density.
The aim of this study was to refine our understanding of how WM structural integrity is affected in HIV-infected individuals, and if these changes were associated with cognitive performance in HAND, using two approaches, FBA and fwcDTI. Additionally, we investigated whether fiber tract degeneration was related to inflammatory blood markers NfL and Tau of HIV infection. Machine learning classification, using a set of binary classifiers was also performed to distinguish cognitively normal individuals from those with cognitive impairment in HIV+ individuals.
Materials and Methods
Study Participants
Forty-two treatment-naïve HIV+ participants (2 females and 40 males; mean age ± standard error, SE = 34.48 ± 1.95 years, range 20–63 years) and 52 age-matched HIV uninfected (HIV–) participants (26 females and 26 males; mean age ± SE = 37.02 ± 1.66 years, range 18–63 years) were enrolled in a study assessing the potential neurotoxicity of combination antiretroviral therapy treatment (cART) study at the University of Rochester Medical Center. All participants provided written informed consent before enrollment according to the institutional protocol and underwent clinical, laboratory, and brain MRI exams. All experiments were performed in accordance with relevant guidelines and regulations. The data reported here reflect the baseline assessment of HIV+, cART naïve individuals prior to starting cART. This time point was chosen because it represents the clearest difference in cognitive performance within the HIV+ group. Details about study participants (including age, sex, and clinical results) are provided in Table 1.
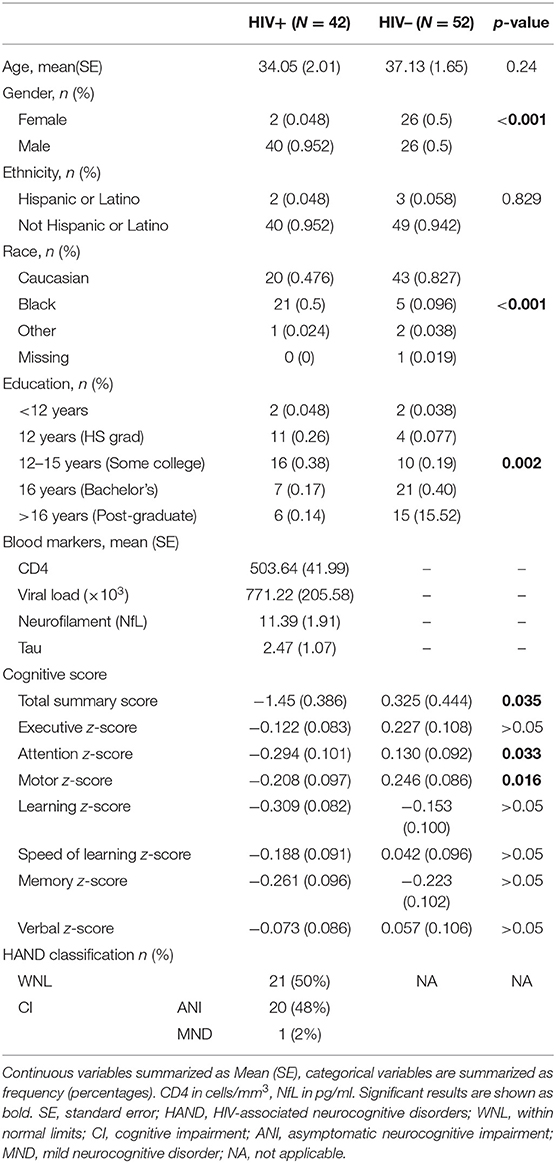
Table 1. Participant demographics, clinical, and cognitive information.
Data Acquisition
Blood Sample
Plasma levels of markers associated with neuroinflammation and neurodegeneration (Neurofilament light chain NfL, and Tau protein) were measured by Simoa assay via commercial lab, QuanterixTM (Lexington, MA, United States, https://www.quanterix.com/). Viral load (VL) from each HIV+ participant was measured via Roche COBAS 8800 System with a lower limit of detection of 20 copies/ml. CD4+ count was obtained via flow cytometric immunophenotyping at the Clinical Laboratory Improvement Amendments (CLIA), certified clinical lab at the University of Rochester.
Neuropsychological Assessments
The neurocognitive evaluation was performed by trained staff and supervised by a clinical neuropsychologist. Tests of Executive Function (Trailmaking Test Parts A & B, Stroop Interference task), Speed of Information Processing (Symbol Digit Modalities Test and Stroop 2 Color Naming), Attention and Working Memory [CalCAP(CRT4) and WAIS-III Letter-Number Sequencing], Learning [Rey Auditory Verbal Learning Test AVLT (trials 1–5), Rey Complex Figure Test Immediate Recall], Memory (Rey Auditory Verbal Learning Test RAVLT Delayed Recall, Rey Complex Figure Test Delayed Recall), and Motor (Grooved Pegboard, left and right hand) were administered at each visit. Premorbid intellectual functioning ability was estimated via WRAT-4 Reading at the baseline visit only. Raw scores were converted to z-scores using test manual norms but the z-scores were cut off at ±3 standard deviations (SD) above and below the mean values. Cognitive domain scores were created by averaging the z-scores of tests within each domain. A total summary score was calculated by summing the z-scores of the six cognitive domains measured (Executive Function, Speed of Information Processing, Attention and Working Memory, Learning, Memory, and Motor). HAND diagnoses were determined for each participant according to the Frascati criteria (49). Participants were accordingly defined as either within normal limits (WNL) or cognitively impaired (CI) [i.e., participants having asymptomatic neurological impairment (ANI) or minor neurocognitive impairment (MND)]. The ANI was defined as neuropsychological impairment (>1 SD below the demographically appropriate normative mean) in 2 or more cognitive domains with no functional decline (as measured by the Instrumental Activities of Daily Living Scale), while mild neurocognitive disorder (MND) was defined as neuropsychological impairment in two or more cognitive domains with mild functional decline (49).
Image Acquisition
All participants were scanned on a 3 T MRI scanner (MAGNETOM Trio, Siemens, Erlangen, Germany) equipped with a 32-channel head coil.
Anatomical Imaging
For the purpose of segmentation and identification of the anatomical landmarks, T1-weighted (T1w) images were acquired using a 3D magnetization prepared rapid acquisition gradient-echo (MPRAGE) sequence with Inversion Time (TI) = 1,100 ms, Repetition Time (TR) = 2,530 ms, Echo Time (TE) = 3.44 ms, Flip Angle = 7, Field of View (FOV) = 256 × 256, GRAPPA factor = 2, number of average = 1, number of slices = 192, voxel size = 1.0 × 1.0 × 1.0 mm3, and total time of acquisition (TA) was 5 min 52 s.
Diffusion Tensor Imaging
Diffusion-weighted images (DWI) were acquired using a single-shot spin echo echo-planar imaging (SE-EPI) sequence with 60 non-collinear diffusion-encoded images (b = 1,000 s/mm2), 10 non-diffusion-weighted reference images (b = 0 s/mm2), TR = 8,900 ms, TE = 86 ms, FOV = 256 × 256, GRAPPA factor = 2, number of slices = 70, number of volumes = 61, voxel size = 2.0 × 2.0 × 2.0 mm3, TA = 10 min 51 s. In order to correct for EPI distortions, a double-echo gradient echo field map sequence was also acquired (TR = 400 ms; TE = 5.19 ms, FOV = 256 × 256, flip angle = 60, number of slices = 70, voxel size = 2.0 × 2.0 × 2.0 mm3, TA = 3 min 28 s).
Image Preprocessing
All MRI images were visually inspected for any severe artifacts. DWI images were corrected for eddy current-induced distortion, susceptibility-induced distortion, and motion correction using TOPUP and EDDY tools in FSL [https://fsl.fmrib.ox.ac.uk/fsl/fslwiki/; (50, 51)].
Fixel-Based Analysis
FBA was performed using the recommended pipeline in MRtrix3 (www.mrtrix.org, version 3.0.2) (36, 52). Briefly, DWI images were up-sampled by a factor of 2 in all three dimensions using tri-cubic interpolation. The fiber orientation distribution functions (FODs) within each voxel were computed in the following way: response functions for single-fiber WM, GM, and CSF were estimated from single-shell data using an unsupervised method (53). Single-shell three-tissue CSD (SS3T-CSD) was then performed to obtain FODs for WM, GM, and CSF compartments (54) using MRtrix3Tissue (https://3Tissue.github.io), a fork of MRtrix3 (52). A study-specific template was then created by spatial normalization of subjects using symmetric diffeomorphic non-linear transformation FOD-based registration (55). One group-averaged FOD template was created for cross-sectional analysis, including 20 HIV+ and 20 HIV– individuals. The FOD image for each subject was then registered to the template using FOD-guided non-linear registration.
A tractogram was then generated using whole-brain probabilistic tractography on the FOD population template (52). Twenty million streamlines were generated and subsequently filtered to two million streamlines using spherical deconvolution informed filtering of tractograms (SIFT) to reduce reconstruction biases (56). Fixel-specific measures of fiber density (FD) and fiber bundle cross section (FC) were calculated within each voxel. The log of FC (logFC) was calculated to ensure FC values were centered around zero and normally distributed. A combined measure, FDC, was also generated by multiplying FD and FC. FD, logFC, and FDC for all fixels within a given ROI were then averaged, determined using a fixel mask for the major fiber bundles, using the Johns Hopkins University (JHU) DTI-based WM atlas.
DTI Preprocessing
DTI metrics (FA and MD) were computed using DTIFIT in FSL (57). Free water corrected DTI (fwcDTI) metrics (FAT and MDT) were computed with a bi-tensor model from the DWI using a previously described algorithm (58) and the processing was performed using Nextflow pipeline (59) with all software dependencies bundled in a Singularity Container (60).
Statistical Analysis
Participant Characteristics
Differences in clinical parameters between HIV+ and HIV– cohorts at baseline were examined using two-way independent t-tests at the α = 0.05 significance level. Statistical analysis of demographic data was computed in R 3.6.2 (R Foundation for Statistical Computing, Vienna, Austria).
Univariate comparisons between two independent groups were conducted by either two-group Welch's unequal variances t-test (for continuous variables) or Fisher exact test (for categorical variables). Pearson correlation test was used to test the univariate associations between two continuous variables. A p < 0.05 was considered statistically significant for a single hypothesis testing problem. For inferential problems that involved multiple hypotheses, Benjamini–Hochberg multiple testing procedure was used to control the false discovery rate (FDR) at α < 0.05 level (61).
Fixel-Based Analysis
Whole-Brain Fixed Based Analysis
Statistical analyses of images were performed in MRtrix3 (www.mrtrix.org, version 3.0.2) (52). All WM fixels were compared between HIV+ and HIV– individuals. Group comparisons were performed for FD, logFC, and FDC at each fixel using a General Linear Model (GLM), with age and sex included as covariates. Connectivity-based fixel enhancement (CFE) and non-parametric permutation testing over 5,000 permutations were used to identify significant differences in fixel-based metrics (62). Family-wise error (FWE)-corrected p-values are reported to account for multiple comparisons. Significant fixels (FWE corrected p < 0.05) were visualized using the mrview tool in MRtrix3. Fixels were mapped to streamlines of the template-derived tractogram, only displaying streamlines corresponding to significant fixels. Significant streamlines were colored by the effect size, presented as a percentage relative to HIV– individuals or by streamline direction (left–right, red; inferior–superior, blue; anterior–posterior, green).
Region of Interest Analysis
In addition to whole-brain analysis, region of interest (ROI) analysis was also performed for fixel-based metrics (FD, logFC, and FDC), DTI metrics (FA and MD), and fwcDTI metrics (FAT and MDT) along specific WM tracts using the JHU DTI-based WM atlas. ROIs were chosen to reflect canonical WM pathways using previous studies investigating WM changes in HIV infection (20, 21). The following ROIs were included in the analyses: the left and right posterior limb of internal capsule (PLIC), the left and right superior corona radiata (SCR), the left and right cerebellar peduncles (CP), the left and right inferior cerebellar peduncle (ICP), and the middle cerebellar peduncle (MCP). These regions were chosen a priori based on the findings from whole-brain FBA. The mean value for FD, logFC, and FDC was computed for each ROI and compared across groups. Correlation analyses were also performed to evaluate the relationship between fixel-based metrics and cognitive z-scores. Independent t-tests with multiple comparison corrections were used to compare mean logFC, FD, and FDC between cohorts over the ROIs. Correlations were performed using the non-parametric Spearman's rho and a linear model with age and sex as covariates. Benjamini–Hochberg procedure was applied to control the FDR at α < 0.05 significance level.
Tract Based Spatial Statistics (DTI and fwcDTI)
FSL-based TBSS was performed to investigate the FA, free water corrected FA (FAT), MD, and free water corrected MD (FAT) changes along WM tracts (24). Group comparisons were performed using FSL Randomize for 5,000 permutations. Threshold-free cluster enhancement (TFCE) (63) was used for multiple comparison correction at the α = 0.05 significance level.
Machine Learning Classification
Machine learning classification was performed using FBA and fwcDTI metrics for HIV+ individuals. Classifiers were implemented in scikit-learn (64). Mean values within an ROI that were determined to be significant between HIV+ and HIV– subjects were used as input, corresponding to 12 input features. Instances were standardized prior to training and dimensionality reduction was performed using kernel principal component analysis (kPCA) to two features. Four binary classifiers were used to evaluate the specificity of both fixel-based metrics and fwcDTI metrics in their ability to distinguish between WNL and CI. In this study, we implemented random forest, naïve Bayes, linear discriminant analysis (LDA), and adaptive boosting (AdaBoost) classifiers. All classifiers were optimized using a grid search algorithm with a stratified five-fold cross-validation. Classifiers were evaluated using the weighted average (across classes) for precision, recall, and f1-score. Precision, also known as the positive predictive value (PPV), is defined as the number of instances classified as positive, divided by the total number of positive (CI) instances. Recall, or sensitivity, is the number of instances accurately classified as positive (true positives), divided by the total number of instances classified as positive. The F-score is the harmonic mean of precision and recall. Receiver operating characteristic (ROC) curves and precision-recall curves (PRC) were also evaluated to assess the performance of these classifiers. Given the small dataset, results are reported as the average across five-fold.
Results
Participant Characteristics
Clinical characteristics, demographic information, and cognitive scores for HIV+ and HIV– individuals are presented in Table 1. HIV+ and HIV– cohorts did not significantly differ in age or ethnicity. The total summary z-score, attention z-score, and motor z-score were found to be significantly lower in the HIV+ cohort (p < 0.05; Supplementary Figure S1).
Whole-Brain Fixel-Based Analysis
Whole-brain FBA is shown in Figure 1. Streamlines corresponding to significant fixels (FWE corrected p < 0.05) are represented as the percentage decrease in HIV+ individuals compared to HIV– individuals for FD, logFC, and FDC. Macrostructural decreases (measured via logFC) of up to 15% were observed along specific fiber tracts. Specifically, the PLIC and MCP were affected bilaterally. The right SCR was also affected. Similar findings were observed for FD, though much less pronounced. Moreover, decreases in FD were more localized to the PLIC. FDC exhibited similar patterns of micro- and macro-structural degeneration, with a larger effect size (Table 2). Compared to HIV– individuals, HIV+ individuals had a 35% decrease in FDC in the PLIC bilaterally as well as the right SCR. Figure 2 shows streamlines displayed and colored based on orientation for significant decreases in logFC in HIV+ individuals. Figure 3 shows a coronal view of fiber tract-specific significant fixels, and the inset shows a zoomed-in area indicating regions with crossing fibers around cerebellar peduncles (CP) and MCP.
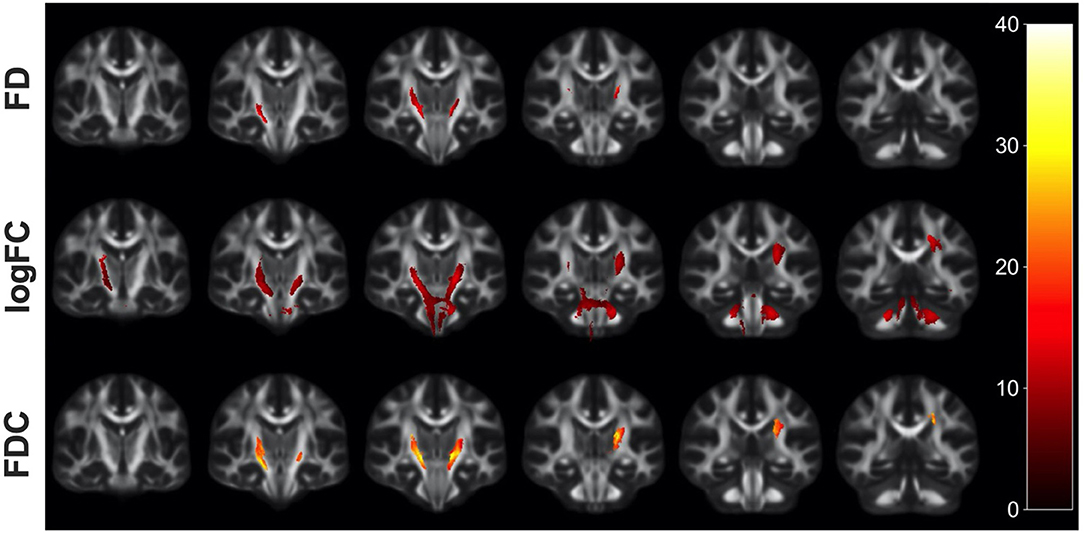
Figure 1. Fiber tract-specific reductions in HIV+ compared to HIV– using whole-brain FBA. Significant fixels (FWE-corrected p-value) between HIV+ and HIV– groups displayed as the percentage decrease in the HIV+ group compared to healthy controls, displayed in coronal slices. FD, fiber density; logFC, fiber bundle cross section; FDC, fiber density and cross section.
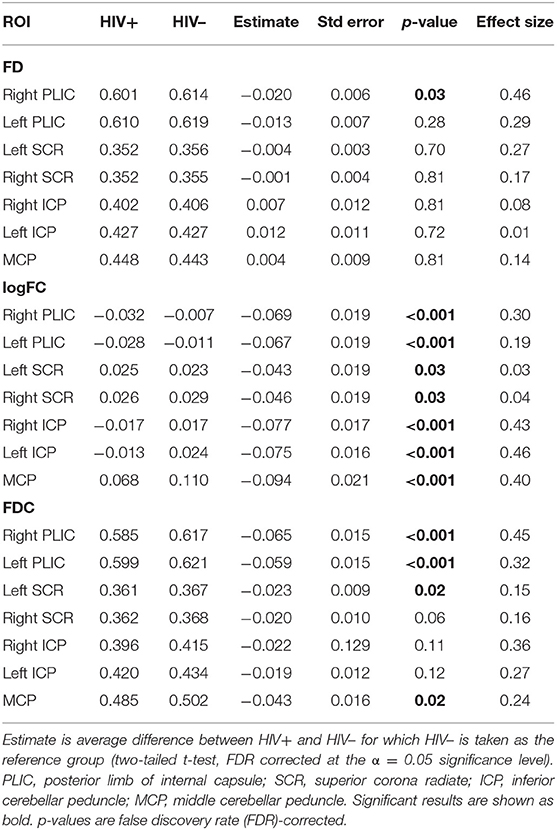
Table 2. Linear regression model comparing the FBA metrics in HIV+ and HIV– individuals, with age and sex included as covariates.
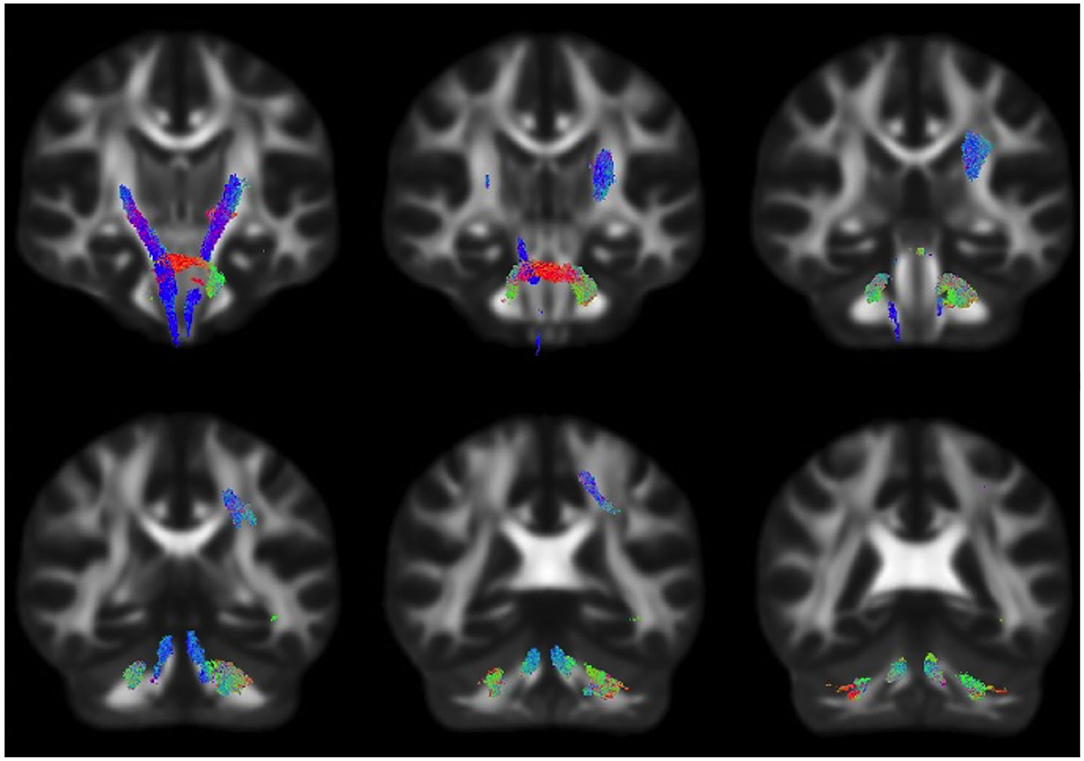
Figure 2. Fiber tract-specific logFC decreases in HIV infection, colored by direction. Streamlines were cropped from the template tractogram to include only significant fixels (FWE-corrected p < 0.05) for which the logFC metric is decreased in the HIV+ compared to HIV– individuals. Significant streamlines are shown across coronal slices and colored by direction (anterior–posterior, green; superior–inferior, blue; left–right, red).
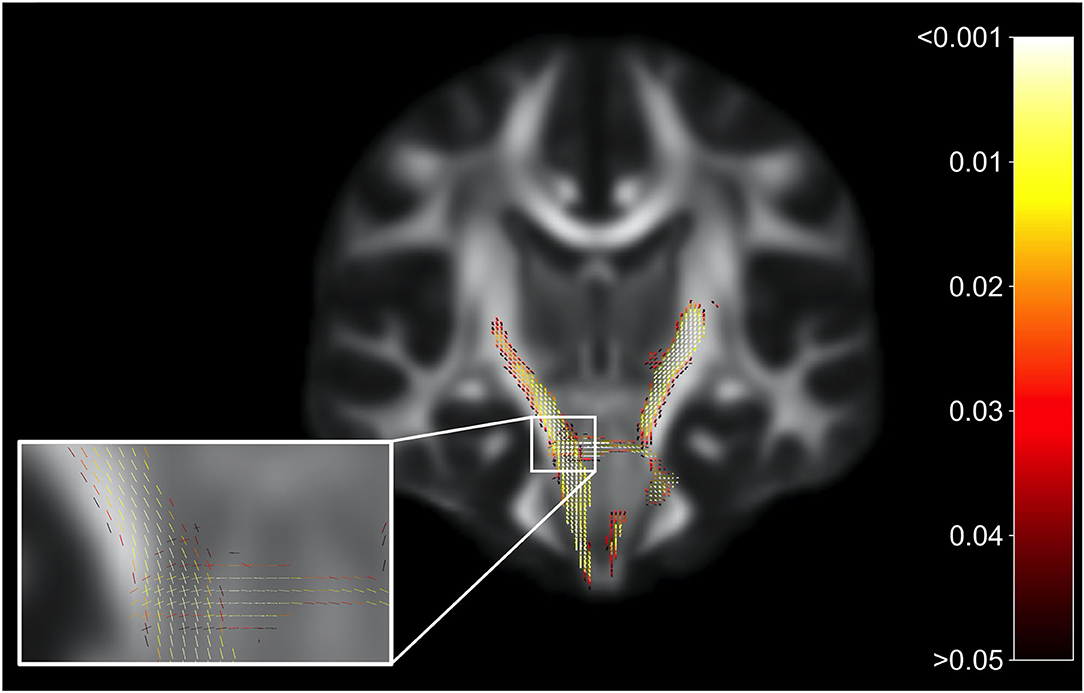
Figure 3. Fiber tract-specific significant fixels. Coronal slice showing fixels that were significantly decreased (FWE-corrected p-values) in HIV+ individuals compared to HIV–. The zoomed-in area illustrates differences and p-values assigned to individual fixels in regions with crossing-fibers, around the cerebral peduncles (CP) and middle cerebellar peduncles (MCP). Fixels are colored by FWE-corrected p-value.
Region of Interest Analysis
Table 2 lists the mean and standard errors for several ROIs between the participants for the FBA metrics FD, logFC, and FDC for HIV+ and HIV– individuals. Linear models were further implemented to evaluate the relationship between fixel-based metrics and cohorts, including age and sex as covariates. We found a significant reduction in several ROIs in FBA metrics in HIV+ than in HIV– individuals. Linear regression models comparing DTI and fwcDTI metrics between HIV+ and HIV– cohorts are provided in Supplementary Table S1. None of the ROIs show any significant differences between the cohorts for the DTI and fwcDTI metrics.
Figures 4A–C shows scatterplots examining the relationship between the attention domain z-scores and FBA metrics (FD, logFC, and FDC) for the right and left of PLIC and SCR. For HIV+ individuals, the right PLIC was found to be significant for FD (ρ = 0.33, p = 0.036), FDC (ρ = 0.44, p = 0.0039), and logFC (ρ = 0.4, p = 0.0085) while the right and left SCR were found to be significant in FDC (ρ = 0.43, p = 0.0048, and ρ = 0.38, p = 0.014, respectively). On the other hand, none of the ROIs for any metrics were significantly correlated with attention z-scores in the HIV– individuals. Figure 4D illustrates the corresponding ROIs.
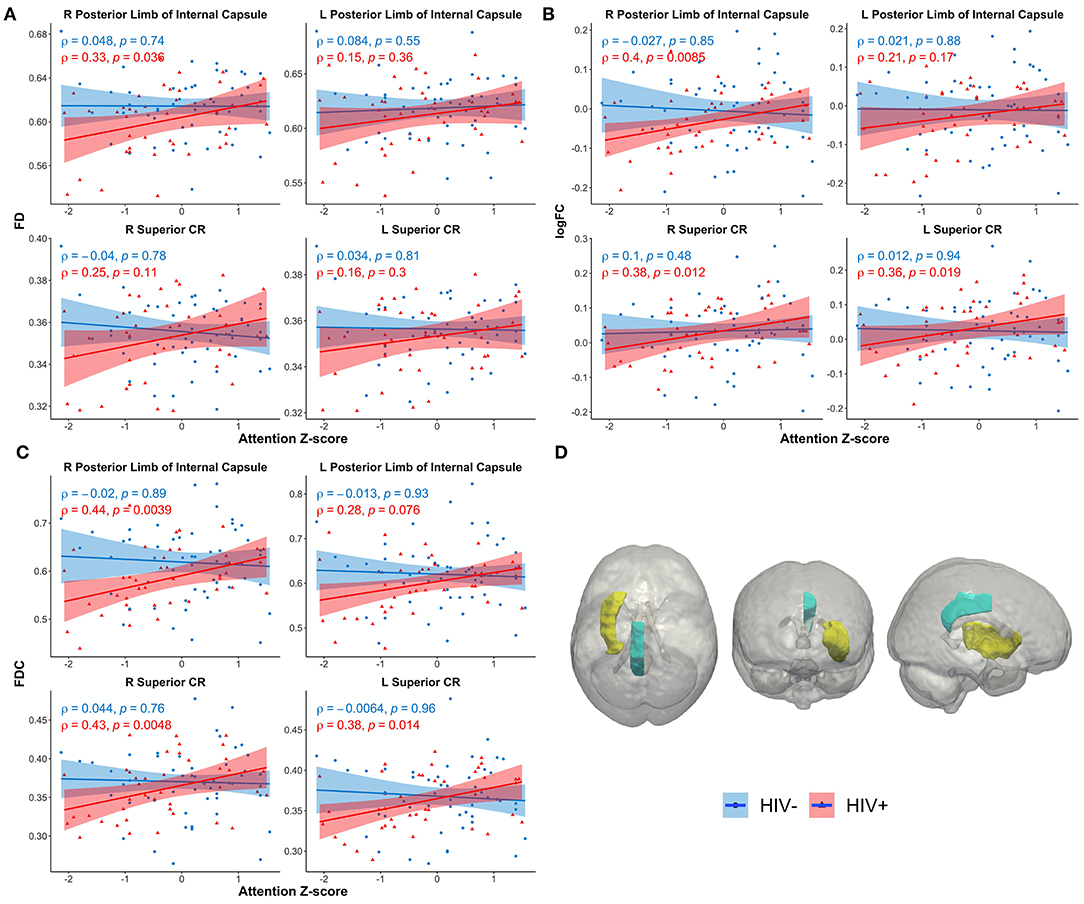
Figure 4. Scatterplots show attention z-score as a function of FBA metrics: (A) fiber density (FD), (B) log of fiber cross section (logFC), (C) fiber density and cross section (FDC), (D) JHU white matter atlas and corresponding regions of interest. Only significant regions are shown. Solid lines represent linear fit, and shaded areas represent the 95% confidence interval. IC, internal capsule (yellow); CR, corona radiata (teal); CR, corona radiata.
Additionally, the right PLIC was also found to be significantly correlated with tau protein in HIV+ individuals (ρ = 0.32, p = 0.043; Supplementary Figure S2). However, no significant associations were observed between FBA metrics and NfL.
Tract-Based Spatial Statistics (DTI and fwcDTI)
No significant differences between HIV+ and HIV– cohorts were observed in FA and FAT using TBSS (Supplementary Figure S3). TBSS of FAT, while not significant, highlighted areas that were decreased in HIV+ individuals compared to HIV– individuals. It should be noted that in our study, the TBSS figures (Supplementary Figure S3) report regions found for p < 0.5. None of the regions survived for significance thresholding for p < 0.05.
Machine Learning Classification
Overall, we found that the use of fixel-based metrics resulted in a higher precision and recall compared to when using fwcDTI metrics. The adaptive boosting (AdaBoost) and random forest methods resulted in the highest recall and f1-score, and the highest precision was achieved with AdaBoost. Figure 5 shows the ROC and PRC curves using an AdaBoost multiclass classifier. Table 3 represents the sample averaged precision, recall, and f1-scores for other classifiers contrasting specificity of FBA and fwcDTI using five-fold cross-validation. In addition, the ROC and PRC curves for LDA, random forest, and naïve Bayes are provided in the Supplementary Figure S4. Decision boundaries for each classifier are also provided in Supplementary Figure S5.
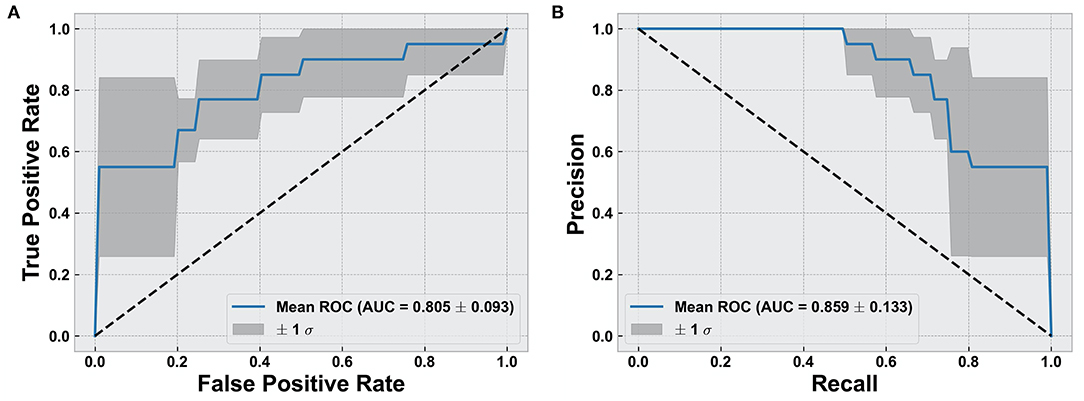
Figure 5. Evaluation of classification results using AdaBoost classifier. (A) Receiver operating characteristic (ROC) curve for cognitively normal compared to cognitively impaired (CI). (B) Precision vs. recall curve (PRC) for cognitively normal compared to CI. Solid line represents the mean curve using five-fold cross-validation. Shaded areas represent ± 1 standard deviation. AUC reported as mean ± standard deviation across five-fold.
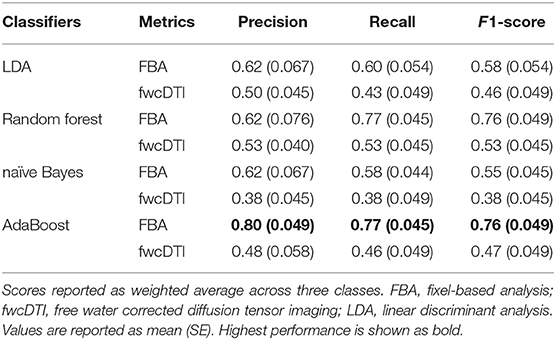
Table 3. Precision, recall, and F1-scores for five different classifiers for FBA and fwcDTI metrics reported using five-fold cross-validation in HIV+ subjects only.
Discussion
In this study, we evaluated fiber tract-specific WM changes in HIV infection using FBA, DTI, and fwcDTI metrics. The major findings of this work were as follows: (a) HIV+ individuals exhibit axonal degradation within the PLIC, CP, and SCR as revealed by FBA. (b) Similar trends were observed using TBSS of FA and FAT. In contrast to FA, FAT showed trends toward more areas that were decreased in HIV+ individuals compared to HIV– individuals. (c) FBA metrics in PLIC and SCR exhibit significant positive associations with attention cognitive z-scores in HIV+ individuals. (d) Machine learning classifiers for FBA reliably distinguished between cognitively normal patients and those with cognitive impairment in patients with HIV infection.
To the best of our knowledge, this is the first study investigating FBA and TBSS of fwcDTI metrics (FAT and MDT) in HIV-infected individuals. The work presented here provides a comprehensive and robust framework for evaluating brain injury (and secondary chronic inflammation) in the setting of HIV. Chronic neuroinflammation results in damage to the CNS, alteration of the blood–brain barrier (BBB), and chronic edema (65). Changes in whole-brain FBA were found along distinct fiber tracts associated with motor and attention cognitive domains. In particular PLIC, CP, MCP, and SCR were affected and exhibited reduced fiber density and fiber bundle cross section in HIV+ individuals compared to HIV– individuals. ROI-based analysis revealed lower mean fixel-based metrics in the HIV+ cohort compared to the HIV– cohort, consistent with those obtained from the whole-brain FBA results.
Previous work using DTI has shown that FA is decreased in corticospinal tract and that MD is increased in the corticospinal tract (CST) bilaterally (23). However, FW contamination results in fitting each voxel with an isotropic tensor, leading to an erroneous conclusion that FA is decreased in the presence of edema (12). Consistent with previous work, our findings suggest that axonal degeneration occurs only in fixels associated with the CST in HIV infection, but accounting for edema and FW contamination. Moreover, FBA is a more robust method to evaluate WM structural integrity compared to TBSS, with or without FW correction. This is likely because constrained spherical deconvolution is dependent on the response function, which is estimated separately and independently for each tissue type, ultimately better modeling the FOD (48).
In addition, our findings are consistent with previous work investigating WM in HIV infection, and with the clinical presentation of HAND (2). However, the present study emphasizes FBA to provide a more robust means to evaluate WM structural integrity independent of partial volume effects and FW contamination. Although we only saw trends using TBSS of fwcDTI, it is reasonable to implement this approach to DTI data. Clinically, HAND is a spectrum of disorders in which patients may present with difficulties in cognition, particularly declines in psychomotor processing, attention, and memory. Of interest, the role of the corona radiata in motor pathways is well-established; however, recent studies have suggested that the corona radiata is related to attention as well (66). As a major WM intersection, it is possible that damage to the corona radiata, observed in this study, affects both corticospinal fibers as well as association fibers passing through the SCR, contributing to the diffuse cognitive changes seen in HAND, particularly psychomotor slowing. Additionally, the default mode network (DMN) has been implicated in HIV and HAND (9). The DMN is primarily composed of the medial prefrontal cortex, posterior cingulate cortex, precuneus, and angular gyrus. Moreover, the DMN, a task-negative network, is associated with attention and memory. Thus, it might be possible that degeneration of association fibers passing through the corona radiata and internal capsule disrupt connections to the DMN (67).
We also investigated the relationship between fixel-based metrics (i.e., FD, logFC, and FDC) and inflammatory blood markers including CD4, VL, and neuronal markers NfL, and tau protein in HIV+ individuals. The PLIC was the only structure significantly correlated with tau protein (ρ = 0.32, p = 0.043). No other blood markers were significantly correlated with fixel-based metrics. Tau protein is a component of the neurofibrillary tangles most often associated with Alzheimer's disease (68). However, increasing evidence suggests that chronic neuroinflammation in the setting of HIV infection predisposes HIV+ individuals to premature neurodegeneration as measured by tau protein (69).
Lastly, four machine learning classifiers were used to classify cognitive status in HIV+ individuals using fixel-based and free water corrected DTI metrics. In general, we observed that fixel-based metrics results in improved performance as measured with precision, recall, and f1-score, compared to fwcDTI metrics. Additionally, ensemble machine learning methods (random forest and AdaBoost) resulted in higher precision, recall and f1-score as compared with discriminant methods (LDA and naïve Bayes). This is likely because ensemble methods utilize bootstrapping and bagging methods that lower the variance of the overall model. However, as suggested by the decision boundaries in Supplementary Figure S5, it is possible that these findings are due to overfitting given the small sample size, and should be interpreted with caution. Additionally, we observed that AdaBoost resulted in a higher precision than the random forest classifier, likely because in AdaBoost, weak classifiers are built sequentially propagating the errors from prior weak learners, whereas in random forest algorithms the decision trees are grown in parallel and as such are independent from each other. Inclusion of other relevant imaging metrics and biomarkers is likely to further improve prediction of developing HAND.
This study has some limitations. First, only one of the HIV+ subjects in the study had mild neurological disorder (MND); therefore, our study was mostly composed of cognitively normal subjects and patients with ANI. However, MND and ANI were combined and categorized as CI. Second, the proportion of male and female subjects was not equal in the HIV+ cohort. However, FBA and DTI metrics were not significantly different in males vs. females in our HIV– participants, which had a more equal representation. Though sex was used as a covariate in between-group analyses, we cannot rule out this possible bias in our findings. Third, as noted previously, the FD is dependent on the b-value, and a higher correspondence between the intra-axonal volume occurs at higher b-values (b >2,000 s/mm2). Thus, it is important to note that at b = 1,000 s/mm2, the AFD may reflect the overall WM density and not just the intra-axonal volume fraction (44). Fourth, it is worth noting that given the small size of our dataset, classification results obtained here are preliminary and need to be further validated in a larger dataset. However, utilization of stratified sampling, standardization, cross-validation, and boosting algorithms have been shown to obviate overfitting when dealing with very small datasets (70, 71). Future research will investigate the utility of fixel-based metrics in evaluating HIV-associated neuroinflammation longitudinally and developing prognostic machine learning models for predicting HAND longitudinally.
Conclusions
Our findings suggest that FBA may be reflective of WM structural integrity in the setting of chronic neuroinflammation in HIV population. Our results indicate that degeneration occurs along specific fiber tracts, which manifests as both macrostructural and microstructural alterations, particularly in the internal capsule and corona radiata in HIV+ individuals. Moreover, our findings are consistent with the clinical presentation of HAND, which often presents as psychomotor slowing with impaired attention, memory, and fine motor function. TBSS-based analysis of free water corrected and uncorrected DTI metrics showed decreasing trends between the HIV+ and HIV– control group. However, these were not significant, suggesting lower sensitivity for the level of pathology in the cohort under investigation compared to FBA. Therefore, FBA may provide a sensitive biomarker to monitor axonal degeneration in individuals with HIV infection.
Data Availability Statement
The data analyzed in this study is subject to the following licenses/restrictions: Anonymized data will be made available on reasonable request, pending appropriate institutional review board approvals. Requests to access these datasets should be directed to Giovanni Schifitto, R2lvdmFubmlfU2NoaWZpdHRvQFVSTUMuUm9jaGVzdGVyLmVkdQ==.
Ethics Statement
The studies involving human participants were reviewed and approved by the University of Rochester Research Subjects Review Board (RSRB). The patients/participants provided their written informed consent to participate in this study.
Author Contributions
AFi: study concept, image processing, data analysis and interpretation, manuscript writing, and original draft. AFa: image processing, data analysis and interpretation, and manuscript review for intellectual content. MW: cognitive data collection and manuscript review for intellectual content. XQ: statistical interpretation and manuscript review for intellectual content. MU: study concept and interpretation and manuscript writing and review for intellectual content. JZ: manuscript review for intellectual content. GS: project administration, funding acquisition, interpretation, and manuscript review for intellectual content. All authors contributed to the article and approved the submitted version.
Funding
This work was supported by the National Institutes of Health (NIH) Grants R01-MH099921, R01-AG054328, and R01-MH118020.
Conflict of Interest
The authors declare that the research was conducted in the absence of any commercial or financial relationships that could be construed as a potential conflict of interest.
Publisher's Note
All claims expressed in this article are solely those of the authors and do not necessarily represent those of their affiliated organizations, or those of the publisher, the editors and the reviewers. Any product that may be evaluated in this article, or claim that may be made by its manufacturer, is not guaranteed or endorsed by the publisher.
Acknowledgments
We thank our study participants and staff who were involved in image acquisition and clinical/neurocognitive assessments.
Supplementary Material
The Supplementary Material for this article can be found online at: https://www.frontiersin.org/articles/10.3389/fneur.2021.725059/full#supplementary-material
Supplementary Figure S1. Boxplots of cognitive domain Z-scores by HIV-status. Worse scores (negative Z-scores) for attention, memory, and overall cognitive summary score were observed in the HIV+ individuals compared to HIV uninfected individuals. Significant group differences are shown with p < 0.05.
Supplementary Figure S2. Relationship between fiber density and cross-section (FDC) and Tau protein in HIV+ cohort. Only significant regions shown. Solid lines represent linear fit, and shaded areas represent the 95% confidence interval. IC, internal capsule.
Supplementary Figure S3. Group comparisons of (A) FA, (B) FAT, and (C) MDT using TBSS. Statistical maps thresholded at 0.5 (not significant) show regions where FA and FAT are reduced in HIV+ individuals compared to HIV– individuals. FA, fractional anisotropy; FAT, free water corrected fractional anisotropy; Blue represents reduced FA or FAT in the HIV+ compared to HIV– individuals.
Supplementary Figure S4. Evaluation of classification results using (A) LDA, (B) random forest, and (C) naïve Bayes. Left column: receiver operating characteristic (ROC) curve for cognitively normal compared to cognitively impaired (CI). Right column: precision-recall curve (PRC) for cognitively normal compared to CI. Solid line represents the mean curve using five-fold cross validation. Shaded areas represent ± 1 standard deviation. AUC reported as mean ± standard deviation across five-folds.
Supplementary Figure S5. Decision boundaries of classifiers (A) LDA, (B) Naïve Bayes, (C) Random Forest, and (D) AdaBoost. Shaded red area indicates region where instances are classified as cognitively normal, and gray region indicates the area where instances are classified as cognitively impaired (CI). The border between these two regions represents the decision boundary for each classifier. PC1: first principal component, PC2: second principal component.
Abbreviations
cART, combined antiretroviral therapy; CNS, central nervous system; BBB, blood–brain barrier; WM, white matter; HAND, HIV-associated neurocognitive disorder; FW, free water; DTI, diffusion tensor imaging; FA, fractional anisotropy; AD, axial diffusivity; RD, radial diffusivity; MD, mean diffusivity; TBSS, tract-based spatial statistics; CSF, cerebrospinal fluid; FAT, free water corrected FA; MDT, free water corrected MD; FBA, fixel-based analysis; FD, fiber density; FC, fiber bundle cross section; FDC, fiber density cross section; AFD, apparent fiber density; FOD, fiber orientation distribution; MT-CSD, multi tissue constrained spherical deconvolution; GM, gray matter; NfL, neurofilament light chain; VVL, viral load; GLM, general linear model; CFE, connectivity-based fixel enhancement; FDR, false discovery rate; ROI, region of interest; TFCE, threshold-free cluster enhancement; WNL, within normal limits; ANI, asymptomatic neurological impairment; MND, minor neurocognitive impairment; CI, cognitively impaired; kPCA, kernel principal component analysis; LDA, linear discriminant analysis; PPV, positive predictive value; ROC, receiver operating characteristic; AUC, area under the curve; fwcDTI, free water corrected DTI; DWI, diffusion weighted imaging; PLIC, posterior limb of the internal capsule; MCP, middle cerebellar peduncles; SCR, superior corona radiata; CP, cerebellar peduncle; SLF, superior longitudinal fasciculus; AdaBoost, adaptive boosting; PRC, precision-recall curve; DMN, default mode network, CST, corticospinal tract.
References
1. Collaboration H-C, Ray M, Logan R, Sterne JA, Hernandez-Diaz S, Robins JM, et al. The effect of combined antiretroviral therapy on the overall mortality of HIV-infected individuals. AIDS. (2010) 24:123–37. doi: 10.1097/QAD.0b013e3283324283
2. Clifford DB, Ances BM. HIV-associated neurocognitive disorder. Lancet Infect Dis. (2013) 13:976–86. doi: 10.1016/S1473-3099(13)70269-X
3. Atluri VS, Hidalgo M, Samikkannu T, Kurapati KR, Jayant RD, Sagar V, et al. Effect of human immunodeficiency virus on blood-brain barrier integrity and function: an update. Front Cell Neurosci. (2015) 9:212. doi: 10.3389/fncel.2015.00212
4. Bissel SJ, Wiley CA. Human immunodeficiency virus infection of the brain: pitfalls in evaluating infected/affected cell populations. Brain Pathol. (2004) 14:97–108. doi: 10.1111/j.1750-3639.2004.tb00503.x
5. Yadav A, Collman RG. CNS inflammation and macrophage/microglial biology associated with HIV-1 infection. J Neuroimmune Pharmacol. (2009) 4:430–47. doi: 10.1007/s11481-009-9174-2
6. Liu H, Xu E, Liu J, Xiong H. Oligodendrocyte injury and pathogenesis of HIV-1-associated neurocognitive disorders. Brain Sci. (2016) 6:23. doi: 10.3390/brainsci6030023
7. Alakkas A, Ellis RJ, Watson CW, Umlauf A, Heaton RK, Letendre S, et al. White matter damage, neuroinflammation, and neuronal integrity in HAND. J Neurovirol. (2019) 25:32–41. doi: 10.1007/s13365-018-0682-9
8. Ances BM, Hammoud DA. Neuroimaging of HIV-associated neurocognitive disorders (HAND). Curr Opin HIV AIDS. (2014) 9:545–51. doi: 10.1097/COH.0000000000000112
9. Zhuang Y, Qiu X, Wang L, Ma Q, Mapstone M, Luque A, et al. Combination antiretroviral therapy improves cognitive performance and functional connectivity in treatment-naive HIV-infected individuals. J Neurovirol. (2017) 23:704–12. doi: 10.1007/s13365-017-0553-9
10. Zhuang Y, Zhang Z, Tivarus M, Qiu X, Zhong J, Schifitto G. Whole-brain computational modeling reveals disruption of microscale brain dynamics in HIV infected individuals. Hum Brain Mapp. (2021) 42:95–109. doi: 10.1002/hbm.25207
11. Stamatovic SM, Dimitrijevic OB, Keep RF, Andjelkovic AV. Inflammation and brain edema: new insights into the role of chemokines and their receptors. Acta Neurochir Suppl. (2006) 96:444–50. doi: 10.1007/3-211-30714-1_91
12. Pasternak O, Sochen N, Gur Y, Intrator N, Assaf Y. Free water elimination and mapping from diffusion MRI. Magn Reson Med. (2009) 62:717–30. doi: 10.1002/mrm.22055
13. Basser PJ, Mattiello J, LeBihan D. MR diffusion tensor spectroscopy and imaging. Biophys J. (1994) 66:259–67. doi: 10.1016/S0006-3495(94)80775-1
14. Le Bihan D, Mangin JF, Poupon C, Clark CA, Pappata S, Molko N, et al. Diffusion tensor imaging: concepts and applications. J Magn Reson Imaging. (2001) 13:534–46. doi: 10.1002/jmri.1076
15. Alexander AL, Lee JE, Lazar M, Field AS. Diffusion tensor imaging of the brain. Neurotherapeutics. (2007) 4:316–29. doi: 10.1016/j.nurt.2007.05.011
16. Beaulieu C. The basis of anisotropic water diffusion in the nervous system–a technical review. NMR Biomed. (2002) 15:435–55. doi: 10.1002/nbm.782
17. Nir TM, Jahanshad N, Busovaca E, Wendelken L, Nicolas K, Thompson PM, et al. Mapping white matter integrity in elderly people with HIV. Hum Brain Mapp. (2014) 35:975–92. doi: 10.1002/hbm.22228
18. Filippi CG, Ulug AM, Ryan E, Ferrando SJ, van Gorp W. Diffusion tensor imaging of patients with HIV and normal-appearing white matter on MR images of the brain. Am J Neuroradiol. (2001) 22:277–83.
19. Chang L, Wong V, Nakama H, Watters M, Ramones D, Miller EN, et al. Greater than age-related changes in brain diffusion of HIV patients after 1 year. J Neuroimmune Pharmacol. (2008) 3:265–74. doi: 10.1007/s11481-008-9120-8
20. Gongvatana A, Schweinsburg BC, Taylor MJ, Theilmann RJ, Letendre SL, Alhassoon OM, et al. White matter tract injury and cognitive impairment in human immunodeficiency virusinfected individuals. J Neurovirol. (2009) 15:187–95. doi: 10.1080/13550280902769756
21. Kamat R, Brown GG, Bolden K, Fennema-Notestein C, Archibald S, Marcotte TD, et al. Apathy is associated with white matter abnormalities in anterior, medial brain regions in persons with HIV infection. J Clin Exp Neuropsychol. (2014) 36:854–66. doi: 10.1080/13803395.2014.950636
22. Hoare J, Fouche J-P, Phillips N, Joska JA, Donald KA, Thomas K, et al. Clinical associations of white matter damage in cART-treated HIV-positive children in South Africa. J Neurovirol. (2015) 21:120–8. doi: 10.1007/s13365-014-0311-1
23. Oh SW, Shin NY, Choi JY, Lee SK, Bang MR. Altered white matter integrity in human immunodeficiency virus-associated neurocognitive disorder: a tract-based spatial statistics study. Korean J Radiol. (2018) 19:431–42. doi: 10.3348/kjr.2018.19.3.431
24. Smith SM, Jenkinson M, Johansen-Berg H, Rueckert D, Nichols TE, Mackay CE, et al. Tract-based spatial statistics: voxelwise analysis of multi-subject diffusion data. Neuroimage. (2006) 31:1487–505. doi: 10.1016/j.neuroimage.2006.02.024
25. Zhu T, Zhong J, Hu R, Tivarus M, Ekholm S, Harezlak J, et al. Patterns of white matter injury in HIV infection after partial immune reconstitution: a DTI tract-based spatial statistics study. J Neurovirol. (2013) 19:10–23. doi: 10.1007/s13365-012-0135-9
26. Archer DB, Patten C, Coombes SA. Free-water and free-water corrected fractional anisotropy in primary and premotor corticospinal tracts in chronic stroke. Hum Brain Mapp. (2017) 38:4546–62. doi: 10.1002/hbm.23681
27. Pasternak O, Westin CF, Dahlben B, Bouix S, Kubicki M. The extent of diffusion MRI markers of neuroinflammation and white matter deterioration in chronic schizophrenia. Schizophr Res. (2015) 161:113–8. doi: 10.1016/j.schres.2014.07.031
28. Uddin MN, Faiyaz A, Wang L, Zhuang Y, Murray KD, Descoteaux M, et al. A longitudinal analysis of brain extracellular free water in HIV infected individuals. Sci Rep. (2021) 11:8273. doi: 10.1038/s41598-021-87801-y
29. Bergamino M, Kuplicki R, Victor TA, Cha YH, Paulus MP. Comparison of two different analysis approaches for DTI free-water corrected and uncorrected maps in the study of white matter microstructural integrity in individuals with depression. Hum Brain Mapp. (2017) 38:4690–702. doi: 10.1002/hbm.23694
30. Bergamino M, Pasternak O, Farmer M, Shenton ME, Hamilton JP. Applying a free-water correction to diffusion imaging data uncovers stress-related neural pathology in depression. Neuroimage Clin. (2016) 10:336–42. doi: 10.1016/j.nicl.2015.11.020
31. Mandl RC, Pasternak O, Cahn W, Kubicki M, Kahn RS, Shenton ME, et al. Comparing free water imaging and magnetization transfer measurements in schizophrenia. Schizophr Res. (2015) 161:126–32. doi: 10.1016/j.schres.2014.09.046
32. Duering M, Finsterwalder S, Baykara E, Tuladhar AM, Gesierich B, Konieczny MJ, et al. Free water determines diffusion alterations and clinical status in cerebral small vessel disease. Alzheimers Dement. (2018) 14:764–74. doi: 10.1016/j.jalz.2017.12.007
33. Albi A, Pasternak O, Minati L, Marizzoni M, Bartrés-Faz D, Bargalló N, et al. Free water elimination improves test–retest reproducibility of diffusion tensor imaging indices in the brain: a longitudinal multisite study of healthy elderly subjects. Hum Brain Mapp. (2017) 38:12–26. doi: 10.1002/hbm.23350
34. Jeurissen B, Leemans A, Tournier JD, Jones DK, Sijbers J. Investigating the prevalence of complex fiber configurations in white matter tissue with diffusion magnetic resonance imaging. Hum Brain Mapp. (2013) 34:2747–66. doi: 10.1002/hbm.22099
35. Bach M, Laun FB, Leemans A, Tax CM, Biessels GJ, Stieltjes B, et al. Methodological considerations on tract-based spatial statistics (TBSS). Neuroimage. (2014) 100:358–69. doi: 10.1016/j.neuroimage.2014.06.021
36. Raffelt DA, Tournier JD, Smith RE, Vaughan DN, Jackson G, Ridgway GR, et al. Investigating white matter fibre density and morphology using fixel-based analysis. Neuroimage. (2017) 144(Pt A):58–73. doi: 10.1016/j.neuroimage.2016.09.029
37. Rau Y-A, Wang S-M, Tournier J-D, Lin S-H, Lu C-S, Weng Y-H, et al. A longitudinal fixel-based analysis of white matter alterations in patients with Parkinson's disease. Neuroimage Clin. (2019) 24:102098. doi: 10.1016/j.nicl.2019.102098
38. Li Y, Guo T, Guan X, Gao T, Sheng W, Zhou C, et al. Fixel-based analysis reveals fiber-specific alterations during the progression of Parkinson's disease. Neuroimage Clin. (2020) 27:102355. doi: 10.1016/j.nicl.2020.102355
39. Storelli L, Pagani E, Preziosa P, Filippi M, Rocca MA. Measurement of white matter fiber-bundle cross-section in multiple sclerosis using diffusion-weighted imaging. Multiple Scler J. (2021) 27:818–26. doi: 10.1177/1352458520938999
40. Carandini T, Mancini M, Bogdan I, Rae CL, Barritt AW, Sethi A, et al. Disruption of brainstem monoaminergic fibre tracts in multiple sclerosis as a putative mechanism for cognitive fatigue: a fixel-based analysis. Neuroimage Clin. (2021) 30:102587. doi: 10.1016/j.nicl.2021.102587
41. Wallace EJ, Mathias JL, Ward L, Fripp J, Rose S, Pannek K. A fixel-based analysis of micro-and macro-structural changes to white matter following adult traumatic brain injury. Hum Brain Mapp. (2020) 41:2187–97. doi: 10.1002/hbm.24939
42. Verhelst H, Giraldo D, Vander Linden C, Vingerhoets G, Jeurissen B, Caeyenberghs K. Cognitive training in young patients with traumatic brain injury: a fixel-based analysis. Neurorehabil Neural Repair. (2019) 33:813–24. doi: 10.1177/1545968319868720
43. Choy SW, Bagarinao E, Watanabe H, Ho ETW, Maesawa S, Mori D, et al. Changes in white matter fiber density and morphology across the adult lifespan: a cross-sectional fixel-based analysis. Hum Brain Mapp. (2020) 41:3198–211. doi: 10.1002/hbm.25008
44. Genc S, Tax CMW, Raven EP, Chamberland M, Parker GD, Jones DK. Impact of b-value on estimates of apparent fibre density. Hum Brain Mapp. (2020) 41:2583–95. doi: 10.1002/hbm.24964
45. Tournier JD, Calamante F, Connelly A. Robust determination of the fibre orientation distribution in diffusion MRI: non-negativity constrained super-resolved spherical deconvolution. Neuroimage. (2007) 35:1459–72. doi: 10.1016/j.neuroimage.2007.02.016
46. Tournier JD, Yeh CH, Calamante F, Cho KH, Connelly A, Lin CP. Resolving crossing fibres using constrained spherical deconvolution: validation using diffusion-weighted imaging phantom data. Neuroimage. (2008) 42:617–25. doi: 10.1016/j.neuroimage.2008.05.002
47. Jeurissen B, Tournier JD, Dhollander T, Connelly A, Sijbers J. Multi-tissue constrained spherical deconvolution for improved analysis of multi-shell diffusion MRI data. Neuroimage. (2014) 103:411–26. doi: 10.1016/j.neuroimage.2014.07.061
48. Newman BT, Dhollander T, Reynier KA, Panzer MB, Druzgal TJ. Test-retest reliability and long-term stability of three-tissue constrained spherical deconvolution methods for analyzing diffusion MRI data. Magn Reson Med. (2020) 84:2161–73. doi: 10.1002/mrm.28242
49. Gandhi NS, Moxley RT, Creighton J, Roosa HV, Skolasky RL, Selnes OA, et al. Comparison of scales to evaluate the progression of HIV-associated neurocognitive disorder. HIV Ther. (2010) 4:371–9. doi: 10.2217/hiv.10.23
50. Andersson JL, Skare S, Ashburner J. How to correct susceptibility distortions in spin-echo echo-planar images: application to diffusion tensor imaging. Neuroimage. (2003) 20:870–88. doi: 10.1016/S1053-8119(03)00336-7
51. Andersson JLR, Sotiropoulos SN. An integrated approach to correction for off-resonance effects and subject movement in diffusion MR imaging. Neuroimage. (2016) 125:1063–78. doi: 10.1016/j.neuroimage.2015.10.019
52. Tournier JD, Smith R, Raffelt D, Tabbara R, Dhollander T, Pietsch M, et al. MRtrix3: a fast, flexible and open software framework for medical image processing and visualisation. Neuroimage. (2019) 202:116137. doi: 10.1016/j.neuroimage.2019.116137
53. Dhollander T, Mito R, Raffelt D, Connelly A. Improved white matter response function estimation for 3-tissue constrained spherical deconvolution. In: 27th International Society of Magnetic Resonance in Medicine. Montreal, QC (2019).
54. Dhollander T, Connelly A. A novel iterative approach to reap the benefits of multi-tissue CSD from just single-shell (+b=0) diffusion MRI data. In: 24th International Society of Magnetic Resonanc in Medicine. Singapore (2016).
55. Raffelt D, Tournier JD, Fripp J, Crozier S, Connelly A, Salvado O. Symmetric diffeomorphic registration of fibre orientation distributions. Neuroimage. (2011) 56:1171–80. doi: 10.1016/j.neuroimage.2011.02.014
56. Smith RE, Tournier JD, Calamante F, Connelly A. SIFT: spherical-deconvolution informed filtering of tractograms. Neuroimage. (2013) 67:298–312. doi: 10.1016/j.neuroimage.2012.11.049
57. Behrens TE, Woolrich MW, Jenkinson M, Johansen-Berg H, Nunes RG, Clare S, et al. Characterization and propagation of uncertainty in diffusion-weighted MR imaging. Magn Reson Med. (2003) 50:1077–88. doi: 10.1002/mrm.10609
58. Dumont M, Roy M, Jodoin P-M, Morency FC, Houde J-C, Xie Z, et al. Free water in white matter differentiates MCI and AD from control subjects. Front Aging Neurosci. (2019) 11:270. doi: 10.3389/fnagi.2019.00270
59. Di Tommaso P, Chatzou M, Floden EW, Barja PP, Palumbo E, Notredame C. Nextflow enables reproducible computational workflows. Nat Biotechnol. (2017) 35:316. doi: 10.1038/nbt.3820
60. Kurtzer GM, Sochat V, Bauer MW. Singularity: scientific containers for mobility of compute. PLoS ONE. (2017) 12:e0177459. doi: 10.1371/journal.pone.0177459
61. Benjamini Y, Hochberg Y. Controlling the false discovery rate: a practical and powerful approach to multiple testing. J R Stat Soc Ser B. (1995) 57:289–300. doi: 10.1111/j.2517-6161.1995.tb02031.x
62. Raffelt DA, Smith RE, Ridgway GR, Tournier JD, Vaughan DN, Rose S, et al. Connectivity-based fixel enhancement: whole-brain statistical analysis of diffusion MRI measures in the presence of crossing fibres. Neuroimage. (2015) 117:40–55. doi: 10.1016/j.neuroimage.2015.05.039
63. Smith SM, Nichols TE. Threshold-free cluster enhancement: addressing problems of smoothing, threshold dependence and localisation in cluster inference. Neuroimage. (2009) 44:83–98. doi: 10.1016/j.neuroimage.2008.03.061
64. Abraham A, Pedregosa F, Eickenberg M, Gervais P, Mueller A, Kossaifi J, et al. Machine learning for neuroimaging with scikit-learn. Front Neuroinform. (2014) 8:14. doi: 10.3389/fninf.2014.00014
65. Hong S, Banks WA. Role of the immune system in HIV-associated neuroinflammation and neurocognitive implications. Brain Behav Immun. (2015) 45:1–12. doi: 10.1016/j.bbi.2014.10.008
66. Stave EA, De Bellis MD, Hooper SR, Woolley DP, Chang SK, Chen SD. Dimensions of attention associated with the microstructure of corona radiata white matter. J Child Neurol. (2017) 32:458–66. doi: 10.1177/0883073816685652
67. Luo L, Xu L, Jung R, Pearlson G, Adali T, Calhoun VD. Constrained source-based morphometry identifies structural networks associated with default mode network. Brain Connect. (2012) 2:33–43. doi: 10.1089/brain.2011.0026
68. Mandelkow EM, Mandelkow E. Biochemistry and cell biology of tau protein in neurofibrillary degeneration. Cold Spring Harb Perspect Med. (2012) 2:a006247. doi: 10.1101/cshperspect.a006247
69. Brown LA, Scarola J, Smith AJ, Sanberg PR, Tan J, Giunta B. The role of tau protein in HIV-associated neurocognitive disorders. Mol Neurodegener. (2014) 9:40. doi: 10.1186/1750-1326-9-40
70. Vabalas A, Gowen E, Poliakoff E, Casson AJ. Machine learning algorithm validation with a limited sample size. PLoS ONE. (2019) 14:e0224365. doi: 10.1371/journal.pone.0224365
Keywords: HIV, diffusion MRI (dMRI), fixel-based analysis, free water imaging, machine learning, cognitive impairment, brain, white matter (WM)
Citation: Finkelstein A, Faiyaz A, Weber MT, Qiu X, Uddin MN, Zhong J and Schifitto G (2021) Fixel-Based Analysis and Free Water Corrected DTI Evaluation of HIV-Associated Neurocognitive Disorders. Front. Neurol. 12:725059. doi: 10.3389/fneur.2021.725059
Received: 14 June 2021; Accepted: 04 October 2021;
Published: 04 November 2021.
Edited by:
Maria Petracca, Sapienza University of Rome, ItalyReviewed by:
Giuseppe Pontillo, University of Naples Federico II, ItalyChun-Hung Yeh, Chang Gung University, Taiwan
Copyright © 2021 Finkelstein, Faiyaz, Weber, Qiu, Uddin, Zhong and Schifitto. This is an open-access article distributed under the terms of the Creative Commons Attribution License (CC BY). The use, distribution or reproduction in other forums is permitted, provided the original author(s) and the copyright owner(s) are credited and that the original publication in this journal is cited, in accordance with accepted academic practice. No use, distribution or reproduction is permitted which does not comply with these terms.
*Correspondence: Md Nasir Uddin, bmFzaXJfdWRkaW5AdXJtYy5yb2NoZXN0ZXIuZWR1