 Ning Luo1*†
 Lihua Peng
- 1Department of Endocrinology, Chenzhou No. 1 People's Hospital, Chenzhou, China
- 2Department of Geriatrics, Chenzhou No. 1 People's Hospital, Chenzhou, China
- 3Department of Clinical Laboratory, Chenzhou No. 4 People's Hospital, Chenzhou, China
- 4Breast Health Care Center, Chenzhou No. 1 People's Hospital, Chenzhou, China
Objective: Through transcriptomic and metabolomic analyses, this study examined the role of high-fiber diet in obesity complicated by diabetes and neurodegenerative symptoms.
Method: The expression matrix of high-fiber-diet-related metabolites, blood methylation profile associated with pre-symptomatic dementia in elderly patients with type 2 diabetes mellitus (T2DM), and high-throughput single-cell sequencing data of hippocampal samples from patients with Alzheimer's disease (AD) were retrieved from the Gene Expression Omnibus (GEO) database and through a literature search. Data were analyzed using principal component analysis (PCA) after quality control and data filtering to identify different cell clusters and candidate markers. A protein–protein interaction network was mapped using the STRING database. To further investigate the interaction among high-fiber-diet-related metabolites, methylation-related DEGs related to T2DM, and single-cell marker genes related to AD, AutoDock was used for semi-flexible molecular docking.
Result: Based on GEO database data and previous studies, 24 marker genes associated with high-fiber diet, T2DM, and AD were identified. Top 10 core genes include SYNE1, ANK2, SPEG, PDZD2, KALRN, PTPRM, PTPRK, BIN1, DOCK9, and NPNT, and their functions are primarily related to autophagy. According to molecular docking analysis, acetamidobenzoic acid, the most substantially altered metabolic marker associated with a high-fiber diet, had the strongest binding affinity for SPEG.
Conclusion: By targeting the SPEG protein in the hippocampus, acetamidobenzoic acid, a metabolite associated with high-fiber diet, may improve diabetic and neurodegenerative diseases in obese people.
1. Introduction
The incidence of obesity is increasing annually worldwide. According to the recent data published in NEJM, the incidence of obesity has been increasing at a high rate since the 1980s, with the incidence rate being 12 and 5% among adults and children, respectively. The number of individuals with obesity is highest in China (1, 2). Obesity and type 2 diabetes mellitus (T2DM) significantly increase the incidence of neurodegenerative diseases such as depression, dementia, stroke, and memory loss (3–8). Chronic systemic inflammation throughout the body is a common feature of obesity and diabetes and may be present in the central nervous system, suggesting an important relationship among obesity, diabetes, and neurodegenerative diseases (9). Therefore, examining the regulation of energy balance in obesity and identifying biomarkers are major research directions at present.
The central nervous system plays an important role in regulating energy balance in the body, energy metabolism is also linked to the health of the central nervous system (10–14). As the main appetite control center of the hypothalamus, the arcuate nucleus region (ARC) is one of the most studied neural circuits for energy balance (10). As the sensors of peripheral nutrients and hormones, AgRP and POMC neurons in the ARC are considered key neurons involved in sensing the global energy status of an organism and playing an important role in diet and weight regulation (15–18). In a state of energy surplus, POMC neurons release neuropeptides such as α-MSH, which have appetite-suppressing effects, to reduce the energy intake of the body, thereby maintaining body weight (17). There are network loops in the hypothalamus that regulate feeding and are precisely interconnected (19). The hippocampus is part of the limbic nervous system. In addition to its relevance to cognition and learning, it has received increasing attention in the study of feeding and digestion; processing visceral sensory information and participating in the regulation of energy balance mainly through connections with the hypothalamus, amygdala and medulla (20, 21). This phenomenon may be attributed to the regulation of the hypothalamus via the hippocampal–hypothalamic neural loop. Direct neural projections from the ventral pole of hippocampal CA1 to hypothalamic loci are involved in the control of food intake (22). In a study, significant alterations in feeding behavior were observed in rats with a damaged hippocampus. The effects of nesfatin-1 on GD-responsive neurons in the ventral medial nucleus of the hypothalamus were significantly reduced after the hippocampal CA1 region of rats was electrically damaged, thereby affecting gastric motility (21). However, factors affecting hippocampal function are intricate. Previous studies have found that many hormone receptors are related to feeding and energy regulation in the hippocampus, such as ghrelin, nesfatin-1, and insulin (21, 23). The hypothalamic–pituitary–adrenal (HPA) axis and its neuroendocrine hormones can mediate stressful effects in the hippocampus (24). In addition, various neurovascular markers can influence hippocampal function (25). Therefore, we hypothesized that modulation of hippocampal function can improve the energy homeostasis function of the hypothalamus by improving the hippocampal–hypothalamic neural circuit, thus suppressing obesity.
An increase in dietary fiber intake is associated with a reduced risk of obesity, and dietary fiber also plays a beneficial role in obesity-related metabolic diseases (26, 27). High-fiber and low-glycaemic-index diets with conventional T2DM treatment can improve the disorder of glucolipid metabolism and have certain hypoglycaemic effects in elderly patients with T2DM (28, 29). Consumption of whole grains may prevent the development of T2DM (30, 31). Consumption of almonds increases dietary fiber intake, which is beneficial for obesity, glycaemic control and lipid profile, probably owing to the presence of fiber, which promotes an antidiabetic microbiome by increasing the amount of short-chain fatty acids (32–34). Moreover, high-fiber diet is essentially a low-calorie diet and consuming foods rich in fiber increases satiety and hence reduces caloric intake (35). In addition, a high fiber intake is associated with a reduced risk of Alzheimer's disease (AD) (36). Metabolites associated with high-fiber diet are blood markers that target key genes and suppress obesity. Inulin, a type of soluble dietary fiber, promotes the production of glucagon-like peptide-1 (GLP-1) in enteroendocrine cells and suppresses postprandial blood glucose elevation and appetite through short-chain fatty acids (SCFAs) produced by the intestinal microbiota (37, 38). Kimura et al. reported that SCFA exerts an inhibitory effect on fat accumulation via GPR43 (39). Therefore, high-fiber diet improves metabolic status and prevents obesity. However, its effects on the hippocampal–hypothalamic functional axis remain unknown. Previous studies have reported that dietary fiber plays a role in improving insulin resistance (40). Adherence to high-fiber diet can decrease the plasma levels of ghrelin and GLP-1 (41). Many hormone receptors related to feeding and energy regulation are present in the hippocampus, such as ghrelin, nesfatin-1 and insulin (21, 23). Therefore, we speculate that metabolites from high-fiber diet might act on the hippocampus. In order to identify new treatment targets for obesity, it is important to investigate how high-fiber diet work in obesity and the corresponding complications.
This study examined high-fiber diet' ability to delay the progression of obesity complicated by diabetes type 2 and neurodegenerative symptoms using integrated scRNA transcriptomic and metabolomic analyses, providing new insights into obesity management.
2. Materials and methods
2.1. Methylation genes in the peripheral blood of patients with T2DM–AD
Gene methylation signature matrix data associated with pre-dementia in elderly T2DM patients were downloaded from the GEO database. The following search strategy was used: keywords, “Type 2 diabetes” and “Alzheimer's disease;” study subjects, “Homo sapiens;” study type, “Blood methylomic signatures.” Datasets were obtained using whole-genome RNA-expression microarrays, and human-derived whole blood was used for experiments. After fine data screening, the microarray dataset GSE62003 was eventually selected (Illumina HumanMethylation 450 BeadChip; HumanMethylation 450_15017482) (42). The platform used for testing samples was GPL13534, and the dataset contained the expression data of methylation-related genes from 58 patients with T2DM. Firstly, samples with >10% missing methylation sites were excluded. Then, the R package “ChAMP” was used to perform a series of processes: the missing values were filled in using the ChAMP (43, 44). Data were extracted and screened for DEGs using the R package. The probe IDs were converted to standard gene symbols. Genes with P < 0.05 and |log2FC| > 0.1 were selected as methylation genes in peripheral blood of T2DM–AD patients.
2.2. Acquisition of metabolomics data for high-fiber diets
Metabolomic data of the high-fiber diet were obtained using the GEO database and a literature search, and metabolite expression matrices were created to screen and identify potential metabolic markers of serum endogenous origin based on differential expression multiplicity (|log2FC| > 1.00) and t-test (P < 0.05) results. The MetaboAnalyst 5.0 (http://www.metaboanalyst.ca/) database was further used to perform metabolic pathway analysis of the potential metabolic markers that were significantly back-regulated after the high-fiber diet intervention and to obtain metabolism related differentially expressed genes (DEGs) (45).
2.3. Downloading single-cell RNA sequencing data of hippocampal tissue from the AD patients
The high-throughput scRNA-seq data of the hippocampal samples associated with AD were downloaded from the GEO database with the following screening criteria: (i) Alzheimer's disease; (ii) human; (iii) hippocampus; and (iv) single cell RNA-seq/scRNA-seq. The single-cell sequencing data of hippocampal samples from patients with AD were extracted from the GEO database using “Alzheimer's disease” as the search term, and the scRNA-seq dataset (GSE163577) was selected for further analysis (46). The single-cell sequencing data of nine patients with AD (AD group) and eight healthy individuals (control group) in the dataset were selected, and cells with gene counts of 200–10,000 and mitochondrial gene proportion of < 5% were screened using the Seurat package as previous researches (47–52). Subsequently, the data were normalized using the “Normalizedata” function of the Seurat package and the global scaling normalization method “LogNormalize.” To remove the batch effects of cells include in the analysis and maximize the preservation of the gene expression data of these cells, the “ScaleData” function of the Seurat package was used to regress the variances of “nCount/nFeature_RNA” and “percent. Mt” (Supplementary Figure 2C). Subsequently, the “RunPCA” function of the Seurat package was used for dimensionality reduction and t-SNE clustering. The identified cells were subjected to top-down clustering analysis and annotated according to the known human gastric tissue cell marker genes.
2.4. Single cell sequencing quality control and data removal
For quality assessment, quality control processing of sequencing raw expression data, Limma, Seurat, Dplyr, and Magrittr packages were used. Seurat's R package is used to generate objects, remove poor quality data, and calculate the percentages of gene counts, cell counts, and mitochondrial sequencing counts from the matrix data. For quality control, set Seurat's screening criteria as follows: cells with < 3 genes expressed and < 50 genes were rejected. It was necessary to remove cells with more than 5% mitochondrial genes.
2.5. Cell annotation and screening of marker genes
In order to obtain the highest principal component in the cell population, further principal component analysis (PCA) was conducted after quality control of the sequencing data. The principal components were determined by P < 0.05 screening and the t-SNE clustering algorithm was used to select the significant components. We used the Seurat package for the t-SNE analysis, and all the removed data was classified by setting the clustering parameter of the FindClusters function in Seurat to 0.5. The R package by limma was used to adjust P < 0.05, and the expression change was greater than or equal to twice the (|log2FC| ≥ 1.00) as the criteria to filter the marker genes. In addition, candidate marker genes were found in different clusters of cells using the ggplot2 package.
2.6. GO/KEGG enrichment analysis of marker genes
The Gene Ontology (GO) and Kyoto Encyclopedia of Genes and Genomes (KEGG) signaling pathway analysis of the marker genes obtained in the previous step was performed in the R language to further explore the potential mechanisms of marker genes in specific cell clusters in Alzheimer's disease (53). Potential marker genes are categorized by Cellular Components (CC), Molecular Functions (MF), and Biological Processes (BP). Pathview is also used to map the corresponding signaling pathways. GO enrichment and KEGG pathway analyses were performed using the DAVID (http://david.ncifcrf.gov) and Metascape databases, and the results were visualized using the R software (54–58). The DAVID online database was conducted on methylation genes associated with high-fiber diet, T2DM, and AD for GO and KEGG enrichment analysis. Based on the P-value of each item p < 0.05, the best biological process and enrichment pathway were selected.
2.7. Network involving high-fiber diet, T2DM, and AD in single cells
To illustrate the relevant target sets of the T2DM-AD-monocyte marker gene methylation network, the Venn R package was used to map hippocampus-associated marker genes in AD to DEGs in high-fiber diets and differentially methylated genes in T2DM patients, respectively. In order to map intersecting protein interaction networks and output protein-interaction relationship data, the STRING database (https://string-db.org/) was applied (59–63). By analyzing the topological structure of the protein-protein interaction network model with Cytohubba plugin of Cytoscape 3.7.2, the top-ranked core targets were selected, and their degree, closeness, and betweenness values were visualized (64, 65).
2.8. Molecular docking
The study used AutoDock 4 for semi-flexible molecular docking of ligands and receptors to investigate the interaction of differentially metabolized compounds of a high fiber diet with the T2DM-AD-monocyte marker methylation gene (66, 67). Small molecule ligands are flexible and changeable in semi-flexible docking, while receptors are robust and difficult to change. By downloading the 3D SDF file from PubChem, modifying the structure with Chem Bio3D Ultra 14.0, and saving it as mol2 format, the active ingredient was first processed. Our next step was to download the 3D protein model of the core target from the PDB database, dehydrate, hydrogenate, extract the ligand, and save it as a PDB file using PyMOL. The files were then converted to pdbqt files using Auto Dock Tools-1.5.6. The docking results were visualized in PyMOL to map the “protein-molecule” docking interaction patterns. In addition, run Discovery Studio 2019 to find the docking site and calculate the LibDockScore. Analyze the chemical bonds formed between the docking model and the 2-dimensional image.
3. Results
3.1. Differential expression analysis of metabolites associated with high-fiber diet
Potential serum endogenous metabolic markers were identified via differential expression analysis (|log2FC| > 1) and a t-test (P < 0.05) using data from the GEO database and previous studies (68, 69). A total of nine upregulated and seven downregulated metabolites were identified. According to the MetaboAnalyst 5.0 database, the three most relevant pathways (P < 0.05) were related to the citrate cycle (TCA cycle); beta-alanine metabolism and the biosynthesis of neomycin, kanamycin, and gentamicin (Figure 1A). In addition, the enrichment analysis of potential metabolic markers revealed that their functions were mainly related to the Warburg effect, glycolysis, and beta-alanine metabolism (Figure 1B). Furthermore, the combined multifunctional analysis of high-fiber-diet-related metabolic DEGs and differential metabolites revealed that these metabolites were mainly involved in the citrate cycle (TCA cycle), beta-alanine metabolism and the biosynthesis of neomycin, kanamycin, and gentamicin, which is consistent with the results of the previous pathway enrichment analysis (Figure 1C). As a result of the above analysis, we identified differential metabolites associated with high fiber diets.
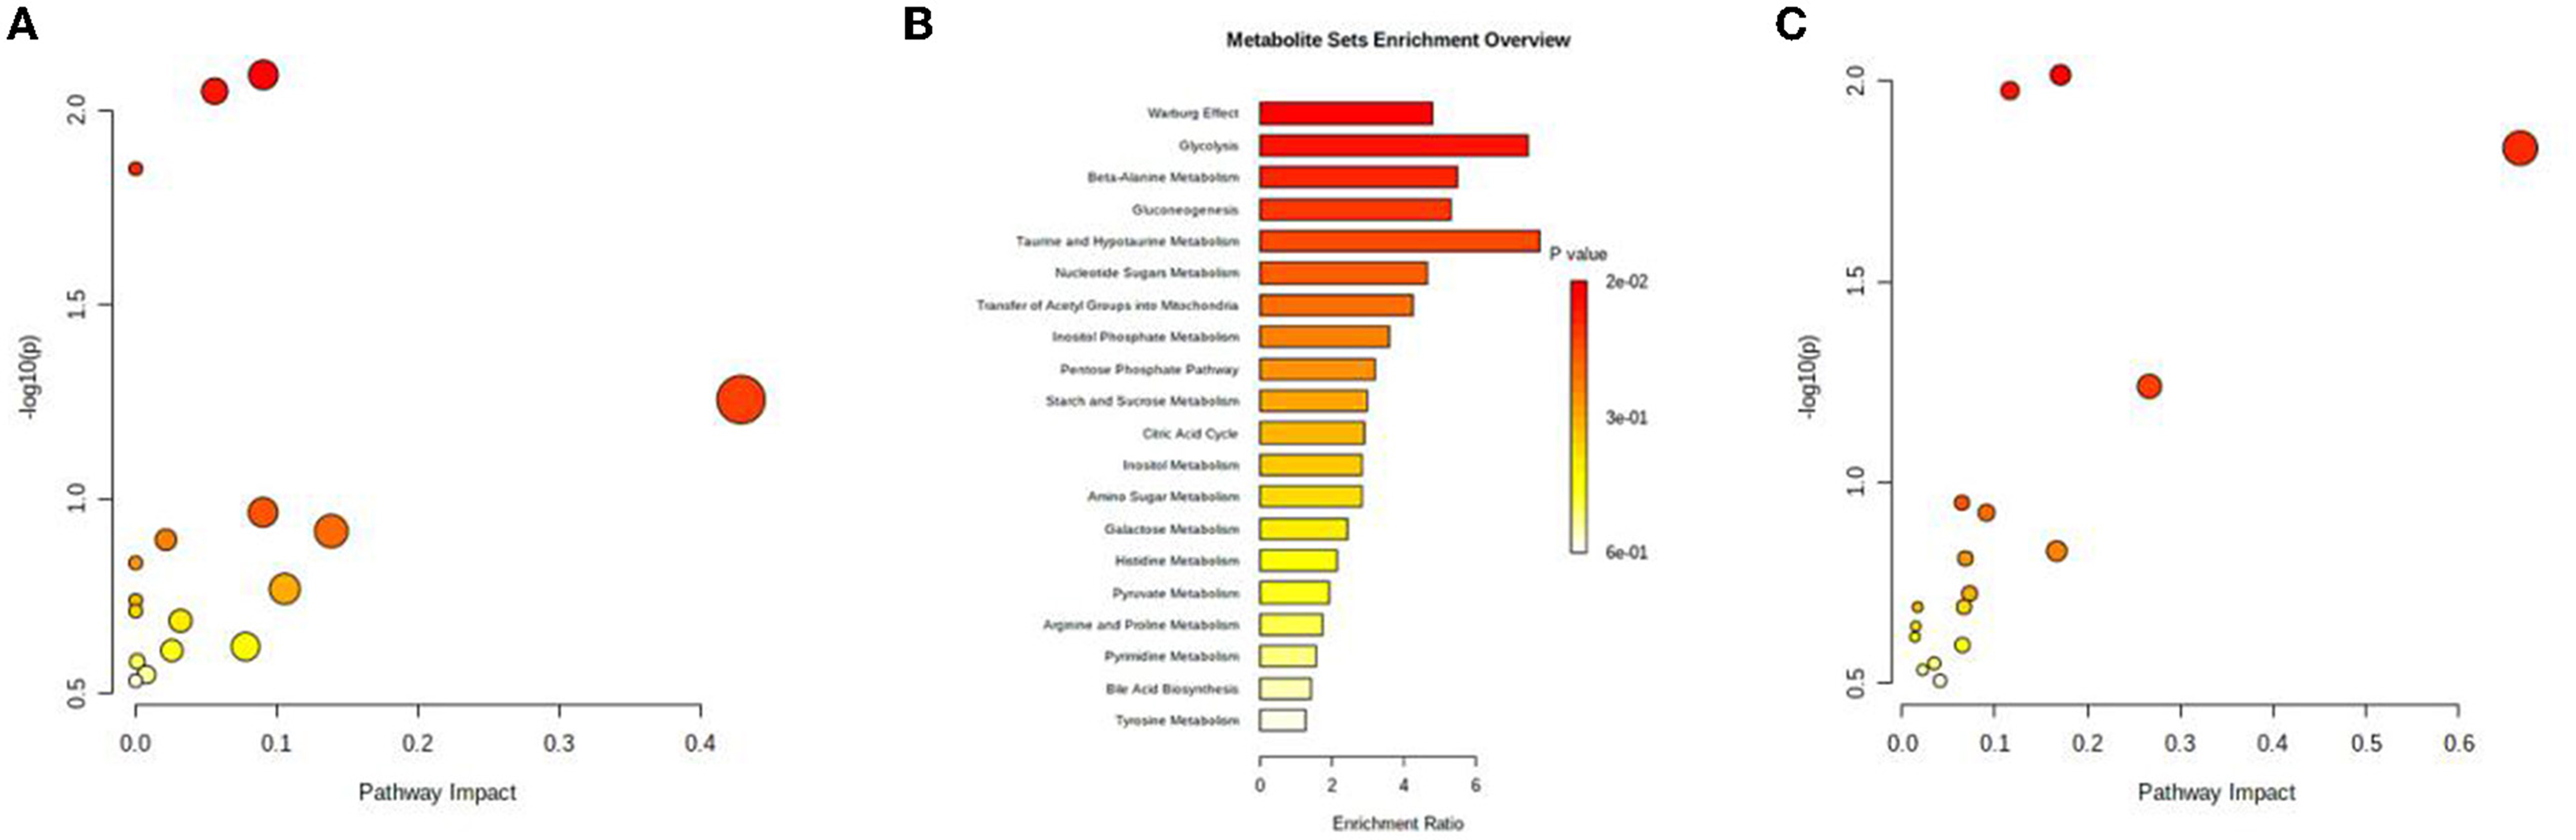
Figure 1. Metabolomic analysis. (A) Signaling pathways associated with differentially expressed metabolites associated with high-fiber diet. (B) Bubble map of differentially expressed metabolites associated with high-fiber diet. (C) Bubble map of the interaction between differentially expressed metabolites associated with high-fiber diet and DEGs.
3.2. Methylation genes in the peripheral blood of patients with T2DM–AD
The expression profiles of methylation-related genes in the peripheral blood of patients with T2DM–AD were obtained. And a total of 11 upregulated and 10 downregulated methylation-related genes were identified and visualized on a heat map (Supplementary Figure 1A). The transcriptomic data of these DEGs were imported into the R software to construct a volcano plot (Supplementary Figure 1B). The peripheral blood of T2DM-AD patients was analyzed for methylation-related genes.
3.3. Cellular distribution and characteristics in the hippocampal tissue of patients with AD
Hippocampal samples from patients with AD were extracted from the GEO database using “Alzheimer's disease” as the search term, and the scRNA-seq dataset (GSE163577) was selected for further analysis. The single-cell sequencing data of nine patients with AD and eight healthy individuals in the dataset were selected, and cells with gene counts of 200–10,000 and mitochondrial gene proportion of < 5% were screened using the Seurat package in R (Supplementary Figures 2A, B). To remove the batch effects of cells include in the analysis and maximize the preservation of the gene expression data of these cells, the “ScaleData” function of the Seurat package was used to regress the variances of “nCount/nFeature_RNA” and “percent. Mt” (Supplementary Figure 2C). Subsequently, the “RunPCA” function of the Seurat package was used for dimensionality reduction and t-SNE clustering (Supplementary Figures 3A, B). A total of 182,056 cells and 27,005 associated genes were identified after quality control, integration and normalization of data and removal of batch effects from the single-cell sequencing data of patients with AD and healthy individuals. The identified cells were subjected to top-down clustering analysis and annotated according to the known human gastric tissue cell marker genes. A total of 27 cell types were identified (Supplementary Figure 3B), with uniform scattered distribution and good integration of batch effects. The expression of marker genes in each cell type was specific, indicating that the cell annotation results were accurate (Figure 2). Thus, hippocampal tissue of AD patients was examined with respect to its distribution and characteristics.
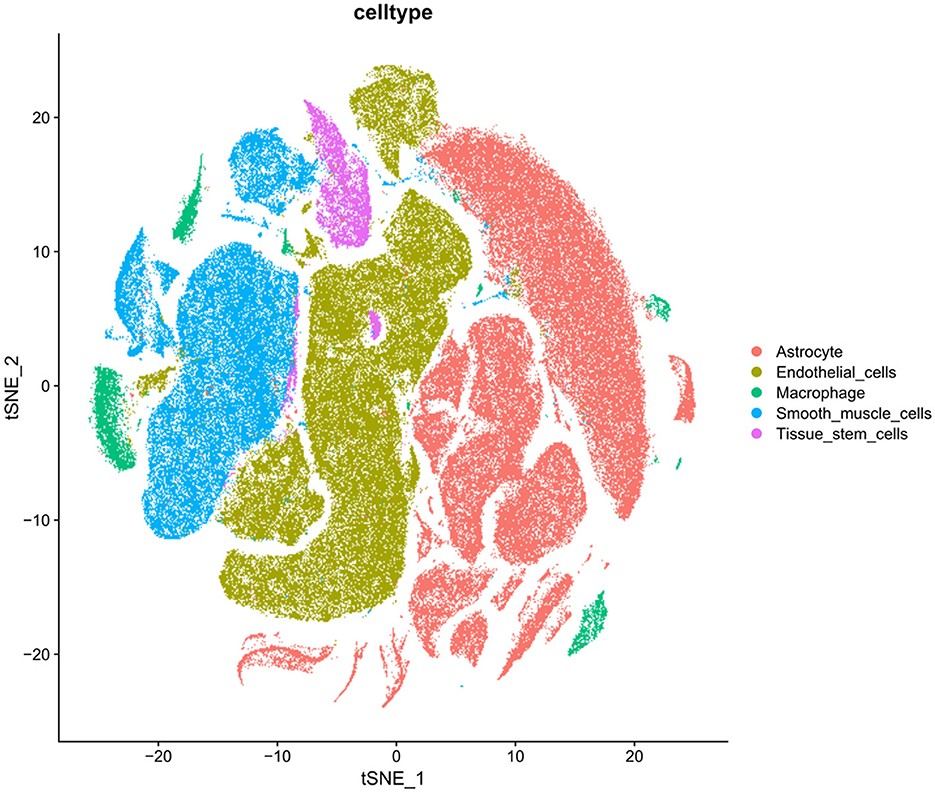
Figure 2. Annotated distribution maps of cells in tSNE map.
3.4. Screening and enrichment analysis of marker genes
Based on the results of cell annotation, different types of cell subpopulations were identified using the Seurat package, and DEGs in different cell subpopulations in the hippocampal tissue of patients with AD and healthy individuals were screened using the FindMarkers function. A total of 12,610 DEGs were identified and visualized on a heat map (Figure 3A). GO analysis revealed that the identified DEGs were mainly enriched in cellular responses to nitric oxide, muscle cell differentiation, and RNA polymerase II transcriptional regulation complex (Figure 3B). KEGG analysis revealed that the genes were mainly enriched in pathways associated with autophagy, cellular senescence, AGE–RAGE signaling in diabetic complications and NF–kappa B signaling (Figure 3C).
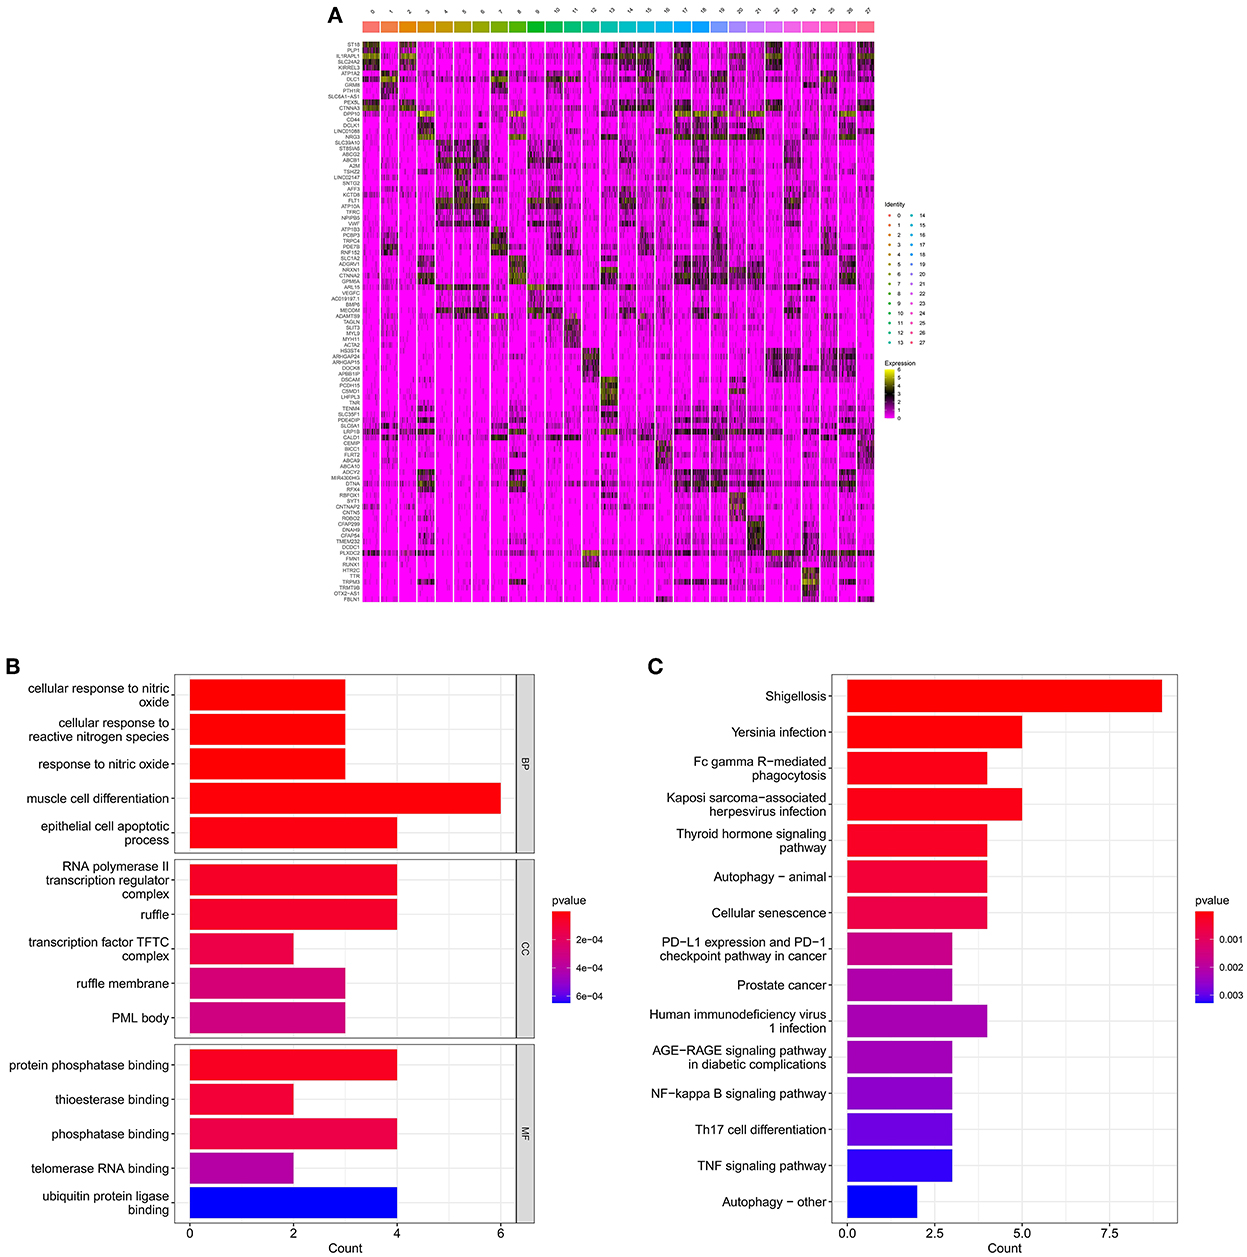
Figure 3. Enrichment analysis for the identification of markers genes. (A) Heat map demonstrating the distribution of marker genes. (B) Histogram of GO enrichment analysis of marker genes. (C) Histogram of KEGG functional analysis of marker genes.
3.5. Interaction network of high-fiber-diet-related metabolites, methylation-related DEGs associated with T2DM–AD, and single-cell marker genes associated with AD
There were 24 high-fiber-diet–T2DM–AD marker genes identified by intersecting high-fiber-diet-related metabolites with methylation-related DEGs associated with T2DM (Figure 4A). The STRING (version 11.0) database was used to construct a gene interaction network for these marker genes. The species selected was “Homo sapiens.” To identify hub genes (Figures 4B–D), the cytoHubba plug-in in Cytoscape 3.7.2 software was used to construct a protein–protein interaction network based on network topology, calculate degree, closeness, and betweenness values, and select the size of the values for ranking. Top hub genes included SYNE1, ANK2, SPEG, PDZD2, KALRN, PTPRM, PTPRK, BIN1, DOCK9, and NPNT. As a result, we constructed a network of interactions between high-fiber diet-associated metabolites, methylation-associated DEGs associated with T2DM-AD, and single-cell marker genes related to AD. Functional and pathway enrichment analyses of the 24 high-fiber-diet–T2DM–AD-related marker genes were performed using Metascape. GO enrichment analysis revealed a total of 245 biological processes (BPs), 33 cellular components (CCs), and 26 molecular functions (MFs). BPs included muscle cell differentiation, muscle cell development, cell–cell adhesion mediated by integrin, CC assembly involved in morphogenesis, and nephron development. MFs included transmembrane receptor protein tyrosine phosphatase activity, transmembrane receptor protein phosphatase activity, protein serine/threonine kinase activity, protein tyrosine phosphatase activity, and cysteine-type endopeptidase activity. CCs included contractile fibers, cell–cell junction, sarcomere, T-tubules, and myofibrils (Figures 5A–D). According to KEGG pathway enrichment analysis, the marker genes were enriched in two pathways (Figures 5E, F), of which autophagy was the pathway of interest in this study.
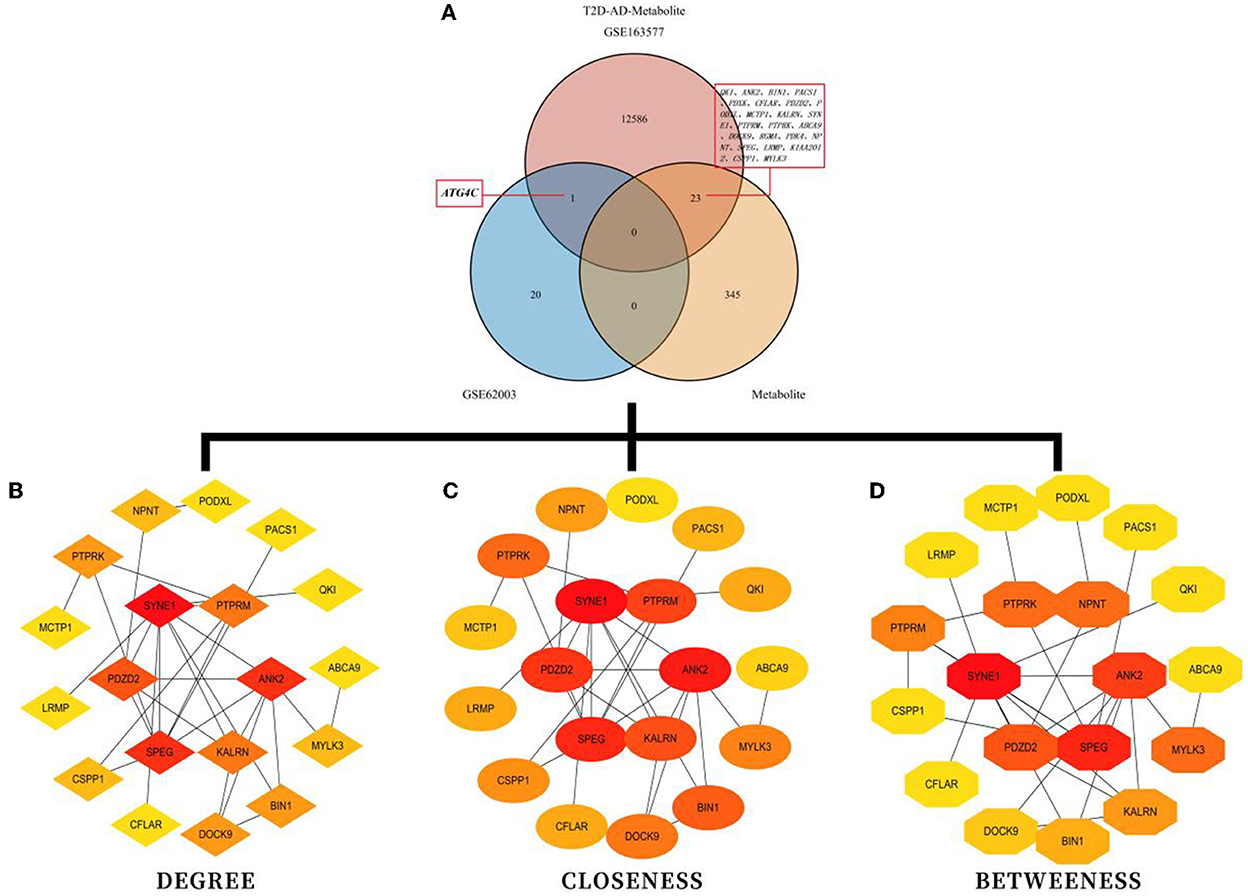
Figure 4. Enrichment analysis for the identification of markers genes. (A) Venn diagram demonstrating high-fiber-diet–T2DM–AD-related marker genes. (B) Potential core target genes identified based on degree values. (C) Potential core target genes identified based on closeness values. (D) Potential core target genes identified based on between-ness values.
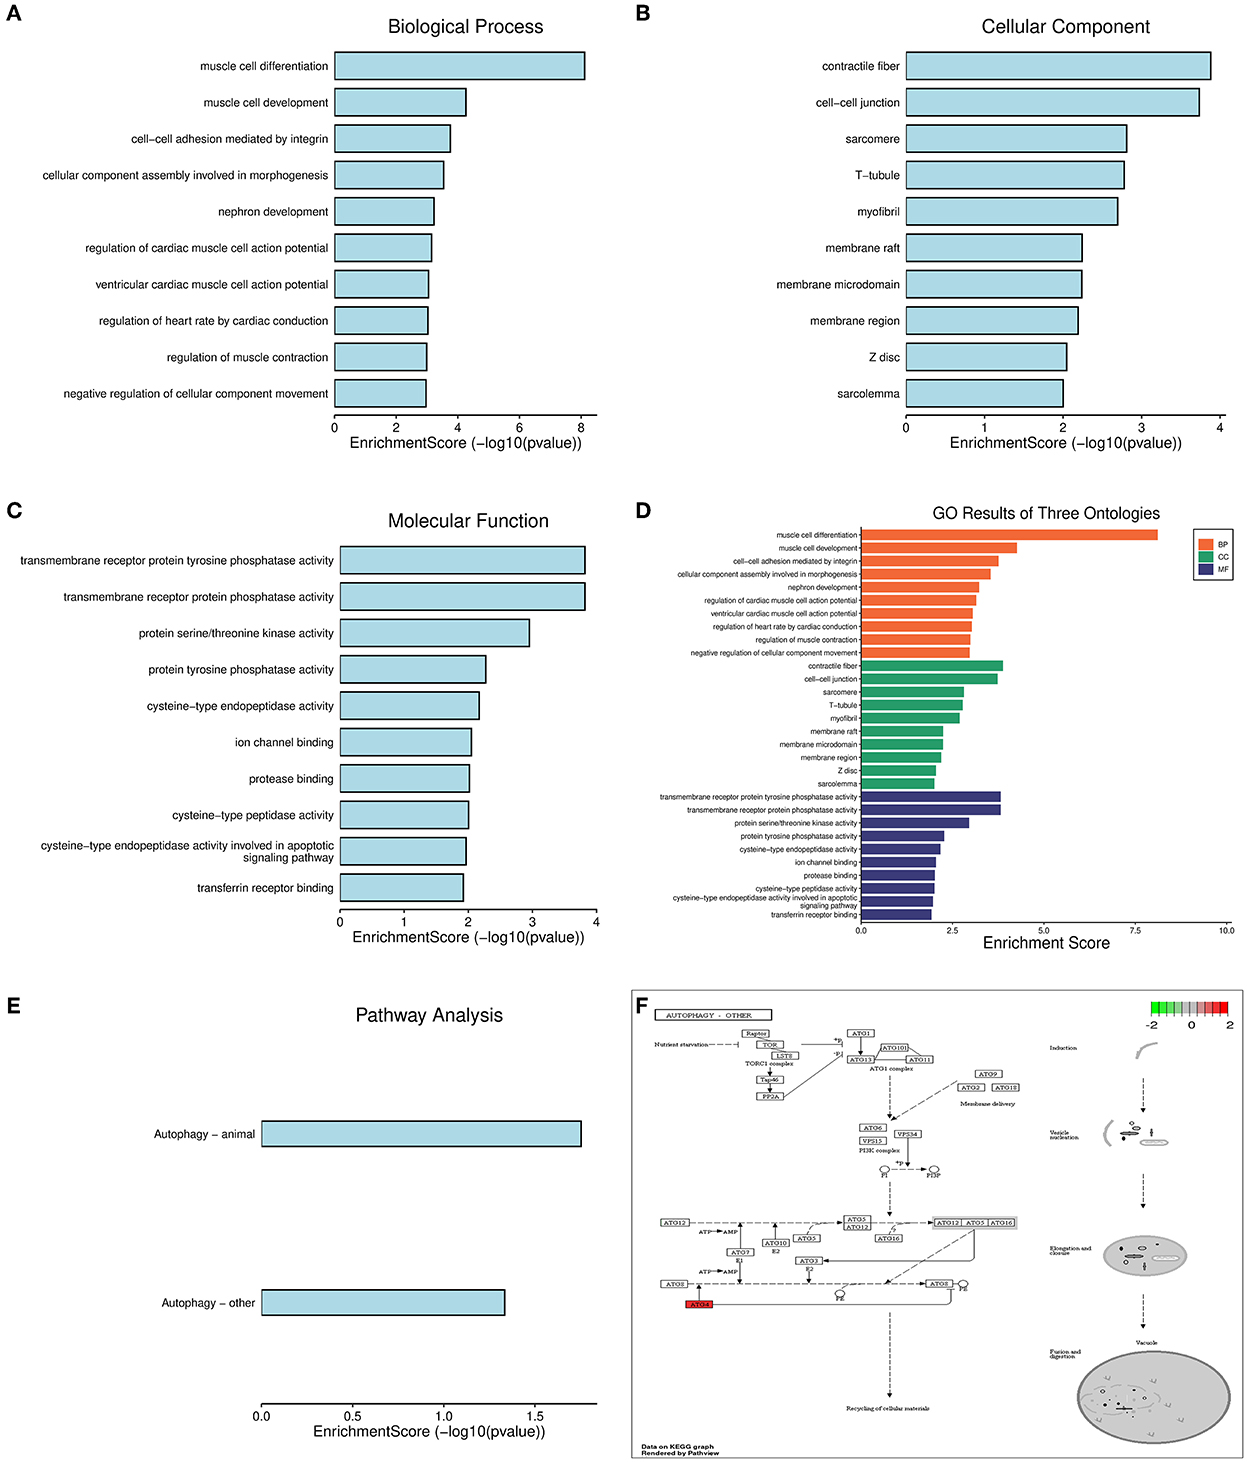
Figure 5. GO and KEGG enrichment analysis. (A) Histogram of BP functional analysis. (B) Histogram of CC functional analysis. (C) Histogram of MF functional analysis. (D) Histogram of GO enrichment analysis. (E) Histogram of KEGG enrichment analysis. (F) Autophagy signaling pathway.
3.6. Molecular docking validation
The most significantly altered metabolic markers, including phosphoenolpyruvate and acetamidobenzoic acid, as well as the top three core proteins, SYNE1 (4DXR), ANK2 (5Y4E), and SPEG (6CY6) (the corresponding structural domains of the proteins are mentioned in parentheses) were analyzed with the AutoDock Tools (version 1.5.6) software. Smaller the binding energy, the stronger the binding capacity. Table 1 shows that phosphoenolpyruvate and acetamidobenzoic acid had adequate binding affinities for the core proteins SYNE1 (4DXR), ANK2 (5Y4E), and SPEG (6CY6). Acetamidobenzoic acid had the strongest binding affinity for the core protein SPEG (6CY6), with an RMSD value of < 2.00 (Figure 6). Docking the active molecule with the corresponding target protein in Discovery Studio 2019 revealed that acetamidobenzoic acid binds via hydrogen and hydrophobic bonds to SPEG (6CY6). Acetamidobenzoic acid forms hydrogen bonds with amino acid residues at position 31 (ARG) and 123 (ILE) and hydrophobic bonds with amino acid residues at position 159 (ALA) and 150 (PHE) of the structural domain of SPEG (6CY6) (Figure 6). Acetamidobenzoic acid, a metabolite associated with high-fiber diet, may target SPEG in the hippocampus and affect autophagy related pathway.
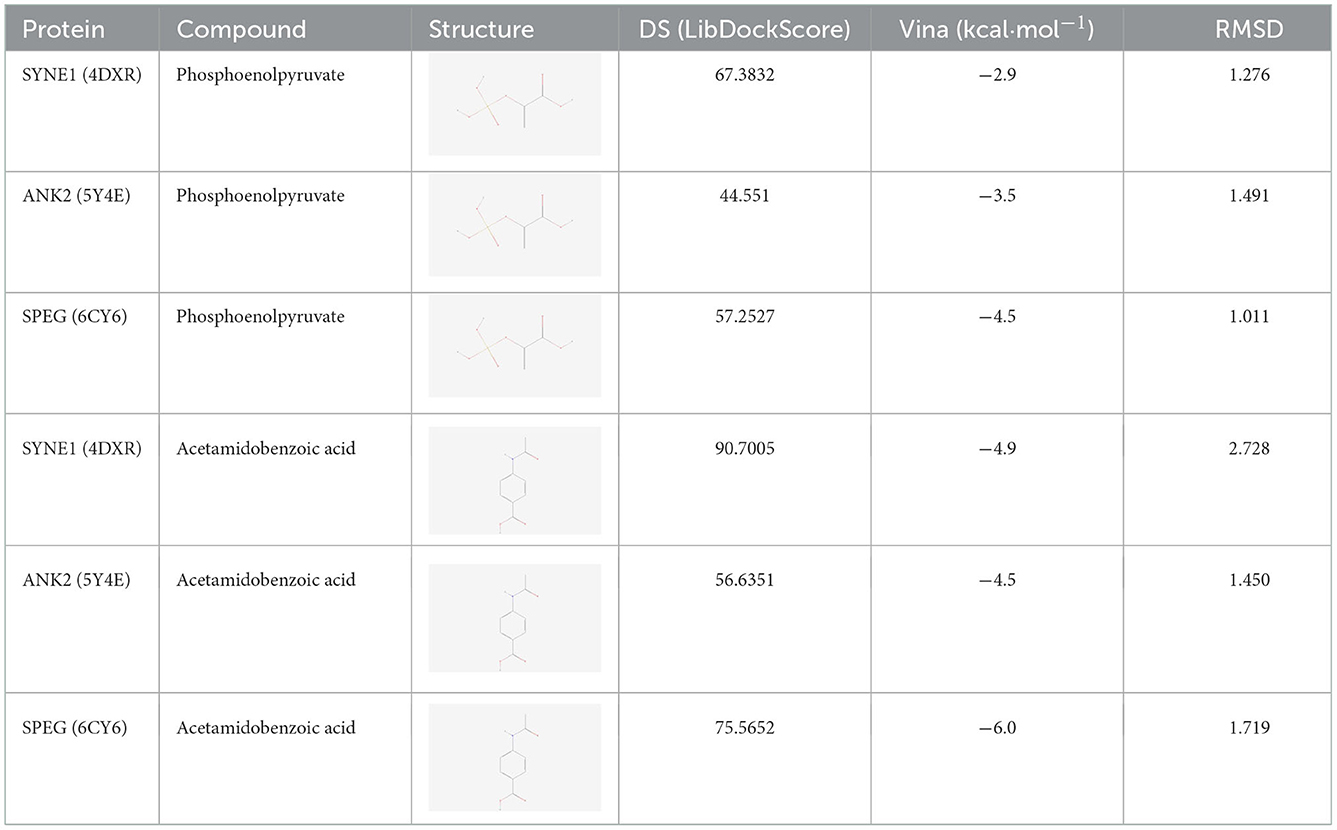
Table 1. Molecular docking and binding energy.
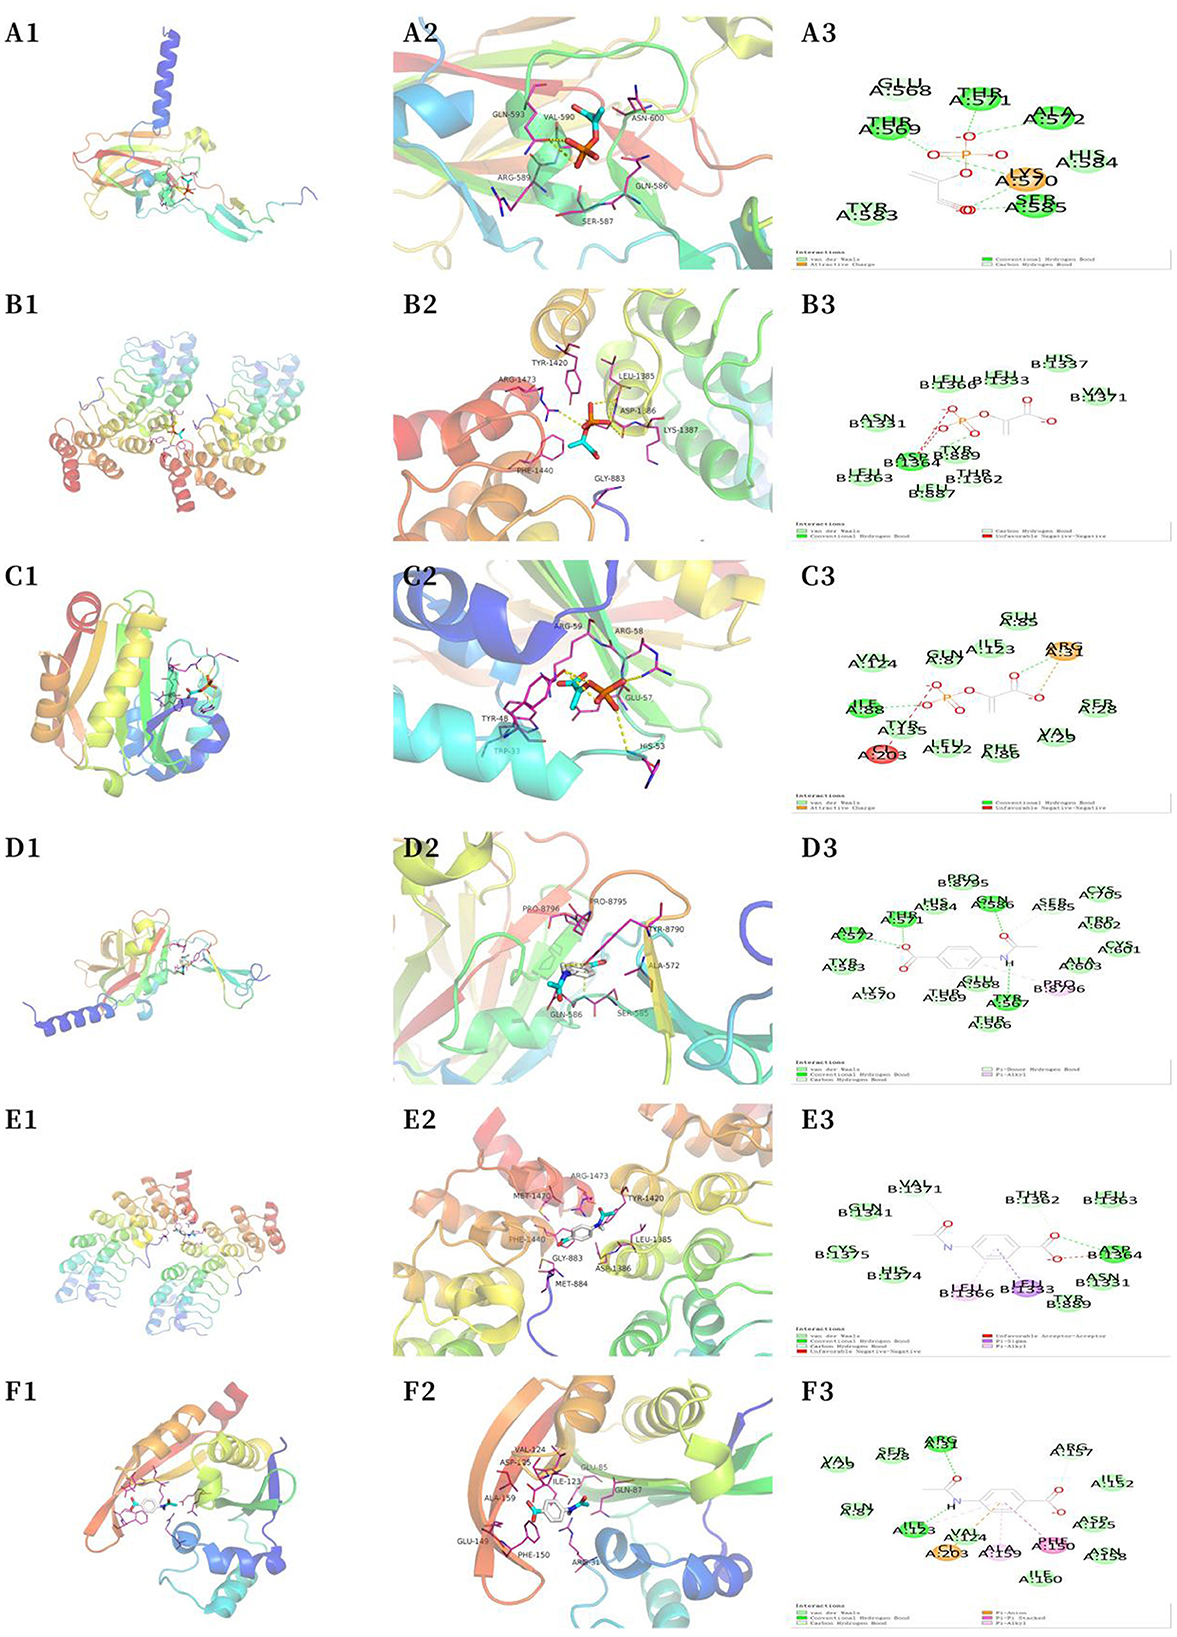
Figure 6. Molecular docking analysis. (A) SYNE1 phosphoenolpyruvate (macroscopic) (A1); SYNE1 phosphoenolpyruvate (microscopic) (A2); SYNE1 phosphoenolpyruvate (A3). (B) ANK2 phosphoenolpyruvate (macroscopic) (B1); ANK2 phosphoenolpyruvate (microscopic) (B2); ANK2 phosphoenolpyruvate (B3). (C) SPEG phosphoenolpyruvate (macroscopic) (C1); SPEG phosphoenolpyruvate (microscopic) (C2); SPEG phosphoenolpyruvate (C3). (D) SYNE1 acetamidobenzoic acid (macroscopic) (D1); SYNE1 acetamidobenzoic acid (microscopic) (D2); SYNE1–acetamidobenzoic acid (D3). (E) ANK2–acetamidobenzoic acid (macroscopic) (E1); ANK2–acetamidobenzoic acid (microscopic) (E2); ANK2–acetamidobenzoic acid (E3). (F) SPEG–acetamidobenzoic acid (macroscopic) (F1); SPEG–acetamidobenzoic acid (microscopic) (F2); SPEG–acetamidobenzoic acid (F3).
Discussion
In this study, metabolites and signaling pathways associated with high-fiber diet were identified based on databases. The GEO database was used to identify 10 core high-fiber-diet–T2DM–AD-related marker genes, whose functions are mainly related to autophagy. The results of molecular docking suggested that high-fiber-diet-associated metabolites can stably bind to the core high-fiber diet–T2DM–AD-associated proteins, with the most stable binding observed between SPEG (6CY6) and acetamidobenzoic acid. These results suggest that high-fiber diet influences autophagic homeostasis in the hippocampus through binding of the metabolite acetamidobenzoic acid to the SPEG (6CY6) protein and regulation of the hippocampal–hypothalamic endocrine axis, eventually improving the diabetic and neurodegenerative disease states of patients with obesity.
Autophagy is involved in the regulation of lipid metabolism, and its dysregulation in adipose tissue is associated with the development of metabolic diseases (70, 71). Dysregulation of autophagy alters energy metabolism in hypothalamic neurons and white adipose tissue (WAT). Imbalance of autophagy in hypothalamic neurons can lead to increased caloric intake and weight gain, resulting in obesity and metabolic disorders (72). Mitochondrial autophagy is critical for protecting neurons in the hippocampal CA1 region from ischaemic stress injury (73). In addition to hippocampal CA1 neuronal deletion leading to cognitive impairment, direct neural projections from the ventral pole of hippocampal CA1 to hypothalamic loci are involved in the control of food intake (22, 74). Furthermore, the autophagic pathway is closely related to the pathogenic mechanism underlying the impairment of intestinal mucosal barrier function (75). Impairment of intestinal barrier structure and function is an important pathogenic process in T2DM (76). Autophagy is also involved in the pathological process of AD through several mechanisms, such as the removal of misfolded proteins, and is a novel therapeutic target for AD (77, 78). Therefore, autophagy is closely related to the pathogenesis of obesity and the associated metabolic diseases T2DM and neurodegenerative diseases and regulates the hippocampal–hypothalamic neuroendocrine axis. In the present study, KEGG pathway enrichment analysis strongly suggested that the function of high-fiber-diet–T2DM–AD-related DEGs was mainly related to autophagy, which is consistent with the results of previous similar studies (79–82). Therefore, metabolites associated with high-fiber diet may play a role in the pathological process of T2DM and AD among patients with obesity by affecting autophagy in the hippocampus and hypothalamus.
Furthermore, this study demonstrated that the high-fiber-diet-associated metabolite acetamidobenzoic acid can bind to the SPEG (6CY6) protein in the hippocampus and affect autophagic homeostasis in the hippocampus, thus improving the diabetic and neurodegenerative disease states of individuals with obesity. Acetamidobenzoic acid is a derivative of benzoic acid. Benzoic acid derivatives are involved in promoting the activity of the autophagy–lysosome pathway (83). Benzoic acid is involved in the composition of the compound Mn (III) tetrakis (4-benzoic acid) porphyrin chloride (MnTBAP), which reduces obesity by reducing adipocyte hypertrophy and adipogenesis and regulating energy balance and improves insulin function (84, 85). Benzoic acid derivatives present in garlic shells can be combined with other compounds to synergistically activate the PPAR signaling pathway or inactivate the phospholipase D signaling pathway to exert an anti-T2DM effect (86). In addition, the bifunctional molecule BPBA synthesized using benzoic acid can target Aβ and inhibit neuroinflammation, which plays a role in AD (87). To the best of our knowledge, this study is the first to identify the potential role of acetamidobenzoic acid in the pathogenesis of obesity–T2DM–AD, thus laying a foundation for the subsequent development of new drugs.
Striated muscle preferentially expressed protein kinase (SPEG) is a myosin light-chain kinase containing a double serine/threonine kinase domain and multiple immunoglobulin (Ig)-like and proline-rich regions involved in protein–protein interactions (88). SPEG as a single gene can be alternatively spliced into several tissue-specific isoforms, including BPEG (the brain) and SPEGα (skeletal muscle) and SPEGβ (cardiac muscle) (89–91). Patients with neurodegenerative diseases had significantly lower levels of SPEG methylation, which is strongly associated with obesity. The m6A demethylase FTO may regulate adipocyte differentiation and adipogenesis by regulating the expression of proteins such as gastric starvation hormone, pro-adipogenic factors and peroxisome proliferator-activated receptor, thereby affecting the development of obesity (92). Furthermore, FTO plays a major role in the development of T2DM, as m6A methyltransferases can inhibit adipogenesis, delay the onset and progression of obesity by inhibiting autophagosome formation, blocking mitotic clone expansion, and controlling adipogenic differentiation in mesenchymal stem cells (93). And missense mutations in SPEG are also closely associated with the development of T2DM in GK rats (94). Therefore, acetaminobenzoic acid may target SPEG in the hippocampus, thereby affecting the autophagic balance of the hippocampus and regulating the hippocampal-hypothalamic endocrine axis, improving diabetic and neurodegenerative disease states.
To the best of our knowledge, this study is the first to report that the SPEG protein in the hippocampus, a peripheral blood biomarker in patients with obesity with concomitant T2DM and neurodegenerative diseases, can bind to acetamidobenzoic acid, a high-fiber-diet-related metabolite, and plays an important role in the development of T2DM and neurodegenerative diseases in patients with obesity. In addition to acetamidobenzoic acid and SPEG, the metabolite phosphoenolpyruvate, which is significantly altered by high-fiber diet, was found to have a strong binding affinity for the core proteins SYNE1 and ANK2, suggesting that high-fiber diet can benefit individuals with obesity through multiple targets and pathways.
However, this study has some limitations. This study was mainly based on bioinformatic analysis of data extracted from databases and lacks relevant experimental validation. Further research is needed to determine exactly how acetamidobenzoic acid binds to hippocampal SPEG proteins.
5. Conclusion
Acetamidobenzoic acid, a metabolite associated with high-fiber diet, can target SPEG (6CY6) protein in the hippocampus, thereby affecting autophagic homeostasis in the hippocampus, regulating the hippocampal–hypothalamic endocrine axis and eventually improving the diabetic and neurodegenerative disease states of patients with obesity.
Data availability statement
The original contributions presented in the study are included in the article/Supplementary material, further inquiries can be directed to the corresponding author.
Ethics statement
Ethical review and approval was not required for the study on human participants in accordance with the local legislation and institutional requirements. Written informed consent from the patients/participants or patients/participants' legal guardian/next of kin was not required to participate in this study in accordance with the national legislation and the institutional requirements.
Author contributions
LP: conceptualization, methodology, software, investigation, formal analysis, and writing—original draft. YG: data curation, writing—original draft, methodology, software, investigation, and formal analysis. FD: visualization and investigation. NL: conceptualization, funding acquisition, resources, supervision, and writing—review and editing. All authors contributed to the article and approved the submitted version.
Funding
This study was supported by the Chenzhou Science and Technology Project (lcy12021035): Clinical characteristics of early-onset type 2 diabetes mellitus and analysis of related risk factors.
Acknowledgments
We would like to thank Shanghai Qiaoyidao Biotechnology Co Ltd and Hainan Superparameter Technology Co Ltd. for providing bioinformatics analysis services. We also thank Bullet Edits Limited for the linguistic editing and proofreading of the manuscript.
Conflict of interest
The authors declare that the research was conducted in the absence of any commercial or financial relationships that could be construed as a potential conflict of interest.
Publisher's note
All claims expressed in this article are solely those of the authors and do not necessarily represent those of their affiliated organizations, or those of the publisher, the editors and the reviewers. Any product that may be evaluated in this article, or claim that may be made by its manufacturer, is not guaranteed or endorsed by the publisher.
Supplementary material
The Supplementary Material for this article can be found online at: https://www.frontiersin.org/articles/10.3389/fneur.2022.1026904/full#supplementary-material
Supplementary Figure 1. (A) Heat map of differentially expressed methylation-related genes in the GSE62003 dataset. (B) Heat map of differentially expressed methylation-related genes in the GSE62003 dataset (the red color represents upregulated gene expression, and the green color represents downregulated gene expression).
Supplementary Figure 2. (A) Quality control and data removal plots for the GSE163577 dataset. (B) Distribution of the top 10 most significant genes in the GSE163577 dataset. (C) Distribution of genes before and after normalization of data in the GSE163577 dataset.
Supplementary Figure 3. (A) Principal component analysis distribution map. (B) t-SNE principal component distribution map.
Abbreviations
T2DM, Type 2 diabetes mellitus; AD, Alzheimer's disease; SPEG, Striated muscle preferentially expressed protein kinase; GO, Gene ontology; KEGG, Kyoto Encyclopedia of Genes and Genomes.
References
1. Gregg EW, Shaw JE. Global health effects of overweight and obesity. N Engl J Med. (2017) 377:80–1. doi: 10.1056/NEJMe1706095
2. Yang Z-J, Liu J, Ge J-P, Chen L, Zhao Z-G, Yang W-Y, et al. Prevalence of cardiovascular disease risk factor in the Chinese population: the 2007-2008 China national diabetes and metabolic disorders study. Euro Heart J. (2012) 33:213–20. doi: 10.1093/eurheartj/ehr205
3. Medina-Remón A, Kirwan R, Lamuela-Raventós RM, Estruch R. Dietary patterns and the risk of obesity, type 2 diabetes mellitus, cardiovascular diseases, asthma, and neurodegenerative diseases. Crit Rev Food Sci Nutr. (2018) 58:262–96. doi: 10.1080/10408398.2016.1158690
4. Saltiel AR, Olefsky JM. Inflammatory mechanisms linking obesity and metabolic disease. J Clin Invest. (2017) 127:1–4. doi: 10.1172/JCI92035
5. Pugazhenthi S, Qin L, Reddy PH. Common neurodegenerative pathways in obesity, diabetes, and Alzheimer's disease. Biochim Biophys Acta. (2017) 1863:1037–45. doi: 10.1016/j.bbadis.2016.04.017
6. Tang G-Y, Yu P, Zhang C, Deng H-Y, Lu M-X, Le J-H. The neuropeptide-related HERC5/TAC1 interactions may be associated with the dysregulation of lncRNA GAS5 expression in gestational diabetes mellitus exosomes. Dis Mark. (2022) 2022:8075285. doi: 10.1155/2022/8075285
7. Zhou S-P, Fei S-D, Han H-H, Li J-J, Yang S, Zhao C-Y. A prediction model for cognitive impairment risk in colorectal cancer after chemotherapy treatment. BioMed Res Int. (2021) 2021:6666453. doi: 10.1155/2021/6666453
8. Liu Z, Li C. A predictive model for the risk of cognitive impairment in patients with gallstones. BioMed Res Int. (2021) 2021:3792407. doi: 10.1155/2021/3792407
9. Bruce-Keller AJ, Keller JN, Morrison CD. Obesity and vulnerability of the CNS. Biochim Biophys Acta. (2009) 1792:395–400. doi: 10.1016/j.bbadis.2008.10.004
10. Huynh MKQ, Kinyua AW, Yang DJ, Kim KW. Hypothalamic AMPK as a regulator of energy homeostasis. Neural Plasticity. (2016) 2016:2754078. doi: 10.1155/2016/2754078
11. Chen Y, Luo Z, Sun Y, Li F, Han Z, Qi B, et al. Exercise improves choroid plexus epithelial cells metabolism to prevent glial cell-associated neurodegeneration. Front Pharmacol. (2022) 13:1010785. doi: 10.3389/fphar.2022.1010785
12. Kullmann S, Kleinridders A, Small DM, Fritsche A, Häring H-U, Preissl H, et al. Central nervous pathways of insulin action in the control of metabolism and food intake. Lancet Diabetes Endocrinol. (2020) 8:524–34. doi: 10.1016/S2213-8587(20)30113-3
13. Myers MG, Affinati AH, Richardson N, Schwartz MW. Central nervous system regulation of organismal energy and glucose homeostasis. Nat Metab. (2021) 3:737–50. doi: 10.1038/s42255-021-00408-5
14. Bélanger M, Allaman I, Magistretti PJ. Brain energy metabolism: focus on astrocyte-neuron metabolic cooperation. Cell Metab. (2011) 14:724–38. doi: 10.1016/j.cmet.2011.08.016
15. Cavadas C, Aveleira CA, Souza GFP, Velloso LA. The pathophysiology of defective proteostasis in the hypothalamus — from obesity to ageing. Nat Rev Endocrinol. (2016) 12:723–33. doi: 10.1038/nrendo.2016.107
16. Li C, Xu J-J, Hu H-T, Shi C-Y, Yu C-J, Sheng J-Z, et al. Amylin receptor insensitivity impairs hypothalamic POMC neuron differentiation in the male offspring of maternal high-fat diet-fed mice. Mol Metab. (2021) 44:101135. doi: 10.1016/j.molmet.2020.101135
17. Biebermann H, Kühnen P, Kleinau G, Krude H. “The neuroendocrine circuitry controlled by POMC, MSH, and AGRP. In: Joost H-G, editor. Appetite Control. Handbook of Experimental Pharmacology. Berlin: Springer (2012). p. 47–75. doi: 10.1007/978-3-642-24716-3_3
18. Huisman C, Cho H, Brock O, Lim SJ, Youn SM, Park Y, et al. Single cell transcriptome analysis of developing arcuate nucleus neurons uncovers their key developmental regulators. Nat Commun. (2019) 10:3696. doi: 10.1038/s41467-019-11667-y
19. Lizcano F, Arroyave F. Control of adipose cell browning and its therapeutic potential. Metabolites. (2020) 10:471. doi: 10.3390/metabo10110471
20. Xu L, Sun X, Depoortere I, Lu J, Guo F, Peeters TL. Effect of motilin on the discharge of rat hippocampal neurons responding to gastric distension and its potential mechanism. Peptides. (2008) 29:585–92. doi: 10.1016/j.peptides.2007.12.002
21. Feng H, Wang Q, Guo F, Han X, Pang M, Sun X, et al. Nesfatin-1 influences the excitability of gastric distension-responsive neurons in the ventromedial hypothalamic nucleus of rats. Physiol Res. (2017) 66:335–44. doi: 10.33549/physiolres.933347
22. Cenquizca LA, Swanson LW. Analysis of direct hippocampal cortical field CA1 axonal projections to diencephalon in the rat. J Comp Neurol. (2006) 497:101–14. doi: 10.1002/cne.20985
23. Boleti AP, Cardoso PH, Frihling BE, e Silva PS, de Moraes LF, Migliolo L. Adipose tissue, systematic inflammation, and neurodegenerative diseases. Neural Regen Res. (2023) 18:38. doi: 10.4103/1673-5374.343891
24. Kino T. Stress, glucocorticoid hormones, and hippocampal neural progenitor cells: implications to mood disorders. Front Physiol. (2015) 6:230. doi: 10.3389/fphys.2015.00230
25. Shohayeb B, Diab M, Ahmed M, Ng DCH. Factors that influence adult neurogenesis as potential therapy. Transl Neurodegener. (2018) 7:4. doi: 10.1186/s40035-018-0109-9
26. Nguyen TD, Hållenius FF, Lin X, Nyman M, Prykhodko O. Monobutyrin and monovalerin affect brain short-chain fatty acid profiles and tight-junction protein expression in apoe-knockout rats fed high-fat diets. Nutrients. (2020) 12:E1202. doi: 10.3390/nu12041202
27. Weitkunat K, Stuhlmann C, Postel A, Rumberger S, Fankhänel M, Woting A, et al. Short-chain fatty acids and inulin, but not guar gum, prevent diet-induced obesity and insulin resistance through differential mechanisms in mice. Sci Rep. (2017) 7:6109. doi: 10.1038/s41598-017-06447-x
28. Nitta A, Imai S, Kajiayama S, Matsuda M, Miyawaki T, Matsumoto S, et al. Impact of dietitian-led nutrition therapy of food order on 5-year glycemic control in outpatients with type 2 diabetes at primary care clinic: retrospective cohort study. Nutrients. (2022) 14:2865. doi: 10.3390/nu14142865
29. Al-Adwi ME, Al-Haswsa ZM, Alhmmadi KM, Eissa YA, Hamdan A, Bawadi H, et al. Effects of different diets on glycemic control among patients with type 2 diabetes: a literature review. Nutr Health. (2022) 6:26010602211128. doi: 10.1177/02601060221112805
30. Aune D, Norat T, Romundstad P, Vatten LJ. Whole grain and refined grain consumption and the risk of type 2 diabetes: a systematic review and dose–response meta-analysis of cohort studies. Eur J Epidemiol. (2013) 28:845–58. doi: 10.1007/s10654-013-9852-5
31. Fulgoni VL, Brauchla M, Fleige L, Chu Y. Oatmeal-Containing breakfast is associated with better diet quality and higher intake of key food groups and nutrients compared to other breakfasts in children. Nutrients. (2019) 11:964. doi: 10.3390/nu11050964
32. Cockburn DW, Koropatkin NM. Polysaccharide degradation by the intestinal microbiota and its influence on human health and disease. J Mol Biol. (2016) 428:3230–52. doi: 10.1016/j.jmb.2016.06.021
33. Wang Y, LaPointe G. Arabinogalactan utilization by Bifidobacterium longum subsp. longum NCC 2705 and Bacteroides caccae ATCC 43185 in monoculture and coculture. Microorganisms. (2020) 8:1703. doi: 10.3390/microorganisms8111703
34. Li S-C, Liu Y-H, Liu J-F, Chang W-H, Chen C-M, Chen C-YO. Almond consumption improved glycemic control and lipid profiles in patients with type 2 diabetes mellitus. Metabolism. (2011) 60:474–9. doi: 10.1016/j.metabol.2010.04.009
35. Guess ND, Dornhorst A, Oliver N, Bell JD, Thomas EL, Frost GS. A randomized controlled trial: the effect of inulin on weight management and ectopic fat in subjects with prediabetes. Nutr Metab. (2015) 12:36. doi: 10.1186/s12986-015-0033-2
36. Cuervo-Zanatta D, Syeda T, Sánchez-Valle V, Irene-Fierro M, Torres-Aguilar P, Torres-Ramos MA, et al. Dietary fiber modulates the release of gut bacterial products preventing cognitive decline in an alzheimer's mouse model. Cell Mol Neurobiol. (2022). doi: 10.1007/s10571-022-01268-7. [Epub ahead of print].
37. Hamer HM, Jonkers D, Venema K, Vanhoutvin S, Troost FJ, Brummer R-J. Review article: the role of butyrate on colonic function: review: role of butyrate on colonic function. Aliment Pharmacol Ther. (2007) 27:104–19. doi: 10.1111/j.1365-2036.2007.03562.x
38. Chambers ES, Viardot A, Psichas A, Morrison DJ, Murphy KG, Zac-Varghese SEK, et al. Effects of targeted delivery of propionate to the human colon on appetite regulation, body weight maintenance and adiposity in overweight adults. Gut. (2015) 64:1744–54. doi: 10.1136/gutjnl-2014-307913
39. Kimura I, Ozawa K, Inoue D, Imamura T, Kimura K, Maeda T, et al. The gut microbiota suppresses insulin-mediated fat accumulation via the short-chain fatty acid receptor GPR43. Nat Commun. (2013) 4:1829. doi: 10.1038/ncomms2852
40. Wang M, Yang F, Yan X, Chao X, Zhang W, Yuan C, et al. Anti-diabetic effect of banana peel dietary fibers on type 2 diabetic mellitus mice induced by streptozotocin and high-sugar and high-fat diet. J Food Biochem. (2022) 46:e14275. doi: 10.1111/jfbc.14275
41. Ueno H, Haraguchi N, Azuma M, Shiiya T, Noda T, Ebihara E, et al. Active consumption of konjac and konjac products improves blood glucose control in patients with type 2 diabetes mellitus. J Am Nutr Assoc. (2021) 1–7. doi: 10.1080/07315724.2021.2002739
42. Lunnon K, Smith RG, Cooper I, Greenbaum L, Mill J, Beeri MS. Blood methylomic signatures of presymptomatic dementia in elderly subjects with type 2 diabetes mellitus. Neurobiol Aging. (2015) 36:1600.e1–4. doi: 10.1016/j.neurobiolaging.2014.12.023
43. Morris TJ, Butcher LM, Feber A, Teschendorff AE, Chakravarthy AR, Wojdacz TK, et al. ChAMP: 450k chip analysis methylation pipeline. Bioinformatics. (2014) 30:428–30. doi: 10.1093/bioinformatics/btt684
44. Tian Y, Morris TJ, Webster AP, Yang Z, Beck S, Feber A, et al. ChAMP: updated methylation analysis pipeline for illumina BeadChips. Bioinformatics. (2017) 33:3982–4. doi: 10.1093/bioinformatics/btx513
45. Pang Z, Chong J, Zhou G, de Lima Morais DA, Chang L, Barrette M, et al. MetaboAnalyst 5.0: narrowing the gap between raw spectra and functional insights. Nucleic Acids Res. (2021) 49:W388–96. doi: 10.1093/nar/gkab382
46. Yang AC, Vest RT, Kern F, Lee DP, Agam M, Maat CA, et al. A human brain vascular atlas reveals diverse mediators of Alzheimer's risk. Nature. (2022) 603:885–92. doi: 10.1038/s41586-021-04369-3
47. Satija R, Farrell JA, Gennert D, Schier AF, Regev A. Spatial reconstruction of single-cell gene expression data. Nat Biotechnol. (2015) 33:495–502. doi: 10.1038/nbt.3192
48. Chen Y, Luo Z, Lin J, Qi B, Sun Y, Li F, et al. Exploring the potential mechanisms of melilotus officinalis (L.) Pall. in chronic muscle repair patterns using single cell receptor-ligand marker analysis and molecular dynamics simulations. Dis Mark. (2022) 2022:9082576. doi: 10.1155/2022/9082576
49. Luo Z, Qi B, Sun Y, Chen Y, Lin J, Qin H, et al. Engineering bioactive M2 macrophage-polarized, anti-inflammatory, miRNA-based liposomes for functional muscle repair: from exosomal mechanisms to biomaterials. Small. (2022) 18:2201957. doi: 10.1002/smll.202201957
50. Wu J, Qin J, Li L, Zhang K, Chen Y, Li Y, et al. Roles of the immune/methylation/autophagy landscape on single-cell genotypes and stroke risk in breast cancer microenvironment. Oxid Med Cell Longev. (2021) 2021:5633514. doi: 10.1155/2021/5633514
51. Lin W, Wang Q, Chen Y, Wang N, Ni Q, Qi C, et al. Identification of a 6-RBP gene signature for a comprehensive analysis of glioma and ischemic stroke: cognitive impairment and aging-related hypoxic stress. Front Aging Neurosci. (2022) 14:951197. doi: 10.3389/fnagi.2022.951197
52. Lin W, Wang Y, Chen Y, Wang Q, Gu Z, Zhu Y. Role of calcium signaling pathway-related gene regulatory networks in ischemic stroke based on multiple WGCNA and single-cell analysis. Oxidat Med Cell Longev. (2021) 2021:8060477. doi: 10.1155/2021/8060477
53. The Gene Ontology Consortium. Gene ontology consortium: going forward. Nucleic Acids Res. (2015) 43:D1049–56. doi: 10.1093/nar/gku1179
54. Zhou Y, Zhou B, Pache L, Chang M, Khodabakhshi AH, Tanaseichuk O, et al. Metascape provides a biologist-oriented resource for the analysis of systems-level datasets. Nat Commun. (2019) 10:1523. doi: 10.1038/s41467-019-09234-6
55. Kang X, Sun Y, Yi B, Jiang C, Yan X, Chen B, et al. Based on network pharmacology and molecular dynamics simulations, baicalein, an active ingredient of yiqi qingre ziyin method, potentially protects patients with atrophic rhinitis from cognitive impairment. Front Aging Neurosci. (2022) 14:880794. doi: 10.3389/fnagi.2022.880794
56. Sun Y, Luo Z, Chen Y, Lin J, Zhang Y, Qi B, et al. si-Tgfbr1-loading liposomes inhibit shoulder capsule fibrosis via mimicking the protective function of exosomes from patients with adhesive capsulitis. Biomater Res. (2022) 26:39. doi: 10.1186/s40824-022-00286-2
57. Lin W-W, Xu L-T, Chen Y-S, Go K, Sun C, Zhu Y-J. Single-Cell transcriptomics-based study of transcriptional regulatory features in the mouse brain vasculature. BioMed Res Int. (2021) 2021:7643209. doi: 10.1155/2021/7643209
58. Luo Z, Sun Y, Qi B, Lin J, Chen Y, Xu Y, et al. Human bone marrow mesenchymal stem cell-derived extracellular vesicles inhibit shoulder stiffness via let-7a/Tgfbr1 axis. Bioact Mater. (2022) 17:344–59. doi: 10.1016/j.bioactmat.2022.01.016
59. Mering C. STRING: a database of predicted functional associations between proteins. Nucleic Acids Res. (2003) 31:258–61. doi: 10.1093/nar/gkg034
60. Szklarczyk D, Gable AL, Nastou KC, Lyon D, Kirsch R, Pyysalo S, et al. The STRING database in 2021: customizable protein–protein networks, and functional characterization of user-uploaded gene/measurement sets. Nucleic Acids Res. (2021) 49:D605–12. doi: 10.1093/nar/gkaa1074
61. Feng W, Yang J, Song W, Xue Y. Crosstalk between heart failure and cognitive impairment via hsa-miR-933/RELB/CCL21 pathway. BioMed Re Int. (2021) 2021:2291899. doi: 10.1155/2021/2291899
62. Zhang Q, Yang J, Yang C, Yang X, Chen Y. Eucommia ulmoides Oliver-Tribulus terrestris L. drug pair regulates ferroptosis by mediating the neurovascular-related ligand-receptor interaction pathway- a potential drug pair for treatment hypertension and prevention ischemic stroke. Front Neurol. (2022) 13:833922. doi: 10.3389/fneur.2022.833922
63. Wang T, Liu G, Guo X, Ji W. Single-Cell analysis reveals the role of the neuropeptide receptor FPR2 in monocytes in kawasaki disease: a bioinformatic study. Dis Mark. (2022) 2022:1666240. doi: 10.1155/2022/1666240
64. Shannon P, Markiel A, Ozier O, Baliga NS, Wang JT, Ramage D, et al. Cytoscape: a software environment for integrated models of biomolecular interaction networks. Genome Res. (2003) 13:2498–504. doi: 10.1101/gr.1239303
65. Huang J, Liang X, Cai Z. A potential ceRNA network for neurological damage in preterm infants. BioMed Res Int. (2021) 2021:2628824. doi: 10.1155/2021/2628824
66. Goodsell DS, Morris GM, Olson AJ. Automated docking of flexible ligands: Applications of autodock. J Mol Recognit. (1996) 9:1–5. doi: 10.1002/(SICI)1099-1352(199601)9:1<1::AID-JMR241>3.0.CO;2-6
67. Zhang Y, Zhang J, Sun C, Wu F. Identification of the occurrence and potential mechanisms of heterotopic ossification associated with 17-beta-estradiol targeting MKX by bioinformatics analysis and cellular experiments. PeerJ. (2022) 9:e12696. doi: 10.7717/peerj.12696
68. Johansson-Persson A, Barri T, Ulmius M, Önning G, Dragsted LO. LC-QTOF/MS metabolomic profiles in human plasma after a 5-week high dietary fiber intake. Anal Bioanal Chem. (2013) 405:4799–809. doi: 10.1007/s00216-013-6874-5
69. Wu J, Yang D, Gong H, Qi Y, Sun H, Liu Y, et al. Multiple omics analysis reveals that high fiber diets promote gluconeogenesis and inhibit glycolysis in muscle. BMC Genomics. (2020) 21:660. doi: 10.1186/s12864-020-07048-1
70. Rabanal-Ruiz Y, Korolchuk V. mTORC1 and nutrient homeostasis: the central role of the lysosome. IJMS. (2018) 19:818. doi: 10.3390/ijms19030818
71. Choi C, Son Y, Kim J, Cho YK, Saha A, Kim M, et al. TM4SF5 knockout protects mice from diet-induced obesity partly by regulating autophagy in adipose tissue. Diabetes. (2021) 70:2000–13. doi: 10.2337/db21-0145
72. Mattar P, Toledo-Valenzuela L, Hernández-Cáceres MP, Peña-Oyarzún D, Morselli E, Perez-Leighton C. Integrating the effects of sucrose intake on the brain and white adipose tissue: could autophagy be a possible link? Obesity. (2022) 30:1143–55. doi: 10.1002/oby.23411
73. Li Q, Zhang T, Wang J, Zhang Z, Zhai Y, Yang G-Y, et al. Rapamycin attenuates mitochondrial dysfunction via activation of mitophagy in experimental ischemic stroke. Biochem Biophys Res Commun. (2014) 444:182–8. doi: 10.1016/j.bbrc.2014.01.032
74. Castellazzi M, Patergnani S, Donadio M, Giorgi C, Bonora M, Bosi C, et al. Autophagy and mitophagy biomarkers are reduced in sera of patients with Alzheimer's disease and mild cognitive impairment. Sci Rep. (2019) 9:20009. doi: 10.1038/s41598-019-56614-5
75. Huang Y, Wang Y, Feng Y, Wang P, He X, Ren H, et al. Role of endoplasmic reticulum stress-autophagy axis in severe burn-induced intestinal tight junction barrier dysfunction in mice. Front Physiol. (2019) 10:606. doi: 10.3389/fphys.2019.00606
76. Xu J, Liang R, Zhang W, Tian K, Li J, Chen X, et al. Faecalibacterium prausnitzii-derived microbial anti-inflammatory molecule regulates intestinal integrity in diabetes mellitus mice via modulating tight junction protein expression. J Diabetes. (2020) 12:224–36. doi: 10.1111/1753-0407.12986
77. Eshraghi M, Ahmadi M, Afshar S, Lorzadeh S, Adlimoghaddam A, Rezvani Jalal N, et al. Enhancing autophagy in Alzheimer's disease through drug repositioning. Pharmacol Ther. (2022) 237:108171. doi: 10.1016/j.pharmthera.2022.108171
78. Moreau K, Fleming A, Imarisio S, Lopez Ramirez A, Mercer JL, Jimenez-Sanchez M, et al. PICALM modulates autophagy activity and tau accumulation. Nat Commun. (2014) 5:4998. doi: 10.1038/ncomms5998
79. Spooner HC, Derrick SA, Maj M, Manjarín R, Hernandez GV, Tailor DS, et al. High-Fructose, high-fat diet alters muscle composition and fuel utilization in a juvenile iberian pig model of non-alcoholic fatty liver disease. Nutrients. (2021) 13:4195. doi: 10.3390/nu13124195
80. Choi JW, Ohn JH, Jung HS, Park YJ, Jang HC, Chung SS, et al. Carnitine induces autophagy and restores high-fat diet-induced mitochondrial dysfunction. Metabolism. (2018) 78:43–51. doi: 10.1016/j.metabol.2017.09.005
81. Morales PE, Monsalves-Álvarez M, Tadinada SM, Harris MP, Ramírez-Sagredo A, Ortiz-Quintero J, et al. Skeletal muscle type-specific mitochondrial adaptation to high-fat diet relies on differential autophagy modulation. The FASEB J. (2021) 35:e21933. doi: 10.1096/fj.202001593RR
82. Akhtar A, Sah SP. Insulin signaling pathway and related molecules: role in neurodegeneration and Alzheimer's disease. Neurochem Int. (2020) 135:104707. doi: 10.1016/j.neuint.2020.104707
83. Georgousaki K, Tsafantakis N, Gumeni S, Lambrinidis G, González-Menéndez V, Tormo JR, et al. Biological evaluation and in silico study of benzoic acid derivatives from Bjerkandera adusta targeting proteostasis network modules. Molecules. (2020) 25:666. doi: 10.3390/molecules25030666
84. Pires KM, Ilkun O, Valente M, Boudina S. Treatment with a SOD mimetic reduces visceral adiposity, adipocyte death, and adipose tissue inflammation in high fat-fed mice. Obesity. (2014) 22:178–87. doi: 10.1002/oby.20465
85. Brestoff JR, Brodsky T, Sosinsky AZ, McLoughlin R, Stansky E, Fussell L, et al. Manganese [III] tetrakis [5,10,15,20]-Benzoic acid porphyrin reduces adiposity and improves insulin action in mice with pre-existing obesity. PLoS ONE. (2015) 10:e0137388. doi: 10.1371/journal.pone.0137388
86. Oh KK. A network pharmacology study to investigate bioactive compounds and signaling pathways of garlic ( Allium sativum L.) husk against type 2 diabetes mellitus. J Food Biochem. (2022) 46:e14106. doi: 10.1111/jfbc.14106
87. Yang T, Zhang L, Shang Y, Zhu Z, Jin S, Guo Z, et al. Concurrent suppression of Aβ aggregation and NLRP3 inflammasome activation for treating Alzheimer's disease. Chem Sci. (2022) 13:2971–80. doi: 10.1039/D1SC06071F
88. Hsieh C-M, Fukumoto S, Layne MD, Maemura K, Charles H, Patel A, et al. Striated muscle preferentially expressed genes α and β are two serine/threonine protein kinases derived from the same gene as the aortic preferentially expressed gene-1. J Biol Chem. (2000) 275:36966–73. doi: 10.1074/jbc.M006028200
89. Lee K, Kim J, Köhler M, Yu J, Shi Y, Yang S-N, et al. Blocking Ca2+ channel β3 subunit reverses diabetes. Cell Rep. (2018) 24:922–34. doi: 10.1016/j.celrep.2018.06.086
90. Tsutsui Y, Hays FA. A link between alzheimer's and type II diabetes mellitus? Ca+2-mediated signal control and protein localization. BioEssays. (2018) 40:1700219. doi: 10.1002/bies.201700219
91. Quick AP, Wang Q, Philippen LE, Barreto-Torres G, Chiang DY, Beavers D, et al. SPEG (Striated muscle preferentially expressed protein kinase) is essential for cardiac function by regulating junctional membrane complex activity. Circ Res. (2017) 120:110–19. doi: 10.1161/CIRCRESAHA.116.309977
92. Karra E, O'Daly OG, Choudhury AI, Yousseif A, Millership S, Neary MT, et al. A link between FTO, ghrelin, and impaired brain food-cue responsivity. J Clin Invest. (2013) 123:3539–51. doi: 10.1172/JCI44403
93. Takala J. Nutrition in acute renal failure. Crit Care Clin. (1987) 3:155–66. doi: 10.1016/S0749-0704(18)30566-9
Keywords: high-fiber diet, neurodegenerative diseases, obesity, neurovascular, SPEG, AD
Citation: Luo N, Guo Y, Peng L and Deng F (2023) High-fiber-diet-related metabolites improve neurodegenerative symptoms in patients with obesity with diabetes mellitus by modulating the hippocampal–hypothalamic endocrine axis. Front. Neurol. 13:1026904. doi: 10.3389/fneur.2022.1026904
Received: 24 August 2022; Accepted: 09 December 2022;
Published: 17 January 2023.
Edited by:
Jun Xu, Beijing Tiantan Hospital, Capital Medical University, ChinaReviewed by:
Boyan Zhao, Fourth Military Medical University, ChinaJie Tao, Shanghai General Hospital, China
Chao Xu, The Second Affiliated Hospital of Shaanxi University of Traditional Chinese Medicine, China
Copyright © 2023 Luo, Guo, Peng and Deng. This is an open-access article distributed under the terms of the Creative Commons Attribution License (CC BY). The use, distribution or reproduction in other forums is permitted, provided the original author(s) and the copyright owner(s) are credited and that the original publication in this journal is cited, in accordance with accepted academic practice. No use, distribution or reproduction is permitted which does not comply with these terms.
*Correspondence: Ning Luo,  bmVkODEyMkAxNjMuY29t
†These authors have contributed equally to this work