

- Department of Psychiatry, Center for Neuroscience, University of Pittsburgh, Pittsburgh, PA, USA
The structure of gene coexpression networks reflects the activation and interaction of multiple cellular systems. Since the pathology of neuropsychiatric disorders is influenced by diverse cellular systems and pathways, we investigated gene coexpression networks in major depression, and searched for putative unifying themes in network connectivity across neuropsychiatric disorders. Specifically, based on the prevalence of the lethality–centrality relationship in disease-related networks, we hypothesized that network changes between control and major depression-related networks would be centered around coexpression hubs, and secondly, that differentially expressed (DE) genes would have a characteristic position and connectivity level in those networks. Mathematically, the first hypothesis tests the relationship of differential coexpression to network connectivity, while the second “hybrid” expression-and-network hypothesis tests the relationship of differential expression to network connectivity. To answer these questions about the potential interaction of coexpression network structure with differential expression, we utilized all available human post-mortem depression-related datasets appropriate for coexpression analysis, which spanned different microarray platforms, cohorts, and brain regions. Similar studies were also performed in an animal model of depression and in schizophrenia and bipolar disorder microarray datasets. We now provide results which consistently support (1) that genes assemble into small-world and scale-free networks in control subjects, (2) that this efficient network topology is largely resilient to changes in depressed subjects, and (3) that DE genes are positioned on the periphery of coexpression networks. Similar results were observed in a mouse model of depression, and in selected bipolar- and schizophrenia-related networks. Finally, we show that baseline expression variability contributes to the propensity of genes to be network hubs and/or to be DE in disease. In summary, our results suggest that the small-world and scale-free properties of gene networks are resilient to pathological changes in major depression, and that the network structure may constrain the extent to which a gene may be DE in the illness, hence informing further gene-network-based mechanistic studies of neuropsychiatric disorders.
Introduction
The pathophysiology of major depression is hypothesized to involve dysregulation at the levels of genes, neurons, and brain regions (Belmaker and Agam, 2008; Sibille et al., 2009), but the size, complexity, and interaction of the affected systems make it difficult to determine the disease impact of single modulators. Indeed, it appears that the disorder is driven by the collusion of deficits in metabolic, inflammatory, and neuroendocrine systems (Gaiteri et al., 2010) alongside abnormalities in multiple neurotransmitter systems (Belmaker and Agam, 2008), which move brain function into a pathological dynamical state. Gene microarrays have the potential to overcome this complexity by simultaneously measuring levels of many different gene transcripts. However, this larger window into cellular activity has not always led to more consistent results, as different laboratories, brain regions, and model systems implicate a divergent set of pathological mechanisms in depression (Mehta et al., 2010).
Here, we propose using coexpression-based gene networks, which encompass many types of molecular interactions, as a contextual biological framework that may highlight common features of suspected disease genes in depression and other neuropsychiatric disorders. In coexpression networks, the links between genes (nodes) are determined by the extent of their correlated pattern of expression across multiple samples (measured by Pearson correlation) and are thought to result from a variety of biological relationships between genes, including common transcription factors or adjacent genome position (Allocco et al., 2004; Purmann et al., 2007; Marco et al., 2009). Gene networks derived from different tissues and species consistently show stereotypical “small-world” and “scale-free” network architecture (Carlson et al., 2006; Oldham et al., 2008). In small-world networks, nodes (genes) are typically strongly clustered into local communities that support biological sub-processes (Lee et al., 2004). Small-world networks also have rare “shortcut” links that balance local modularity with global connectivity. The connectivity distribution in scale-free networks can reinforce the local modularity and global connectivity of small-world architecture, as most genes are “provincial,” with only a few connections, while rare “hub” genes provide shortcuts between many nodes.
Networks with these structural characteristics are robust to the deletion of random nodes, but critically sensitive to disrupted function or “attacks” targeted at the rare hub nodes (Albert et al., 2000). Accordingly, at the level of molecular interactions, there are numerous demonstrations of close relationships between network connectivity and disease activity (Jeong et al., 2001; Feldman et al., 2008; Barrenas et al., 2009). Specifically, pathology-related targets may occupy strategic positions within these networks, which are poised to interrupt normal cellular function (Zotenko et al., 2008; Yanashima et al., 2009). Hub nodes may be intrinsically disease-targeted, or merely frequently associated with disease, due to their far-flung connections (He and Zhang, 2006; Goh et al., 2007). In either case, the collusion of network structure and pathology are important to understanding the relevance and priority of disease-related changes.
Therefore, to understand how networks of molecular interactions may broadly direct transcription changes in depression, we investigated gene coexpression network structure in control and depressed subjects using post-mortem transcriptome datasets. Based on the prevalence of the lethality–centrality relationship in disease-related networks, we hypothesized that network changes between control and disease-state networks would be centered around coexpression hubs. Second we hypothesized that differentially expressed (DE) genes would have a characteristic position and connectivity level in those networks. Mathematically, the first hypothesis tests the relationship of differential coexpression to network connectivity, while the second “hybrid” expression-and-network hypothesis tests the relationship of differential expression to network connectivity. Because we seek to establish general principles of differential expression, we show the findings are consistent in an animal model of depression and applicable to a broader class of neuropsychiatric disorders, by including schizophrenia and bipolar disorder array datasets.
We show that while the basic structure of these networks is small-world and scale-free, connectivity changes in disease are not targeted at network hubs – the network topology is surprisingly resilient to the effects of depression, given the association of hubs and disease action. Relatedly, tests of our second hypothesis show that DE genes are positioned on the perimeter of the coexpression network – relatively far from the critical network core. To understand what may mediate this resilient core gene network structure, we explore the relationship of variability in gene transcript expression levels to network connectivity. Based on these results, we propose a general model of altered transcription in neuropsychiatric disorders and speculate on how the diffuse and peripheral localization of disease-related genes may inform the identification of consistent DE genes across studies.
Materials and Methods
Study Inclusion Criteria
Thirteen human depression post-mortem microarray datasets of sufficient size for coexpression analysis were included (Table 1; Torrey et al., 2000; Iwamoto et al., 2004; Sibille et al., 2004; Aston et al., 2005; Iwamoto and Kato, 2006; Surget et al., 2009). Array data from mice submitted to the unpredictable chronic mild stress (UCMS) model of depression were also included (Surget et al., 2009). Analyses were also performed on additional schizophrenia- and bipolar-related datasets (Table 1) to test whether the observed trends were specific to depression or relevant to multiple complex disorders. Those results are compiled with depression data (both human and mouse) into our meta-analysis results and displayed in the meta-analysis figures. We used optimized link-selection methods (below) to ensure that despite a range of post-mortem standards across this collection of studies, that the network structure was real and representative of biological features.
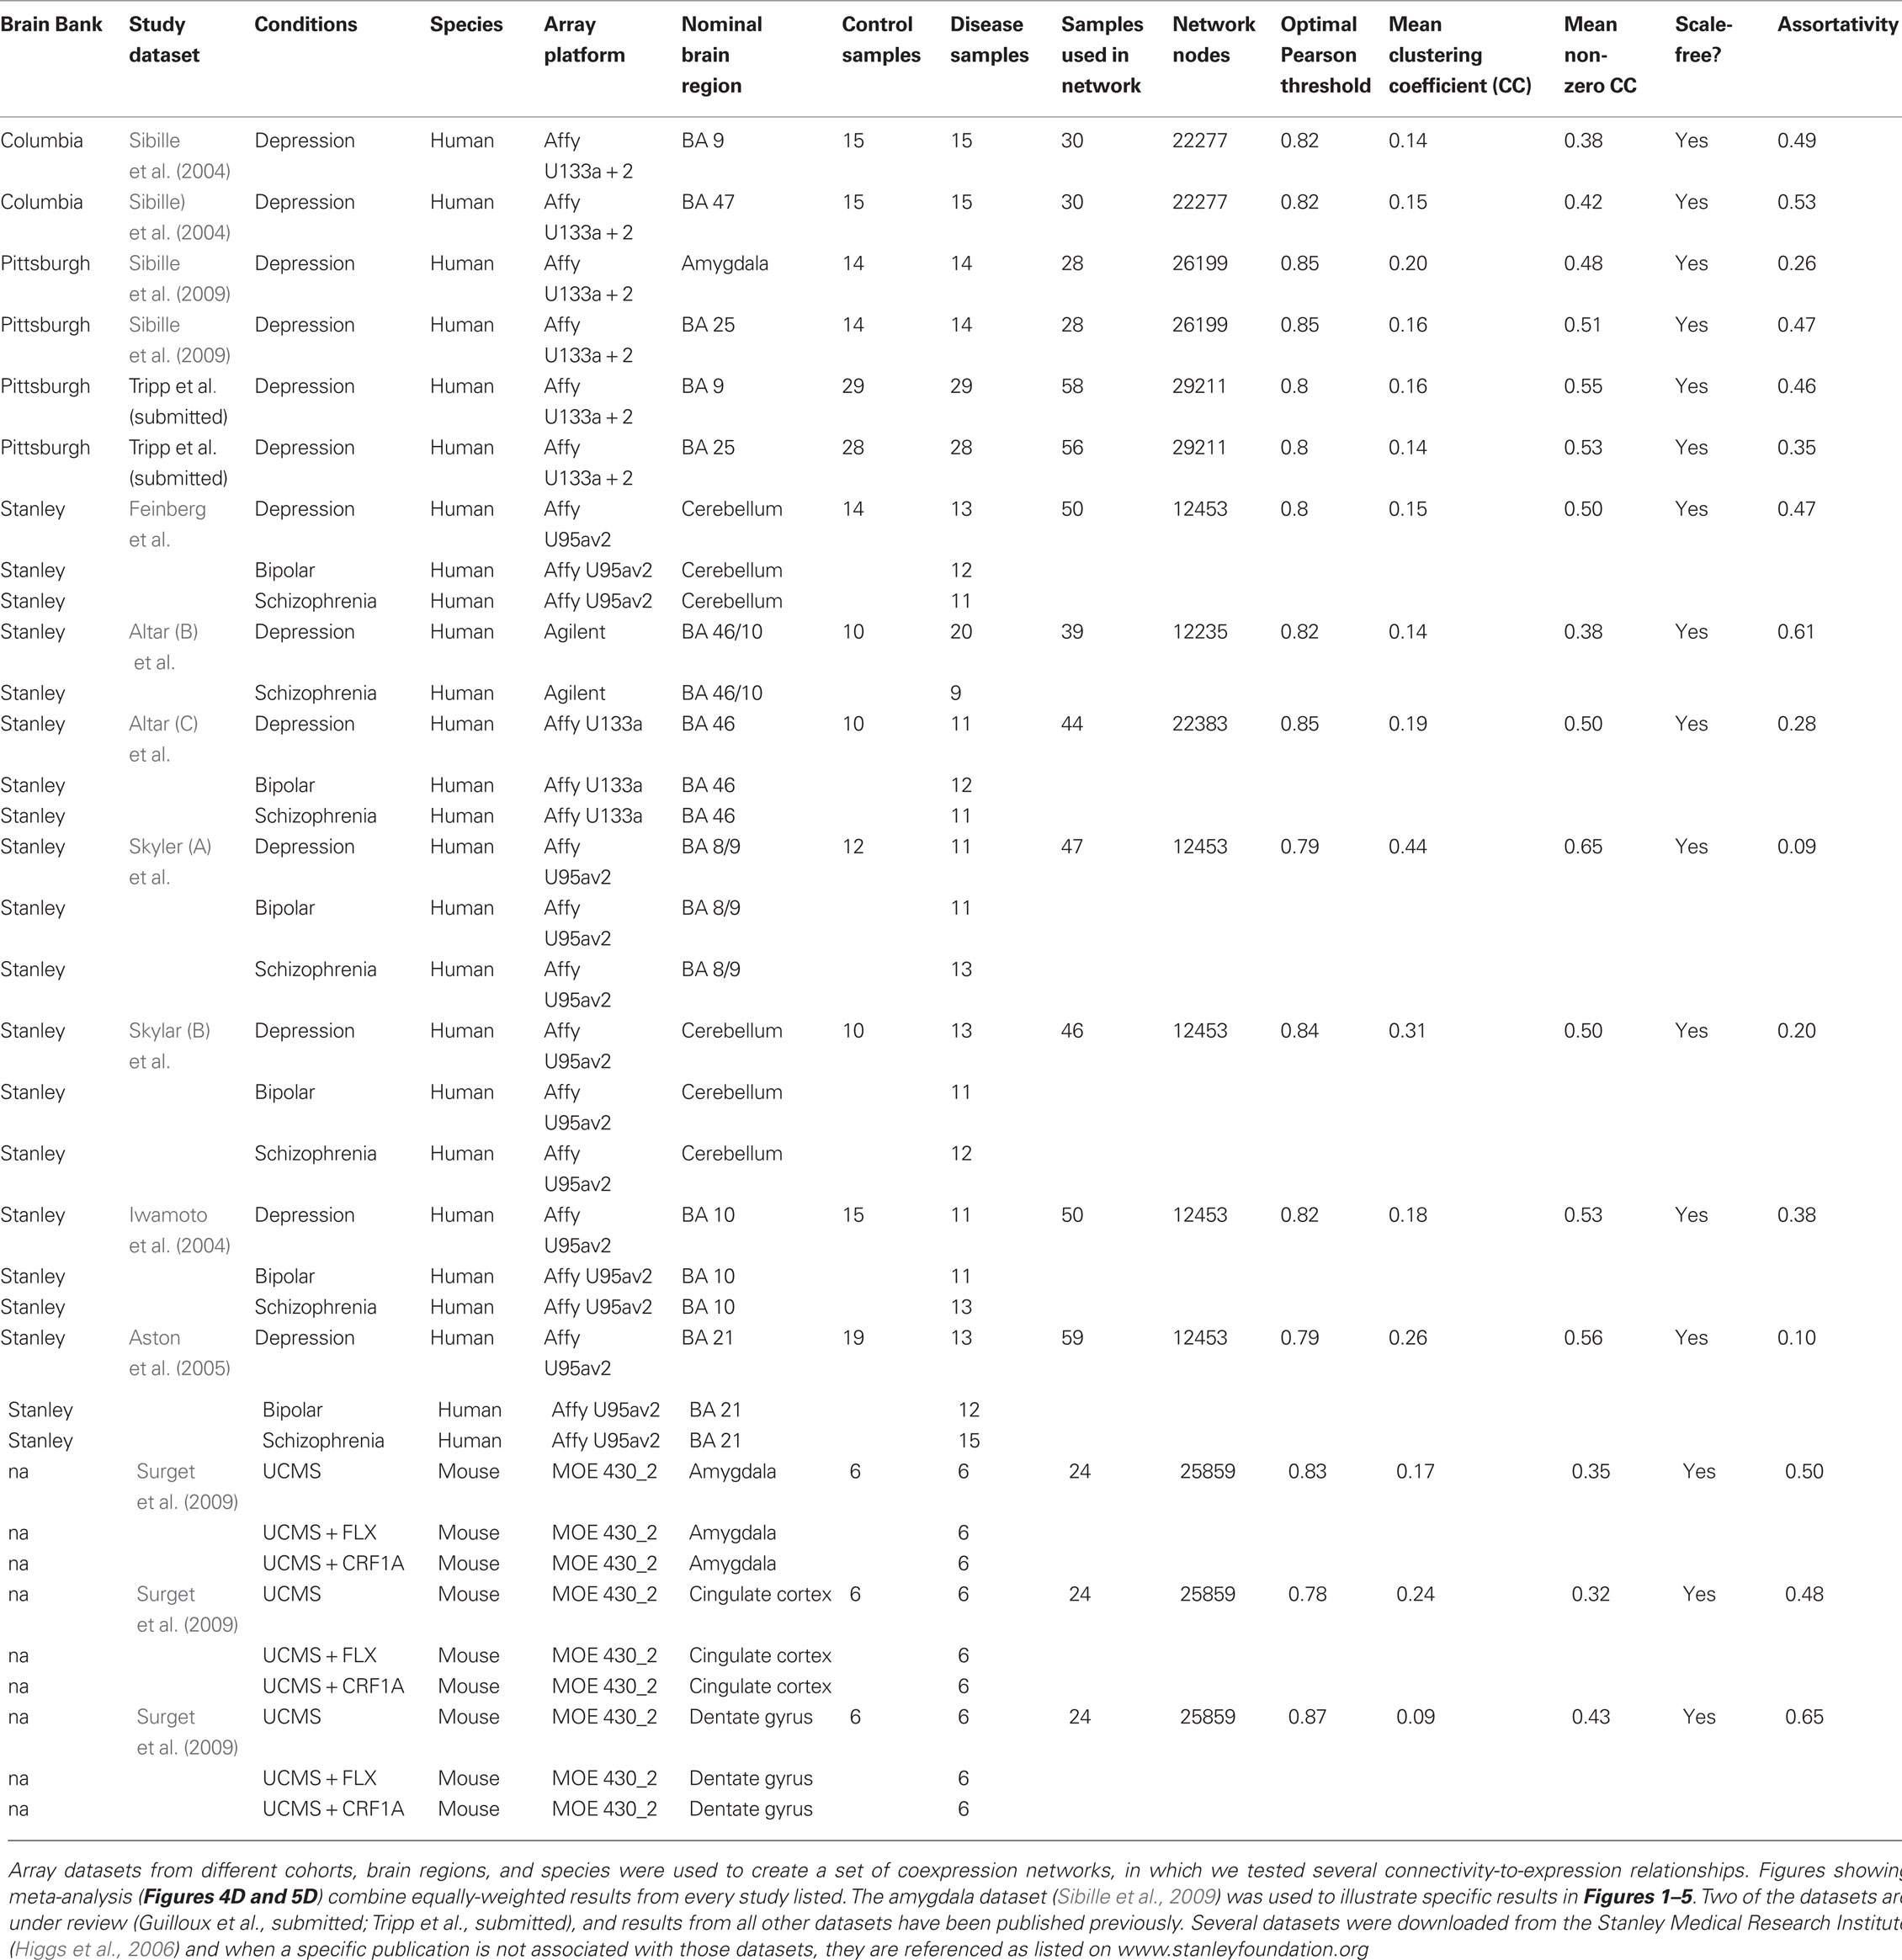
Table 1. Summary of array datasets and network parameters.
Optimal Selection of Network Links to Establish a High-Confidence Gene Networks Using Human Post-Mortem Microarray Data
There are multiple ways to infer gene interaction networks, however all methods rely on synchronous fluctuations in two or more genes across multiple microarrays. Therefore, when inferring biological networks based on microarrays, a primary concern is selecting an optimal level of correlation, so that the core network structure is a product of real biological interactions, not spurious data correlations. To ensure that the networks generated represent biological reality, we first individually optimize the link-selection process for each dataset, since each represents a distinct combination of sample size, data quality, and biological structure. Figure 1A illustrates the importance of samples sizes in addressing these issues by shrinking the null distribution of expected Pearson correlation values between genes (decreasing noise). The larger number of extreme correlation values of the non-permutated dataset (Figure 1A, red) compared to the permutated data (gray) is thus indicative of biological relationships underlying gene correlations. Using human array data, an additional concern is the influence of subpopulations on network generation. Increasing sample-size addresses this concern as it refines the set of actual correlations, decreasing false positives (shown in Figure 1B; distribution plateauing at n = 14 samples). These plots show that false-positive network links are unlikely to occur at high link-selection thresholds (Figure 1A).
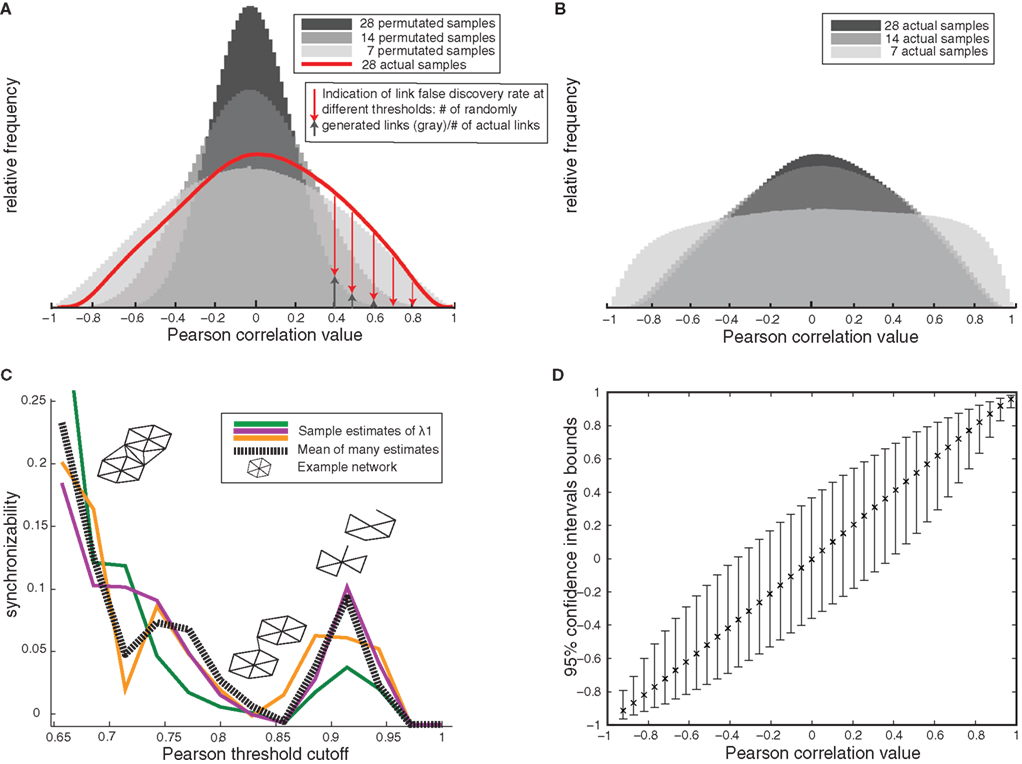
Figure 1. Gene network validity and optimization – example from human amygdala(A) Decreasing spurious network links with increasing sample size is shown by the null correlation distributions in permutated samples decreasing toward zero with increasing sample size, and the greater number of high correlations in real versus permutated data (red). (B) Decreasing false-positive correlations in the actual data set with increasing sample size is shown as a decrease in the number of extreme correlations when comparing 7–14 samples. Correlation values then remains constant between n = 14 and n = 28 samples. (C) Example estimates of network synchronizability (low synchronizability implies high modularity) at various thresholds in order to optimize correlation cutoff (example estimates based on different subsets of nodes are shown in different colors). Inset: schematic of link pruning and changes in modularity shown for increasing cutoffs. (D) 95% confidence bounds on Pearson correlation values (estimated by resampling) later employed in testing for differential coexpression.
To translate raw gene–gene correlation values into gene networks, we apply this optimized threshold to the absolute correlation values and select all higher correlations to be network links (∼0.85 for most networks; Figure 1C). The outcome of this network generation procedure is extremely low false discovery rate (FDR) for network links, commonly under 1%. Bootstrap estimates of correlation values shows that at the high thresholds used here, the correlations are very stable and that there is little influence from outlying values (Figure 1D), as would be generated by the presence of subpopulations. Based on this complete assessment of gene–gene correlations, every dataset was transformed into a separate high-confidence network, in which links represent biologically undefined but highly consistent relationship between connected nodes.
To optimally balance false positive and false negative links, we utilize the stereotypical community structure of biological networks. Because modularity (segregated clusters) is a hallmark of meaningful network connections, we chose the cutoff for “real” correlations at the point of greatest biological/clustered structure. We do this by minimizing network synchronizability (λ1) – a measure which is small in networks of nearly disconnected clusters (Figure 1C), indicating the network has been pruned down to its core modular components (Perkins and Langston, 2009). As illustrated in Figure 1C, this procedure generates networks for a range of potential cutoff values for the Pearson correlation between genes (x-axis Figure 1C) and then computes the corresponding synchronizability (a measure of modularity). To ensure we have found a robust minimum synchronizability (maximum modularity) we perform this procedure for several large randomly selected subnetworks and use the cutoff specified by the average of these tests. In addition to theoretical support that maximum modularity should reflect maximum biological information, this method was the top performer in a competition of threshold selection methods, indicating it indeed has practical relevance for creating coexpression networks (Borate et al., 2009).
Assortativity
The likelihood of connection to nodes of similar degree, is another global characteristic that may direct disease activity in coexpression networks (Newman, 2003). A commonly cited distinction between technological and biological network compared to social networks social networks are positively assortative (meaning that hubs are preferentially connected to hubs, while provincial nodes are preferentially connected to other provincial nodes) while technological networks tend to be disassortative (have preferential hub-provincial connections). However, we show here that all investigated gene array-based networks are strongly assortative (mean/median assortativity 0.396/0.468; Table 1). The high positive assortativity may be due to the symmetric correlation basis of coexpression networks and their high modularity. Specifically, genes in large modules are by definition well-correlated with other genes in that large module, and genes in small modules are well-correlated with genes in that small module. Thus, the true assortativity of gene interactions should be determined by further research on the regulatory networks underlying coexpression.
Differential Connectivity
To check for evidence of hub targeting of coexpression links in disease, we use the resampling-based confidence intervals (Figure 1D) to identify links that are differentially coexpressed in control and disease networks. If a link is in condition “A” is greater than the optimized cutoff and the correlation falls below its associated lower 95% confidence bound in condition “B” (or the reverse situation for link creation) then we define it as differentially coexpressed (“A” and “B” signify datasets in any control/disease comparison). The prevalence of lethality–centrality relationships in disease biology suggests that altered links would be centered around hub nodes. Therefore we tracked the number of differentially coexpressed links connected to the top 5% most connected genes (“hub” nodes) versus an equal number of randomly selected (non-hub or “provincial” nodes). Significance of a particular number of altered links (p-values in Figure 3) connected to a given node type (hub/provincial) was assessed by comparing the actual number of DE links to the null distribution for the expected number of differentially coexpressed links. These null distributions were created by permutating the control and disease arrays 1000 times to create sets of networks with no disease-driven effects (because it is balanced between the permuted groups) and then counting the number of differentially coexpressed links (similar methodology to Choi et al., 2005).
Determining Significance of Gene Connectivity
The expected mean connectivity of a selected group of genes (for instance, low p-value genes) can be accurately estimated through resampling even in degree-heterogeneous scale-free networks. By randomly selecting sets of genes of the same size (10,000 times), null distributions such as those in Figure 4D can provide confidence intervals on expected connectivity. Utilizing these limits, it is possible to tell if a group of genes falls outside of the 95% expected range of resamples, either as highly connected hubs or low-connected “provincial” nodes.
Permutation Significance Bounds
We repeatedly splice datasets into two pseudo “control” and “depressed” selections, each consisting of 50/50 mixture of control/depressed data. Thus any low p-values from this pseudo-comparison are due to chance or unknown demographic stratification characteristic, and not disease effect. Repeated comparisons of degree versus p-value in such mixed datasets generates an expected null range for the degree associated with each p-value segment. The 95% confidence intervals on expected degree for a given p-value segment are equivalent to the bounds that encompass 95% of the permutation values (see Figure 5B for examples).
Corrections for Multiple Testing and Procedure for Meta-Analysis of Connectivity Patterns
To assess the level of connectivity at a particular thresholds across datasets we combined individual p-values for under- or over-connectivity using the “inverse normal method,” This is more appropriate to this data than the common Fisher’s method, as it equally weights high and low values and outputs a consensus p-value as opposed to specifically favoring low p-value results. This combined p-value estimation of under- or over-connectivity we term “meta-connectivity,” significance of the meta-connectivity values was assessed using the Benjamini–Hochberg method to control the FDR (Benjamini and Hochberg, 1995). Because datasets can be segmented with different bin sizes, correction to the meta-connectivity values due to multiple testing varies based on the number of segments into which genes are partitioned (alpha/#bins). Thus, it is possible to reduce the nominal FDR simply by a coarser estimation of the region of p-values with non-random connectivity. However, even with our fine-grained approach, there were clearly defined under- and over-connected regions at 10% FDR, which largely persisted at 1% FDR as well.
Results
Small-world Gene Network Structure in Brain Transcriptome Datasets
In unweighted coexpression networks, each node is a single gene/probe-set and each link represents a correlation between gene expression profiles above some threshold. These networks were generated with established techniques to minimize false-positive links (under 1%), that optimize the threshold for maximal biological information (Figure 1). As expected based on many previous studies (Bergmann et al., 2004; Jordan et al., 2004; Van Noort et al., 2004; Tsaparas et al., 2006), all datasets examined have approximately scale-free and small-world characteristics (Table 1). Since a graphical representation of the ∼200,000 links present in individual networks is not practical, the characteristics of the “consensus” network generated from both control and disease-state samples are illustrated in Figure 2D using the exemplar human amygdala dataset. First, the distribution of gene links (degree) fits a power-law on log–log scale (R = 0.82), indicating an approximately scale-free connectivity distribution (Figure 2A). Second, the distribution of path lengths (number of links) between any two genes is similar to that of randomized networks (Figure 2B). Third, genes were clustered into local communities with a high number of mutual interconnections (Figure 2C), compared to a randomized network with identical degree distribution and number of links. The combination of high clustering (Figure 2C) and low average path-length (Figure 2B) is the hallmark of small-world networks. All tested networks also showed uniformly positive assortativity, meaning that hubs are likely connected to other hubs, and provincial nodes to other provincial nodes (Table 1). Figure 2D describes a schematic of network structure that incorporates all of these characteristics.
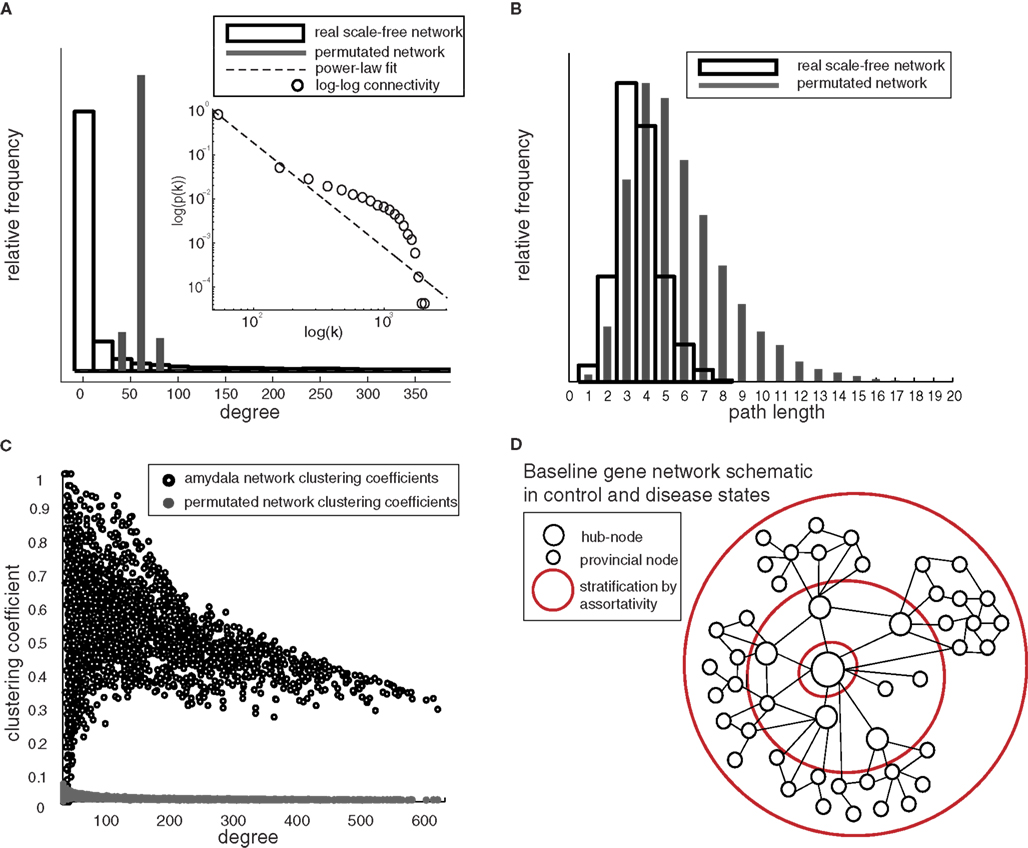
Figure 2. Scale-free and small-world properties of gene networks common to all human brain datasets – examples from human amygdala. (A) Histogram of frequency of connectivity values for exemplar amygdala network and randomized network with equal total number of links (degree, k), truncated at k = 400 for clarity. Inset: a power-law fit of full connectivity distribution (R = 0.82) on log–log scale indicates that the distribution of links is approximately scale-free. The connectivity distribution does not follow an exact power-law, but the degree distribution is highly heterogeneous compared to the Gaussian degree distribution expected under random connectivity (gray bars). (B) Path-length comparison of actual and randomized network indicates that the signal pathways through the network are extremely short (since random networks are a common benchmark for low path lengths). (C) Clustering coefficients by degree nodes for a segment of the real amygdala network compared to randomized network with identical degree distribution and number of links. Parameters for all dataset-related networks are in Table 1. (D) Network schematic of resilient structure, which persists in both control and disease networks, showing existence of hubs, high clustering, and positive assortativity.
Resilient Small-World Gene Network Structure in Major Depression
Since the basic combined structure of both control and disease coexpression networks is scale-free and small-world, it is possible that disease genes propagate pathological activity by altering the connections of influential hub genes – a concept validated in other biological systems (Bullmore and Sporns, 2009). Hence, we compared gain or loss of connections (correlation-based links going from control to disease-state networks) to measure differential coexpression for hub and provincial genes (Figure 3A). This comparison (Figures 3B,C) shows that hub connections are not preferentially disrupted in the example of the amygdala network. In fact, hubs experience less average rewiring between control and depressed states than do provincial nodes. Also, the total number of differential connectivity between control and depressed networks lies within the disease-permutated bounds (Figure 3B), indicating that apparent connectivity changes in disease are indistinguishable from variability in the Pearson correlations (Figure 3C).
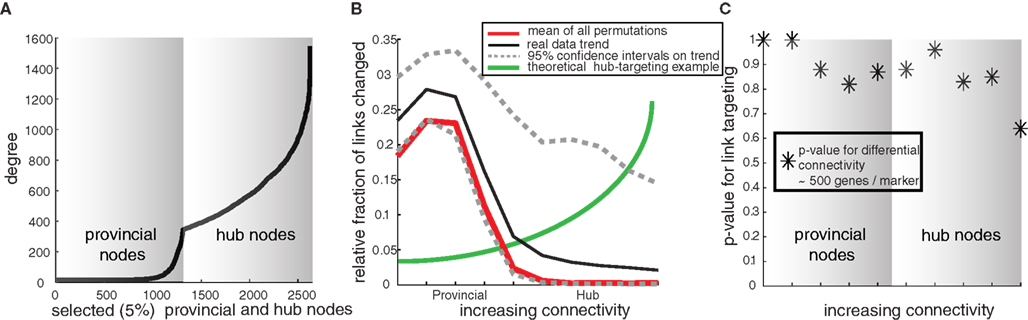
Figure 3. Small-world network structure is maintained in post-mortem networks in disease states – example from human amygdala. (A) Connectivity of hubs (top 5% connectivity nodes) and equal number of provincial (non-hub) nodes for examination of targeted differential connectivity in disease. This example selection of two different types of genes will be used to illustrate that disease does not target hub connections. (B) For this selection of provincial and hub nodes, we compute the relative fraction of altered links (both created and destroyed) between control and depressed networks. For comparison the same rewiring statistic is calculated for disease-permutated data (pseudo network comparisons with no disease effect). These permutations establish the mean and expected confidence bounds on a real effect. While provincial nodes are generically more likely to show differential connectivity compared to hub nodes, this is not a disease effect, but rather due to the greater statistical stability of hub nodes with a large base of connections, since the “real” network connectivity changes are within the expected bounds of variability. (C) To further quantify panel 3B, the p-values for probability of greater than expected differential connectivity are plotted, showing that connectivity changes in depression are not greater than expected by chance for both provincial and hub nodes.
Expanding this test to all datasets, we find no evidence of hub targeting (using p < 0.05 as the criterion for hub targeting in all datasets), including gene networks derived from an animal model of depression and bipolar and schizophrenia datasets. These results demonstrate that the pathology of depression is not created through differential connectivity targeted at hub nodes (at least using this methodology in current datasets), as in this critical measure (hub link targeting), coexpression networks are resilient to changes in depression.
A Hybrid Approach Linking Differentially Expressed Genes with Coexpression Networks
To address our second hypothesis relating to connectivity characteristics of DE genes within coexpression networks, we use a constant network structure derived from the combined control and disease samples, supported by observation of similar connectivity in both conditions. We observed a robust trend between differential expression and connectivity, wherein genes with low p-values for differential expression display very low connectivity, while genes with non-significant disease effect (high p-value) are progressively more connected (Figure 4A). Evidence for this relationship was generated by (1) sorting p-values for differential expression from least to greatest numeric value, (2) binning the ordered p-values into 100 groups/percentiles, and (3) computing the mean connectivity of each p-value group/percentile. We use this binned percentile method because it facilitates comparisons across datasets with unique p-value distributions. We repeated this procedure on every dataset, showing visual examples from the amygdala dataset, and compiling results across all datasets into a meta-analysis (see below). Performing all analyses using only control samples to generate the network structure does not significantly alter the trends (not shown), but leads to higher link false-discovery rates. Significance of the connectivity level at a given p-value percentile was tested by repeatedly selecting an equivalent number of genes at random from that particular dataset to generate a distribution of expected connectivity (Figure 4C). The results shown in Figure 4A do not rule out the possibility that DE genes might be located at low-connected but influential “bottleneck” positions. Since the betweenness centrality of such bottleneck nodes would be elevated, we assessed the relationship of betweeness centrality to differential connectivity (example result from amygdale dataset in Figure 4B) and found that DE genes are not located in bottleneck positions in coexpression networks.
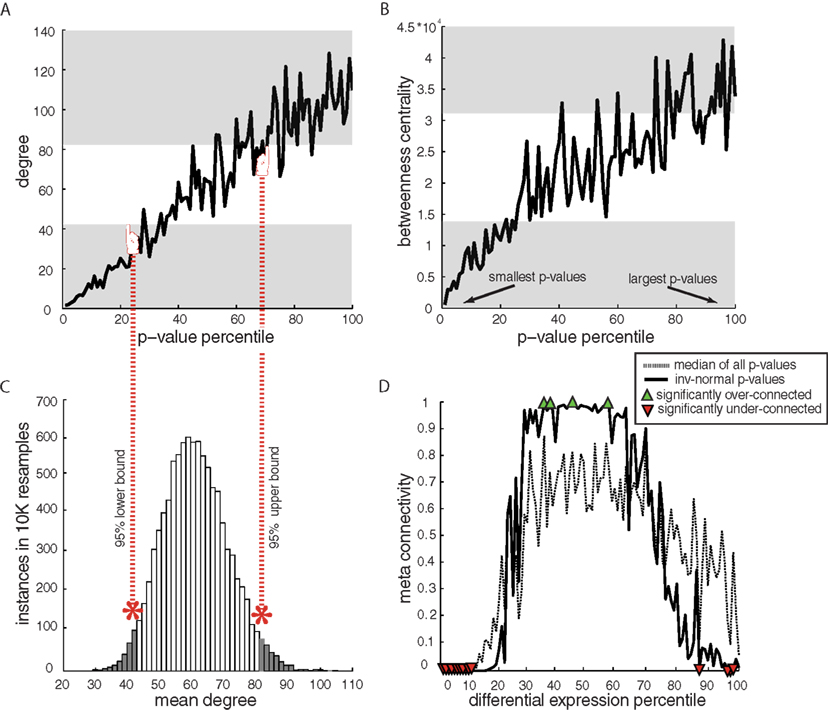
Figure 4. Examples and meta-analysis of network characteristics stratified by significance of disease-related differential gene expression. (A) Stereotypical trends in connectivity by p-value for differential expression in human amygdala data, showing rising connectivity with rising p-values and particularly low connectivity for the most DE genes (in all figures lowest p-values are to the left and transparent gray area shows non-random connectivity values). Here, two-group t-test p-values were used for differential expression in order to normalize analytical approaches across datasets. Results using complex statistical models in the amygdala dataset did not affect the outcome (not shown). (B) Betweenness centrality (a measure of how trafficked a particular node is by all shortest network paths) by p-values in amygdala indicates that the DE genes are not merely low-connected, but on the edge of the network, because low p-value genes have the lowest betweenness centrality. (C) An example of a null connectivity distribution is used to estimate the expected range of connectivity – each network has its own specific null distribution used to estimate bounds on expected connectivity. (D) Combined p-value by degree trends for all datasets (spanning species, disease, and array platforms). Meta-connectivity values close to 0 indicate less connectivity than expected for that percentile of DE genes in all datasets. Percentiles with non-random connectivity were estimated at alpha = 0.05 and 10% FDR.
The consensus relationship of connectivity to differential expression across all datasets (defined as meta-connectivity; see Materials and Methods) indicates a strong and stereotypical transcription response to disease that is closely related to gene network structure (Figure 4D). This collective analysis, that compiles results from datasets that span platform, disease, and species, suggests a stereotypical connectivity for the entire continuum of DE genes, with the most consistent finding across datasets being low connectivity for low p-values DE genes. This was very consistent for the top 10% of DE genes across all datasets, including bipolar-, schizophrenia-, and the UCMS animal model-related datasets, even when controlling for FDR (10%). Greater than expected connectivity is also observed for some moderately DE genes, but in a less consistent manner (see fewer number of significant points at middle percentiles in Figure 4D), due to lack of this broad trend in specific datasets (Figure 4A for instance). Similarly, there is an inconsistent drop in connectivity for ultra-high p-values, which is not supported across datasets, unlike the major finding of robust low connectivity for low p-value DE genes.
Since meta-analysis shows that the connectivity of DE genes is highly non-random (Figure 4D), we next investigated the broader question of whether these trends were specific to disease. To answer this question, for every dataset individually, we evaluate the same p-value to connectivity relationship for pseudo-groups, consisting of 50/50 control/disease combinations (Figure 5A). The range of expected results from these permutations (Figure 5B) shows that the non-random connectivity of the true control-disease comparison is actually not disease-specific, since the “observed” connectivity trends lie between permutation bounds. Furthermore, the control-disease comparison show a differential expression to connectivity relationship that is very similar to the mean relationship of all permutations, indicating that while the real differential expression to connectivity relationship is non-random, it is not unexpected or disease-specific. This additional test for disease specificity was not performed in the only prior study that used comparable approaches (although in asthma; Lu et al., 2007). The permutation results indicate that some underlying trend beyond disease effects (which is negated by the permutations) must be creating the special connectivity of DE genes.
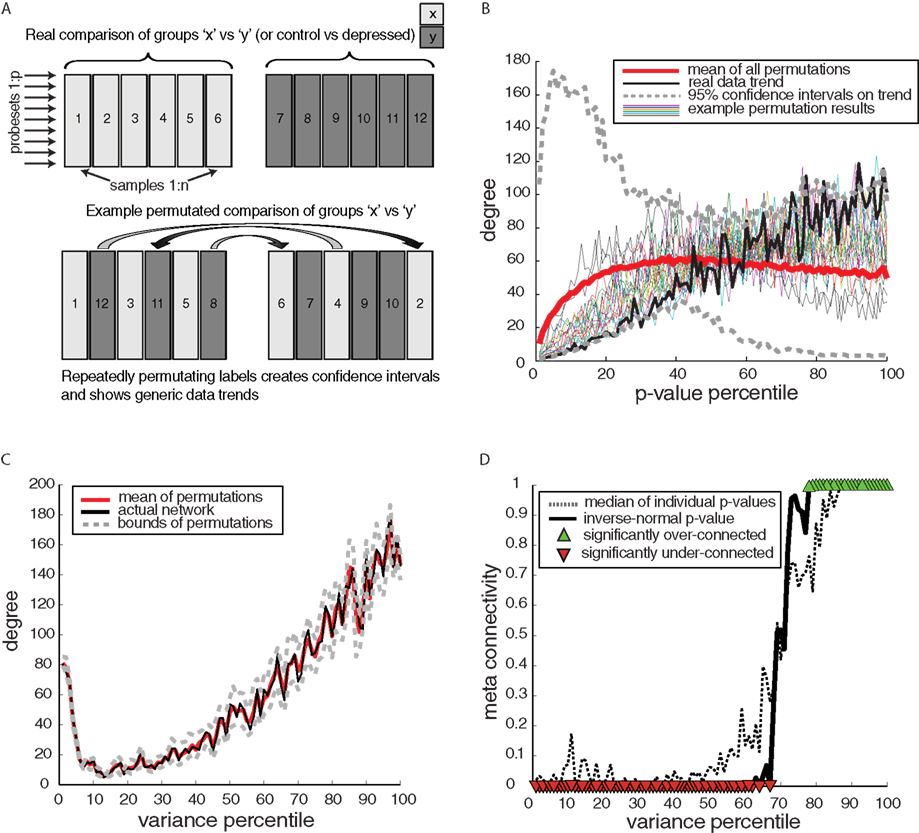
Figure 5. Disease specificity of differentially expressed (DE) gene connectivity patterns – example from human amygdala. (A) Schematic of method of data permutation to generate null comparisons, which contain no disease effect since control/disease samples are balanced. (B) Stereotypical and actual trends in connectivity by p-value, showing that the p-value-connectivity trend for DE genes is a generic trend of all comparisons, because the permutation bounds encompass the real comparison and because the mean permutation trend is similar to the actual trend. (C) Variability (transcript expression variance) plotted compared to degree – example from amygdala dataset (D) Meta-analysis of variability–connectivity relationship including all datasets.
Baseline Expression Variability Contributes to the Differential Expression to Connectivity Relationship
What could account for this generic relationship of DE genes to network connectivity (red line in Figure 5B)? A meta-analysis comparing baseline variance in transcript level to connectivity shows a strong relationship across all datasets (Figures 5C,D), where hubs show large swings in transcript level (high-variance), with a mean/median correlation of 0.85/0.86 between variability and connectivity across all datasets. Since hubs show more variable expression levels, this presents a simple explanation for the low connectivity of low p-value DE genes since low-variance genes are less connected and, low p-values tend to be generated by low-variance genes, therefore low p-values are associated with low connectivity. Any split of the data (permutation testing) will show this association of low p-values for differential expression with low connectivity, since transcript variance is unaffected by permutation. Note that transcript variability is factored out in the generation of Pearson correlations used here. So while this connectivity–variability trend exists, it is not circular, but appears to be a natural characteristic of gene networks. Thus, the special connectivity properties of disease genes appear fueled by the broader trend of connectivity increasing with variability. Hence taking into consideration the context of variability/connectivity with transcriptional programs may lead to uncovering putative disease genes that are closer to the core neuropathology.
Discussion
Resilience of Small-world Brain-related Gene Network Structure to Neuropsychiatric Diseases
When genetic variants and environmental influences combine to create disease pathology, they utilize and interact with cellular and molecular networks. We showed here that the coexpression networks of brain regions implicated in depression and other neuropsychiatric disorders display small-world and scale-free characteristics. These networks architectures are efficient (low path-length) and well-organized (highly clustered) frameworks for transcriptional activation. This efficiency comes with a specific weakness – vulnerability to attacks on hub nodes (Albert et al., 2000), as demonstrated by disease operation in other large-scale networks (Micheloyannis et al., 2006; Srinivas et al., 2007; Stam et al., 2007; Smit et al., 2008; Van Nas et al., 2009; Guye et al., 2010). Therefore, we speculated that the connectivity of disease-affected genes could offer a window into pathological mechanisms in neuropsychiatric disorders. However, we found that the small-world connectivity characteristics of coexpression networks are resilient to the effects of depression (and of other neuropsychiatric diseases), and that the related pathology is not mediated by network disintegration via attack on hub nodes.
Two related studies (Lu et al., 2007; Torkamani et al., 2010) also observed a broad similarity in the structure of control and schizophrenia gene networks or control and asthma-related networks, indicating that coexpression structure may be unaffected, or only slightly affected in complex disorders. While complete network reconfiguration and targeted destruction of hub connections appears to be rare in post-mortem brain networks, it may be more evident in smaller more dedicated local networks that operate on a short time-scale, such as those devoted to metabolism or immune function (Reverter et al., 2006; Leonardson et al., 2010). The lack of hub targeting does not preclude existence of differential connectivity shown by more involved methods or if larger samples become available.
As an alternative mechanism of network-pathology interaction, we tested if DE genes had a characteristic connectivity level within these resilient gene networks. We show that DE genes in neuropsychiatric disorders tend to have very low connectivity and fall on the edges of the network. This second form of network resilience to disease (i.e., differential expression of provincial nodes, but not central hubs) is the opposite of the standard pathological mechanisms in small-world networks, but potentially consistent with the broad range of affected systems in neuropsychiatric disorders. The low connectivity of DE genes is observed across various brain regions, species, neuropsychiatric diseases and array platforms. Such a diffuse disease signature may be characteristic of complex disorders (Lu et al., 2007), but this is unclear since previous studies did not include permutation testing for significance or exploration of the relevance of expression variance. These findings are schematized in Figure 6, which shows the relationship between network structure and DE genes.
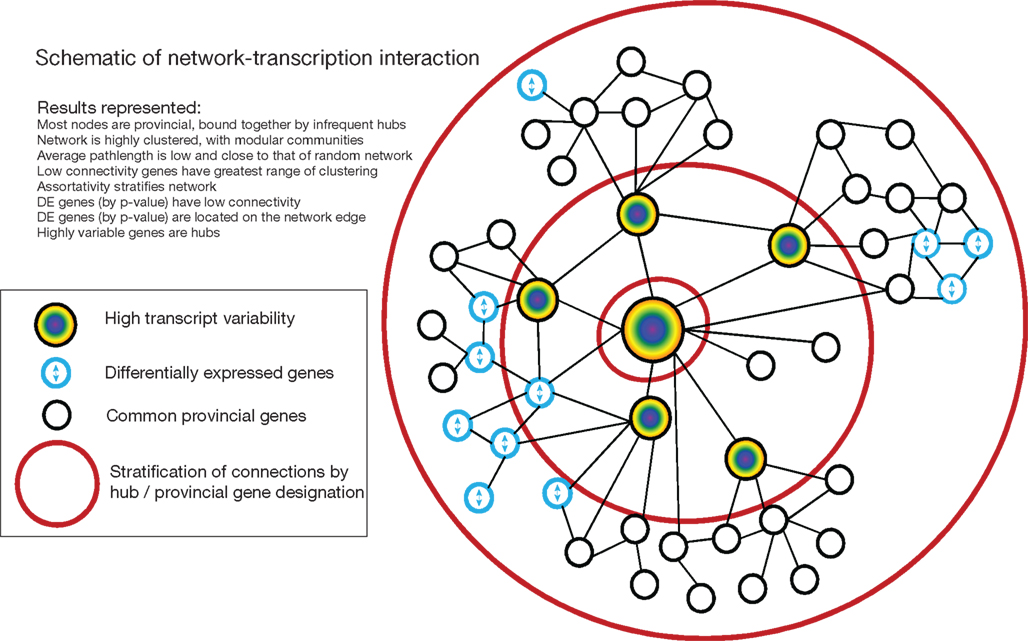
Figure 6. Schematic of relationship between network structure and differential expression incorporating all results.
Why do Differentially Expressed Genes have Low Connectivity?
Since we show that DE genes in neuropsychiatric disorders have low connectivity, it is natural to ask what biological and statistical relationships could generate this situation, and how can this knowledge improve selection of disease-associated genes in a network setting? We show that a strong variability–connectivity relationship (Figure 5) creates a situation where DE genes are generically low-connected. Several biological rationales may explain why DE genes are located on the edge of networks. It could be that DE genes follow generic patterns of variation (Figure 5B) due to high FDRs associated with microarray studies. Alternately, if control/disease comparisons accurately identify disease-related genes, they may indeed ride on top of normal patterns of variability, since individual genes have small pro-disease effects in complex diseases. To determine if the low connectivity of DE genes is specific to complex diseases, a useful future experiment would be to calculate the connectivity of DE genes from microarray datasets of disorders with more severe biological disturbances.
Inferring Mechanisms of Pathology from Differentially Expressed Gene Connectivity
Regardless of why DE genes are located on the edge of networks, how does this knowledge influence our conceptualization of disease effects on cellular networks? The decentralized nature of DE genes in coexpression networks (Figure 6) may contribute to the illusive nature of depression pathology and the high failure rate of putative antidepressant drugs – which may essentially attempt to influence a vast network from the edge (if directly targeting DE genes). These results are consistent with the multifactorial nature of major depression, bipolar depression, and schizophrenia, and, from a coexpression perspective, suggest that modulators of single DE genes will have limited therapeutic effect. It may be discouraging that the disease signal follows generic patterns of network fluctuation, but by understanding patterns of molecular interactions, it may be possible to more effectively track and dismantle disease processes.
Limitations
A common concern in microarray analysis is that varying standards for post-mortem parameters or array platform could induce technical artifacts. However, we designed this analysis to prevent exactly such effects by including data from multiple brain banks, array platforms, diseases, and species. Not only are the meta-analysis results significant, but the connectivity–variability relationship was evident categorically in each dataset. Samples sizes for individual studies in psychiatry are relatively small, and sample size does affect ability to detect significant correlations. However we used permutation testing to ensure that likelihood of including false-positive links in any network was under 1%. Furthermore, we included nearly every microarray large publicly available study of depression, so our analysis is accurate to the current resolution of transcriptional research. Our investigation does not produce a specific list of genes considered implicated in depression, but our purpose was rather to highlight general properties of coexpression networks that have relevance to future gene selection criteria in neuropsychiatric disorders.
Moving Forward with Gene Networks Analysis in Light of the Position of De Genes
The distinctive lack of centrality of DE genes has both technical limitations and implications for investigating mechanisms of diseases. First, it highlights a long-standing challenge in complex diseases: detecting biologically cohesive sets of genes that create a cumulative disease effect. We propose that coexpression links, which encapsulate many cellular relationships, can reveal collective dysfunction. For instance, coexpression links indicated that genes associated with depression in a cross-species analysis of depression were tightly bound together in glial and neuronal-growth related communities (Sibille et al., 2009). Specific modules of coexpressed genes may emerge to support specific biological functions, as exemplified by the identification of a neurogenesis-related gene module in hippocampus (Oldham et al., 2008), or by identifying specific modulators by searching for transcription factors linking DE genes, and that are themselves dysregulated (Hudson et al., 2009). But until we understand how disease or environmental influences percolate through the structure of coexpression networks, it is difficult to define consistent strategies to predict which genes are critical mediators of disease. Second, it should be noted that our study was focused on detecting statistical effects that have relevance to disease, but sample-size limitations curtail region-specific analyses, or the investigation of particular demographic (e.g., female-only) or clinical correlates (e.g., antidepressant effects, death-by-suicide, disease severity) and their impact on gene network structure. Third, understanding how the structure of gene coexpression networks will respond to known perturbations could inform efforts to trace disease-related network changes back to unknown deficits. However time-series microarrays from inducible knockout systems for instance, or tightly controlled human populations are extremely rare (Leonardson et al., 2010). Finally, the transcriptome networks described here are one of many cellular interaction networks, which themselves intersect at multiple contact points through feedback loops that can cloud causal relationships (De La Fuente, 2010). Combining information from different types of biological networks would more accurately reflect the “true” connectivity of genes sets associated with complex disease (Wachi et al., 2005), and hopefully further define the structure of pathology (Sharan and Ideker, 2006).
Conflict of Interest Statement
The authors declare that the research was conducted in the absence of any commercial or financial relationships that could be construed as a potential conflict of interest.
Acknowledgments
Supported by NIMH grants MH084060 and MH077159 (Etienne Sibille) and by a fellowship from the University of Pittsburgh Clinical and Translational Science (Chris Gaiteri).
References
Albert, R., Jeong, H., and Barabasi, A.-L. (2000). Error and attack tolerance of complex networks. Nature 406, 378–382.
Allocco, D. J., Kohane, I. S., and Butte, A. J. (2004). Quantifying the relationship between co-expression, co-regulation and gene function. BMC Bioinformatics 5, 18.
Aston, C., Jiang, L., and Sokolov, B. P. (2005). Transcriptional profiling reveals evidence for signaling and oligodendroglial abnormalities in the temporal cortex from patients with major depressive disorder. Mol. Psychiatry 10, 309–322.
Barrenas, F., Chavali, S., Holme, P., Mobini, R., and Benson, M. (2009). Network properties of complex human disease genes identified through genome-wide association studies. PLoS ONE 4, e8090.
Benjamini, Y., and Hochberg, Y. (1995). Controlling the false discovery rate: a practical and powerful approach to multiple testing. J. R. Stat. Soc. Series B Stat. Methodol. 57, 289–300.
Bergmann, S., Ihmels, J., and Barkai, N. (2004). Similarities and differences in genome-wide expression data of six organisms. PLoS Biol. 2, E9.
Borate, B. R., Chesler, E. J., Langston, M. A., Saxton, A. M., and Voy, B. H. (2009). Comparison of threshold selection methods for microarray gene co-expression matrices. BMC Res. Notes 2, 240.
Bullmore, E., and Sporns, O. (2009). Complex brain networks: graph theoretical analysis of structural and functional systems. Nat. Rev. Neurosci. 10, 186–198.
Carlson, M. R. J., Zhang, B., Fang, Z., Mischel, P. S., Horvath, S., and Nelson, S. F. (2006). Gene connectivity, function, and sequence conservation: predictions from modular yeast co-expression networks. BMC Genomics 7, 40.
Choi, J. K., Yu, U., Yoo, O. J., and Kim, S. (2005). Differential coexpression analysis using microarray data and its application to human cancer. Bioinformatics 21, 4348–4355.
De La Fuente, A. (2010). From ‘differential expression’ to ‘differential networking’ – identification of dysfunctional regulatory networks in diseases. Trends Genet. 26, 326–333.
Feldman, I., Rzhetsky, A., and Vitkup, D. (2008). Network properties of genes harboring inherited disease mutations. Proc. Natl. Acad. Sci. U.S.A. 105, 4323–4328.
Gaiteri, C., Guilloux, J.-P., Lewis, D. A., and Sibille, E. (2010). Altered gene synchrony suggests a combined hormone-mediated dysregulated state in major depression. PLoS ONE 5, e9970.
Goh, K.-I., Cusick, M. E., Valle, D., Childs, B., Vidal, M., and Barabási, A.-L. (2007). The human disease network. Proc. Natl. Acad. Sci. U.S.A. 104, 8685–8690.
Guilloux, J. -P., Douillard-Guilloux, G., Kota, R., Wang, X., Gardier, A., Martinowich, K., Tseng, G. C., Lewis, D. A., and Sibille, E. (2011). Molecular evidence for BDNF- and GABArelated dysfunctions in the amygdala of female subjects with Major Depression. [Submitted].
Guye, M., Bettus, G., Bartolomei, F., and Cozzone, P. J. (2010). Graph theoretical analysis of structural and functional connectivity MRI in normal and pathological brain networks. MAGMA 23, 409–421.
He, X., and Zhang, J. (2006). Why do hubs tend to be essential in protein networks? PLoS Genet. 2, e88.
Higgs, B. W., Elashoff, M., Richman, S., and Barci, B. (2006). An online database for brain disease research. BMC Genomics 7, 70.
Hudson, N. J., Reverter, A., and Dalrymple, B. P. (2009). A differential wiring analysis of expression data correctly identifies the gene containing the causal mutation. PLoS Comput. Biol. 5, e1000382.
Iwamoto, K., Kakiuchi, C., Bundo, M., Ikeda, K., and Kato, T. (2004). Molecular characterization of bipolar disorder by comparing gene expression profiles of postmortem brains of major mental disorders. Mol. Psychiatry 9, 406–416.
Iwamoto, K., and Kato, T. (2006). Gene expression profiling in schizophrenia and related mental disorders. Neuroscientist 12, 349–361.
Jeong, H., Mason, S. P., Barabási, A. L., and Oltvai, Z. N. (2001). Lethality and centrality in protein networks. Nature 411, 41–42.
Jordan, I. K., Mariño-Ramírez, L., Wolf, Y. I., and Koonin, E. V. (2004). Conservation and coevolution in the scale-free human gene coexpression network. Mol. Biol. Evol. 21, 2058–2070.
Lee, H. K., Hsu, A. K., Sajdak, J., Qin, J., and Pavlidis, P. (2004). Coexpression analysis of human genes across many microarray data sets. Genome Res. 14, 1085–1094.
Leonardson, A. S., Zhu, J., Chen, Y., Wang, K., Lamb, J. R., Reitman, M., Emilsson, V., and Schadt, E. E. (2010). The effect of food intake on gene expression in human peripheral blood. Hum. Mol. Genet. 19, 159–169.
Lu, X., Jain, V. V., Finn, P. W., and Perkins, D. L. (2007). Hubs in biological interaction networks exhibit low changes in expression in experimental asthma. Mol. Syst. Biol. 3, 98.
Marco, A., Konikoff, C., Karr, T. L., and Kumar, S. (2009). Relationship between gene co-expression and sharing of transcription factor binding sites in Drosophila melanogaster. Bioinformatics 25, 2473–2477.
Mehta, D., Menke, A., and Binder, E. B. (2010). Gene expression studies in major depression. Curr. Psychiatry Rep. 12, 135–144.
Micheloyannis, S., Pachou, E., Stam, C. J., Breakspear, M., Bitsios, P., Vourkas, M., Erimaki, S., and Zervakis, M. (2006). Small-world networks and disturbed functional connectivity in schizophrenia. Schizophr. Res. 87, 60–66.
Newman, M. E. J. (2003). Mixing patterns in networks. Phys. Rev. E. Stat. Nonlin. Soft Matter Phys. 67, 026126.
Oldham, M. C., Konopka, G., Iwamoto, K., Langfelder, P., Kato, T., Horvath, S., and Geschwind, D. H. (2008). Functional organization of the transcriptome in human brain. Nat. Neurosci. 11, 1271–1282.
Perkins, A. D., and Langston, M. A. (2009). Threshold selection in gene co-expression networks using spectral graph theory techniques. BMC Bioinformatics 10(Suppl. 11), :S4.
Purmann, A., Toedling, J., Schueler, M., Carninci, P., Lehrach, H., Hayashizaki, Y., Huber, W., and Sperling, S. (2007). Genomic organization of transcriptomes in mammals: coregulation and cofunctionality. Genomics 89, 580–587.
Reverter, A., Ingham, A., Lehnert, S. A., Tan, S.-H., Wang, Y., Ratnakumar, A., and Dalrymple, B. P. (2006). Simultaneous identification of differential gene expression and connectivity in inflammation, adipogenesis and cancer. Bioinformatics 22, 2396–2404.
Sharan, R., and Ideker, T. (2006). Modeling cellular machinery through biological network comparison. Nat. Biotechnol. 24, 427–433.
Sibille, E., Arango, V., Galfalvy, H. C., Pavlidis, P., Erraji-Benchekroun, L., Ellis, S. P., and Mann, J. J. (2004). Gene expression profiling of depression and suicide in human prefrontal cortex. Neuropsychopharmacology 29, 351–361.
Sibille, E., Wang, Y., Joeyen-Waldorf, J., Gaiteri, C., Surget, A., Oh, S., Belzung, C., Tseng, G. C., and Lewis, D. A. (2009). A molecular signature of depression in the amygdala. Am. J. Psychiatry 166, 1011–1024.
Smit, D. J. A., Stam, C. J., Posthuma, D., Boomsma, D. I., and De Geus, E. J. C. (2008). Heritability of “small-world” networks in the brain: a graph theoretical analysis of resting-state EEG functional connectivity. Hum. Brain Mapp. 29, 1368–1378.
Srinivas, K. V., Jain, R., Saurav, S., and Sikdar, S. K. (2007). Small-world network topology of hippocampal neuronal network is lost, in an in vitro glutamate injury model of epilepsy. Eur. J. Neurosci. 25, 3276–3286.
Stam, C. J., Jones, B. F., Nolte, G., Breakspear, M., and Scheltens, P. (2007). Small-world networks and functional connectivity in Alzheimer’s disease. Cereb. Cortex 17, 92–99.
Surget, A., Wang, Y., Leman, S., Ibarguen-Vargas, Y., Edgar, N., Griebel, G., Belzung, C., and Sibille, E. (2009). Corticolimbic transcriptome changes are state-dependent and region-specific in a rodent model of depression and of antidepressant reversal. Neuropsychopharmacology 34, 1363–1380.
Torkamani, A., Dean, B., Schork, N. J., and Thomas, E. A. (2010). Coexpression network analysis of neural tissue reveals perturbations in developmental processes in schizophrenia. Genome Res. 20, 403–412.
Torrey, E. F., Webster, M., Knable, M., Johnston, N., and Yolken, R. H. (2000). The stanley foundation brain collection and neuropathology consortium. Schizophr. Res. 44, 151–155.
Tsaparas, P., Mariño-Ramírez, L., Bodenreider, O., Koonin, E. V., and Jordan, I. K. (2006). Global similarity and local divergence in human and mouse gene co-expression networks. BMC Evol. Biol. 6, 70.
Van Nas, A., Guhathakurta, D., Wang, S. S., Yehya, N., Horvath, S., Zhang, B., Ingram-Drake, L., Chaudhuri, G., Schadt, E. E., Drake, T. A., Arnold, A. P., and Lusis, A. J. (2009). Elucidating the role of gonadal hormones in sexually dimorphic gene coexpression networks. Endocrinology 150, 1235–1249.
Van Noort, V., Snel, B., and Huynen, M. A. (2004). The yeast coexpression network has a small-world, scale-free architecture and can be explained by a simple model. EMBO Rep. 5, 280–284.
Wachi, S., Yoneda, K., and Wu, R. (2005). Interactome-transcriptome analysis reveals the high centrality of genes differentially expressed in lung cancer tissues. Bioinformatics 21, 4205–4208.
Yanashima, R., Kitagawa, N., Matsubara, Y., Weatheritt, R., Oka, K., Kikuchi, S., Tomita, M., and Ishizaki, S. (2009). Network features and pathway analyses of a signal transduction cascade. Front. Neuroinform. 3:13.
Keywords: major depression, small-world, scale-free, coexpression, microarray, psychiatry, human post-mortem, graph theory
Citation: Gaiteri C and Sibille E (2011) Differentially expressed genes in major depression reside on the periphery of resilient gene coexpression networks. Front. Neurosci. 5:95. doi: 10.3389/fnins.2011.00095
Received: 11 May 2011; Accepted: 15 July 2011;
Published online: 30 August 2011.
Edited by:
Radhakrishnan Nagarajan, University of Arkansas for Medical Sciences, USAReviewed by:
Radhakrishnan Nagarajan, University of Arkansas for Medical Sciences, USANidhal Bouaynaya, University of Arkansas at Little Rock, USA
Preetam Ghosh, Virginia Commonwealth University, USA
Copyright: © 2011 Gaiteri and Sibille. This is an open-access article subject to a non-exclusive license between the authors and Frontiers Media SA, which permits use, distribution and reproduction in other forums, provided the original authors and source are credited and other Frontiers conditions are complied with.
*Correspondence: Etienne Sibille, Department of Psychiatry, Center for Neuroscience, 3811 O’Hara Street, University of Pittsburgh, Pittsburgh, PA 15213, USA. e-mail:c2liaWxsZWVsQHVwbWMuZWR1