 Xiangfei Geng1†
 Junhai Xu
- 1Tianjin Key Laboratory of Cognitive Computing and Application, School of Computer Science and Technology, Tianjin University, Tianjin, China
- 2Laboratory of Neural Imaging, Keck School of Medicine, USC Stevens Neuroimaging and Informatics Institute, University of Southern California, Los Angeles, CA, United States
- 3State Key Laboratory of Intelligent Technology and Systems, National Laboratory for Information Science and Technology, Tsinghua University, Beijing, China
Major depressive disorder (MDD) is a mental disorder characterized by at least 2 weeks of low mood, which is present across most situations. Diagnosis of MDD using rest-state functional magnetic resonance imaging (fMRI) data faces many challenges due to the high dimensionality, small samples, noisy and individual variability. To our best knowledge, no studies aim at classification with effective connectivity and functional connectivity measures between MDD patients and healthy controls. In this study, we performed a data-driving classification analysis using the whole brain connectivity measures which included the functional connectivity from two brain templates and effective connectivity measures created by the default mode network (DMN), dorsal attention network (DAN), frontal-parietal network (FPN), and silence network (SN). Effective connectivity measures were extracted using spectral Dynamic Causal Modeling (spDCM) and transformed into a vectorial feature space. Linear Support Vector Machine (linear SVM), non-linear SVM, k-Nearest Neighbor (KNN), and Logistic Regression (LR) were used as the classifiers to identify the differences between MDD patients and healthy controls. Our results showed that the highest accuracy achieved 91.67% (p < 0.0001) when using 19 effective connections and 89.36% when using 6,650 functional connections. The functional connections with high discriminative power were mainly located within or across the whole brain resting-state networks while the discriminative effective connections located in several specific regions, such as posterior cingulate cortex (PCC), ventromedial prefrontal cortex (vmPFC), dorsal cingulate cortex (dACC), and inferior parietal lobes (IPL). To further compare the discriminative power of functional connections and effective connections, a classification analysis only using the functional connections from those four networks was conducted and the highest accuracy achieved 78.33% (p < 0.0001). Our study demonstrated that the effective connectivity measures might play a more important role than functional connectivity in exploring the alterations between patients and health controls and afford a better mechanistic interpretability. Moreover, our results showed a diagnostic potential of the effective connectivity for the diagnosis of MDD patients with high accuracies allowing for earlier prevention or intervention.
Introduction
Major Depressive Disorder (MDD) is a mental disorder characterized by at least 2 weeks of low mood that is presented across most situations (Belmaker and Agam, 2008). The cause of MDD is complicated which includes psychological, environmental and genetic factors. The diagnosis of MDD is based on person's mental status examinations and experiences and the most widely used criteria are the Diagnostic and Statistical Manual of Mental Disorders (DSM-IV-TR) (American Psychiatric Association, 2000), World Health Organization's International Statistical Classification of Diseases and Related Health Problems (ICD-10) (World Health Organization, 1992). Those methods base on self-reported symptoms are easily impacted by human factors, which restricted the diagnosis and treatment of MDD in advance (Singh et al., 2010; Oyebode, 2013; Bordini et al., 2017). Undoubtedly, it is important to explore a more efficient and not based on self-reported symptoms method for MDD diagnosis.
In recent years, structure abnormalities in MDD have been reported at a group level in many studies (Kempton et al., 2011; Schmaal et al., 2017). Some specific brain regions in MDD patients, such as part of frontal regions, anterior cingulate, orbitofrontal cortex, hippocampus putamen, and caudate nucleus show different degree of volume reduction compared to HC (Lorenzetti et al., 2009; Zhao et al., 2017). The machine learning method especially multivariate pattern analysis (MVPA) has been used to explore structural and functional differences between MDD and healthy controls (HC), suggesting a promising direction on exploring an efficient diagnosis method for MDD based on neuroimaging data. MVPA is a widely used approach in task-related functional magnetic resonance imaging (fMRI) studies, which treats many consecutive voxels as a pattern and can improve the sensibility for imperceptible changes in brain activities (Weil and Rees, 2010). Based on those structure abnormalities between MDD patients and HC, many classification approaches based on MVPA are developed to examine whether those abnormalities can be treated as an objective biomarker for MDD diagnosis. With a support vector machine (SVM) and relevance vector machine (RVM) classifier, MDD patients were distinguished from HC with a 90% accuracy based on T1-weighted “structural” scans (Mwangi et al., 2012). A single SVM classifier was also used in a multi-ethnic structural neuroimaging data classification task and the best performance reached 78.3% (Sankar et al., 2016), which showed that the structure abnormalities cross the multi-ethnic group had a similarity pattern and machine learning methods can learn the pattern to afford classification abilities. The studies in structural neuroimaging data provide an important step for developing a potential efficient diagnosis method of MDD. However, there are some limitations when only structural neuroimaging data are used for MDD diagnosis. The main limitation is that there is a slow change in the structural abnormalities in MDD and only after a long period of time the structural abnormalities will become significant (Lorenzetti et al., 2009), which leads to lack of sensitivity for MDD diagnosis.
Except for structural neuroimaging data, functional neuroimaging data have attracted more and more attention in investigating the pathophysiology of MDD, as we can obtain the active brain status from the functional images. Our human brain is considered as an integrated network, which consists of anatomically separated but functionally linked brain regions (van den Heuvel and Hulshoff Pol, 2010). Many studies using the fMRI technique reveal that the pathophysiology of MDD involves a large-scale dysfunction in functional brain networks (Kaiser et al., 2015; Lv et al., 2016; Williams, 2017; Whitton et al., 2018). The functional connectivity (FC) is used as a most common measure for exploring the functional brain networks. FC, which represents the correlation between the time series of anatomically separated brain regions, has been used to investigate the dysfunctions in many mental disorder diseases, such as social anxiety disorder (Liao et al., 2010), depression disorder (Dørum et al., 2017). MDD patients showed decreased FC alterations in the bilateral amygdala, left anterior insula, left frontal pole, bilateral lingual gyrus comparing to HC (Veer et al., 2010). The resting-state networks distinctly at rest have been confirmed in many studies (Betzel et al., 2014; Nashiro et al., 2017), which mainly include the default mode network (DMN), visual network (VN), sensorimotor network (SMN), attention network (AN), salience network (SN) and fronto-parietal network (FPN) (van den Heuvel and Hulshoff Pol, 2010; Rosazza and Minati, 2011). DMN activates “by default” when a person is not involved in a specific task and deactivates during specific tasks, such as a cognitive task and attention task, which commonly consists of the medial prefrontal cortex (mPFC), bilateral inferior parietal lobule (LP) and posterior cingulate cortex (PCC) (Raichle, 2015). Besides, the altered dynamics functional brain networks in MDD patients have been reported in the dorsal attention network (DAN), FPN, and SN (Sambataro et al., 2017). SN consisting of the anterior cingulate cortex (ACC) and bilateral rostrolateral prefrontal cortex (RPFC), shows a significant increased power of the low frequency oscillations (LFO) during the task performance in MDD patients (Zhang et al., 2014). DAN, including the bilateral frontal eye field (FEF) and intraparietal sulcus (IPS), shows an altered amplitude of Low frequency oscillation (LFO) and reduced FC, revealing that the orienting attention dysfunction in DAN may be a possible pathophysiology of MDD (Corbetta et al., 2008). FPN, also referred to the executive network, is consisted of the bilateral prefrontal cortex (LPFC) and posterior parietal cortex (PPC) (Kaas et al., 2017; Ray et al., 2017). Ineffective transmission of information between prefrontal and parietal regions may be a main reason for MDD (Brzezicka, 2013). Many studies have found significantly altered connections in other resting-state network such as SMN and VN in MDD patients (Yao et al., 2009; Veer et al., 2010; Wei et al., 2015; Sambataro et al., 2017). Abnormal FC in MDD patients in the resting-state networks has been used as a biomarker for MDD diagnosis (Dørum et al., 2017). Using FC from 15 regions of interest (ROI) as features and SVM as a trained classifier for identifying MDD patients from HC, the accuracy achieved 83.3%, suggesting that resting-state FC can be used as a biomarker for MDD diagnosis (Craddock et al., 2009). Further more, different neurophysiological subtypes of depression were successfully distinguished only using FC in a MRI study (Drysdale et al., 2017), indicating the strong discriminative power of FC.
Although FC has a good performance in exploring the abnormalities of functional brain networks, it is not an efficient approach when we want to further understand the mechanism under the observed abnormalities, since FC simply represents the correlation between two brain regions. Effective connectivity (EC) is a more complex and efficient measure to examine the dynamic changes, which describes the causal influences that neural units exert over another (Friston, 1994). Using EC during an emotion-relevant task, the adolescents with MDD shows a significantly different connection from the amygdala to subgenual ACC (Schlösser et al., 2008). EC among several resting-state networks (such as DMN, AN, and FPN) altered significantly comparing to HC, which reveals that EC may be used as a biomarker for MDD diagnosis. Spectral Dynamic Causal Modeling (spDCM) is a model-based method to estimate the EC of the brain. It uses a plausible power-law model of the coupled dynamics of neuronal populations to generate the complex cross spectra among measured responses. It is similar to the conventional deterministic DCM for fMRI but models endogenous activities that would reproduce the functional connectivity observed in resting state fMRI (Friston et al., 2014).
FC has achieved good performances in exploring the abnormalities between patients and HC, which shows the potential as a biomarker in disease diagnosis in many studies (Craddock et al., 2009; Zeng et al., 2012). However, any hypothesis about coupling differences in brain cannot be valid throw FC. EC can reflect how the brain works by measuring the coupling among hidden brain states, it tries to explain observed dependencies, such as FC (Friston, 2011). It remain unknown whether EC can be used as an efficient and without self-reported symptoms biomarker for MDD diagnosis. In this study, we will explore the relationship and difference between FC and EC by using FC and EC as features to train a classifier for MDD diagnosis. Firstly, FC was extracted from a whole brain FC analysis, while spectral DCM was used to analysis the EC and the most important four testing-state networks (DMN, DAN, FPN and SN) for MDD were used to define the specific ROIs in this spectral DCM analysis. Linear SVM, non-linear SVM, k-nearest neighbors (KNN) and logistic regression (LR) classifiers were used to identify MDD patients from HC using the FC features and EC features separately. Based on the classification results and weight factor in classifiers, abnormal FC and EC in MDD patients will be discussed.
Materials and Methods
Participants
Twenty four patients with MDD (16 females and 8 males, average age: 51.2 ± 10.6 years old, range 24–65 years old, PHQ is 21.1 ± 5.8, range 7–30, BDI is 32.3 ± 10.8, range 18–54, average time of education is 11.4 ± 3.4) and 24 HC (16 females and 8 males, average age: 47.8 ± 11.0 years old; range 25–65 years old, PHQ is 1.1 ± 1.2, range 0–5, BDI is 2.3 ± 1.4, range 0–5, average time of education is 13.1 ± 5.1) participated in this study. Those patients met criteria for DSM-IV-TR major depressive disorder without comorbidity and had a minimum duration of illness >3 months. All subjects were dominantly right-handed as determined by Edinburgh Handedness Inventory (Oldfield, 1971). Each participant provided written informed consent and the study was conducted in accordance with the local Ethics Committee.
Data Acquisition
Functional and structural images were obtained using 3T Siemens TIM Trio. Foam padding was used to minimize the head movement. One 8-min resting-state scan (240 time points, 36 axial slices, repetition time = 2,000 ms, echo time = 30 ms, voxel size = 3 × 3 × 3.99 mm3) was acquired on each participant for getting functional imaging data. A high-resolution T1-weighted scan (176 sagittal slices, voxel size = 1 × 1 × 1 mm3, repetition time = 20 ms, echo time = 6 ms) was acquired on each participant using T1-weighted sequence with generalized auto calibrating partially parallel acquisition.
Data Preprocessing
All fMRI data was preprocessed by the statistical parametric mapping software package (SPM12, http://www.fil.ion.ucl.ac.uk/spm/software/spm12). The first five volumes of scan data were discarded to allow the magnetization to approach dynamic equilibrium in each participant firstly. Each slice was corrected in slice timing by resampling slices to eliminate the time difference. Subsequently, a realignment analysis was performed with the middle image of the testing sequence as a reference; the data of each participant with a translation exceeding 3 mm and rotation exceeding 3 degree were removed. Individual structural images were linearly coregistered to the mean functional image, and then the transformed structural images were segmented into gray matter (GM), white matter (WM), and cerebrospinal fluid (CSF). Following this, all functional imaging data were normalized to Montreal Neurological Institutes (MNI) space and resampled to 3 × 3 × 3 mm3. Data were detrended and band-pass filtered (0.01 Hz < f < 0.08 Hz) and the sources of spurious variance, such as signals from WM, CSF and movement parameters, which extracted from the realignment process, were removed by a linear regression to remove artifacts and reduce physiological noise in CONN toolbox.
Whole-Brain Functional Connectivity Analysis
A ROI-to-ROI functional connectivity analysis was performed using two whole-brain template separately, including the Automated Anatomical Labeling (AAL) template and Brainnetome template. AAL is a widely used anatomical template, which divides the whole brain into 78 cortical regions, 26 cerebellar regions and 12 subcortical regions according to anatomy (Tzouriomazoyer et al., 2002). The Brainnetome template contains more fine-grained functional brain subregions and gives more detailed anatomical information compared with AAL, because it is generated with both the functional connectivity and anatomical information (Fan et al., 2016). Brainnetome contains 246 subregions of bilateral hemispheres except for Cerebellum. Considering Cerebellum plays an import role in MDD (Lai and Wu, 2014; Guo et al., 2015), Cerebellum regions from the AAL template and Brainnetome were merge into a whole-brain template using the open source software WFU_pickatlas, which results a new template including 272 regions. In the following paper, we means this expanded template when we referred Brainnetome.
The following ROI-to-ROI functional analysis was performed using CONN toolbox (CONN17a, https://www.nitrc.org/projects/conn) in Matlab. The representative time series were first extracted by averaging the times series in each region and then the Pearson's correlation coefficients were calculated in each possible region pairs. A Fisher's r-to-z transform (Rosner, 2010) was applied to transform the correlation coefficients to the z-score space and then normalized to a standard normal distribution (0 mean, unit variance). This analysis generated a 116 × 116 matrix for the AAL template and a 272 × 272 matrix for the Brainnetome template, and the triangular portions of the two matrix were extracted separately and transformed to a vectorial feature space (6670 dimensions for the AAL template; 36,856 dimensions for the Brainnetome template).
Effective Connectivity Analysis in Resting-State Networks
Four resting-state networks (DMN, DAN, FPN, and SN) were used in EC analysis. A seed-to-voxel FC analysis was performed using CONN toolbox to identify the main regions of the four resting-state networks. The seed ROIs, which were generated using a 6-mm radius spheres centered on MNI coordinates, were selected from previous studies (Vincent et al., 2008; Woodward et al., 2011). The seed ROIs were defined as follows: DMN (MPFC: 31 62 25); DAN (IPS_L:−18 29 43); FPN (LPFC: 17 54 35); SN (ACC: 31 50 37). For each seed, the temporal correlations between the seed and all other voxels in the brain were computed for each participant separately. A one-sample t-test statistical analysis was performed to define the coordinates of peak values in the four resting-state networks by masking with preexisting templates (Tsvetanov et al., 2016). Those coordinates were used in the following spDCM analysis.
The spDCM uses a plausible power-law model of the coupled dynamics of neuronal populations to generate the complex cross spectra among measured responses. It is similar to the conventional deterministic DCM for fMRI but models endogenous activities that would reproduce the functional connectivity observed in resting state fMRI (Friston et al., 2014). The spDCM analysis was performed using DCM12 in SPM12. First, volumes of interest (VOIs) for each network were defined as spheres with a radius of 6 mm centered at the MNI coordinates from the seed-to-voxel analysis, and then the first eigenvector was extracted after modeling the GLM that removed effects of the head motion and low-frequency drift. Then, the blood oxygen level-dependent fMRI time series was extracted from those VOIs. Subsequently, the extracted VOIs were used to construct DCM models. Four fully-connected models with bi-directional connections in each pair of VOIs were specified for DMN, DAN, FPN, and SN respectively. Then the optimal models for each resting-state network were obtained by using Bayes model selection (BMS) method. The post hoc function was used to perform the BMS, which adopted a greedy strategy to search over all permutations of the eight parameters whose removal produced the smallest reduction in model evidence when the free parameters equal or more than 16. There are 24 = 16 free parameters for DMN, DAN, and FPN, respectively, and 9 free parameters for SN, which results 28 = 256 DCM models for DMN, DAN, FPN, respectively and 29 = 512 DCM models for SN. Then the model with the greatest model evidence was selected as the optimal model and the coupling parameters for the optimal model were estimated. Model parameters are extracted from four optimal models (each resting-state network has one) and transformed to a vectorial feature space. For an n node model, there are n2 free parameters. So we get 42 × 3 + 32 = 57 dimensions features for each participant, which were used for further classification analyzes.
Feature Selection
Given that there are some uninformative, irrelevant or redundant features, feature reductions can not only speed up the computation, but also improve the classification performance. Therefore, the feature selection step was utilized. First, One-sample t-test was applied to identify the significant connections among all participants and the features with the p-value bigger than 0.05 were removed. Subsequently, a univariate feature selection method (Gibbons and Kendall, 1990) was used to reduce the number of features. In this method, samples were divided into concordant and discordant pairs. Concordant pairs were defined as a pair of two-observation data sets (xmi, ym) and (xni, yn), when they meet the following conditions:
Where the signx is a signum function:
Correspondingly, it is a discordant pair when they meet the following conditions:
We defined the weight of i'th feature as the following formula:
Where there are m patients and n controls and nc, nd represent the number of concordant and discordant pairs, respectively. Finally, we ranked the features according to wi and selected the top k features as the final features set for the subsequent classification analysis. To obtain the optimizing features number (k-value) from numerous features, a rough searching analysis with a step 200 was performed in each classification process firstly to get the best performance interval range of k; then an accurate searching analysis of k with step 10 was performed in this interval range to identify the optimized feature number.
Classification and Evaluation
Four supervised learning classifiers (linear SVM, non-linear SVM, LR, and KNN) were used in the classification stage. This collocation is conducive to compare advantages and disadvantages of the different machine learning methods in fMRI data analysis (Misaki et al., 2010). The supervised learning classification process consists of two steps: training and testing. In the training step, the classifier finds a decision boundary that separates the samples in the input space using their class labels. Once the decision function is determined from the training set, it can be used to predict the class label of a new testing sample.
Training and testing classifiers on the same data could cause the overfitting problem (Dietterich, 1995). In this study, a leave-one-out cross-validation (LOOCV) procedure was used to avoid the over fitting and used as many as possible samples in the training step. In each LOOCV trial for n samples, n-1 samples were used for the training step and the leave-one sample was used for the testing step. The above feature selection process was wrapped in the LOOCV, because of the risk of overfitting. In each training step, the n-1 samples were first used to train the feature selection model and the training data and testing data were transformed to a new reduced feature space using the trained model. Then the training data after the feature selection analysis were used to train a classifier. In the testing step, the leave-one sample was transferred to the trained classifier and the predicted label of this sample was computed through the trained classifier. The accuracy, recall, specificity, f1 and receiver operating characteristic (ROC) curve were used to quantify the performance of a classifier. In this study, we referred the MDD patients as positive samples and HC as negative samples. TP represents the number of positive samples correctly classified; TN represents the number of negative samples correctly classified; FP represents the number of negative samples classified as positive samples; FN represents the number of positive samples classified as negative samples. The accuracy, recall, specificity and precision defined as:
ROC, which is a curve created by plotting the true positive rate against false positive rate, can measure the diagnostic ability of a binary classifier. The area under the curve (AUC) is proportional to the performance of the classifier.
A permutation test was conducted to estimate the statistical significance of the observed classification accuracy. In the permutation test, all of the classification process were similar to the previous analysis except for the samples' label of the training set was randomly permuted. The statistical significance of a classifier was given as:
Where m represents the permutation times, acc(s′)represents the accuracy on randomized permuted dataset and the acc(s) represents the accuracy obtained in normal classification process. In the current work, the m is set to 10,000. The bigger the p-value is, the more likely the accuracy is obtained by chance. The result was thought to be significant if p was <5% (p < 0.05). The whole classification and evaluation process was performed in python using scikit-learn toolkit, and detailed information about those conceptions can be found in the scikit-learn official website (http://scikit-learn.github.io/stable).
Results
Performances of the Classification Analysis
In this study, three classification procedures based on the different templates were performed using four classifiers separately. Figure 1 showed the whole workflow of the three classification procedures. In the following paper, we referred the three classification process as AAL classification, Brainnetome classification and spDCM classification. The linear SVM classifier achieved the best performance among the four classifiers (linear SVM, nonlinear SVM, KNN, and LR) in all three classification tasks while the accuracies of the other classifiers were inconsistent. To further evaluate the performance of the linear SVM classifier in three classification procedures, the recall, specificity, f1, and ROC curve were calculated. The spDCM classification achieved the best performance (accuracy: 91.67%; f1: 91.30%; AUC: 0.98) when 19 effective connection features were used among the three classification tasks. The best performance for the AAL classification was observed when 950 functional connections were chosen as features (accuracy: 87.50%; f1: 87.50%; AUC: 0.91), and 6,650 functional connections as features were included for the Brainnetome classification (accuracy: 89.36%; f1: 90.90%; AUC: 0.92). The Brainnetome classification achieved the highest recall and f1 (recall: 96.15%; f1: 94.44%) among the three tasks, which revealed a good performance for the diseases diagnosis. Permutation tests were performed on all of the classifiers in the three classification procedures and p-values of all classifiers were <0.0001 (p < 0.0001), suggesting that accuracies of all of the classifiers were significantly higher than the chance level (50% of accuracy). The detailed results of the three classification procedures were showed in Figure 2.
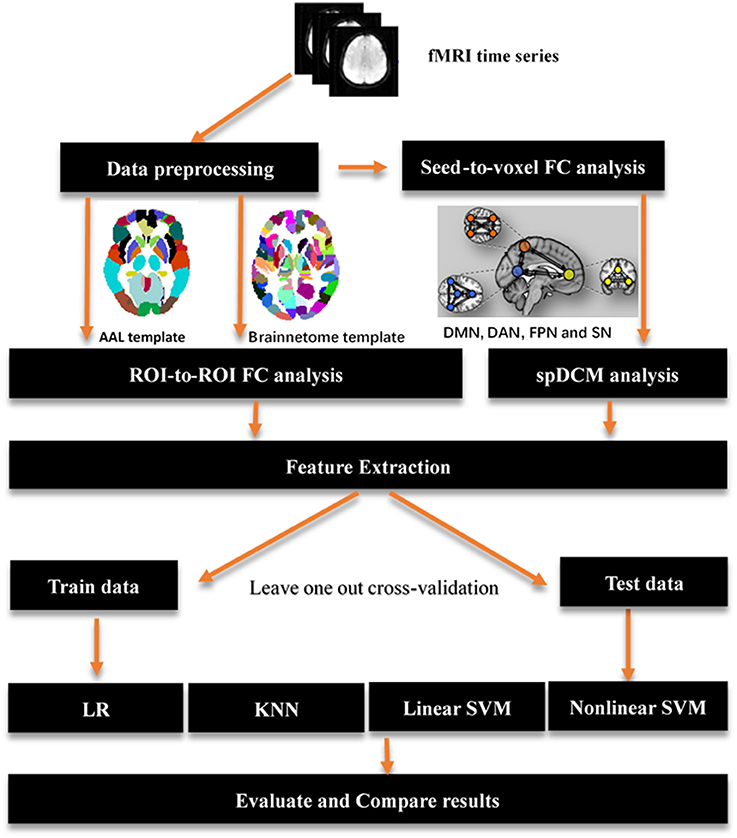
Figure 1. Overview of key processing steps for whole analysis. The origin fMRI time series first was preprocessing using SPM12, then a seed-to-voxel functional connectivity analysis performed on those data to identified main regions location of resting-state networks. Those regions were used to define spectral DCM models and get a best model fitted those data by using Bayes model selection method. AAL template and brainnetome template were used to perform a ROI-to-ROI functional connectivity analysis respectively. A feature extraction process was performed after functional connectivity analysis and spDCM analysis to prepare features for classification in the next step. Four classifiers were used in the classification with a leave one out cross-validation. AAL: Automated Anatomical Labeling; FC: functional connectivity; ROI: region of interest; SVM: support vector machine; LR: logical regression; KNN: k-nearest neighbors; spDCM: spectral Dynamic Causal Modeling; DMN: default mode network; DAN: dorsal attention network; FPN: fronto-parietal network; SN: salience network.
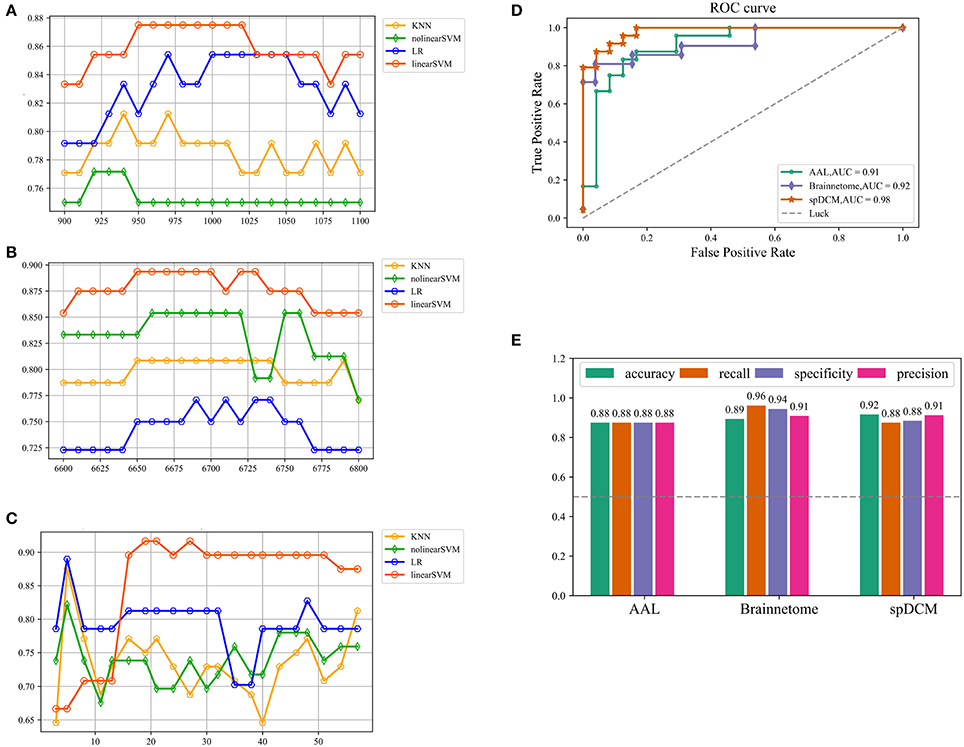
Figure 2. Classification results of three classification tasks. (A,B,C) Represents the research process of the hyper parameter k for AAL classification, Brainnetome classification and spDCM classification, respectively. For AAL classification and Brainnetome classification, the step of search is 10 while the step of search is 3 for spDCM classification considering the number of features and the speed of computation. (D) Represents ROC curve of the linear SVM classifiers in the three classification tasks. The gray dashed represents the chance level of a random classifier. (E) Represents the accuracy, recall, specificity, and f1 of linear SVM classifier in the three classification tasks. SVM: support vector machine; ROC: receiver operating characteristic.
Spectral DCM Analysis of the Resting-State Networks
The MNI coordinates of 15 specific regions for each group (MDD and HC) were obtained after the seed-to-voxel functional connectivity analysis. Based on those coordinates, time series of VOIs were extracted and used to define and estimate the DCM models. Details of those coordinates were listed in Table 1. DMN, DAN, FPN, and SN were used in this study and the first three resting-state networks consisted of four nodes (DMN: MPFC, PCC, LP_L, and LP_R; DAN: FEF_L, FEF_R, IPS_L, and IPS_R; FPN: LPFC_L, LPFC_R, PPC_L, and PPC_R) while SN included three nodes (ACC, RPFC_L, and RPFC_R). After the defined models were estimated, a Bayes model selection procedure was conducted to obtain the best model for each resting-state network. We found that the full connected DCM model achieved the best performance for each resting-state network, which was consistent with previous studies (Tsvetanov et al., 2016; Xu J. et al., 2017). The parameters of the full connected models were estimated and then transformed to a vector feature space, which resulted 42 × 3 + 32 = 57 dimensions of features for each participant. Those features were used in the following spDCM classification.
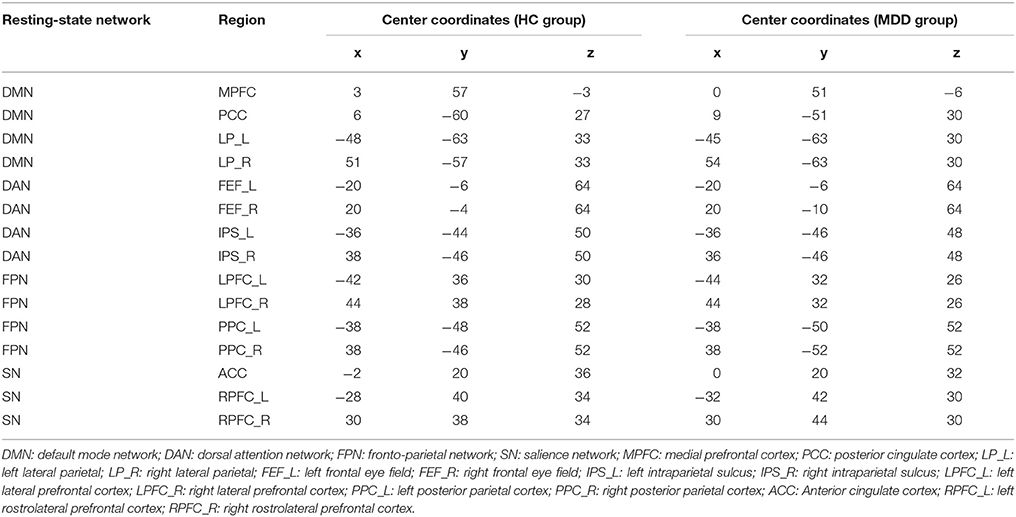
Table 1. Coordinates used in spDCM analysis.
In order to compare the differences of DCM models between MDD patients and HC participants, a Bayes model average approach was adopted to obtain the parameters of four DCM models of four resting-state networks at a group level. Two-sample t-test was performed to identify the significance of the effective connectivity measures in two groups. As shown in Figure 3, there were significant differences in DCM model parameters, in which the intensities of some connections became positive in MDD while they were negative in HC participants. In details, those connections included: the bidirectional connections between MPFC and left LP, and both directions between MPFC and PCC; the connection from right FEF to left IPS and from left IPS to right IPS in DAN; the connections from right LPFC to left LPFC, from left PCC to right LPFC, and from right LPFC to right PCC in FPN; SN included the connections from left RPFC to ACC and that from right RPFC to ACC.
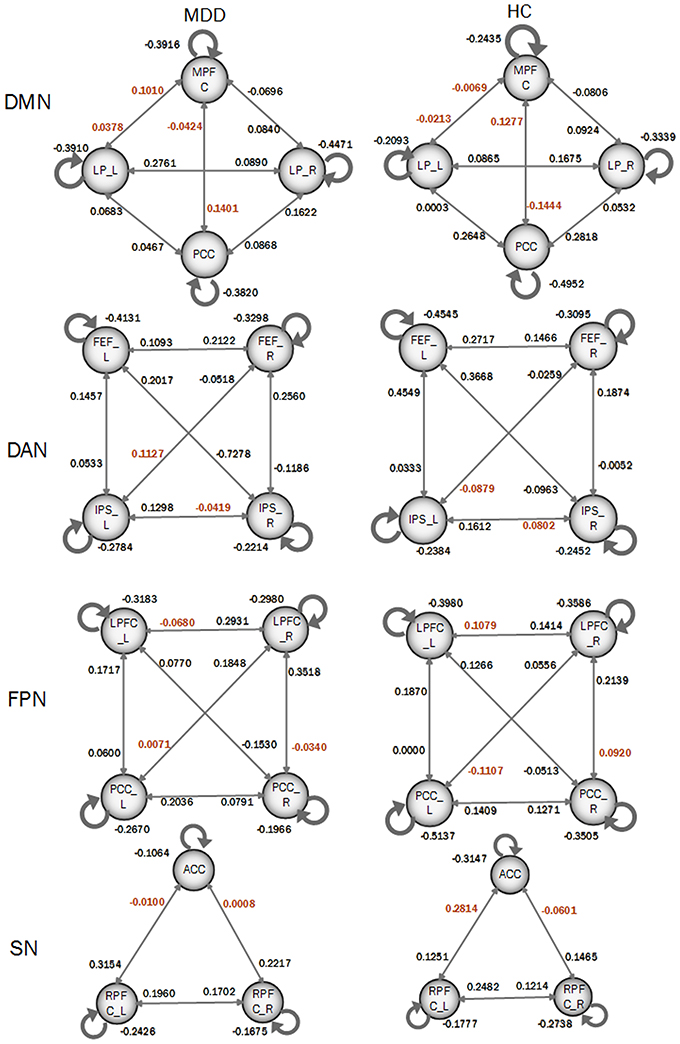
Figure 3. Coupling parameters of four DCM models obtained by bays model average. The connections colored by black paint not significant difference between groups. Connections colored by red paint between groups represents that they are significant difference between groups.
High Discriminative Power of the Functional Connectivity Measures
Consensus features, which were defined as the common selected features in each cross-validation fold, were identified and ranked according to their weights assigned by the linear SVM classifier, which generated 516 consensus features for the AAL classification and 5,596 consensus features for the Brainnetome classification. The region weight was defined as half of the weight of connections in those consensus features and was calculated separately for the AAL classification and Brainnetome classification. Those consensus features from both classification procedures were found to be mainly located in several brain regions, including the hippocampus, inferior parietal lobe, superior medial frontal gyrus, and precuneus in the left hemisphere, right parahippocampal, frontal middle orbital gyrus, superior parietal lobule, medial pre-frontal thalamus, posterior parietal thalamus, and inferior temporal gyrus in the right hemisphere, which belonged to the default model resting-state network; the bilateral superior temporal gyrus and amygdala, left insula, right ventral agranular insula, left angular, which belonged to the affective resting-state network; left calcarine, left lingual, right cuneus, right superior occipital gyrus, which belonged to the visual network, and the cerebellum regions such as left cerebellum 7b, right cerebellum 3, vermis 7, and vermis 8. For a better visualization of the consensus features and regions in the AAL classification and Brainnetome classification, a complex combination of graphs was created and shown in Figure 4 for AAL classification and in Figure 5 for Brainnetome classification. Colored lines in the two figures represent those consensus features while its color and thickness proportional to its weight assigned by the linear SVM classifier. Blocks in the edge of the circle represent the weight assigned by the linear SVM classifier.
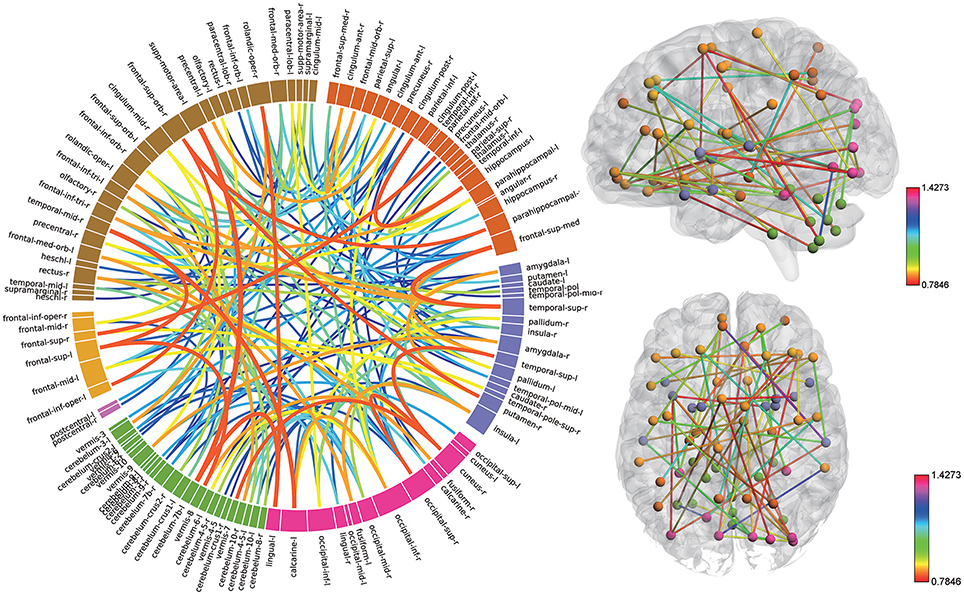
Figure 4. The ranking of regions weight and feature weight from classifiers of whole functional connectivity analysis using AAL template. In the left panel, the box in the ring represents brain regions and line connect two boxes represents functional connectivity of the two brain regions. Box size represents the size of the weight of brain regions. Color and z-depth of the line represents the size of the weight. In the right panel, small ball represents brain regions whose different colors means they belongs to different resting-state networks. Lines connect two small ball represents functional connectivity of two brain regions and its color represents the size of its weight.
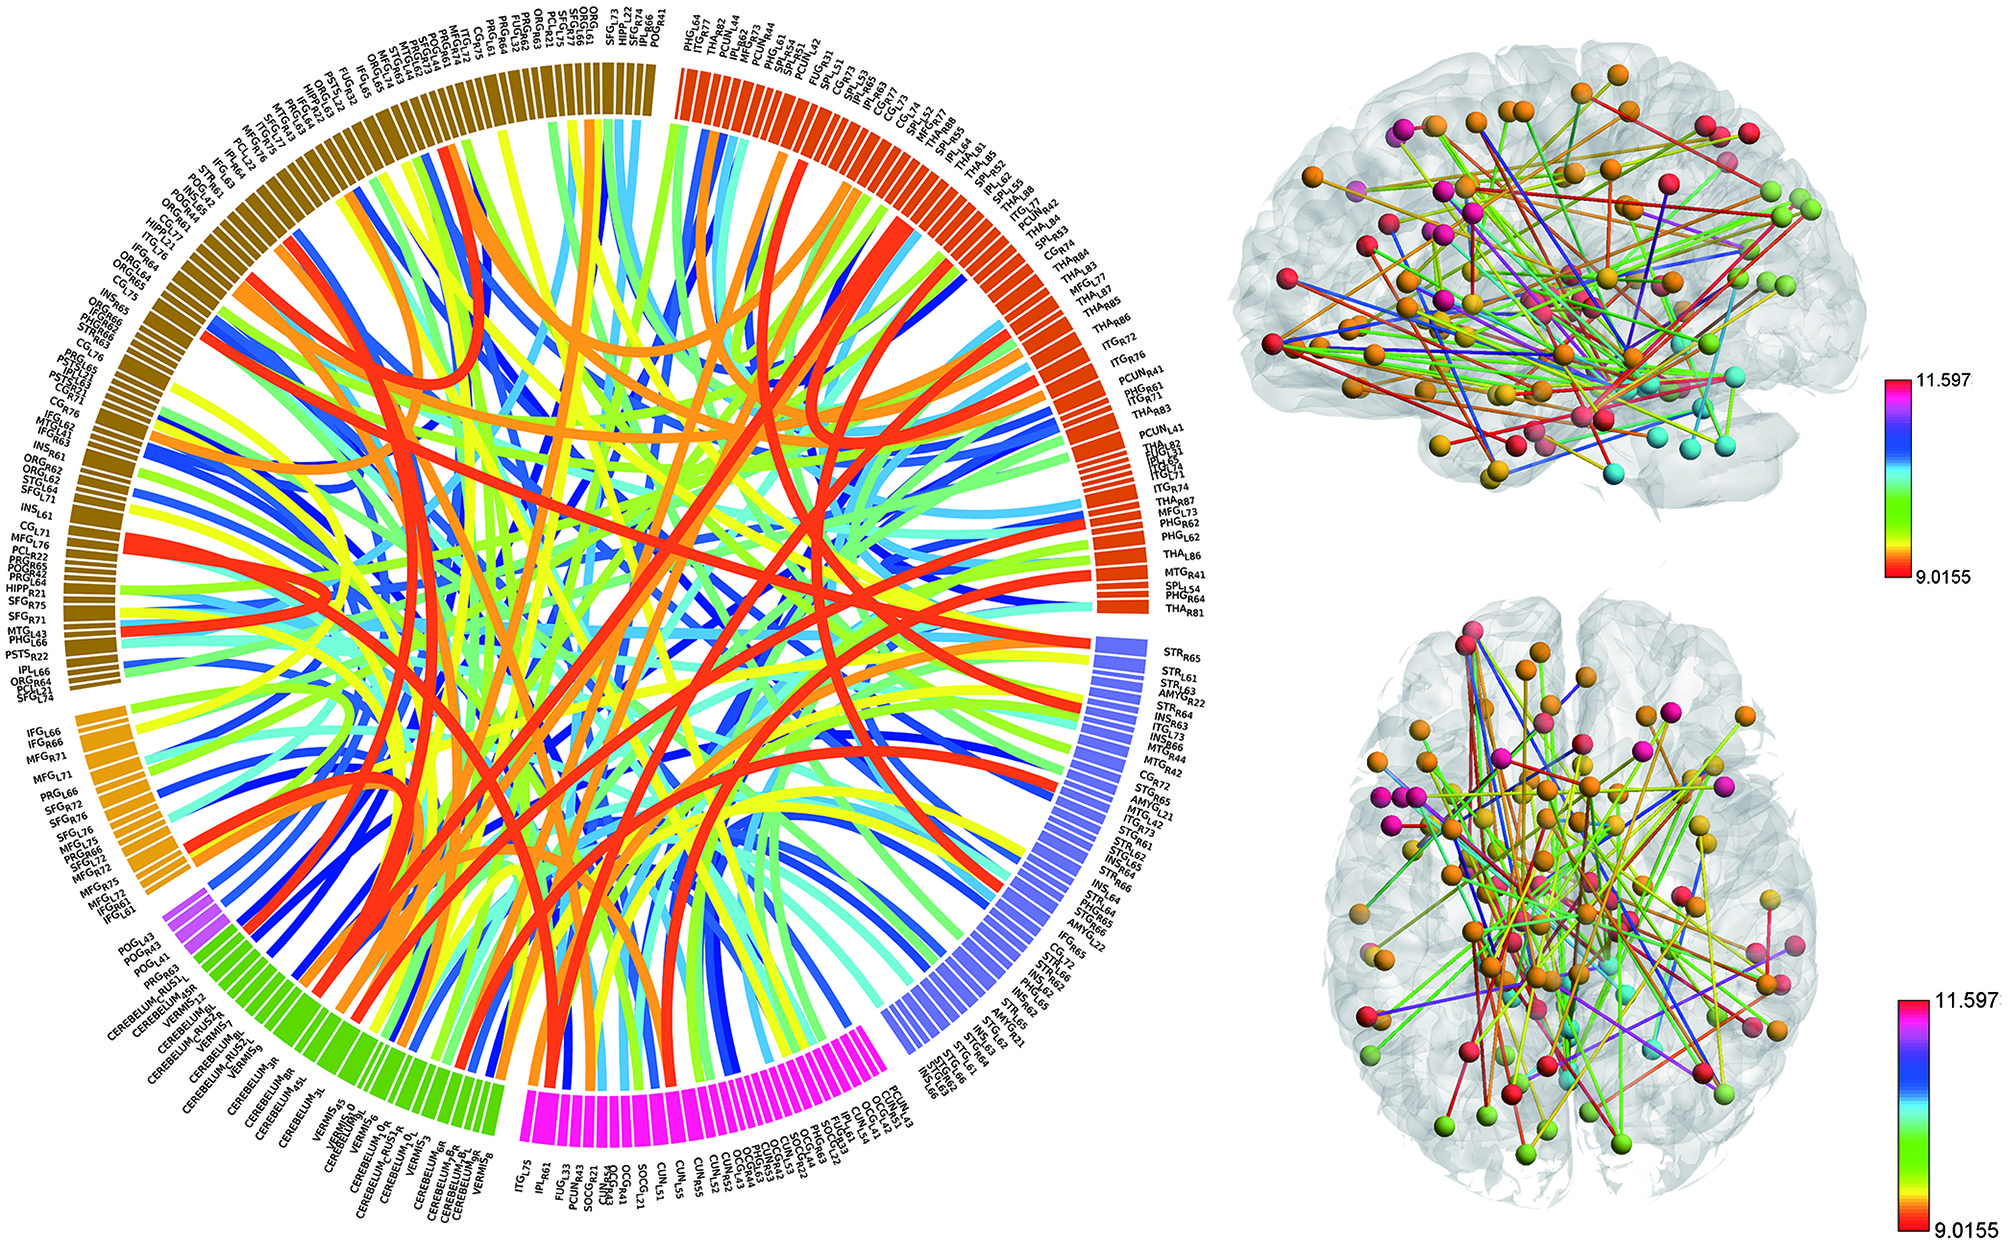
Figure 5. The ranking of regions weight and feature weight from classifiers of whole functional connectivity analysis using Brainnetome template. The meaning of color and legend is similar to Figure 4.
Although the highest discriminative power connections in both classification procedures were mainly located in the several resting-state networks and cerebellum, there were slight differences due to the different parcellation of the two templates. The Brainnetome template is a more detailed division of the brain compared to the AAL template, which resulted more consensus features in Brainnetome classification. Besides, connections between the cerebellum and other regions in Brainnetome were assigned higher weights in the linear SVM classifier than AAL. The weights assigned by classifier were more evenly distributed in Brainnetome compared to that in AAL. We also found slight differences for the cross resting-state network connections in two classification procedures. The most cross networks connections in Brainnetome were the connections between the cerebellum and other networks while there was no significantly assemble connection in cerebellum for the cross resting-state network connections in AAL.
High Discriminative Power of the Effective Connectivity Measures
Fifteen consensus features in spDCM classification process were chosen, which could be divided into two groups: self-to-self connections and one-to-another connections. Those consensus features were ranked by their weights assigned by the linear SVM classifier. The left LP, left LPFC, left PPC, right RPFC, and right LRFC were assigned top 5 in the self-to-self connections. Those connections including the connections from left IPS to right IPS, from left LP to right PPC, from the left LPFC to right PPC, from left IPS to right left FEF, from left IPS to right FEF were assigned top 5 self-to-another connections. The details of this ranking were listed in Table 2. Region weight was defined as the half of the connections weight and the top 5 weighted regions included the left LPFC, left LP, right LPFC, left IPS, and left PPC. The detailed information of this ranking were listed in Table 3.
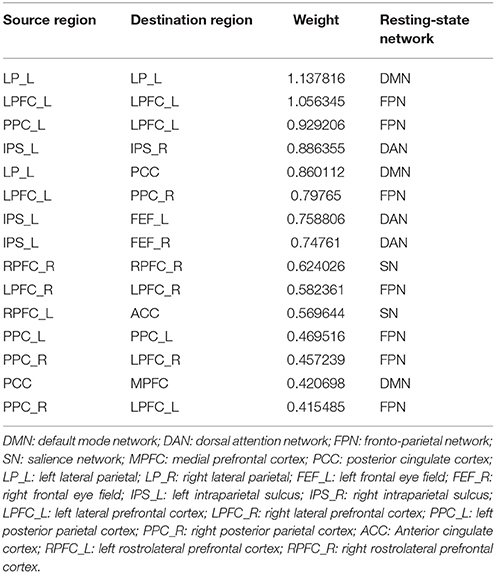
Table 2. Connections ranking of spDCM classification.
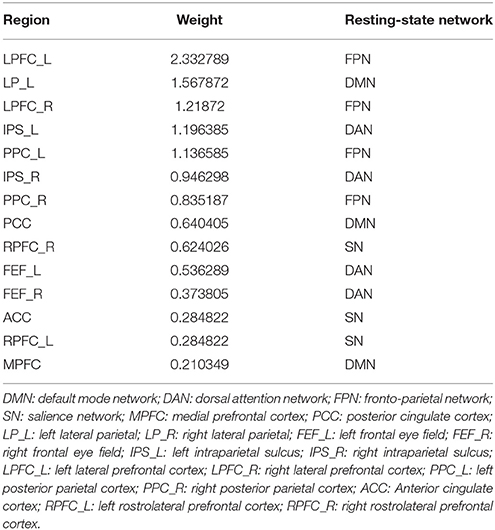
Table 3. Ranking of regions weight of spDCM classification.
To further explore the advantages and disadvantages between FC and EC, a ROI-to-ROI functional connectivity analysis only using those ROIs used in spDCM classification was performed. This results 15 × 14/2 = 105 dimensions features. Following the same workflow in Figure 1, the functional connectivity features were extracted and send to classifiers and the classification results and each feature's weight in classifier was obtained. This classification was referred as resting-state network functional connectivity classification (RSNFCC) in the following paper. The best performance of RSNFCC achieved 78.33% accuracy (f1: 72.30%; AUC: 0.70) when using the top 55 features and linear SVM classifier. For further understanding of the relationship and difference between effective and functional connectivity, the connection parameter of FC and EC were plot in Figure S1 using the same form of organization.
Discussion
In this study, both functional connectivity and effective connectivity were used as features to identify MDD patients from health populations using multivariate analysis methods. We found that effective connectivity achieved the best classification performance while functional connectivity with two templates slightly lower than effective connectivity. Both the functional connectivity and effective connectivity show a diagnostic potential for MDD disgnosis but the effective connectivity maybe more efficient comparing to functional connectivity.
Altered Functional Connectivity in MDD
Altered functional connectivity in MDD was found in a majority of previous studies (Buchanan et al., 2014; Pannekoek et al., 2014; Kaiser et al., 2015; Dørum et al., 2017). Those altered FCs were mainly located in several resting-state networks and cerebellum. Bilateral hippocampus and parahippocampal gyrus, anterior cingulate cortex, thalamus, inferior temporal gyrus, posterior cingulate cortex, and medial prefrontal cortex, which belonged to default mode network, were considered to make great contributions in MDD (Gong and He, 2015). In this study, the left hippocampus, left inferior parietal lobe, right parahippocampal, medial pre-frontal thalamus, right parietal thalamus were assigned high weight by the linear SVM classifier, which were consistent with the previous study, suggesting that those regions played an important role in the pathophysiology of depression. The impaired FCs of DMN in MDD may be a main biomarker for MDD diagnosis. Disturbances within the fronto-parietal network are suggested to be strongly associated with the cognitive performance in patients with depression (Brzezicka, 2013). The abnormalities of FC in the fronto-parietal network have been reported in many MDD studies (Chen et al., 2017; Nord et al., 2017; Vasudev et al., 2017; Yu et al., 2017). There is one widely accepted hypothesis that the dorsal and lateral parts of the PFC are associated with more “cognitive” aspects of behavior, while the ventral and medial parts are mostly connected to “emotional” aspects of information processing (Brzezicka, 2013). One recent fMRI study found decreased activities in the parietal gyrus accompanied by diminished activities in the prefrontal cortex, and suggested the abnormalities within the dorsolateral prefrontal cortex (DLPFC)-parietal network during the working memory task. These studies revealed that the superior parietal cortex worked together with the prefrontal cortex and played a crucial role in cognitive neuroscience.
Besides the default model network, regions in other functional networks also shared higher weights in the classification procedure. For example, we found that the precuneus, parts of inferior temporal gyrus, middle frontal gyrus located in the attention network, parts of superior frontal gyrus involved in the FPN, and the amygdala, insula, middle temporal pole in the affective network, which were consistent with previous functional connectivity studies (Mayberg, 2003; Liu et al., 2010). The altered functional connectivity between the temporal pole and orbitofrontal cortex may reflect dysfunctions of visceral monitoring in depression (Liu et al., 2010; Sheline et al., 2010). Decreased functional connections between bilateral amygdala and left anterior insula were observed in this study, as suggested in a whole brain resting-state analysis (Veer et al., 2010). Dysfunctions in the limbic-cortical connectivity have been served as an important diagnostic marker for depression disorders (Mayberg, 2003). Using ReHo, MDD exhibited significantly decreased ReHo in the insula and in the cerebellum (Liu et al., 2010). In line with previous studies (Lai and Wu, 2016; Xu L.-Y. et al., 2017), we found that some cerebellum regions showed high discriminative powers, such as left cerebellum 7b, right cerebellum 3, vermis 7 and vermis 8, indicating the cerebellum as a key node in the cognitive processing of MDDs (Lu et al., 2012).
Altered Effective Connectivity in Resting-State Networks in MDD
Functional connectivity can be used to describe the abnormal patterns of distributed activity, but it cannot tell us the influence that one neuronal system exerts over another (Harrison et al., 2003). Effective connectivity can describe the causal influences that neural units exert over another, which is more important for facilitating our understanding of ectopic foci leading to pathological conditions. Granger causality analysis (GCA), stochastic DCM and spDCM can be used to estimate the effective connectivity. GCA is a model-free, data-driven approach for effective connectivity analysis, which can model the effective connectivity of many nodes simultaneously. But application of GCA to resting state fMRI is particularly controversial (Craddock et al., 2013). Stochastic DCM can be used to analysis the effective connectivity in resting state fMRI, which is different from deterministic DCM because it do not ignore random fluctuations or noise on hidden states. The DCM can identify and quantify the effective connectivity that causes functional connectivity. The spDCM is designed for the resting-state fMRI effective connectivity analysis based on the observed functional connectivity, which is more accurate and more sensitive to the group difference compared to the stochastic DCM (Razi et al., 2015). The resting-state fMRI signals convey fluctuations in the low-frequency band typical within 0.01–0.08 Hz, and the low-frequency fluctuations are associated with the alterations of the externally-oriented and internally-oriented system (Wang et al., 2018). Furthermore, the effective connectivity estimated by the spDCM could reflect the time varying fluctuations in low-frequency neuronal states producing observed resting-state fMRI data by estimating the parameters of their cross correlation functions or cross spectra (Friston et al., 2014). In this study, spDCM was used to estimate the effective connectivity within four resting-state brain networks (Friston, 2011). Many studies have demonstrated that there was abnormal effective connectivity in MDD compared to HC group (Kasess et al., 2008; Vai et al., 2016; Li et al., 2017a; Wei et al., 2017).
DMN and FPN have been found to play an important role in the neuropathology of MDD. DMN has been linked to self-referential processing, while FPN has been linked to environmental information processing (Cieslik et al., 2011). In this study, effective connectivity from left LP to PCC and the self-to-self connection of left LP were assigned high weights, suggesting that they have the high discriminative power in distinguish MDD from health populations. The PCC is considered one of the hubs of the DMN with a general role in attention modulation, and in episodic and working memory. Declined influences from left LP to PCC in MDD compared with HC group have been reported in a recent study (Li et al., 2017b). This dysfunction of the connection may be related to the impaired signals propagate from one region to another in DMN. LP is associated with the episodic memory, and increased efferent connections from LP after treatment in MDD have been reported. By examining EC between amygdala and orbitomedial prefrontal cortex (OMPFC) during a happy and sad faces distinction task in both bipolar depressed (BD) and MDD patients, found that the bottom-up amygdala-OMPFC abnormalities of EC in the right hemisphere was found to be specific to bipolar disorder (Almeida et al., 2009), which revealed that the different pathophysiological mechanisms of the two type of depression. EC between four DMN nodes has been estimated by a spDCM method and used to explore the changes before and after 2-month treatment in MDD patients. MDD patients after treatment showed significant decreased effective connections from medial frontal cortex (MFC) toward PCC and toward right parietal cortex (RPC) and significant increased effective connections from the left parietal cortex (LPC) toward MFC, PCC, and RPC. This result reveals that MFC maybe play an important role in inhibitory conditioning of the DMN. In this study, we found that left LP shared a high discriminative power in distinguishing MDD, which may be related to the impaired memory function in MDD.
FPN, also referred as executive network, plays a pivotal role in control function, execution, and emotion processing. It seems to be strongly associated with cognitive problems in depression, especially those concerning executive functions. The dysfunctions within FPN are most probably connected to ineffective transmission of information between parietal and prefrontal regions (Brzezicka, 2013). Dysfunctions of the FPN in negative mood states of depression were found, which was consistent with our study. We found that the effective connections from left PPC to left LPFC, from left LPFC to right PPC, from right PPC to left LPFC showed high discriminative powers to identify MDDs from HCs. Bilateral LPFC were assigned high region weight by those connections. The left dorsal LPFC is well-known for top-down voluntary modulation of positive and negative emotions (Beauregard et al., 2001). Applying fast rTMS over the left PFC has been proved an antidepressant effect (George et al., 1997). The cortical circuit involving left frontal and right parietal regions is important in depression, and there were decreased functional connections between these regions in depression. The dysfunctions between the prefrontal and parietal regions may be a main reason that those effective connections were assigned higher weighs by the linear SVM classifier in the spDCM classification analysis.
There is evidence that MDDs showed increased attention for negative stimuli and decreased attention for positive stimuli (Disner et al., 2011). In this study, effective connections from left IPS to right IPS, left FEF, and right FEF were assigned high weights, revealing that those connections showed high discriminative powers in distinguishing MDD from health populations. IPS shows decreased brain activations in MDD compared to HC and is associated with the attention function. One recent study found that the left motor and the DAN showed reduced power in the low-frequency range in patients with MDD compared to healthy controls. Considering the role of DAN in orienting attention based on internal goals, those connections may contribute to the limited engagement with the external environment and potentially to increased self-reflection in MDD (Sambataro et al., 2017).
Our study found one effective connection from left RPFC to ACC in SN. Altered functional connectivity between ACC and frontal cortical regions in SN has been observed (Sheline et al., 2010). The role of dorsal ACC is mediating the integration of information across events in SN, so the effective connectivity from left RPFC to ACC may be associated with the dysfunction of information integration in MDD. SN is conceived as a toggle system allowing mental switching between processing self-referential and environmental information (Moran et al., 2013). Impaired salience responses to positive stimuli may be a main reason why MDD patients tend to make more concerns on the negative things. As dorsal ACC plays an important role in this switching, we speculate that the high discriminative connection from left RPFC to ACC in our study may be related to this dysfunction of switching (Yang et al., 2016).
Different Classification Performances Using Functional Connectivity and Effective Connectivity
Functional connections were applied as features in many classification studies, in which a high accuracy and good mechanistic interpretative power have been confirmed, but the classification performances using effective connections have not been explored. Effective connectivity can afford better mechanistic interpretative than functional connectivity, because it can model the causality interaction between two neurons. Using the effective connectivity as a biomarker, the pathophysiologic difference in the DMN was observed between bipolar depression and unipolar depression (Liu Y. et al., 2015), suggesting the potential ability of effective connectivity as a biomarker for MDD diagnosis. We suppose that effective connectivity will perform better than functional connectivity in the classification analysis.
To our best knowledge, this is the first study to compare the difference using EC and FC as features to identify patients from healthy controls. Effective connectivity and functional connectivity has closely relationship when using spDCM to estimate the effective connectivity. Functional connectivity adopts the cross-correlation function at zero lag as its measures while spDCM uses cross spectra, whose Fourier transforms correspond to cross-correlation function, to estimate the coupling parameters of DCM models. Cross spectra is a generalization of functional connectivity, so the effective connectivity estimated by spDCM preserve information on directed functional connectivity (Friston et al., 2014). In our study, spDCM classification indeed has a better performance compared with those classifications using functional connectivity as features. And the difference between MDD and HC was not significant for the functional connectivity, but there was significant difference in the effective connectivity. This reveals that effective connective may be more sensitive for detecting the group difference. Besides the more accuracy and more sensitive, the results obtained using effective connectivity can afford better mechanistic interpretative than functional connectivity, as the effective connectivity can provide the causality interaction of two neurons, while functional connectivity can only provide the correlation information of two brain regions.
Differences of the Classifiers Performances in the Classification Analysis
In our study, we found that the linear SVM classifier achieved the best performance in all classification process, which suggested that the linear SVM was indeed a good classifier for fMRI data. This finding was consistent with majority of previous studies (Craddock et al., 2009; Wang et al., 2016; Saccà et al., 2017). For example, using the linear SVM classifier, patients with depression were successfully distinguished from healthy volunteers (R. Cameron Craddock), One recent study achieved high accuracy in object categories classification task using functional connections from task-related functional neuroimaging as features and SVM as the classifier. Besides, by comparing the classification performances of Random Forest and SVM in a prediction task of early multiple sclerosis, SVM was suggested to be better than Random Forest. Combining our findings with the previous studies, we speculated that the linear SVM classifier should be the preferred classifier for this type of fMRI data analysis.
Limitations
One limitation is that we only explore inner-network effective connectivity and do not consider the causality interaction between networks. Dysfunction in the interaction between the FPN, DMN, and the DAN were reported in many previous studies (Buchanan et al., 2014; Sundermann et al., 2014; Wei et al., 2015). In the further work, we will add the cross-networks causal connection to feature space using spDCM to further investigate whether the accuracy would be improved and search a better combine of resting-state networks as biomarker for MDD diagnosis.
Another limitation is that the template used in whole-brain functional connectivity classification analysis has an important impact to the result. To explore the influence of the template in the whole-brain functional analysis, two templates (AAL and Brainnetome) were used in the whole-brain functional connectivity analysis. The classification performance of the Brainnetome template is slightly higher than AAL template, but more features (connections) were employed. We can see that through different templates to compute the FCs, there was no big change for the accuracy and the accuracy maintained at a higher value. The significant difference between the AAL and Brainnetome template was that weights assigned by the classifier were more evenly distributed in Brainnetome comparing to in AAL. As FCs were computed by averaging the times series of ROIs, the different division of brain regions have a great influence on the functional connections. One previous study explored the impact of different templates on the whole-brain functional connectivity analysis and developed a fine-gained atlas using spectral clustering method and achieved a good performance comparing with other templates (Craddock et al., 2012). It revealed that the choice of templates could impact the generated connections at a certain degree. Our study showed that the whole-brain functional connectivity classification maybe had a certain degree of stability although different templates were used, which need to be proved using more templates in future. Besides, the sample size in this study is not enough to totally prove that the effective connectivity is an efficient biomarker for MDD diagnosis, we use a leave-one-out cross-validation to use as many as sample in training and testing process and refer to the sample size of other papers (Zeng et al., 2012; Liu F. et al., 2015). We will use a larger sample size to verify our results in the future work.
Conclusion
In this study, both functional connectivity and effective connectivity measures were used as features for the classification analysis. We found that both functional and effective connectivity show a diagnostic potential for MDD diagnosis, but effective connectivity may be more efficient compared with functional connectivity. The best performance achieved 91.67% accuracy when we used the effective connectivity estimated by spDCM using four resting-state networks. Those connections with high discriminative powers identified by the classifier can afford better mechanistic interpretative for the pathophysiology of MDD.
Ethics Statement
This study was carried out in accordance with the recommendations of Institutional Review Board (IRB) of Tianjin Key Laboratory of Cognitive Computing and Application, Tianjin University with written informed consent from all subjects. All subjects gave written informed consent in accordance with the Declaration of Helsinki. The protocol was approved by the Institutional Review Board (IRB) of Tianjin Key Laboratory of Cognitive Computing and Application, Tianjin University.
Author Contributions
BL designed the experiments. XG and JX performed the experiments. XG analyzed results. XG and JX wrote the manuscript. XG, JX, and YS contributed to manuscript revision. All authors contributed to discuss the results and have approved the final manuscript.
Conflict of Interest Statement
The authors declare that the research was conducted in the absence of any commercial or financial relationships that could be construed as a potential conflict of interest.
Acknowledgments
This work was supported by the National Natural Science Foundation of China (No. U1736219, No. 61571327 and No. 61703302). We thank the volunteers and patients for their participation in the study.
Supplementary Material
The Supplementary Material for this article can be found online at: https://www.frontiersin.org/articles/10.3389/fnins.2018.00038/full#supplementary-material
Figure S1. The connection parameters of the functional and effective connectivity for MDD and HC groups. Fifteen regions of interest (ROI) defined in the DCM analysis were used for the functional connectivity analysis. The colorbar showed the connection intensity. MDD: major depressive disorder; HC: healthy control.
References
American Psychiatric Association (2000). DSM-IV-TR: Diagnostic and Statistical Manual of Mental Disorders, Text Revision. Washington, DC: American Psychiatric Association.
Almeida, J. R., Versace, A., Mechelli, A., Hassel, S., Quevedo, K., Kupfer, D. J., et al. (2009). Abnormal amygdala-prefrontal effective connectivity to happy faces differentiates bipolar from major depression. Biol. Psychiatry 66, 451–459. doi: 10.1016/j.biopsych.2009.03.024
Beauregard, M., Lévesque, J., and Bourgouin, P. (2001). Neural correlates of conscious self-regulation of emotion. J. Neurosci. Offic. J. Soc. Neurosci. 21:RC165.
Belmaker, R. H., and Agam, G. (2008). Major depressive disorder. N. Engl. J. Med. 358, 55–68. doi: 10.1056/NEJMra073096
Betzel, R. F., Byrge, L., He, Y., Goñi, J., Zuo, X.-N., and Sporns, O. (2014). Changes in structural and functional connectivity among resting-state networks across the human lifespan. Neuroimage 102, 345–357. doi: 10.1016/j.neuroimage.2014.07.067
Bordini, B. J., Stephany, A., and Kliegman, R. (2017). Overcoming diagnostic errors in medical practice. J. Pediatr. 185, 19–25:e11. doi: 10.1016/j.jpeds.2017.02.065
Brzezicka, A. (2013). Integrative deficits in depression and in negative mood states as a result of fronto-parietal network dysfunctions. Acta Neurobiol. Exp. 73:313.
Buchanan, A., Wang, X., and Gollan, J. K. (2014). Resting-state functional connectivity in women with Major Depressive Disorder. J. Psychiatr. Res. 59, 38–44. doi: 10.1016/j.jpsychires.2014.09.002
Chen, X., Liu, C., He, H., Chang, X., Jiang, Y., Li, Y., et al. (2017). Transdiagnostic differences in the resting-state functional connectivity of the prefrontal cortex in depression and schizophrenia. J. Affect. Disord. 217, 118. doi: 10.1016/j.jad.2017.04.001
Cieslik, E. C., Zilles, K., Grefkes, C., and Eickhoff, S. B. (2011). Dynamic interactions in the fronto-parietal network during a manual stimulus-response compatibility task. Neuroimage 58, 860–869. doi: 10.1016/j.neuroimage.2011.05.089
Corbetta, M., Patel, G., and Shulman, G. L. (2008). The reorienting system of the human brain: from environment to theory of mind. Neuron 58, 306–324. doi: 10.1016/j.neuron.2008.04.017
Craddock, R. C., Holtzheimer, P. E., Hu, X. P., and Mayberg, H. S. (2009). Disease state prediction from resting state functional connectivity. Magn. Reson. Med. 62, 1619–1628. doi: 10.1002/mrm.22159
Craddock, R. C., James, G. A., Holtzheimer, P. E., Hu, X. P., and Mayberg, H. S. (2012). A whole brain fMRI atlas generated via spatially constrained spectral clustering. Hum. Brain Mapp. 33, 1914–1928. doi: 10.1002/hbm.21333
Craddock, R. C., Jbabdi, S., Yan, C.-G., Vogelstein, J. T., Castellanos, F. X., Di Martino, A., et al. (2013). Imaging human connectomes at the macroscale. Nat. Methods 10, 524–539. doi: 10.1038/nmeth.2482
Dietterich, T. (1995). Overfitting and undercomputing in machine learning. ACM Comput. Surv. 27, 326–327. doi: 10.1145/212094.212114
Disner, S. G., Beevers, C. G., Haigh, E. A., and Beck, A. T. (2011). Neural mechanisms of the cognitive model of depression. Nat. Rev. Neurosci. 12, 467–477. doi: 10.1038/nrn3027
Dørum, E. S., Kaufmann, T., Alnæs, D., Andreassen, O. A., Richard, G., Kolskår, K. K., et al. (2017). Increased sensitivity to age-related differences in brain functional connectivity during continuous multiple object tracking compared to resting-state. Neuroimage 148, 364–372. doi: 10.1016/j.neuroimage.2017.01.048
Drysdale, A. T., Grosenick, L., Downar, J., Dunlop, K., Mansouri, F., Meng, Y., et al. (2017). Resting-state connectivity biomarkers define neurophysiological subtypes of depression. Nat. Med. 23, 28–38. doi: 10.1038/nm.4246
Fan, L., Li, H., Zhuo, J., Zhang, Y., Wang, J., Chen, L., et al. (2016). The human brainnetome atlas: a new brain atlas based on connectional architecture. Cereb. Cortex 26, 3508–3526. doi: 10.1093/cercor/bhw157
Friston, K. J. (1994). Functional and effective connectivity in neuroimaging: a synthesis. Hum. Brain Mapp. 2, 56–78. doi: 10.1002/hbm.460020107
Friston, K. J. (2011). Functional and effective connectivity: a review. Brain Connect. 1, 13–36. doi: 10.1089/brain.2011.0008
Friston, K. J., Kahan, J., Biswal, B. B., and Razi, A. (2014). A DCM for resting state fMRI. Neuroimage 94, 396–407. doi: 10.1016/j.neuroimage.2013.12.009
George, M. S., Wassermann, E. M., Kimbrell, T. A., Little, J. T., Williams, W. E., Danielson, A. L., et al. (1997). Mood improvement following daily left prefrontal repetitive transcranial magnetic stimulation in patients with depression: a placebo-controlled crossover trial. Am. J. Psychiatry 154, 1752–1756. doi: 10.1176/ajp.154.12.1752
Gong, Q., and He, Y. (2015). Depression, neuroimaging and connectomics: a selective overview. Biol. Psychiatry 77, 223–235. doi: 10.1016/j.biopsych.2014.08.009
Guo, W., Liu, F., Liu, J., Yu, M., Zhang, Z., Liu, G., et al. (2015). Increased cerebellar-default-mode-network connectivity in drug-naive major depressive disorder at rest. Medicine 94:e560. doi: 10.1097/MD.0000000000000560
Harrison, L., Penny, W. D., and Friston, K. (2003). Multivariate autoregressive modeling of fMRI time series. Neuroimage 19, 1477–1491. doi: 10.1016/S1053-8119(03)00160-5
Kaas, J. H., Qi, H. X., and Stepniewska, I. (2017). Evolution of Parietal-Frontal Networks in Primates. Oxford, UK: Oliver Walter.
Kaiser, R. H., Andrews-Hanna, J. R., Wager, T. D., and Pizzagalli, D. A. (2015). Large-scale network dysfunction in major depressive disorder: a meta-analysis of resting-state functional connectivity. JAMA Psychiatry 72, 603–611. doi: 10.1001/jamapsychiatry.2015.0071
Kasess, C. H., Hartinger, B., Kandler, B., Scharinger, C., Huf, W., Pail, G., et al. (2008). Effective connectivity as a depression vulnerability marker. Int. J. Psychiatry Clin. Pract. 12, 336–337.
Kempton, M. J., Salvador, Z., Munafò, M. R., Geddes, J. R., Simmons, A., Frangou, S., et al. (2011). Structural neuroimaging studies in major depressive disorder: meta-analysis and comparison with bipolar disorder. Arch. Gen. Psychiatry 68, 675–690. doi: 10.1001/archgenpsychiatry.2011.60
Lai, C.-H., and Wu, Y.-T. (2014). Decreased inter-hemispheric connectivity in anterior sub-network of default mode network and cerebellum: significant findings in major depressive disorder. Int. J. Neuropsychopharmacol. 17, 1935–1942. doi: 10.1017/S1461145714000947
Lai, C.-H., and Wu, Y.-T. (2016). The alterations in regional homogeneity of parieto-cingulate and temporo-cerebellum regions of first-episode medication-naive depression patients. Brain Imaging Behav. 10, 187–194. doi: 10.1007/s11682-015-9381-9
Li, J. Z., Gui, F. Y., Xin, Y. Z., Yun, F. W., Liu, Y., Gang, Z., et al. (2017a). Altered amygdala and hippocampus effective connectivity in mild cognitive impairment patients with depression: a resting-state functional MR imaging study with granger causality analysis. Oncotarget 8, 25021–25031. doi: 10.18632/oncotarget.15335
Li, L., Li, B., Bai, Y., Liu, W., Wang, H., Leung, H. C., et al. (2017b). Abnormal resting state effective connectivity within the default mode network in major depressive disorder: a spectral dynamic causal modeling study. Brain Behav. 7:e00732. doi: 10.1002/brb3.732
Liao, W., Qiu, C., Gentili, C., Walter, M., Pan, Z., Ding, J., et al. (2010). Altered effective connectivity network of the amygdala in social anxiety disorder: a resting-state FMRI study. PLoS ONE 5:e15238. doi: 10.1371/journal.pone.0015238
Liu, F., Guo, W., Fouche, J.-P., Wang, Y., Wang, W., Ding, J., et al. (2015). Multivariate classification of social anxiety disorder using whole brain functional connectivity. Brain Struct. Funct. 220, 101–115. doi: 10.1007/s00429-013-0641-4
Liu, Y., Wu, X., Zhang, J., Guo, X., Long, Z., and Yao, L. (2015). Altered effective connectivity model in the default mode network between bipolar and unipolar depression based on resting-state fMRI. J. Affect. Disord. 182, 8–17. doi: 10.1016/j.jad.2015.04.009
Liu, Z., Xu, C., Xu, Y., Wang, Y., Zhao, B., Lv, Y., et al. (2010). Decreased regional homogeneity in insula and cerebellum: a resting-state fMRI study in patients with major depression and subjects at high risk for major depression. Psychiatry Res. Neuroimag. 182, 211–215. doi: 10.1016/j.pscychresns.2010.03.004
Lorenzetti, V., Allen, N. B., Fornito, A., and Yücel, M. (2009). Structural brain abnormalities in major depressive disorder: a selective review of recent MRI studies. J. Affect. Disord. 117, 1–17. doi: 10.1016/j.jad.2008.11.021
Lu, Q., Li, H., Luo, G., Wang, Y., Tang, H., Han, L., et al. (2012). Impaired prefrontal–amygdala effective connectivity is responsible for the dysfunction of emotion process in major depressive disorder: a dynamic causal modeling study on MEG. Neurosci. Lett. 523, 125–130. doi: 10.1016/j.neulet.2012.06.058
Lv, Q., Yang, L., Li, G., Wang, Z., Shen, Z., Yu, W., et al. (2016). Large-scale persistent network reconfiguration induced by ketamine in anesthetized monkeys: relevance to mood disorders. Biol. Psychiatry 79, 765–775. doi: 10.1016/j.biopsych.2015.02.028
Mayberg, H. S. (2003). Modulating dysfunctional limbic-cortical circuits in depression: towards development of brain-based algorithms for diagnosis and optimised treatment. Br. Med. Bull. 65, 193–207. doi: 10.1093/bmb/65.1.193
Misaki, M., Kim, Y., Bandettini, P. A., and Kriegeskorte, N. (2010). Comparison of multivariate classifiers and response normalizations for pattern-information fMRI. Neuroimage 53, 103–118. doi: 10.1016/j.neuroimage.2010.05.051
Moran, L. V., Tagamets, M. A., Sampath, H., O'Donnell, A., Stein, E. A., Kochunov, P., et al. (2013). Disruption of anterior insula modulation of large-scale brain networks in schizophrenia. Biol. Psychiatry 74, 467–474. doi: 10.1016/j.biopsych.2013.02.029
Mwangi, B., Ebmeier, K. P., Matthews, K., and Steele, J. D. (2012). Multi-centre diagnostic classification of individual structural neuroimaging scans from patients with major depressive disorder. Brain 135, 1508–1521. doi: 10.1093/brain/aws084
Nashiro, K., Sakaki, M., Braskie, M. N., and Mather, M. (2017). Resting-state networks associated with cognitive processing show more age-related decline than those associated with emotional processing. Neurobiol. Aging 54, 152–162. doi: 10.1016/j.neurobiolaging.2017.03.003
Nord, C., Halahakoon, D. C., Limbachya, T., Gray, A., Charpentier, C., Lally, N., et al. (2017). Neural, cognitive, and clinical effects of prefrontal cortex stimulation in depression combined with psychological therapy: a double-blind randomized controlled trial. Biol. Psychiatry 81, S261–S262. doi: 10.1016/j.biopsych.2017.02.1054
Oldfield, R. C. (1971). The assessment and analysis of handedness: the Edinburgh inventory. Neuropsychologia 9, 97–113. doi: 10.1016/0028-3932(71)90067-4
World Health Organization, (1992). International Classification of Mental and Behavioural Disorders (ICD-10). Geneva: WHO.
Oyebode, F. (2013). Clinical errors and medical negligence. Med. Princ. Pract. 22, 323–333. doi: 10.1159/000346296
Pannekoek, J. N., Werff, S., Meens, P. H., Bulk, B. G., Jolles, D. D., Veer, I. M., et al. (2014). Aberrant resting-state functional connectivity in limbic and salience networks in treatment-naive clinically depressed adolescents. J. Child Psychol. Psychiatry 55, 1317–1327. doi: 10.1111/jcpp.12266
Raichle, M. E. (2015). The brain's default mode network. Annu. Rev. Neurosci. 38:433. doi: 10.1146/annurev-neuro-071013-014030
Ray, K., Macdonald, A. W. III., Ragland, J. D., Gold, J., Silverstein, S. M., Barch, D., et al. (2017). Dynamic network reorganization of the frontal-parietal, aalience, and default mode networks during cognitive control and episodic memory. 81:S255. doi: 10.1016/j.biopsych.2017.02.499
Razi, A., Kahan, J., Rees, G., and Friston, K. J. (2015). Construct validation of a DCM for resting state fMRI. Neuroimage 106, 1–14. doi: 10.1016/j.neuroimage.2014.11.027
Rosazza, C., and Minati, L. (2011). Resting-state brain networks: literature review and clinical applications. Neurol. Sci. 32, 773–785. doi: 10.1007/s10072-011-0636-y
Saccà, V., Sarica, A., Novellino, F., Barone, S., Tallarico, T., Filippelli, E., et al. (2017). “Evaluation of random forest and SVM classification performance for the prediction of early multiple sclerosis from resting state FMRI connectivity data,” in 19th International Conference on Neuroinformatics and Computational Neuroscience (Paris).
Sambataro, F., Visintin, E., Doerig, N., Brakowski, J., Holtforth, M. G., Seifritz, E., et al. (2017). Altered dynamics of brain connectivity in major depressive disorder at-rest and during task performance. Psychiatry Res. Neuroimag. 259, 1–9. doi: 10.1016/j.pscychresns.2016.11.001
Sankar, A., Zhang, T., Gaonkar, B., Doshi, J., Erus, G., Costafreda, S. G., et al. (2016). Diagnostic potential of structural neuroimaging for depression from a multi-ethnic community sample. Br. J. Psychiatry Open 2, 247–254. doi: 10.1192/bjpo.bp.115.002493
Schlösser, R. G. M., Wagner, G., Koch, K., Dahnke, R., Reichenbach, J. R., and Sauer, H. (2008). Fronto-cingulate effective connectivity in major depression: a study with fMRI and dynamic causal modeling. Neuroimage 43, 645–655. doi: 10.1016/j.neuroimage.2008.08.002
Schmaal, L., Hibar, D. P., Sämann, P. G., Hall, G. B., Baune, B. T., Jahanshad, N., et al. (2017). Cortical abnormalities in adults and adolescents with major depression based on brain scans from 20 cohorts worldwide in the ENIGMA Major Depressive Disorder Working Group. Mol. Psychiatry. 22, 900–909. doi: 10.1038/mp.2016.60
Sheline, Y. I., Price, J. L., Yan, Z., and Mintun, M. A. (2010). Resting-state functional MRI in depression unmasks increased connectivity between networks via the dorsal nexus. Proc. Natl. Acad. Sci. U.S.A. 107, 11020–11025. doi: 10.1073/pnas.1000446107
Singh, H., Thomas, E. J., Wilson, L., Kelly, P. A., Pietz, K., Elkeeb, D., et al. (2010). Errors of diagnosis in pediatric practice: a multisite survey. Pediatr. Peds. 126, 70–79. doi: 10.1542/peds.2009-3218
Sundermann, B., Olde Lütke Beverborg, M., and Pfleiderer, B. (2014). Toward literature-based feature selection for diagnostic classification: a meta-analysis of resting-state fMRI in depression. Front. Hum. Neurosci. 8:692–692. doi: 10.3389/fnhum.2014.00692
Tsvetanov, K. A., Henson, R. N., Tyler, L. K., Razi, A., Geerligs, L., Ham, T. E., et al. (2016). Extrinsic and intrinsic brain network connectivity maintains cognition across the lifespan despite accelerated decay of regional brain activation. J. Neurosci. 36, 3115–3126. doi: 10.1523/JNEUROSCI.2733-15.2016
Tzouriomazoyer, N., Landeau, B., Papathanassiou, D., Crivello, F., Etard, O., Delcroix, N., et al. (2002). Automated anatomical labeling of activations in SPM using a macroscopic anatomical parcellation of the MNI MRI single-subject. Neuroimage 15, 273–289. doi: 10.1006/nimg.2001.0978
Vai, B., Bulgarelli, C., Godlewska, B. R., Cowen, P. J., Benedetti, F., and Harmer, C. J. (2016). Fronto-limbic effective connectivity as possible predictor of antidepressant response to SSRI administration. Eur. Neuropsychopharmacol. 26, 2000–2010. doi: 10.1016/j.euroneuro.2016.09.640
van den Heuvel, M. P., and Hulshoff Pol, H. E. (2010). Exploring the brain network: a review on resting-state fMRI functional connectivity. Eur. Neuropsychopharmacol. 20, 519–534. doi: 10.1016/j.euroneuro.2010.03.008
Vasudev, A., Firbank, M. J., Gati, J. S., Ionson, E., and Thomas, A. J. (2017). BOLD activation of the ventromedial prefrontal cortex in patients with late life depression and comparison participants. Int. Psychogeriatr. 18, 1–6. doi: 10.1017/S1041610217000461
Veer, I. M., Beckmann, C. F., Van Tol, M., Ferrarini, L., Milles, J., Veltman, D. J., et al. (2010). Whole brain resting-state analysis reveals decreased functional connectivity in major depression. Front. Syst. Neurosci. 4:41. doi: 10.3389/fnsys.2010.00041
Vincent, J. L., Kahn, I., Snyder, A. Z., Raichle, M. E., and Buckner, R. L. (2008). Evidence for a frontoparietal control system revealed by intrinsic functional connectivity. J. Neurophysiol. 100, 3328–3342. doi: 10.1152/jn.90355.2008
Wang, X., Fang, Y., Cui, Z., Xu, Y., He, Y., Guo, Q., et al. (2016). Representing object categories by connections: evidence from a mutivariate connectivity pattern classification approach. Hum. Brain Mapp. 37, 3685–3697. doi: 10.1002/hbm.23268
Wang, Y., Zhu, L., Zou, Q., Cui, Q., Liao, W., Duan, X., et al. (2018). Frequency dependent hub role of the dorsal and ventral right anterior insula. Neuroimage 165, 112–117. doi: 10.1016/j.neuroimage.2017.10.004
Wei, M. B., Qin, J. L., Yan, R., Bi, K., Liu, C., Yao, Z. J., et al. (2015). Association of resting-state network dysfunction with their dynamics of inter-network interactions in depression. J. Affect. Disord. 174, 527–534. doi: 10.1016/j.jad.2014.12.020
Wei, M., Qin, J., Yan, R., Bi, K., Liu, C., Yao, Z., et al. (2017). Abnormal dynamic community structure of the salience network in depression. J. Magn. Reson. Imag 45, 1135–1143. doi: 10.1002/jmri.25429
Weil, R. S., and Rees, G. (2010). Decoding the neural correlates of consciousness. Curr. Opin. Neurol. 23, 649–655. doi: 10.1097/WCO.0b013e32834028c7
Whitton, A. E., Deccy, S., Ironside, M. L., Kumar, P., Beltzer, M., and Pizzagalli, D. A. (2018). Electroencephalography source functional connectivity reveals abnormal high-frequency communication among large-scale functional networks in depression. Biol. Psychiatry Cogn. Neurosci. Neuroimag. 3, 50–58. doi: 10.1016/j.bpsc.2017.07.001
Williams, L. M. (2017). Defining biotypes for depression and anxiety based on large-scale circuit dysfunction: a theoretical review of the evidence and future directions for clinical translation. Depress. Anxiety 34:9. doi: 10.1002/da.22556
Woodward, N. D., Rogers, B., and Heckers, S. (2011). Functional resting-state networks are differentially affected in schizophrenia. Schizophr. Res. 130, 86–93. doi: 10.1016/j.schres.2011.03.010
Xu, J., Yin, X., Ge, H., Yan, H., Pang, Z., Liu, B., et al. (2017). Heritability of the effective connectivity in the resting-state default mode network. Cereb. Cortex 27, 5626–5634. doi: 10.1093/cercor/bhw332
Xu, L.-Y., Xu, F.-C., Liu, C., Ji, Y.-F., Wu, J.-M., Wang, Y., et al. (2017). Relationship between cerebellar structure and emotional memory in depression. Brain Behav. 7:e00738. doi: 10.1002/brb3.738
Yang, Y., Zhong, N., Kazuyuki, I., Lu, S., Li, M., Zhou, H., et al. (2016). Task and resting-state fMRI reveal altered salience responses to positive stimuli in patients with major depressive disorder. PLoS ONE 11:e0155092. doi: 10.1371/journal.pone.0155092
Yao, Z., Wang, L., Lu, Q., Liu, H., and Teng, G. (2009). Regional homogeneity in depression and its relationship with separate depressive symptom clusters: a resting-state fMRI study. J. Affect. Disord. 115, 430–438. doi: 10.1016/j.jad.2008.10.013
Yu, L., Li, M., Wei, D., Xia, K., Xue, D., Xin, H., et al. (2017). Self-referential processing in unipolar depression: distinct roles of subregions of the medial prefrontal cortex. Psychiatry Res. Neuroimag. 263, 8–14. doi: 10.1016/j.pscychresns.2017.02.008
Zeng, L. L., Shen, H., Liu, L., Wang, L., Li, B., Fang, P., et al. (2012). Identifying major depression using whole-brain functional connectivity: a multivariate pattern analysis. Brain 135, 1498–1507. doi: 10.1093/brain/aws059
Zhang, X., Zhu, X., Wang, X., Zhu, X., Zhong, M., Yi, J., et al. (2014). First-episode medication-naive major depressive disorder is associated with altered resting brain function in the affective network. PLoS ONE 9:e85241. doi: 10.1371/journal.pone.0085241
Zhao, K., Liu, H., Yan, R., Hua, L., Chen, Y., Shi, J., et al. (2017). Altered patterns of association between cortical thickness and subcortical volume in patients with first episode major depressive disorder: a structural MRI study. Psychiatry Res. Neuroimag. 260, 16–22. doi: 10.1016/j.pscychresns.2016.12.001
Keywords: major depressive disorder, pattern classification, functional connectivity, effective connectivity, spectral dynamic causal modeling
Citation: Geng X, Xu J, Liu B and Shi Y (2018) Multivariate Classification of Major Depressive Disorder Using the Effective Connectivity and Functional Connectivity. Front. Neurosci. 12:38. doi: 10.3389/fnins.2018.00038
Received: 31 October 2017; Accepted: 16 January 2018;
Published: 19 February 2018.
Edited by:
Lingzhong Fan, Institute of Automation (CAS), ChinaReviewed by:
Qiu Jiang, Southwest Normal University, ChinaYifeng Wang, University of Electronic Science and Technology of China, China
Copyright © 2018 Geng, Xu, Liu and Shi. This is an open-access article distributed under the terms of the Creative Commons Attribution License (CC BY). The use, distribution or reproduction in other forums is permitted, provided the original author(s) and the copyright owner are credited and that the original publication in this journal is cited, in accordance with accepted academic practice. No use, distribution or reproduction is permitted which does not comply with these terms.
*Correspondence: Baolin Liu, bGl1YmFvbGluQHRzaW5naHVhLmVkdS5jbg==
†These authors have contributed equally to this work.