 Maria V. Fernández1,2
 John Budde1,2
 Jorge L. Del-Aguila1,2
 Laura Ibañez1,2
 Yuetiva Deming1,2
 Oscar Harari1,2Joanne Norton1,2John C. Morris2,3Alison M. Goate4NIA-LOAD family study group†NCRAD†
 Carlos Cruchaga1,2*
- 1Department of Psychiatry, Washington University School of Medicine, St. Louis, MO, United States
- 2Hope Center for Neurological Disorders, Washington University School of Medicine, St. Louis, MO, United States
- 3Knight Alzheimer's Disease Research Center, Washington University School of Medicine, St. Louis, MO, United States
- 4Department of Neuroscience, Ronald M. Loeb Center for Alzheimer's Disease, Icahn School of Medicine at Mount Sinai, New York, NY, United States
Gene-based tests to study the combined effect of rare variants on a particular phenotype have been widely developed for case-control studies, but their evolution and adaptation for family-based studies, especially studies of complex incomplete families, has been slower. In this study, we have performed a practical examination of all the latest gene-based methods available for family-based study designs using both simulated and real datasets. We examined the performance of several collapsing, variance-component, and transmission disequilibrium tests across eight different software packages and 22 models utilizing a cohort of 285 families (N = 1,235) with late-onset Alzheimer disease (LOAD). After a thorough examination of each of these tests, we propose a methodological approach to identify, with high confidence, genes associated with the tested phenotype and we provide recommendations to select the best software and model for family-based gene-based analyses. Additionally, in our dataset, we identified PTK2B, a GWAS candidate gene for sporadic AD, along with six novel genes (CHRD, CLCN2, HDLBP, CPAMD8, NLRP9, and MAS1L) as candidate genes for familial LOAD.
Introduction
Alzheimer disease (AD) is a complex condition for which almost 50% of its phenotypic variability is due to genetic causes; yet only 30% of the genetic variability is explained by known markers (Ridge et al., 2016). GWAS studies have identified more than 20 risk loci (Lambert et al., 2013) and sequencing studies have identified additional genes harboring low frequency variants with large effect size (TREM2, PDL3, UNC5C, SORL1, and ABCA7; Sims et al., 2017). Recent studies also indicate that Late-Onset AD (LOAD) families are enriched for genetic risk factors (Cruchaga et al., 2017). Therefore, studying those families may lead to the identification of novel variants and genes (Guerreiro et al., 2013; Cruchaga et al., 2014).
Current consensus is that the missing heritability for complex traits like AD may be hidden within rare variants that have low to moderate effect on disease risk (Frazer et al., 2009; Manolio et al., 2009; Cirulli and Goldstein, 2010). The rarity of these markers requires specific study designs and statistical analyses for their detection. The simplest approach to detect rare variants for association is to test each variant individually using standard contingency table and regression methods. But due to the limited number of observations of the rare minor allele for a specific variant, the statistical power to detect association with any rare variant is limited; hence, extremely large samples are required and a more stringent multiple-test correction is necessary (Li and Leal, 2008; Bansal et al., 2010). It has been acknowledged that the best alternative to single-variant analysis is to collapse sets of pre-defined candidate rare variants within significant units, usually genes (gene-based sets) (Neale and Sham, 2004; Lee et al., 2014). For collapsing tests each variant is given a certain weight and the weights of all variants within the region are summed; depending on the weights and how summation is performed there are three major types of gene-based methods: collapsing tests, variance-component tests, and combined tests (Lee et al., 2014). Collapsing tests analyze whether the overall burden of rare variants is significantly different between cases and controls by regressing disease status on minor allele counts (MAC). The Cohort Allelic Sum Test (CAST) is a dominant genetic model which assumes that the presence of any rare variant increases disease risk (Morgenthaler and Thilly, 2007); whereas the Combined Multivariate and Collapsing (CMC) method collapses rare variants in different MAF categories and evaluates the joint effect of common and rare variants through Hoteling's test (Li and Leal, 2008). However, neither CAST nor CMC tests account for directional effect. The Variable Threshold (VT) test does allow for both trait-increasing and trait-decreasing variants; it selects optimal frequency thresholds for burden tests of rare variants and estimates p-values analytically or by permutation (Price et al., 2010). Variance-componence methods test for association by evaluating the distribution of genetic effects for a group of variants while appropriately weighting the contribution of each variant. The sequence kernel association test (SKAT) casts the problem to mixed models (Lee et al., 2014) and, in the absence of covariates, SKAT reduces to a C-alpha test (Neale et al., 2011). Finally, collapsing and variance component tests can be combined into one statistical method, the SKAT-O approach (Lee et al., 2012), which is statistically efficient regardless of the direction and effect of the variants tested.
All these methods were initially designed for unrelated case-control studies; but considering the rarity of these variants, large datasets are required to achieve statistical power (Laird and Lange, 2006). Alternatively, family-based studies in which several family members share the same phenotype may provide more statistical power than regular case-controls studies (Li et al., 2006; Cirulli and Goldstein, 2010; Kazma and Bailey, 2011; Ott et al., 2011). Pioneering methods for gene-based analyses in familial datasets are based on the transmission disequilibrium test (TDT–Spielman et al., 1993) which uses the marker genotype of an affected child and genotypes of the parents to test for association (Laird et al., 2000; Horvath et al., 2001; Ott et al., 2011; De et al., 2013; Ionita-Laza et al., 2013). TDT works under the paradigm of Mendel's laws to determine which marker in the affected offspring is responsible for the phenotype (Zöllner et al., 2004). TDT methods have been extended to test rare-variants by grouping information across multiple variants within a genomic region (He et al., 2014). However, these methods were still not valid for incomplete or nuclear families that have several affected offspring. Considering the late-onset nature of Alzheimer disease it is often difficult to obtain genetic information from parents (to conform trios) or nuclear family units. The typical pedigree in familial LOAD represents incomplete, large familial units (Figure 1). Most of the early software for gene-based family-based studies were not suitable for complex pedigrees like those observed in Alzheimer studies. In recent years gene-based methods, whether referring to collapsing, variance-component, or transmission disequilibrium tests, have been adapted to account for complex family structure in its gene-based calculations. Among the software that can manage large pedigrees we find SKAT (Wu et al., 2011), FSKAT (Yan et al., 2015), GSKAT (Wang et al., 2013), RV-GDT (He et al., 2017), EPACTS (http://genome.sph.umich.edu/wiki/EPACTS), FarVAT (Choi et al., 2014), PedGene (Schaid et al., 2013), and RareIBD (Sul et al., 2016).
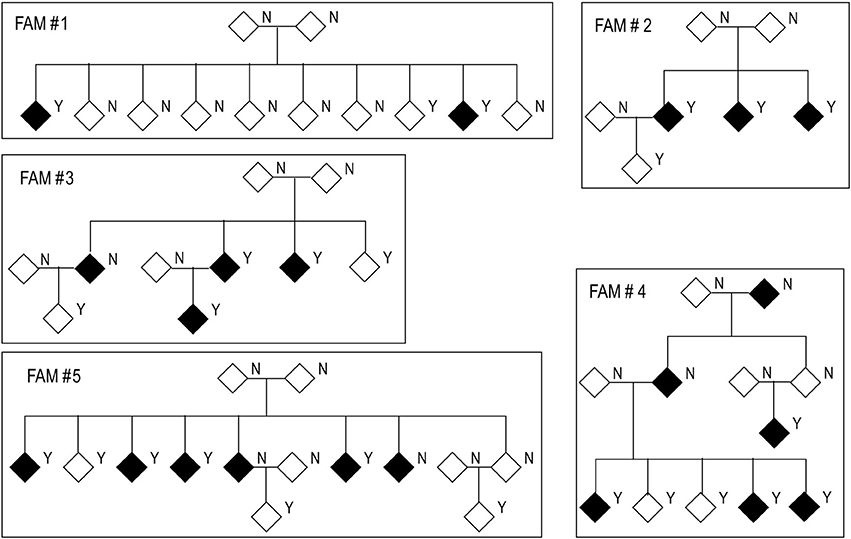
Figure 1. Structure of families used in this study. Black diamonds represent cases and white diamonds represent controls. Y: genetic data available. N: no genetic data available.
In this study, we wanted to evaluate the performance of the eight most common gene-based family-based methods available by using a real dataset, over 250 multiplex families affected with Alzheimer disease, under different conditions and models. We simulated multiple scenarios in which candidate variants in the same gene perfectly segregates with disease status to rank the different programs and models. We also tested the performance of these tests for identifying known causal genes for AD in our cohort. Finally, we performed genome-wide analyses to evaluate the power of each of these tests. Altogether, we discuss the pros and cons of each method that can be informative for other investigators performing similar analyses: complex diseases in complex, incomplete, large families. We want to emphasize that although this work focused on AD, the information extracted from this work can be applied to other complex traits as well. Finally, based on the results from the methods analyzed, we present some candidate genes for AD.
Materials and Methods
Cohort
The LOAD families included in this study originated from two cohorts: Washington University School of Medicine (WUSM; n = 1,144) and Alzheimer Disease Sequencing Project (ADSP; n = 91) (Table 1).
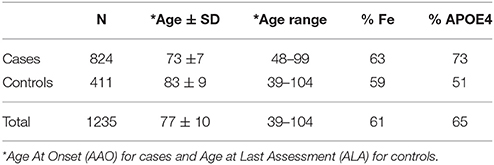
Table 1. Demographic data for the familial dataset employed in this study.
WUSM Cohort
Samples from the Washington University School of Medicine (WUSM) cohort were recruited by either the Charles F. and Joanne Knight Alzheimer's Disease Research Center (Knight ADRC) at the WUSM in Saint Louis or the National Institute on Aging Genetics Initiative for Late-Onset Alzheimer's Disease (NIA-LOAD). This study was approved by each recruiting center's Institutional Review Board and research was carried out in accordance with the approved protocol. Written informed consent was obtained from participants and their family members by the Clinical and Genetics Core of the Knight ADRC. The approval number for the Knight ADRC Genetics Core family studies is 201104178. The NIA-LOAD Family Study has recruited multiplex families with two or more siblings diagnosed with LOAD across the United States. A description of these samples has been reported previously (Wijsman et al., 2011; Cruchaga et al., 2012; Fernández et al., 2017). We selected individuals for sequencing from families in which APOEε4 did not segregate with disease status, and in which the proband of the family did not carry any known mutation in APP, PSEN1, PSEN2, MAPT, GRN, or C9orf72 (described previously; Cruchaga et al., 2012).
ADSP Cohort
The Alzheimer's Disease Sequencing Project (ADSP) is a collaborative work of five independent groups across the USA that aims to identify new genomic variants contributing to increased risk for LOAD (https://www.niagads.org/adsp/content/home). During the discovery phase, ADSP generated whole genome sequence (WGS) data from members of multiplex LOAD families, and whole exome sequence (WES) data from a large case-control cohort. These data are available to qualified researchers through the database of Genotypes and Phenotypes (https://www.ncbi.nlm.nih.gov/gap Study Accession: phs000572.v7.p4).
The familial cohort of the ADSP consists of 582 individuals from 111 multiplex AD families from European-American, Caribbean Hispanic, and Dutch ancestry (details about the samples are available at NIAGADS). We downloaded raw data (.sra format) from dbGAP for 143 IDs (113 cases and 23 controls) from 37 multiplex families of European-American ancestry that were incorporated with the WUSM cohort.
Sequencing
Samples were sequenced using either whole-genome sequencing (WGS, 12%) or whole-exome sequencing (WES, 88%). Exome libraries were prepared using Agilent's SureSelect Human All Exon kits V3 and V5 or Roche VCRome (Table 2). Both WES and WGS samples were sequenced on a HiSeq2000 with paired end reads, with a mean depth of coverage of 50 × to 150 × for WES and 30 × for WGS. Alignment was conducted against GRCh37.p13 genome reference. Variant calling was performed separately for WES and WGS following GATK's 3.6 Best Practices (https://software.broadinstitute.org/gatk/best-practices/) and restricted to Agilent's V5 kit plus a 100 bp of padding added to each capture target end. We used BCFTOOLS (https://samtools.github.io/bcftools/bcftools.html) to decompose multiallelic variants into biallelic prior to variant quality control. Variant Quality Score Recalibration (VQSR) was performed separately for WES and WGS, and for SNPs and INDELs. Only those SNPs and indels that fell above the 99.9 confidence threshold, as indicated by WQSR, were considered for analysis; variants within low complexity regions were removed from both WES and WGS and variants with a depth (DP) larger than the average DP + 5 SD in the WGS dataset were removed. At this point SNPs and indels from WES and WGS datasets were merged into one file. Non-polymorphic variants and those outside the expected ratio of allele balance for heterozygosity calls (ABHet = 0.3–0.7) were removed. Additional hard filters implemented included quality depth (QD ≥ 7 for indels and QD ≥ 2 for SNPs), mapping quality (MQ ≥ 40), fisher strand balance (FS ≥ 200 for indels and FS ≥ 60 for SNPs), Strand Odds Ratio (SOR ≥ 10 for Indels and SOR ≥ 3 for SNPs), Inbreeding Coefficient (IC ≥ −0.8 for indels) and Rank Sum Test for relative positioning of reference vs. alternative alleles within reads (RPRS ≥ −20 for Indels and RPRS ≥ −8 for SNPs) (Figure S1). We used PLINK1.9 (https://www.cog-genomics.org/plink2/ibd) to remove variants that were out of Hardy Weinberg equilibrium (p < 1 × 10⁻⁶), with a genotype calling rate below 95%, with differential missingness between cases vs. controls, WES vs. WGS, or among different sequencing platforms (p < 1 × 10⁻⁶).
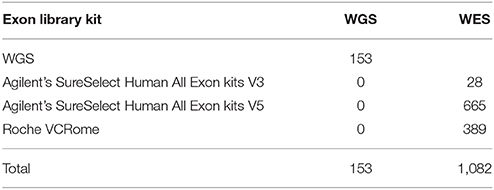
Table 2. Number of samples for which whole genome sequencing (WGS) or whole exome sequencing (WES) was performed, with detail of the exon library kits employed in this study.
Samples with more than 10% of missing variants (four samples) and whose genotype data indicated a sex discordant from the clinical database (three samples) were removed from the dataset. Individual and familial relatedness was confirmed using identity-by-descent (IBD) calculations, an existing GWAS dataset for these individuals, and the pedigree information. Because many of the ADSP families were also recruited from the NIA-LOAD repository there is a certain overlap (48 individuals) between the WUSM and the ADSP familial cohorts; we kept the duplicate that had better genotyping rate after QC. Principal Component Analysis (PCA) was calculated to corroborate ancestry and restrict our analysis to only samples from European American origin. Functional impact and population frequencies of variants were annotated with SnpEff (Cingolani et al., 2012). For this analysis, only SNVs with a minor allele frequency (MAF) below 1%, as registered in ExAC (Lek et al., 2016), were tested.
We excluded families carrying a known pathogenic mutation in any of the Mendelian genes for Alzheimer disease, Frontotemporal Dementia, or Parkinson disease (Fernández et al., 2017). We restricted the selection of families to those with at least one case and one control in the family, and we excluded any participants that were initially clinically diagnosed with AD but had a different diagnosis after pathological examination. Finally, our dataset consisted of 1,235 non-hispanic whites (NHW), 824 cases and 411 controls, from 285 different families (Table 1, Table S1). Of these 1,235 individuals, 1144 originated from WUSM and 91 were from ADSP.
Study Design and Analysis
The goal of this study was to test the performance and power of different gene-based family-based methods currently available, using a real dataset consisting of 1,235 non-hispanic white individuals from 285 families densely affected with AD. We created three different scenarios to test (Figure 2). First, using the real phenotype and pedigree structure from 25 of the 285 families, we generated a synthetic dataset with multiple variants and families with perfect segregation. Second, we evaluated different variant-combinations for the APOE gene. Third, we performed genome-wide gene-based analysis of only nonsynonymous SNPs with a MAF <1%. For each one of these scenarios we evaluated the performance of the different gene-based methods (collapsing, variance-component, and transmission disequilibrium) from the following family-based packages: SKAT (Wu et al., 2011), FSKAT (Yan et al., 2015), GSKAT (Wang et al., 2013), RVGDT (He et al., 2017), EPACTS (http://genome.sph.umich.edu/wiki/EPACTS), FarVAT (Choi et al., 2014), PedGene (Schaid et al., 2013), RareIBD (Sul et al., 2016). Some of these software offer the option to run different gene-based algorithms; e.g., GSKAT, EPACTS, FarVAT or PedGene can run collapsing and variance-component tests; therefore, we ran a total of 25 models (Table 3). The details of each one of these scenarios are described next.
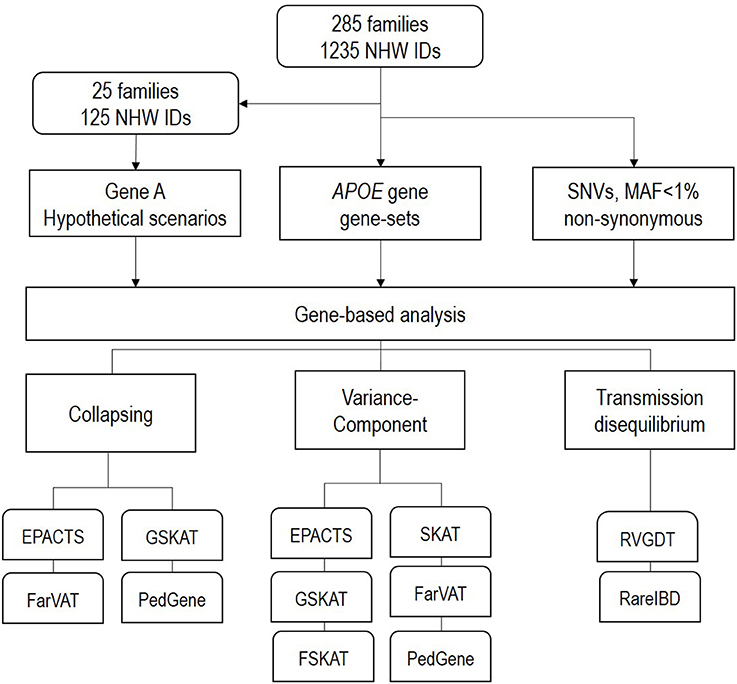
Figure 2. Schematic design of the analysis performed in this study.
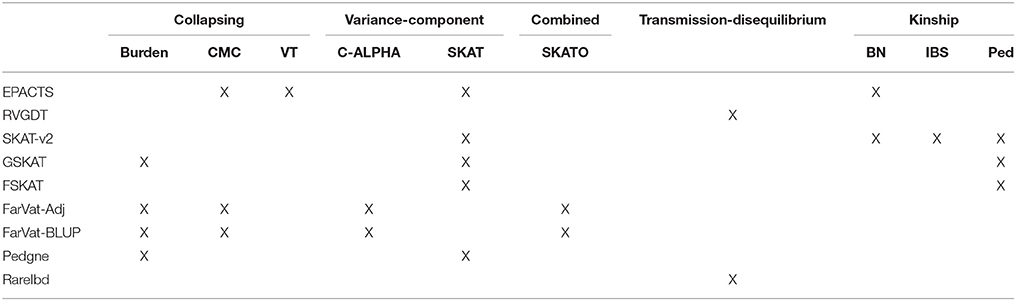
Table 3. Relationship of programs and models tested according to their main features and kinship matrix that they use.
Simulated Data
We selected 25 representative families from our entire dataset for which there were genotypic data for three to seven members (Table S2). We used the existing family structure and phenotypes of these families, and a simulated gene called “GENE-A” containing five variants. We generated several scenarios in which different numbers of families presented perfect segregation with disease status for a variant in GENE-A (Table 4, Table S2). First, we considered a scenario in which only the first five families of the dataset were included in the analyses and each family presented a different perfectly segregating variant of GENE-A [scenario 5 family carriers (FC) and 0 non-carriers (FNC): 5FC × 0FNC]. Second, we generated additional scenarios in which we kept the same five families as carriers of segregating variants in GENE-A, and added five (scenario 5FC × 5FNC), ten (scenario 5FC × 10FNC), 15 (scenario 5FC × 15FNC), and 20 (scenario 5FC × 20FNC) families that were not carriers of any variant in GENE-A. Then, we considered four scenarios of 25 families in which each new scenario added families who were carriers of a segregating variant in GENE-A. We started with the scenario 5FC × 20FNC, then we simulated 10 families who had carriers and 15 families who were non-carriers (scenario 10FC × 15FNC), 15 families with carriers and 10 families who were non-carriers (scenario 15FC × 10FNC), 20 families with carriers and five families who were non-carriers (scenario 20FC × 5FNC) and concluded with a scenario in which all 25 families were carriers of one out of the possible five segregating variants in GENE-A (scenario 25FC × 0FNC). We tested each of these scenarios with all previously mentioned gene-based methods and software to evaluate their power to associate perfect segregating variants with disease.
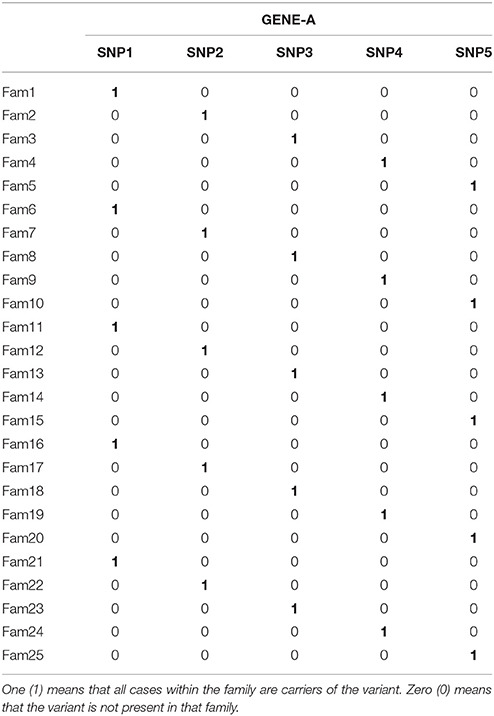
Table 4. Representation of the segregation pattern of the simulated gene.
Candidate Genes
APOE is the largest genetic risk factor for Alzheimer's disease. The allelic combination of two SNPs, rs429358 (APOE 4; 19:45411941:T:C), and rs7412 (APOE 2: 19:45412079:C:T), determines one of the three major isoforms of APOE protein, ε2, ε3, or ε4. The dosage of these isoforms determines a person's risk for AD, from having a protective effect in the cases of APOE ε2/ε2 (OR 0.6) or ε2/ε3 (OR 0.6) to different degrees of increased risk according to the number of copies of the ε4 allele (ε2/ε4, OR 2.6; ε3/ε4, OR 3.2; ε4/ε4, OR 14.9) (Farrer et al., 1997). We tested the power of all previously mentioned gene-based methods and software to detect the association of APOE gene with disease in our entire dataset (N = 1,235) under different conditions. We first tested all polymorphic variants (nonsynonymous with MAF <1%) in the APOE gene, next we tested only those variants considered to have a high or moderate effect on the protein including rs429358 and rs7412, then we tested high and moderate effect variants alone, and finally tested rs429358 and rs7412 alone.
Genome-Wide Analyses
We performed gene-based burden analyses on a genome-wide level in our entire dataset (families n = 285; samples N = 1,235) to evaluate the power of each of the previously described methods to detect novel genes significantly associated with disease; only single nucleotide variants (SNVs) with a minor allele frequency equal to or below 1% (MAF ≤ 1%), based on the EXAC dataset (Lek et al., 2016), and with a predicted high or moderate effect, according to SnpEff (Cingolani et al., 2012), were included in the analysis. Quantile-Quantile (QQ) plots from gene-based p-values were generated with the R package “ggplot2” (Wickham, 2009). We also evaluated the correlations between these methods using Pearson correlation (Pc) and Spearman correlation (Sc) tests of the log of the p-values using R v3.4.0 (R Core Team, 2017). Pc evaluates the linear relationship between two continuous variables whereas Sc evaluates the monotonic relationship between two continuous or ordinal variables.
Software Tested
An accompanying supporting file (Supplementary Material) provides a summary of the code employed to run each of the programs described below.
GSKAT
GSKAT (Wang et al., 2013) is among the first R packages developed with the goal of extending burden and kernel-based gene set association tests for population data to related samples with binary phenotypes. To handle the correlated or clustered structure in the family data, GSKAT fits a marginal model with generalized estimated equations (GEE). The basic idea of GEE is to replace the covariance matrix in a generalized linear mix model (GLMM) with a working covariance matrix that reflects the cluster dependencies. Accordingly, GSKAT blends the strengths of kernel machine methods and generalized estimating equations (GEE) to test for the associations between a phenotype and multiple variants in a SNP set. We ran GSKAT correcting for sex and first two PCs.
SKAT
The sequence kernel association test SKAT (Wu et al., 2011) is an R package initially designed for case-control analyses. Later they incorporated the Efficient Mixed-Model Association eXpedited (EMMAX) algorithm (Kang et al., 2010; Zhou and Stephens, 2012) which allows for performing family-based analyses. EMMAX simultaneously corrects for both population stratification and relatedness in an association study by using a linear mixed model with an empirically estimated relatedness matrix to model the correlation between phenotypes of sample subjects. The efficient application of the EMMAX algorithm depends on appropriate estimates of the variance parameters. Relatedness matrices can be calculated based on pedigree structure or estimated from genotype data. For the latter different methods have been proposed. Relatedness can be estimated using those alleles that have descended from a single ancestral allele, i.e., those that are Identical by Descent (IBD), or using the Balding-Nichols (BN) method (Balding and Nichols, 1995) which explicitly models current day populations via their divergence from an ancestral population specified by Wright's Fst statistic. We ran SKAT v1.2.1, in R v3.3.3, using the option SKAT_Null_EMMAX correcting for sex and first two PCs and we tested four different kinship matrices: pedigree, IBS, BN and a BN-based kinship matrix (HR) that the EPACTS software constructs (Table S3).
FSKAT
FSKAT (Yan et al., 2015), also an R package, is based on a kernel machine regression and can be considered an extension of the sequence kernel association tests (SKAT and famSKAT) for application to family data with dichotomous traits. FSKAT is based on a GLMM framework. Moreover, because it uses all family samples, FSKAT claims to be more powerful than SKAT which uses only unrelated individuals (founders) in the family data. FSKAT constructs a kinship matrix based on pedigree relationships using the R kinship library. We ran FSKAT correcting for sex and first two PCs.
EPACTS
Efficient and Parallelizable Association Container Toolbox (EPACTS) is a stand-alone software that integrates several gene-based statistical tests (CMC, VT, and SKAT) and adapts them to work with complex families by using EMMAX (https://genome.sph.umich.edu/wiki/EPACTS). EPACTS generates a kinship matrix based on the BN algorithm and also annotates the genotypic input file and offers filtering tools (frequency and predicted effect of variants) for easier user-selection of variants that go into gene-based analyses. Nonetheless, we used the same set of variants as in the other tests to run our analysis with EPACTS, correcting for sex and first two PCs.
FarVAT
The Family-based Rare Variant Association Test (FarVAT) (Choi et al., 2014) provides a burden and a variance component test (VT) for extended families and extends these approaches to the SKAT-O statistic. FarVAT assumes that families are ascertained based on the disease status if family members and compares minor allele frequencies between affected and unaffected individuals. FarVAT is implemented with C++ and is computationally efficient. Additionally, if genotype frequencies of affected and unaffected samples are compared to detect genetic associations, it has been shown that the statistical efficiency can be improved by modifying the phenotype; and so FarVAT uses prevalence (Lange and Laird, 2002) or Best Linear Unbalanced Predictor (BLUP) (Thornton and McPeek, 2007) as covariate to modify the genotype.
PedGene
PedGene (Schaid et al., 2013) is an R package that extends burden and kernel statistics to analyze binary traits in family data using large-scale genomic data to calculate pedigree relationships. To derive the kernel association statistic and the burden statistic for data that includes related subjects, they take a retrospective view of sampling with the genotypes considered random.
RVGDT
The Rare Variant Generalized Disequilibrium Test (RVGDT) (He et al., 2017), implemented with Python, differs from the previous methods presented. Instead of using a kernel method to evaluate variants, it uses the generalized disequilibrium test (GDT) which tests genotype differences in all discordant relative pairs to assess associations within a family (Chen et al., 2009). The rare-variant extension of GDT (RVGDT) aggregates a single-variant GDT statistic over a genomic region of interest, which is usually a gene (He et al., 2017). We ran RVGDT correcting for sex and first two PCs.
RareIBD
The developers claim RareIBD (Sul et al., 2016) to be a program without restrictions on family size, type of trait, whether founders are genotyped, or whether unaffected individuals are genotyped. The method is inspired by non-parametric linkage analysis and looks for rare variants with segregation patterns among affected and unaffected individuals that are different from the predicted distributions based on Mendelian inheritance and computes a statistic measuring the difference.
Results
Simulated Dataset
Results from the simulated dataset indicate that RVGDT, rareIBD, and collapsing-based methods (Burden, CMC, and CLP) provided more statistical power than the variance-component methods to detect associations of perfectly segregating variants with disease status (Table 5).
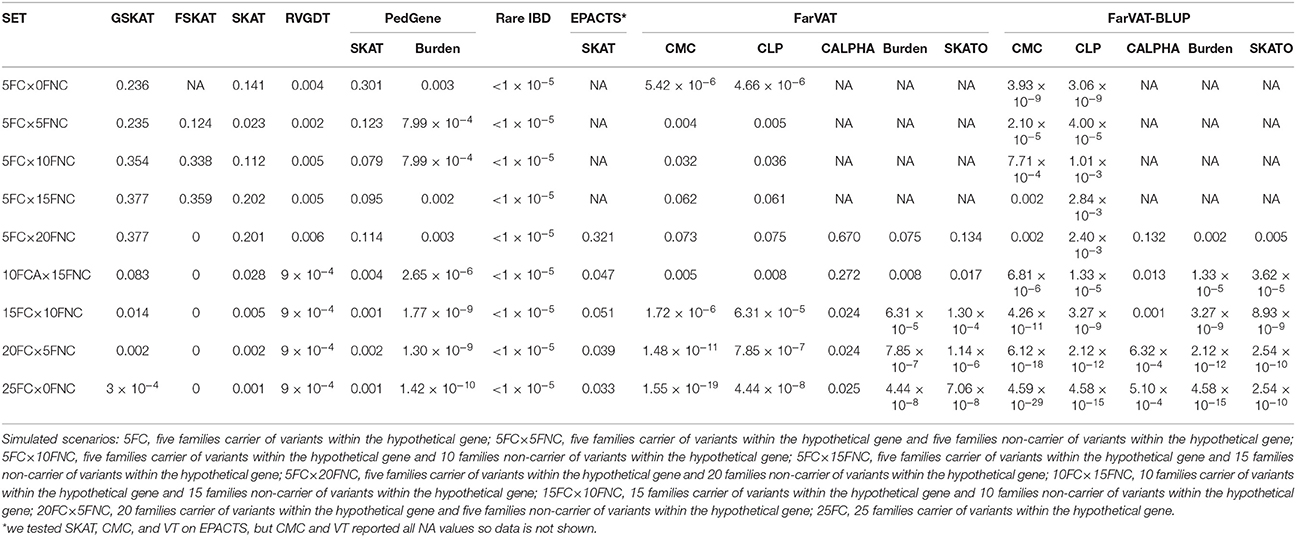
Table 5. Gene-based p-values for the simulated dataset under different scenarios for the gene-based methods tested in the subset of 25 families.
In a hypothetical scenario of five families in which each family presented perfect segregation with disease status for a different variant within the same gene (5FC × 0NFC), transmission-disequilibrium based methods evaluated this association as significant (even after multiple test correction; e.g., RVGDT p = 0.004; p-value after multiple test correction 0.004 × 9 = 0.036). RVGDT reached a ceiling p-value of 1 × 10⁻⁴; at 10 families with carriers (FC) plus 15 families of non-carriers (FNC). RVGDT was unable to produce a p < 9 × 10⁻⁴, therefore it is not possible to rank or determine the significance of genes that reach this limit. Similarly, RareIBD reports the same p-value for all simulated scenarios, which may be an artifact or a flaw of the program. Collapsing-based methods (Burden, CMC and CLP) started with significant p-values for the 5FC × 0NFC scenario, but as we added FNC in the analyses, the associations became less significant. Then as we increased the number of FC of segregating variants, the associations became more significant. In our analyses, most of the variance-component tests could not work with the scenarios containing only five families carrying the segregating variant; most of the tests only provided p-values once 25 families were included in the analyses (5FC × 20FNC). After that, as we increased the number of FC of segregating variants, the p-values became smaller. SKAT required 15FC × 10FNC to report nominally significant p-values, GSKAT required 20FC × 5FNC to report statistically significant p-values, FarVAT-CALPHA did not generate significant p-values unless we used the BLUP correction; FarVAT SKATO reported p-values that were significant at 15FC × 10FNC, and at 5FC × 20FNC if we used the BLUP correction. P-values from EPACTS-SKAT were not statistically significant after multiple test correction. FSKAT did not deal well with perfectly segregating scenarios; it did not provide p-values for a scenario of only five families all carriers of the segregating variant (5FC × 0FNC–FSKAT p-value = NA), and after five families carrying a segregating variant, the program saturated giving no p-value.
Overall, Transmission-disequilibrium tests and collapsing tests were the models that identified the simulated segregating variants as associated with the phenotype; the CMC model provided by FarVAT-BLUP was the one providing most genome-wide significant p-values, even in the 5FC × 0FNC scenario.
Candidate Genes-APOE
We examined the performance of four gene-sets generated for the APOE gene with the 22 family-based gene-based methods in our entire familial cohort. Neither the entire set of polymorphic variants (set “gene” in Table 6) nor the set including only rare nonsynonymous variants (set “HM” in Table 6) confer risk for these families. The association seems to be driven by the common APOE ε2 and ε4 variants, since only when these were included, either alone (set “ε2ε4” in Table 6) or in conjunction with the rest of the rare nonsynonymous variants (set “HM-ε2ε4” in Table 6) did most of the tests yield a significant p-value (after multiple test correction). Only EPACTS-SKAT did not report the APOE ε2 and ε4 variants as significantly associated, after multiple test correction, within our dataset (Table 6). The most significant association for APOE ε2 and ε4 variants was reported by FarVAT-CMC test.
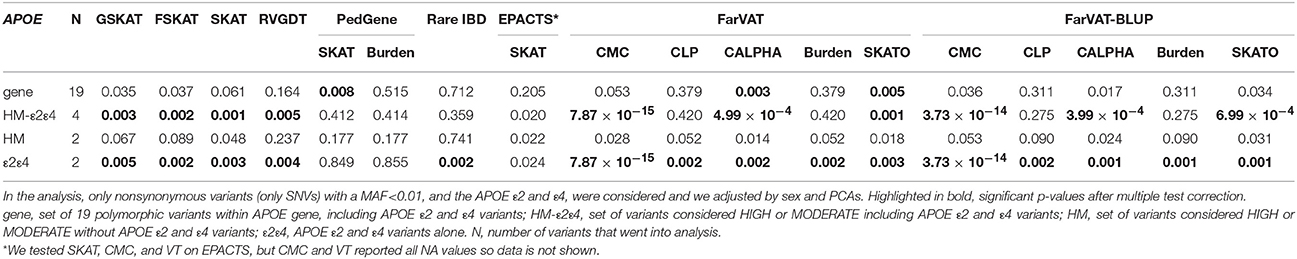
Table 6. Gene-based p-values for the APOE gene under different gene-set scenarios for the gene-based methods tested in the entire dataset (N = 1235, 285 families).
Genome-Wide Analyses
Overall, we examined eight software and over 22 algorithms for genome-wide association analyses in our extended family dataset of 285 families and 1,235 non-hispanic white individuals. We only included in the analyses nonsynonymous SNPs with a MAF ≤ 1% and we corrected for sex and first two PCs. All 22 algorithms were run using the same input data. The results for these 22 algorithms are described, grouped per category, in the following sections. First, we compare the correction effect provided by four kinship matrices (Figure 3A). Second, we compare the performance of nine variance-component software and algorithms (Figure 3B). Third is the comparison of eight collapsing software and algorithms. Fourth, we compare two transmission-disequilibrium tests. We conclude the results section by providing a summary of the pros and cons encountered while running these methods. Overall, most of the results from the gene-based methods tested seemed quite deflated. Only PedGene, FarVAT and Rare-IBD seemed to provide values closer to or above the expected under the null hypothesis. The most efficient in terms of power and p-value inflation appears to be FarVAT with BLUP correction.
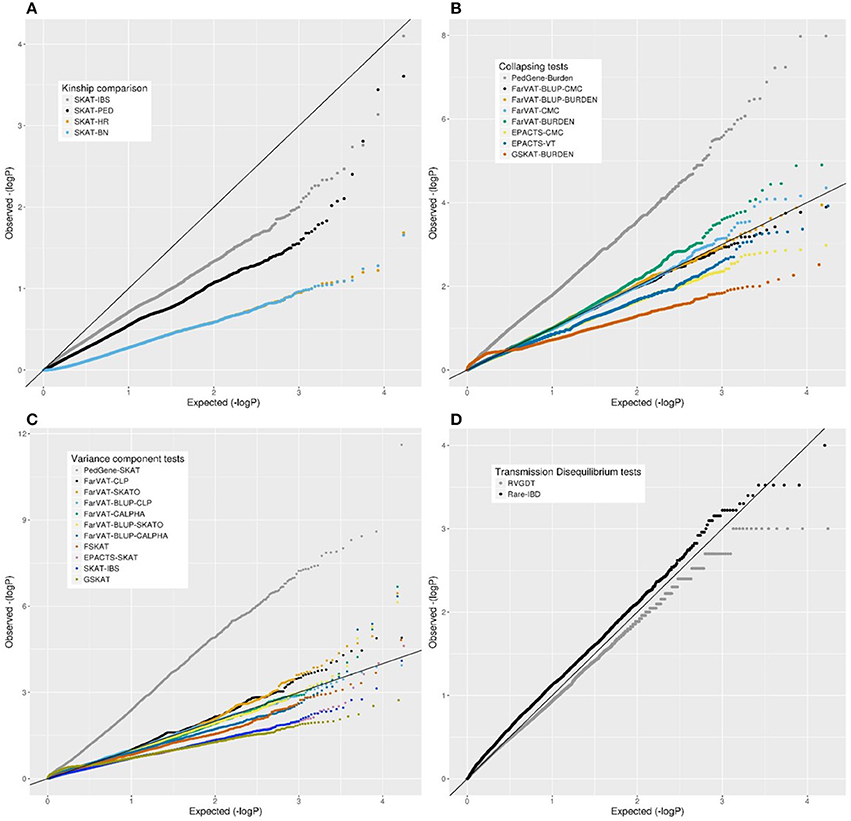
Figure 3. Quantile-quantile (QQ) plots from different family-based gene-based methods for all nonsynonymous variants with a MAF <1% in our family-based dataset. (A) Comparison of SKAT test using different kinship matrices: pedigree calculation (PED), Identity By Similarity (IBS) estimation, Balding-Nichols (BN) estimation, and the kinship generated by EPACTS (HR). (C) Comparison of different collapsing tests: GSKAT, EPACTS, FarVAT, and PedGene. (B) Comparison of different variance-component gene-based methods: GSKAT, FSKAT, SKAT, EPACTS, FarVAT, and PedGene. (D) Comparison of transmission disequilibrium tests: RVGDT and RareIBD.
Kinship Matrices
We tested the correction provided by four kinship matrices using the SKAT method with EMMAX correction implemented in the R package SKATv2. The four kinship matrices tested were pedigree calculation (PED), Identity By State (IBS) estimation, Balding-Nichols (BN) estimation, and the kinship generated by EPACTS (HR) which is also based on the BN algorithm (Figure 3A). Table S3 offers a comparison of these kinships for FAM#1 and FAM#2 of our simulated dataset. For these analyses, we ran the SKAT-EMMAX method in our entire dataset, gene-wide, and calculated a QQ plot and inflation factor (λ) to obtain a general ideal of the behavior of each matrix. Matrices based on the BN algorithm seemed to have a similar performance (SKAT-BN λ = 0.038, SKAT-HR λ = 0.039, Table 7) though their concordance was lower than expected considering they are based on the same algorithm [Pearson correlation (Pc) = 0.85; Spearman correlation (Sc) = 1]. Although the PED matrix generates a more restrictive correction than the IBS matrix (SKAT-PED λ = 0.36, SKAT-IBS λ = 0.67, Table 7), these two tests have a similar overall performance as the p-values for the different genes were highly correlated (Pc = 0.97; Sc = 0.98), making the PED matrix a good surrogate for the IBS matrix. Finally, there were clear performance differences between the BN-type matrices (BN and HR) and the IBS-type matrices (IBS and PED), exemplified by the different top candidate genes (NR1D1 for BN-type matrices and CHRD for IBS-type matrices) and by the correlation algorithms (SAKT-IBS vs. SKAT-BN Pc = 0.8; Sc = 0.89). Overall, we found that the IBS matrix provided the best balance between covariance-correction and overcorrection in our dataset.
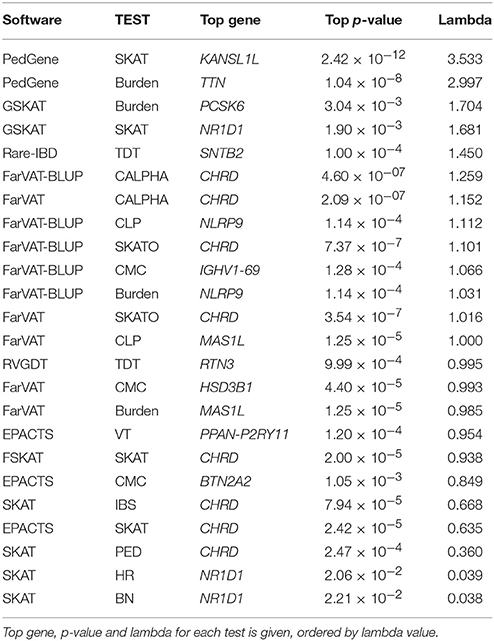
Table 7. Top results for all gene-based methods tested.
Collapsing Tests
The collapsing methods tested from four different software (PedGene, FarVAT, EPACTS and GSKAT) were Burden, CMC, and VT (Figure 3C). To compare the different tests we followed a similar approach as above, ran the different software with the same imputed file, and compared the λ.
In our analyses, the burden test by GSKAT presented the most deflated values; though the lambda does not illustrate this (GSKAT-Burden λ = 1.71, Table 7) because of the initial inflation among the low or non-significant genes. EPACTS-CMC (λ = 0.85) and EPACTS-VT (λ = 0.95) provided values closer to the expected, and although their QQ-plots appear to follow a similar trend, their correlation is low (Pc = 0.54; Sc = 0.68) and they reported different top genes. The Burden and CMC methods by FarVAT and FarVAT-BLUP provided p-values closest to the expected (FarVAT-Burden λ = 0.98; FarVAT-CMC λ = 0.99, FarVAT-BLUP-Burden λ = 1.03; FarVAT-BLUP-CMC λ = 1.07). The correlation for the gene p-values was higher between results generated by the same method (FarVAT-BLUP-CMC vs. FarVAT-BLUP-Burden Pc = 0.99; Sc = 0.96; FarVAT-CMC vs. FarVAT-Burden Pc = 0.98; Sc = 0.97) than between results generated using the same algorithm (FarVAT-BLUP-CMC vs. FarVAT-CMC Pc = 0.88; Sc = 0.8; FarVAT-BLUP-Burden vs. FarVAT-Burden Pc = 0.85; Sc = 0.77). PedGene in the burden model was the software that provided the most significant p-values; however, these were clearly inflated compared to the predicted p-values (Pedgene-Burden λ = 2.99, Table 7) and the results were not correlated with any other Collapsing test (Pc and Sc values < 0.1).
Variance Component Tests
This subset included all the Variance component-based methods available, CLP, CALPHA and SKAT, from six different software: PedGene, FarVAT, FSKAT, EPACTS, SKAT, and GSKAT (Figure 3C). GSKAT was the software that reported more deflated values, though the lambda does not illustrate this (GSKAT-SKAT λ = 1.681, Table 7) because of the initial inflation among the low or non-significant genes. GSKAT was followed by SKAT and EPACTS which showed similar λ and performance-values for each gene (Pc = 0.8, Sc = 0.8, Figure 4). The CLP, CALPHA, and SKATO methods by FarVAT and FarVAT-BLUP provided p-values closest to the expected (FarVAT-CLP λ = 1.00; FarVAT-CALPHA λ = 1.15; FarVAT-SKATO λ = 1.02, FarVAT-BLUP-CLP λ = 1.11; FarVAT-BLUP-CALPHA λ = 1.26; FarVAT-BLUP-SKATO λ = 1.10). FarVAT-CALPHA, FarVAT-SKATO, FarVAT-BLUP-CALPHA and FarVAT-BLUP-SKATO reported the same top candidate gene (CHRD) (Table 7), though the overall p-value correlation was lower than expected considering they are based on the same algorithm (FarVAT-SKATO vs. FarVAT-BLUP-SKATO Pc = 0.6, Sc = 0.7; FarVAT-CALPHA vs. FarVAT-BLUP-CALPHA Pc = 0.82 Sc = 0.82, Figure 4). On the other hand, despite the fact that FarVAT-CLP and FarVAT-BLUP-CLP had higher correlation (Pc = 0.85, Sc = 0.77), these two tests reported different top genes (FarVAT-CLP top gene is MAS1L, and FarVAT-BLIP-CLP top gene is NLRP9). PedGene in the SKAT model was the software that provided the most significant p-values, but these were clearly inflated (Pedgene-SKAT λ = 3.53, Table 7) and its correlation with other variance component tests was low to null (Pc and Sc values < 0.2).
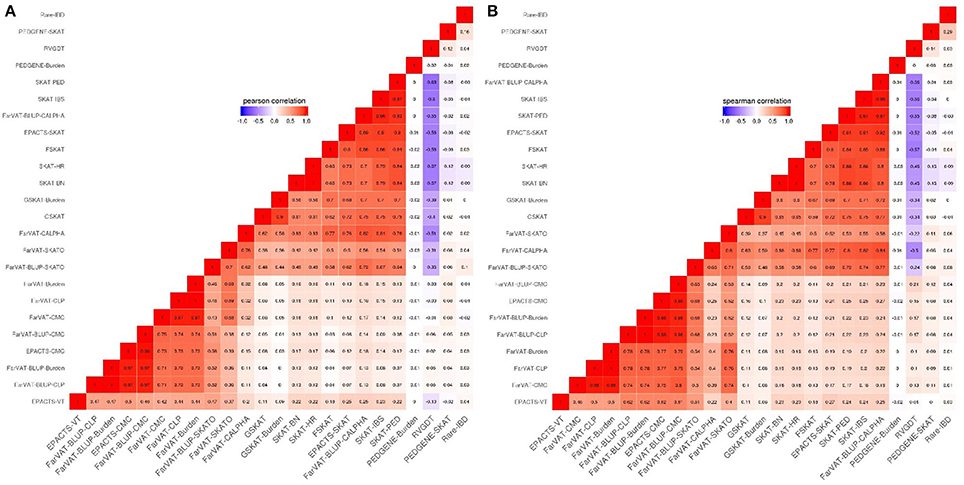
Figure 4. Correlation plots from different family-based gene-based methods for genes with a p ≤ 0.005. (A) Pearson correlation correlates genes according to their p-values. (B) Spearman correlation correlates genes according to their rankings.
Transmission Disequilibrium Tests
We tested two transmission disequilibrium tests, RVGDT and Rare-IBD, which were designed to account for large extended families of arbitrary structure (Figure 3D). Of these two, RVGDT was the test that more closely approached the expected under the null (λ = 0.99), whereas Rare-IBD provided slightly inflated p-values (λ = 1.450, Table 7). The correlation between these two methods was very low (Pearson correlation = 0.23, Spearman correlation = 0.17). A common issue with both methods was that we observed some stratification toward more significant p-values which made it difficult to determine a top significant gene.
Pros and Cons of the Different Gene-Based Methods
Among all the methods tested, EPACTS and FarVAT are the most user-friendly, time-efficient and versatile software. EPACTS is an all-in-one package that annotates the input file, generates the kinship matrix and performs gene-based analysis under different conditions (minor allele frequency and predicted functionality of the variant) with only tag specification. In addition, the program can be run on a genome-wide basis or at a smaller scale given genes or regions specified by the user. FarVAT can generate the kinship matrix by either using the pedigree relationships or using the genetic relationship among individuals. It does not annotate the input file and requires that the user provide their own set of genes and variants per gene to analyze; it allows the user to choose between BLUP or prevalence to estimate and incorporate random effects on the phenotype. FarVAT has initial conditioning that only takes founder-based MAF, so when a genetic variant only has minor alleles in non-founders (offspring) these numbers will not be counted. This is a big limitation with respect to the other programs that take into account all variants regardless of their presence in founders or not. Since we only had genetic data for siblings for many of our families, so no genetic data for founders, we ran FarVAT with the “–freq all” option so that all variants would be included regardless if they were present in founders or not.
FSKAT, GSKAT, and SKAT require some R knowledge from the user, and are less flexible. For FSKAT and GSKAT the user has to provide a genotype, a phenotype, and a gene-set file. For SKAT the user has to additionally provide the kinship matrix. Because these programs were designed to run on a per gene basis, these take longer computational time to be run on a genome-wide level than EPACTS or FarVAT, even if the user parallelizes computation. PedGene is also an R package that requires a genotype, a phenotype file with complete pedigree information (to generate the kinship matrix), and a gene-set file. PedGene provides phenotype adjustment by logistic regression on the trait of interest, but it does not allow for extra covariates, which prohibits correction by multiple PCs or other variables. RVGDT is a Python based program, quite user-friendly since it is operated with simple command-line but is limited in its options. Similar to FSKAT, GSKAT, and SKAT, it is designed to be run on a per-gene basis for which loops and parallelization have to be set up for genome-wide testing. The same applies to RareIBD which requires a genotype, a phenotype, and a Kinship coefficient file for each gene that the user wants to test. For each gene the program first computes statistics for each founder within each family and then calculates the gene-based p-value. The first step of this process can easily take between 3 and 5 min for families with < 100 individuals; hence, the overall time for one gene is directly dependent on the number of families and the time required for a genome-wide analysis is proportional to the number of genes being tested. Although it is possible to parallelize the jobs using a high-performance cluster (if available) this program is the slowest of all tested.
One of the major drawbacks we found is that some of these programs do not accept missing data (FSKAT or RareIBD) or will not generate a p-value if the gene set contains only one variant (GSKAT, PedGene or FarVAT). FSKAT does not accept missing data, and although it calculated p-values for genes that only have one informative SNP (one-SNP-gene), there were at least 75 (3.26%) of 2,154 one-SNP-genes for which the returned p-value was “2.” GSKAT did not provide p-values for more than 1,875 one-SNP-genes. PedGene also had trouble generating p-values for 44 one-SNP-genes out of a total of 1,916 singletons. FarVAT did not generate p-values for the one-SNP-genes using the Burden and SKATO models but it did generate p-values using the CMC and CLP models for the same 1,875 one-SNP-genes.
Candidate Genes for FASe Project
Our results indicate that transmission disequilibrium tests identify genes that have a Mendelian behavior, whereas collapsing and variance-component tests identify genes that confer risk for disease. Therefore, we decided to combine and compare results from all approaches to identify the genes with most consistent results (Table 8).
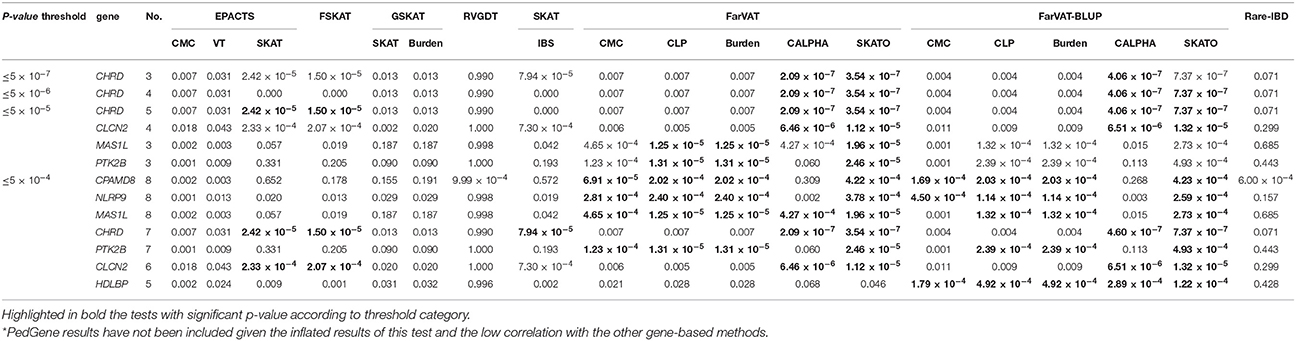
Table 8. Most frequent genes, within p-value threshold category, across the different gene-based family-based methods tested*.
PedGene provided the most significant p-values for NTN5 (Pedgene-Burden p = 5.80 × 10⁻⁸; PedGene-SKAT p = 1.26 × 10⁻⁸) and ANKRD42 (PedGene-Burden p = 3.62 × 10⁻⁷; PedGene-SKAT p = 1.16 × 10⁻⁷). However, the inflated p-values observed and low correlation with any of the other software tested using the same algorithms makes us suspicious of the validity of these results.
CHRD was the gene with the third most significant p-value. CHRD had a p ≤ 5 × 10⁻⁷ in three different models (FarVAT-CALPHA, FarVAT-SKATO, and FarVAT-BLUP-CALPHA). Additionally, as we lowered the considered p-value threshold, we found that more tests identified CHRD as a potential candidate gene associated with AD. When we lowered the threshold to suggestive genome-wide p-value (p ≤ 5 × 10⁻⁴) we found that seven different models identified CHRD as significantly associated with AD. Following the same method we found that CLCN2, MAS1L, and PTK2B had p ≤ 5 × 10−05 in at least three tests, and if we lowered the threshold to ≤ 5 × 10⁻⁴ p-value, these genes were identified as significant by at least three additional tests.
Among genes with a p ≤ 5 × 10−04; CPAMD8 was identified by at least nine gene-based methods (FarVAT, FarVAT-BLUP, and PedGene). The exact p-value for CPAMD8 could not be estimated by RVGDT as it reported a p-value of 9 × 10−04, which is the most significant p-value reported by this test. Therefore, we cannot conclude that CPAMD8 presented a p-value ≤ 5 × 10−04 by RVGDT. CHRD, CLCN2, MAS1L, PTK2B, and CPAMD8, NLRP9, and HDLBP were also potential novel candidate genes for familial LOAD as they had p ≤ 5 × 10−04 using at least five or more tests (Table 8).
Since these were identified by multiple gene-based methods, we wanted to determine whether any of these seven candidate genes are involved in known AD pathways. Common variants in PTK2B have been associated with AD risk at a genome-wide level (Lambert et al., 2013). Our results indicate there are additional low-frequency and rare nonsynonymous variants in PTK2B that are associated with AD risk in late-onset families.
We used the GeneMANIA (http://pages.genemania.org/) algorithm on the seven candidate genes (CHRD, MAS1L, PTK2B, CPAMD8, NLRP9, CLCN2, and HDLBP) and known AD-related genes (APP, PSEN1, PSEN2, APOE, TREM2, PLD3, and ADAM10) which are involved in some pathways important in AD (APP-metabolism and immune response). GeneMANIA looks for relationships among a list of given genes by searching within multiple publicly available biological datasets. These datasets include protein-protein, protein-DNA and genetic interactions, pathways, reactions, gene and protein expression data, protein domains and phenotypic screening profiles. We found that our candidate genes have genetic interactions and co-localization with known AD genes. CHRD and PTK2B are involved in “regulation of cell adhesion” like ADAM10; PTK2B is involved in “regulation of neurogenesis” like APOE and “perinuclear region of cytoplasm” like APP, PSEN1 and PSEN2. Finally, CLCN2 and PTK2B are connected through “regulation of ion transport” (Figure 5).
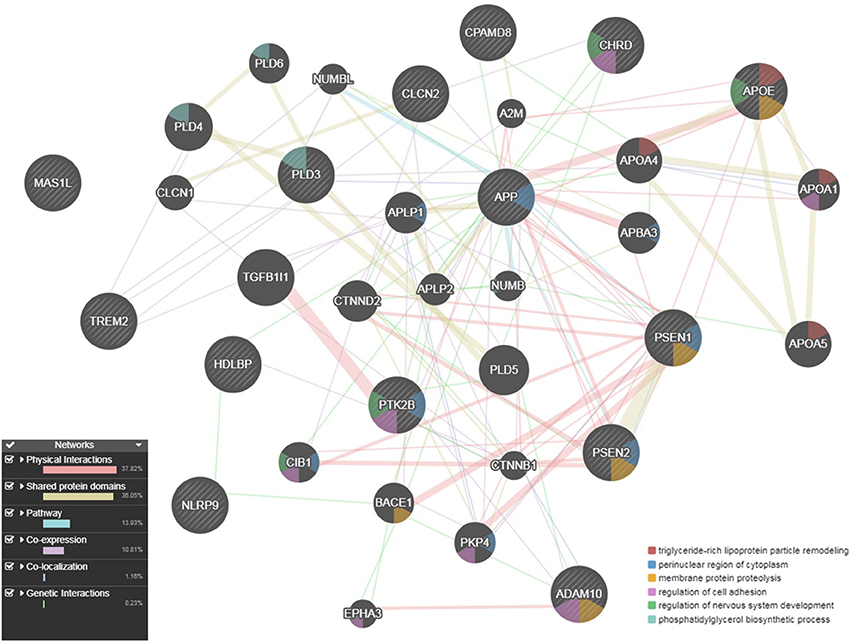
Figure 5. Gene network for the seven candidate genes (CHRD, CLCN2, CPAMD8, HDLBP, MAS1L, NLRP9, and PTK2B) with multiple evidence of a p ≤ 5 × 10−04, anchored with known AD genes (APP, PSEN1, PSEN2, APOE, TREM2, ADAM10, and PLD3), as described by GeneMANIA.
Discussion
The missing heritability in AD, and in many complex diseases, may be found in very rare variants for which discovery will require either large datasets (e.g., the ADSP Discovery Phase which has over 10,000 sequenced individuals) or datasets enriched for rare variants (such as families with history of AD). In this study, we present the most comprehensive performance analyses of multiple gene-based methods using 285 families with AD. Some of the current methods available are underpowered or too restrictive to detect genes significantly associated with this disease (Figure 4). Results from our simulated data (Table 5) show that only certain highly-restricted scenarios provide gene-wide significant p-values in family-based analyses; whereas similar scenarios in a case-control study would result in gene-wide p-values. To circumvent this power issue, we relied on the combination of multiple evidence toward the same gene.
One key aspect to adapt gene-based analyses to a family-based context is to account for population stratification and hidden relatedness that may appear due to the inherent nature of family datasets. To take into account this issue, gene-based algorithms must incorporate kinship matrices to model the relationships among samples. Therefore, an appropriate estimate of the kinship matrix is of utmost importance. In this work we show how different relationship matrices influence results. We tested the three most common types of kinship matrix, pedigree reconstruction (PED), identity by state (IBS), and Balding-Nichols (BN). We show that for a situation of complex incomplete families, correction using PED or BN matrices will lead to an overcorrection of the relationships decreasing the power of these tests (Table 7, Figure 4A).
In order to choose the best gene-based algorithm for analysis, it is important to take into account the nature (impact and directionality) of the variants that are being included in the test. Collapsing tests are powerful when a large proportion of variants are causal and the effects are in the same direction. Variance-component tests are supposed to be more powerful than collapsing tests because they allow for admixture of risk and protective variants within the region being tested (Ionita-Laza et al., 2013). It is not practical to account for the nature of the variants included in each gene-set, and the true disease model is unknown and variable; hence, omnibus or combined tests such as SKAT-O would be desirable for genome-wide studies (Lee et al., 2012). However, most family-based methods do not incorporate the SKAT-O algorithm, except FarVAT. Therefore, the best approach to perform genome-wide rare variant discovery is to combine different algorithms and look for common signatures across the tests performed. Nonetheless, we are aware that running all available tests is a time-consuming task that requires additional expertise and resources. In our analyses FarVAT, with the BLUP adjustment, provide the best results in terms of significant p-values and minor inflation, for genome-wide gene-based analysis; it is a fast software that provides results from multiple tests at the same time. The R version of SKAT or EPACTS would be alternatively valid choices, taking into account that these overcorrect and the p-value threshold should be lowered.
In this study, we identified CHRD as a candidate gene with a genome-wide significant p-value (5 × 10−07) reported by three tests, and another six genes that had a suggestive genome-wide p < 5 × 10−04 in at least five, and up to nine, of the different test performed: CLCN2, CPAMD8, HDLBP, MAS1L, NLRP9, and PTK2B. Additionally, these genes seem to have direct and indirect interactions (genetic interaction, co-localization or shared function) with known AD genes (APP, PSEN1, PSEN2, APOE, TREM2, PLD3, and ADAM10).
CHRD, chordin, is a highly-conserved developmental protein which inhibits the ventralizing activity of bone morphogenetic proteins, is active during gastrulation, expressed in fetal and adult liver and cerebellum, and is associated with Cornelia de Lange syndrome (Smith et al., 1999). CLCN2, chloride voltage-gated channel 2, has several functions including the regulation of cell volume: membrane potential stabilization, signal transduction and transepithelial transport. It has been associated with different epilepsy modes (Saint-Martin et al., 2009; Cukier et al., 2014) and leukoencephalopathy (Gaitán-Peñas et al., 2017). CHRD and CLCN2 show co-expression which could be due to their close proximity, both belong to a gene cluster at 3q27. Interestingly, CLCN2 shows co-expression with TREM2 which, other than being an AD risk gene, is known to cause leukoencephalopathy in PLOSL (polycystic lipomembranous osteodysplasia with sclerosing leukoencephalopathy), also known as Nasu-Hakola disease.
PTK2B, Protein Tyrosine Kinase 2 Beta, was described as an AD risk locus in the largest GWAS meta-analysis conducted to date (Lambert et al., 2013), and later corroborated by others (Beecham et al., 2014; Wang et al., 2015). The protein encoded by PTK2B is a member of the focal adhesion kinase (FAK) family that can be activated by changes in intracellular calcium levels, which are disrupted in AD brains. Its activation regulates neuronal activity such as mitogen-activated protein kinase (MAPK) signaling (Rosenthal and Kamboh, 2014). PTK2B could also be involved in hippocampal synaptic function (Lambert et al., 2013). Although there is no co-expression or genetic interaction between CLCN2 and PTK2B, both are involved in regulation of ion transport. Additionally, PTK2B is involved in regulation of lipidic metabolic processes like APOE, a cholesterol-related gene. Although no association has yet been reported between APOE and HDLBP, the High-Density Lipoprotein Binding Protein, the latter plays a role in cell sterol metabolism, protecting cells from over-accumulation of cholesterol, which has been reported as risk factor for atherosclerotic vascular diseases.
CPAMD8, C3 and PZP Like, Alpha-2-Macroglobulin Domain Containing 8, has been previously associated with neurological conditions other than AD. Common variants in CPAMD8 were found among top markers associated with multiple sclerosis (Baranzini et al., 2009). Missense and frameshift variants in CPAMD8 were identified in three families affected with Anterior Segment Dysgenesis (Cheong et al., 2016). According to the UKBiobank PheWeb (http://pheweb.sph.umich.edu:5000/), CPAMD8 has a 2.9 × 10⁻⁹ p-value for its association with AD. We did not find any shared pathway between CPAMD8 and known AD genes in the GeneMANIA network, even though it seems to have a genetic interaction with APP (Lin et al., 2010). In our study CPAMD8 was identified as a candidate gene (with p < 1 × 10⁻⁴) for AD by at least nine gene-based methods from different software, and we found that several variants within this gene had varying degrees of segregation in more than twenty families. Variant p.(Ser1103Ala) segregates with disease status in two families with two and three carriers respectively, and is present in another two families. Variant p.(His465Arg) segregates with disease status in five families with two or three carriers per family and is present in another 11 families. Variant p.(Arg1380Cys) is private to a family with three carriers, p.(Ala1492Pro) is private to a family with five carriers, and p.(Val521Met) is private to a family with three carriers.
MAS1L, MAS1 Proto-Oncogene Like, is a G Protein-Coupled Receptor. Members of this family of membrane proteins are activated by a wide spectrum of ligands and modulate the activity of different signaling pathways in a ligand-specific manner. Aly et al. (2008) described polymorphisms in the region of the UBD/MAS1L genes that are associated with type-1 diabetes.
The immune system and the integrity of the blood-brain barrier are key factors for Alzheimer disease. NLRP9, NLR Family Pyrin Domain Containing 9, has been involved in inflammation response. Nyúl-Tóth et al. (2017) found NLRP9 expressed in cerebral endothelial cells and, at much lower levels, in brain pericytes; and another member of the NLP family (NLRP1) has been associated with AD (Pontillo et al., 2012).
We have reviewed more than 22 algorithms from eight different software available for gene-based analyses in complex families. After a thorough examination of the performance of these tests under different scenarios, we present a methodology to identify genes associated with the studied phenotype. We have applied this methodology to 285 European-American families affected with late onset Alzheimer disease (LOAD) and we identified six candidate genes with suggestive or genome-wide significant p-values across different software and algorithms. Based on the consistency of our results, we are confident that some of these genes may play a role in AD pathology and therefore are of interest to follow up in replication and functional studies.
Author Contributions
MF performed processing and quality control of data, implementation of software and statistical analysis; participated in study design, interpretation of results and wrote the manuscript. JB contributed to data collection, processing and quality control. JB, JD-A, LI, YD, and OH contributed on software implementation and interpretation or results. JN, JM, and AG contributed to study participant recruitment and sample collection. CC collected data, participated in study design, interpretation of results and revision of manuscript. All the authors read and provided input to the manuscript.
Funding
This work was supported by grants from the National Institutes of Health (R01-AG044546, P01-AG003991, and RF1-AG053303), the Alzheimer Association (NIRG-11-200110, BAND-14-338165 and BFG-15-362540) and the JPB Foundation. The recruitment and clinical characterization of research participants at Washington University were supported by NIH P50-AG05681, P01-AG03991, and P01-AG026276. Samples from the National Cell Repository for Alzheimer's Disease (NCRAD), which receives government support under a cooperative agreement grant (U24-AG21886) awarded by the National Institute on Aging (NIA), were used in this study. NIALOAD samples were collected under a cooperative agreement grant (U24-AG026395) awarded by the National Institute on Aging.
We thank the Genome Technology Access Center in the Department of Genetics at Washington University School of Medicine for help with genomic analysis. The Center is partially supported by NCI Cancer Center Support Grant #P30 CA91842 to the Siteman Cancer Center and by ICTS/CTSA Grant# UL1TR000448 from the National Center for Research Resources (NCRR), a component of the National Institutes of Health (NIH), and NIH Roadmap for Medical Research. This work was supported by access to equipment made possible by the Hope Center for Neurological Disorders and the Departments of Neurology and Psychiatry at Washington University School of Medicine.
Conflict of Interest Statement
The authors declare that the research was conducted in the absence of any commercial or financial relationships that could be construed as a potential conflict of interest.
Acknowledgments
We thank contributors who collected samples used in this study, as well as patients and their families, whose help and participation made this work possible. Members of the National Institute on Aging Late-Onset Alzheimer Disease/National Cell Repository for Alzheimer Disease (NIA-LOAD NCRAD) Family Study Group include the following: Richard Mayeux, M.D., M.Sc., Martin Farlow, M.D., Tatiana Foroud, Ph.D., Kelley Faber, M.S., Bradley F. Boeve, M.D., Neill R. Graff-Radford, M.D., David A. Bennett, M.D., Robert A. Sweet, M.D., Roger Rosenberg, M.D., Thomas D. Bird, M.D., CC, and Jeremy M. Silverman, Ph.D.
The Alzheimer's Disease Sequencing Project (ADSP) is comprised of two Alzheimer's Disease (AD) genetics consortia and three National Human Genome Research Institute (NHGRI) funded Large Scale Sequencing and Analysis Centers (LSAC). The two AD genetics consortia are the Alzheimer's Disease Genetics Consortium (ADGC) funded by NIA (U01 AG032984), and the Cohorts for Heart and Aging Research in Genomic Epidemiology (CHARGE) funded by NIA (R01 AG033193), the National Heart, Lung, and Blood Institute (NHLBI), other National Institute of Health (NIH) institutes and other foreign governmental and non-governmental organizations. The Discovery Phase analysis of sequence data is supported through UF1AG047133 (to Drs. Schellenberg, Farrer, Pericak-Vance, Mayeux, and Haines); U01AG049505 to Dr. Seshadri; U01AG049506 to Dr. Boerwinkle; U01AG049507 to Dr. Wijsman; and U01AG049508 to AG and the Discovery Extension Phase analysis is supported through U01AG052411 to AG, U01AG052410 to Dr. Pericak-Vance and U01 AG052409 to Drs. Seshadri and Fornage. Data generation and harmonization in the Follow-up Phases is supported by U54AG052427 (to Drs. Schellenberg and Wang).
The ADGC cohorts include: Adult Changes in Thought (ACT), the Alzheimer's Disease Centers (ADC), the Chicago Health and Aging Project (CHAP), the Memory and Aging Project (MAP), Mayo Clinic (MAYO), Mayo Parkinson's Disease controls, University of Miami, the Multi-Institutional Research in Alzheimer's Genetic Epidemiology Study (MIRAGE), the National Cell Repository for Alzheimer's Disease (NCRAD), the National Institute on Aging Late Onset Alzheimer's Disease Family Study (NIA-LOAD), the Religious Orders Study (ROS), the Texas Alzheimer's Research and Care Consortium (TARC), Vanderbilt University/Case Western Reserve University (VAN/CWRU), the Washington Heights-Inwood Columbia Aging Project (WHICAP) and the Washington University Sequencing Project (WUSP), the Columbia University Hispanic-Estudio Familiar de Influencia Genetica de Alzheimer (EFIGA), the University of Toronto (UT), and Genetic Differences (GD).
The CHARGE cohorts are supported in part by National Heart, Lung, and Blood Institute (NHLBI) infrastructure grant HL105756 (Psaty), RC2HL102419 (Boerwinkle) and the neurology working group is supported by the National Institute on Aging (NIA) R01 grant AG033193. The CHARGE cohorts participating in the ADSP include the following: Austrian Stroke Prevention Study (ASPS), ASPS-Family study, and the Prospective Dementia Registry-Austria (ASPS/PRODEM-Aus), the Atherosclerosis Risk in Communities (ARIC) Study, the Cardiovascular Health Study (CHS), the Erasmus Rucphen Family Study (ERF), the Framingham Heart Study (FHS), and the Rotterdam Study (RS). ASPS is funded by the Austrian Science Fond (FWF) grant number P20545-P05 and P13180 and the Medical University of Graz. The ASPS-Fam is funded by the Austrian Science Fund (FWF) project I904),the EU Joint Programme-Neurodegenerative Disease Research (JPND) in frame of the BRIDGET project (Austria, Ministry of Science) and the Medical University of Graz and the Steiermärkische Krankenanstalten Gesellschaft. PRODEM-Austria is supported by the Austrian Research Promotion agency (FFG) (Project No. 827462) and by the Austrian National Bank (Anniversary Fund, project 15435. ARIC research is carried out as a collaborative study supported by NHLBI contracts (HHSN268201100005C, HHSN268201100006C, HHSN268201100007C, HHSN268201100008C, HHSN268201100009C, HHSN268201100010C, HHSN268201100011C, and HHSN268201100012C). Neurocognitive data in ARIC is collected by U01 2U01HL096812, 2U01HL096814, 2U01HL096899, 2U01HL096902, 2U01HL096917 from the NIH (NHLBI, NINDS, NIA and NIDCD), and with previous brain MRI examinations funded by R01-HL70825 from the NHLBI. CHS research was supported by contracts HHSN268201200036C, HHSN268200800007C, N01HC55222, N01HC85079, N01HC85080, N01HC85081, N01HC85082, N01HC85083, N01HC85086, and grants U01HL080295 and U01HL130114 from the NHLBI with additional contribution from the National Institute of Neurological Disorders and Stroke (NINDS). Additional support was provided by R01AG023629, R01AG15928, and R01AG20098 from the NIA. FHS research is supported by NHLBI contracts N01-HC-25195 and HHSN268201500001I. This study was also supported by additional grants from the NIA (R01s AG054076, AG049607 and AG033040 and NINDS (R01 NS017950). The ERF study as a part of EUROSPAN (European Special Populations Research Network) was supported by European Commission FP6 STRP grant number 018947 (LSHG-CT-2006-01947) and also received funding from the European Community's Seventh Framework Programme (FP7/2007-2013)/grant agreement HEALTH-F4-2007-201413 by the European Commission under the programme Quality of Life and Management of the Living Resources of 5th Framework Programme (no. QLG2-CT-2002-01254). High-throughput analysis of the ERF data was supported by a joint grant from the Netherlands Organization for Scientific Research and the Russian Foundation for Basic Research (NWO-RFBR 047.017.043). The Rotterdam Study is funded by Erasmus Medical Center and Erasmus University, Rotterdam, the Netherlands Organization for Health Research and Development (ZonMw), the Research Institute for Diseases in the Elderly (RIDE), the Ministry of Education, Culture and Science, the Ministry for Health, Welfare and Sports, the European Commission (DG XII), and the municipality of Rotterdam. Genetic data sets are also supported by the Netherlands Organization of Scientific Research NWO Investments (175.010.2005.011, 911-03-012), the Genetic Laboratory of the Department of Internal Medicine, Erasmus MC, the Research Institute for Diseases in the Elderly (014-93-015; RIDE2), and the Netherlands Genomics Initiative (NGI)/Netherlands Organization for Scientific Research (NWO) Netherlands Consortium for Healthy Aging (NCHA), project 050-060-810. All studies are grateful to their participants, faculty and staff. The content of these manuscripts is solely the responsibility of the authors and does not necessarily represent the official views of the National Institutes of Health or the U.S. Department of Health and Human Services.
The three LSACs are: the Human Genome Sequencing Center at the Baylor College of Medicine (U54 HG003273), the Broad Institute Genome Center (U54HG003067), and the Washington University Genome Institute (U54HG003079).
Biological samples and associated phenotypic data used in primary data analyses were stored at Study Investigators institutions, and at the National Cell Repository for Alzheimer's Disease (NCRAD, U24AG021886) at Indiana University funded by NIA. Associated Phenotypic Data used in primary and secondary data analyses were provided by Study Investigators, the NIA funded Alzheimer's Disease Centers (ADCs), and the National Alzheimer's Coordinating Center (NACC, U01AG016976) and the National Institute on Aging Genetics of Alzheimer's Disease Data Storage Site (NIAGADS, U24AG041689) at the University of Pennsylvania, funded by NIA, and at the Database for Genotypes and Phenotypes (dbGaP) funded by NIH. This research was supported in part by the Intramural Research Program of the National Institutes of health, National Library of Medicine. Contributors to the Genetic Analysis Data included Study Investigators on projects that were individually funded by NIA, and other NIH institutes, and by private U.S. organizations, or foreign governmental or nongovernmental organizations.
Supplementary Material
The Supplementary Material for this article can be found online at: https://www.frontiersin.org/articles/10.3389/fnins.2018.00209/full#supplementary-material
Figure S1. Schematic representation of the bioinformatics pipeline used in this study to filter and combine the information from whole exome sequencing (WES) and whole genome sequencing (WGS).
Table S1. Structure of the families used in this study with detail of the number of individuals (IDs) sequenced per family, number of cases (CA), number of controls (CO), number of females (Fe) and number of males (Ma). The first 25 families were employed in the simulation analysis.
Table S2. Design of simulated “GENE-A” across 25 families. Scenarios 5FCx0FNC, 5FCx5FNC, 5FCx10FNC, 5FCx15FNC, 5FCx20FNC.
Table S3. Comparison of kinship matrices for Fam#1 and Fam#2.
References
Aly, T. A., Baschal, E. E., Jahromi, M. M., Fernando, M. S., Babu, S. R., Fingerlin, T. E., et al. (2008). Analysis of single nucleotide polymorphisms identifies major type 1A diabetes locus telomeric of the major histocompatibility complex. Diabetes 57, 770–776. doi: 10.2337/db07-0900
Balding, D. J., and Nichols, R. A. (1995). A method for quantifying differentiation between populations at Multi-Allelic Loci and Its implications for investigating identity and paternity. Genetica 96, 3–12. doi: 10.1007/BF01441146
Bansal, V., Libiger, O., Torkamani, A., and Schork, N. J. (2010). Statistical analysis strategies for association studies involving rare variants. Nat. Rev. Genet. 11, 773–785. doi: 10.1038/nrg2867
Baranzini, S. E., Wang, J., Gibson, R. A., Galwey, N., Naegelin, Y., Barkhof, F., et al. (2009). Genome-wide association analysis of susceptibility and clinical phenotype in multiple sclerosis. Hum. Mol. Genet. 18, 767–778. doi: 10.1093/hmg/ddn388
Beecham, G. W., Hamilton, K., Naj, A. C., Martin, E. R., Huentelman, M., Myers, A. J., et al. (2014). Genome-wide association meta-analysis of neuropathologic features of Alzheimer's disease and related dementias. PLoS Genet. 10:e1004606. doi: 10.1371/journal.pgen.1004606
Chen, C., Manichaikul, A., and Rich, S. S. (2009). A generalized family-based association test for dichotomous traits. Am. J. Hum. Genet. 85, 364–376. doi: 10.1016/j.ajhg.2009.08.003
Cheong, C., Hentschel, L., Davidson, A. E., Gerrelli, D., Davie, R., Rizzo, R., et al. (2016). Mutations in CPAMD8 cause a unique form of autosomal-recessive anterior segment dysgenesis. Am. J. Hum. Genet. 99, 1338–1352. doi: 10.1016/j.ajhg.2016.09.022
Choi, S., Lee, S., Cichon, S., Nöthen, M. M., Lange, C., Park, T., et al. (2014). FARVAT: a family-based rare variant association test. Bioinformatics 30, 3197–3205. doi: 10.1093/bioinformatics/btu496
Cingolani, P., Platts, A., Wang le L., Melissa Coon, W., Nguyen, T., Wang, L., et al. (2012). A Program for annotating and predicting the effects of single nucleotide polymorphisms, SnpEff: SNPs in the genome of drosophila melanogaster strain w1118; Iso-2; Iso-3. Fly (Austin) 6, 80–92. doi: 10.4161/fly.19695
Cirulli, E. T., and Goldstein, D. B. (2010). Uncovering the roles of rare variants in common disease through whole-genome sequencing. Nat. Rev. Genet. 11, 415–425. doi: 10.1038/nrg2779
Cruchaga, C., Celeste, M. K., Jin, S. C., Benitez, B. A., Cai, Y., Guerreiro, R., et al. (2014). Rare coding variants in the phospholipase D3 gene confer risk for Alzheimer's disease. Nature 505, 550–554. doi: 10.1038/nature12825
Cruchaga, C., Del-Aguila, J. L., Saef, B., Black, K., Fernandez, M. V., Budde, J., et al. (2017). Polygenic risk score of sporadic late-onset Alzheimer's disease reveals a shared architecture with the familial and early-onset forms. Alzheimers Dement. 14, 205–214. doi: 10.1016/j.jalz.2017.08.013
Cruchaga, C., Haller, G., Chakraverty, S., Mayo, K., Vallania, F. L.M., Mitra, R. D., et al. (2012). Rare variants in APP, PSEN1 and PSEN2 increase risk for AD in Late-onset Alzheimer's disease families. PLoS ONE 7:e31039. doi: 10.1371/journal.pone.0031039
Cukier, H. N., Dueker, N. D., Slifer, S. H., Lee, J. M., Whitehead, P. L., Lalanne, E., et al. (2014). Exome sequencing of extended families with autism reveals genes shared across neurodevelopmental and neuropsychiatric disorders. Mol. Autism 5:1. doi: 10.1186/2040-2392-5-1
De, G., Yip, W., Ionita-Laza, I., Laird, N., and Amos, C. I. (2013). Rare variant analysis for family-based design. PLoS ONE 8:e48495. doi: 10.1371/journal.pone.0048495
Farrer, L. A., Cupples, L. A., Haines, J. L., Hyman, B., Kukull, W. A., Mayeux, R., et al. (1997). Effects of age, sex, and ethnicity on the association between apolipoprotein E genotype and Alzheimer disease. A meta-analysis. APOE and Alzheimer disease meta analysis consortium. JAMA 278, 1349–1356. doi: 10.1001/jama.1997.03550160069041
Fernández, M. V., Kim, J. H., Budde, J. P., Black, K., Medvedeva, A., Saef, B., et al. (2017). Analysis of neurodegenerative mendelian genes in clinically diagnosed Alzheimer disease. PLOS Genet. 13:e1007045. doi: 10.1371/journal.pgen.1007045
Frazer, K. A., Murray, S. S., Schork, N. J., and Topolm, E. J. (2009). Human genetic variation and its contribution to complex traits. Nat. Rev. Genet. 10, 241–251. doi: 10.1038/nrg2554
Gaitán-Peñas, H., Apaja, P. M., Arnedo, T., Castellanos, A., Elorza-Vidal, X., Soto, D., et al. (2017). Leukoencephalopathy-Causing CLCN2 mutations are associated with impaired Cl–channel function and trafficking. J. Physiol. 595, 6993–7008. doi: 10.1113/JP275087
Guerreiro, R. J., Lohmann, E., Brás, J. M., Gibbs, J. R., Rohrer, J. D., Gurunlian, N., et al. (2013). Using exome sequencing to reveal mutations in TREM2 presenting as a frontotemporal dementia-like syndrome without bone involvement. JAMA Neurol. 70, 78–84. doi: 10.1001/jamaneurol.2013.579
He, Z., O'Roak, B. J., Smith, J. D., Wang, G., Hooker, S., Santos-Cortez, R. L. P., et al. (2014). Rare-variant extensions of the transmission disequilibrium test: application to autism exome sequence data. Am. J. Hum. Genet. 94, 33–46. doi: 10.1016/j.ajhg.2013.11.021
He, Z., Zhang, D., Renton, A. E., Li, B., Zhao, L., Wang, G. T., et al. (2017). The rare-variant generalized disequilibrium test for association analysis of nuclear and extended pedigrees with application to Alzheimer disease WGS data. Am. J. Hum. Genet. 100, 193–204. doi: 10.1016/j.ajhg.2016.12.001
Horvath, S., Xu, X., and Laird, N. M. (2001). The family based association test method: strategies for studying general genotype–phenotype associations. Eur. J. Hum. Genet. 9, 301–306. doi: 10.1038/sj.ejhg.5200625
Ionita-Laza, I., Lee, S., Makarov, V., Buxbaum, J. D., and Lin, X. (2013). Family-based association tests for sequence data, and comparisons with population-based association tests. Eur. J. Hum. Genet. 21, 1158–1162. doi: 10.1038/ejhg.2012.308
Kang, H. M., Sul, J. H., Service, S. K., Zaitlen, N. A., Kong, S., Freimer, N. B., et al. (2010). Variance component model to account for sample structure in genome-wide association studies. Nat. Genet. 42, 348–354. doi: 10.1038/ng.548
Kazma, R., and Bailey, J. N. (2011). Population-based and family-based designs to analyze rare variants in complex diseases. Genet. Epidemiol. 35(Suppl. 1). S41–S47. doi: 10.1002/gepi.20648
Laird, N. M., Horvath, S., and Xu, X. (2000). Implementing a unified approach to family-based tests of association. Genet. Epidemiol. 19(Suppl. 1). S36–S42. doi: 10.1002/1098-2272(2000)19:1+<::AID-GEPI6>3.0.CO;2-M
Laird, N. M., and Lange, C. (2006). Family-based designs in the age of large-scale gene-association studies. Nat. Rev. Genet. 7, 385–394. doi: 10.1038/nrg1839
Lambert, J. C., Ibrahim-Verbaas, C. A., Harold, D., Naj, A. C., Sims, R., Bellenguez, C., et al. (2013). Meta-analysis of 74,046 individuals identifies 11 new susceptibility loci for Alzheimer's disease. Nat. Genet. 45, 1452–1458. doi: 10.1038/ng.2802
Lange, C., and Laird, N. M. (2002). On a general class of conditional tests for family-based association studies in genetics: the asymptotic distribution, the conditional power, and optimality considerations. Genet. Epidemiol. 23, 165–180. doi: 10.1002/gepi.209
Lee, S., Abecasis, G. R., Boehnke, M., and Lin, X. (2014). Rare-variant association analysis: study designs and statistical tests. Am. J. Hum. Genet. 95, 5–23. doi: 10.1016/j.ajhg.2014.06.009
Lee, S., Emond, M. J., Bamshad, M. J., Barnes, K. C., Rieder, M. J., Nickerson, D. A., et al. (2012). Optimal unified approach for rare-variant association testing with application to small-sample case-control whole-exome sequencing studies. Am. J. Hum. Genet. 91, 224–237. doi: 10.1016/j.ajhg.2012.06.007
Lek, M., Karczewski, K. J., Minikel, E. V., Samocha, K. E., Banks, E., Fennell, T., et al. (2016). Analysis of protein-coding genetic variation in 60,706 humans. Nature 536, 285–291. doi: 10.1038/nature19057
Li, B., and Leal, S. M. (2008). Methods for detecting associations with rare variants for common diseases: application to analysis of sequence data. Am. J. Hum. Genet. 83, 311–321. doi: 10.1016/j.ajhg.2008.06.024
Li, M., Boehnke, M., and Abecasis, G. R. (2006). Efficient study designs for test of genetic association using sibship data and unrelated cases and controls. Am. J. Hum. Genet. 78, 778–792. doi: 10.1086/503711
Lin, A., Wang, R. T., Ahn, S., Park, C. C., and Smith, D. J. (2010). A genome-wide map of human genetic interactions inferred from radiation hybrid genotypes. Genome Res. 20, 1122–1132. doi: 10.1101/gr.104216.109
Manolio, T. A., Francis, A., Collins, S., Cox, N. J., Goldstein, D. B., and Hindorff, L. A. (2009). Finding the missing heritability of complex diseases. Nature 461, 747–753. doi: 10.1038/nature08494
Morgenthaler, S., and Thilly, W. G. (2007). A Strategy to discover genes that carry multi-allelic or mono-allelic risk for common diseases: a Cohort Allelic Sums Test (CAST). Mutat. Res. 615, 28–56. doi: 10.1016/j.mrfmmm.2006.09.003
Neale, B. M., Rivas, M. A., Voight, B. F., Altshuler, D., Devlin, B., Orho-Melander, M., et al. (2011). Testing for an unusual distribution of rare variants. PLoS Genet. 7:e1001322. doi: 10.1371/journal.pgen.1001322
Neale, B. M., and Sham, P. C. (2004). The future of association studies: gene-based analysis and replication. Am. J. Hum. Genet. 75, 353–362. doi: 10.1086/423901
Nyúl-Tóth, Á., Kozma, M., Nagyoszi, P., Nagy, K., Fazakas, C., Haskó, J., et al. (2017). Expression of pattern recognition receptors and activation of the non-canonical inflammasome pathway in brain pericytes. Brain Behav. Immun. 64, 220–231. doi: 10.1016/j.bbi.2017.04.010
Ott, J., Kamatani, Y., and Lathrop, M. (2011). Family-based designs for genome-wide Association Studies. Nat. Rev. Genet. 12, 465–474. doi: 10.1038/nrg2989
Pontillo, A., Catamo, E., Arosio, B., Mari, D., and Crovella, S. (2012). NALP1/NLRP1 genetic variants are associated with Alzheimer disease. Alzheimer Dis. Assoc. Disord. 26, 277–281. doi: 10.1097/WAD.0b013e318231a8ac
Price, A. L., Kryukov, G. V., de Bakker, P. I.W., Purcell, S. M., Staples, J., Wei, LJ., et al. (2010). Pooled association tests for rare variants in exon-resequencing studies. Am. J. Hum. Genet. 86, 832–838. doi: 10.1016/j.ajhg.2010.04.005
R Core Team (2017). R: A Language and Environment for Statistical Computing. Vienna: R Foundation for Statistical Computing. Available online at: www.R-project.org/
Ridge, P. G., Hoyt, K. B., Boehme, K., Mukherjee, S., Crane, P. K., Haines, J. L., et al. (2016). Assessment of the genetic variance of late-onset Alzheimer's disease. Neurobiol. Aging 41, 200.e13–200.e20. doi: 10.1016/j.neurobiolaging.2016.02.024
Rosenthal, S. L., and Kamboh, M. I. (2014). Late-onset Alzheimer's disease genes and the potentially implicated pathways. Curr. Genet. Med. Rep. 22, 85–101. doi: 10.1007/s40142-014-0034-x
Saint-Martin, C., Gauvain, G., Teodorescu, G., Gourfinkel-An, I., Fedirko, E., Weber, Y. G., et al. (2009). Two novel CLCN2 mutations accelerating chloride channel deactivation are associated with idiopathic generalized epilepsy. Hum. Mutat. 30, 397–405. doi: 10.1002/humu.20876
Schaid, D. J., McDonnell, S. K., Sinnwell, J. P., and Thibodeau, S. N. (2013). Multiple genetic variant association testing by collapsing and kernel methods with pedigree or population structured data. Genet. Epidemiol. 37, 409–418. doi: 10.1002/gepi.21727
Sims, R., van der Lee, S. J., Naj, A. C., Bellenguez, C., Badarinarayan, N., Jakobsdottir, J., et al. (2017). Rare coding variants in PLCG2, ABI3, and TREM2 implicate microglial-mediated innate immunity in Alzheimer's disease. Nat. Genet. 49, 1373–1384. doi: 10.1038/ng.3916
Smith, M., Herrell, S., Lusher, M., Lako, L., Simpson, C., and Wiestner, A. (1999). Genomic organisation of the human chordin gene and mutation screening of candidate cornelia de lange syndrome genes. Hum. Genet. 105, 104–111. doi: 10.1007/s004399900068
Spielman, R. S., McGinnis, R. E., and Ewens, W. J. (1993). Transmission test for linkage disequilibrium: the insulin gene region and insulin-dependent diabetes mellitus (IDDM). Am. J. Hum. Genet. 52, 506–516.
Sul, J. H., Cade, B. E., Cho, M. H., Qiao, D., Silverman, E. K., Redline, S., et al. (2016). Increasing generality and power of rare-variant tests by utilizing extended pedigrees. Am. J. Hum. Genet. 99, 846–859. doi: 10.1016/j.ajhg.2016.08.015
Thornton, T., and McPeek, M. S. (2007). Case-control association testing with related individuals: a more powerful quasi-likelihood score test. Am. J. Hum. Genet. 81, 321–337. doi: 10.1086/519497
Wang, X., Lee, S., Zhu, X., Redline, S., and Lin, X. (2013). GEE-based SNP set association test for continuous and discrete traits in family-based association studies. Genet. Epidemiol. 37, 778–786. doi: 10.1002/gepi.21763
Wang, X., Lopez, O. L., Sweet, R. A., Becker, J. T., Dekosky, S. T., Barmada, M. M., et al. (2015). Genetic determinants of disease progression in Alzheimer's disease. J. Alzheimers Dis. 43, 649–655. doi: 10.3233/JAD-140729
Wijsman, E. M., Pankratz, N. D., Choi, Y., Rothstein, J. H., Faber, K. M., Cheng, R., et al. (2011). Genome-wide association of familial late-onset Alzheimer's disease replicates BIN1 and CLU and nominates CUGBP2 in interaction with APOE. PLoS Genet. 7:e1001308. doi: 10.1371/journal.pgen.1001308
Wu, M. C., Lee, S., Cai, T., Li, Y., Boehnke, M., and Lin, X. (2011). Rare-variant association testing for sequencing data with the sequence kernel association test. Am. J. Hum. Genet. 89, 82–93. doi: 10.1016/j.ajhg.2011.05.029
Yan, Q., Tiwari, H. K., Yi, N., Gao, G., Zhang, K., Lin, W. Y., et al. (2015). A sequence kernel association test for dichotomous traits in family samples under a generalized linear mixed model. Hum. Hered. 79, 60–68. doi: 10.1159/000375409
Zhou, X., and Stephens, M. (2012). Genome-wide efficient mixed-model analysis for association studies. Nat. Genet. 44, 821–824. doi: 10.1038/ng.2310
Keywords: gene-based, family-based, clustering, variance-component, transmission disequilibrium, rare variants, whole exome sequencing, Alzheimer's disease
Citation: Fernández MV, Budde J, Del-Aguila JL, Ibañez L, Deming Y, Harari O, Norton J, Morris JC, Goate AM, NIA-LOAD family study group, NCRAD and Cruchaga C (2018) Evaluation of Gene-Based Family-Based Methods to Detect Novel Genes Associated With Familial Late Onset Alzheimer Disease. Front. Neurosci. 12:209. doi: 10.3389/fnins.2018.00209
Received: 26 December 2017; Accepted: 15 March 2018;
Published: 04 April 2018.
Edited by:
Michael F. Miles, Virginia Commonwealth University, United StatesReviewed by:
Fanny Elahi, University of California, San Francisco, United StatesIris Broce, University of California, San Francisco, United States
Copyright © 2018 Fernández, Budde, Del-Aguila, Ibañez, Deming, Harari, Norton, Morris, Goate, NIA-LOAD family study group, NCRAD and Cruchaga. This is an open-access article distributed under the terms of the Creative Commons Attribution License (CC BY). The use, distribution or reproduction in other forums is permitted, provided the original author(s) and the copyright owner are credited and that the original publication in this journal is cited, in accordance with accepted academic practice. No use, distribution or reproduction is permitted which does not comply with these terms.
*Correspondence: Carlos Cruchaga, Y3J1Y2hhZ2FjQHd1c3RsLmVkdQ==
†Membership of the NIA-LOAD and NCRAD Family Study Group is provided in the Acknowledgements