 Stavros I. Dimitriadis
 María Eugenia López
 Fernando Maestu
 Ernesto Pereda
- 1Cardiff University Brain Research Imaging Centre, School of Psychology, Cardiff University, Cardiff, United Kingdom
- 2Neuroinformatics Group, Cardiff University Brain Research Imaging Centre, School of Psychology, Cardiff University, Cardiff, United Kingdom
- 3Division of Psychological Medicine and Clinical Neurosciences, School of Medicine, Cardiff University, Cardiff, United Kingdom
- 4School of Psychology, Cardiff University, Cardiff, United Kingdom
- 5Neuroscience and Mental Health Research Institute, School of Medicine, Cardiff University, Cardiff, United Kingdom
- 6MRC Centre for Neuropsychiatric Genetics and Genomics, School of Medicine, Cardiff University, Cardiff, United Kingdom
- 7Department of Experimental Psychology, Cognitive Processes and Speech Therapy, Universidad Complutense de Madrid, Madrid, Spain
- 8Laboratory of Cognitive and Computational Neuroscience, Center for Biomedical Technology, Universidad Complutense de Madrid – Universidad Politécnica de Madrid, Madrid, Spain
- 9Networking Research Center on Bioengineering, Biomaterials and Nanomedicine (CIBER-BBN), Madrid, Spain
- 10Electrical Engineering and Bioengineering Group, Department of Industrial Engineering and Institute of Biomedical Technology, Universidad de La Laguna, Tenerife, Spain
The need for designing and validating novel biomarkers for the detection of mild cognitive impairment (MCI) is evident. MCI patients have a high risk of developing Alzheimer’s disease (AD), and for that reason the introduction of novel and reliable biomarkers is of significant clinical importance. Motivated by recent findings on the rich information of dynamic functional connectivity graphs (DFCGs) about brain (dys) function, we introduced a novel approach of identifying MCI based on magnetoencephalographic (MEG) resting state recordings. The activity of different brain rhythms {δ, 𝜃, α1, α2, β1, β2, γ1, γ2} was first beamformed with linear constrained minimum norm variance in the MEG data to determine 90 anatomical regions of interest (ROIs). A DFCG was then estimated using the imaginary part of phase lag value (iPLV) for both intra-frequency coupling (8) and cross-frequency coupling pairs (28). We analyzed DFCG profiles of neuromagnetic resting state recordings of 18 MCI patients and 22 healthy controls. We followed our model of identifying the dominant intrinsic coupling mode (DICM) across MEG sources and temporal segments, which further leads to the construction of an integrated DFCG (iDFCG). We then filtered statistically and topologically every snapshot of the iDFCG with data-driven approaches. An estimation of the normalized Laplacian transformation for every temporal segment of the iDFCG and the related eigenvalues created a 2D map based on the network metric time series of the eigenvalues (NMTSeigs). The NMTSeigs preserves the non-stationarity of the fluctuated synchronizability of iDCFG for each subject. Employing the initial set of 20 healthy elders and 20 MCI patients, as training set, we built an overcomplete dictionary set of network microstates (n μstates). Afterward, we tested the whole procedure in an extra blind set of 20 subjects for external validation. We succeeded in gaining a high classification accuracy on the blind dataset (85%), which further supports the proposed Markovian modeling of the evolution of brain states. The adaptation of appropriate neuroinformatic tools that combine advanced signal processing and network neuroscience tools could properly manipulate the non-stationarity of time-resolved FC patterns revealing a robust biomarker for MCI.
Introduction
The major cause of clinical dementia in the elderly is that of Alzheimer’s type (DAT; Qiu et al., 2009), which is mainly characterized by loss of synapses, the accumulation of the Beta amyloid protein (Aβ) and the phosphorylation of the Tau protein. Due to the progressive loss of synapses, which alters the efficient communication within and between various brain subsystems, the DAT may be considered a disconnection syndrome (Delbeuck et al., 2003). The pathological changes of DAT start decades before the first clinical symptoms appear, thus it is important to design proper analytic pathways for analyzing neuroimaging datasets via, e.g., the notion of brain connectivity, which allows the early detecting of such changes (Gómez et al., 2009a; Stam et al., 2009; Maestú et al., 2015). It is extremely important to Alzheimer’s disease (AD) research to identify early on preclinical and prodromal AD as it can assist clinical trials and targeted interventions (Livingston et al., 2017).
Mild cognitive impairment (MCI) is considered to be an intermediate clinical stage between the normal cognitive decline and DAT (Petersen and Negash, 2008). The main parts of the affected brain during the MCI, apart from those involved in action and thought, are those related to memory. For that reason, MCI patients face memory problems on a higher level compared to normal aged population but with no prevalent characteristic symptomatology of dementia-like reasoning or impaired judgment (Petersen et al., 2009). MCI is a heterogeneous state with different subtypes, which complicates in many cases the prediction of DAT (Portet et al., 2006). Additionally, it is also difficult to accurately discriminate symptomatic predementia (MCI) from healthy aging or dementia (DAT) (Petersen and Negash, 2008). Despite these difficulties to achieve an early diagnosis, an accurate identification of MCI should be attempted. Early diagnosis of MCI, even in the absence of a healing strategy, is significant for both pharmacological and non-pharmacological interventions. For that reason, new tools based on neuroimaging approaches are needed to increase sensitivity in the detection of MCI.
Analysis of magnetoencephalographic (MEG) recordings untangled the association between neural oscillations, functional connectivity assessment and neurophysiological activity (Brookes et al., 2011). Altered frequency-dependent functional patterns have been linked to the progression of cognitive decline (Poza et al., 2007). Alternative scenarios of analyzing MEG recordings include single channel analysis, e.g., power analysis, functional connectivity, and brain network analysis in resting state and also in task-based experiments (for a review, see Mandal et al., 2018). Analysis of single channel recordings is a less complex approach that identified aberrant oscillations in AD primarily in the left temporal-parietal-occipital brain areas (Gómez et al., 2009b). Functional connectivity (FC) and effective connectivity (EC) analysis revealed a loss of connectivity in AD compared to healthy control (HC) subjects found mostly in higher frequency bands (Gómez et al., 2017) while multiplex network analysis of MEG study in AD identified affected regions of the hippocampus, posterior default mode network (DMN) and occipital areas (Yu et al., 2017). However, the current clinical literature is limited and no strong conclusion can be drawn.
A recent multicenter MEG study addressed this issue using FC analysis (Maestú et al., 2015). It revealed hypersynchronization in MCI as the most discriminative feature of brain connectivity, mainly over the fronto-parietal and inter-hemispheric links. This pattern was stable across the five different neuroimaging centers that participated in the study (Accuracy ∼ = 80%), which might thereby be considered as a preclinical connectomic biomarker for MCI/DAT. Previous MEG studies based on connectivity analysis described a less organized functional brain network, a hypersynchrony in the fronto-parietal network in MCI subjects (Bajo et al., 2010; Buldú et al., 2011), while patients with DAT demonstrated a less synchronized brain network accompanied with cognitive decline (Stam et al., 2009). This hypersynchronization might be a compensatory mechanism but it cannot be adaptive since the patient’s network is closer to a random network compared to healthy elderly controls (Buldú et al., 2011). In a recent MEG study comparing progressive MCI and stable MCI, authors described hypersynchronization in the α band between the anterior cingulate and posterior brain areas in the progressive MCI group (López et al., 2014).
Spontaneous fluctuations of functional MRI (fMRI) blood-oxygen-level-dependent (BOLD) signals are temporally coherent between distinct spatial brain areas and not random. Biswal et al. (1995) demonstrated that fluctuations from motor areas were correlated even in the absence of a motor task. FC based on BOLD signal is modulated by cognitive and affective states (Richiardi et al., 2011; Shirer et al., 2012), by learning (Bassett et al., 2011), and also spontaneously (Kitzbichler et al., 2009; Britz et al., 2010; Chang and Glover, 2010).
When non-stationarity is taken into account and a dynamic functional connectivity (DFC) approach is adopted for studying FC patterns even in the absence of a task (resting state), more sophisticated algorithmic analyses should be used. In this line, two studies have recently been published simultaneously that presented a data-driven methodology. In the first one, Allen et al. (2014) proposed a method based on k-means clustering, aimed at detecting distinct “FC states” in the resting brain. These authors clearly showed differences from the stationary static functional brain networks. The second study proposed a data-driven method focused on extracting, out of hundreds of functional connectivity graphs (FCGs) in a multi-trial experimental paradigm, distinct brain states called functional connectivity microstates (FCμstates; Dimitriadis et al., 2013a). Both approaches revealed the need of dynamic FC to explore brain dynamics via the notion of brain connectivity, as it is clear that brain FC “hops” from one state to another (FCμstate) leading to a Markovian chain with characteristic favored transitions between distinct pairs of FCμstates (Dimitriadis et al., 2010b, 2013a,b; Allen et al., 2014).
In the last years, an increasing amount of human brain research based on functional imaging methods (electro-encephalography: EEG/magnetoencephalography: MEG/functional Magnetic Resonance Imaging: fMRI) has adopted a dynamic approach for exploring how brain connectivity fluctuates during resting-state and tasks alike (Laufs et al., 2003; Mantini et al., 2007; Dimitriadis et al., 2009, 2010b, 2012b, 2013a,b, 2015a,b,c,d, 2016a,b; Chang and Glover, 2010; Bassett et al., 2011; Handwerker et al., 2012; Ioannides et al., 2012; Hutchison et al., 2013; Liu and Duyn, 2013; Allen et al., 2014; Braun et al., 2014; Mylonas et al., 2015; Toppi et al., 2015; Yang and Lin, 2015; Calhoun and Adali, 2016). The aforementioned studies have demonstrated the superiority of DFC as compared to a static connectivity analysis.
In parallel, the concept of cross-frequency coupling (CFC) is gaining attention lately in the neuroscience community, as evinced by the increasing number of papers published with the incorporation of this type of interaction in the analysis (van Wijk and Fitzgerald, 2014; Dimitriadis et al., 2015a,c, 2016a,b; Florin and Baillet, 2015; Antonakakis et al., 2016a,b; Tewarie et al., 2016). Specifically, intrinsic coupling modes and especially CFC bias the task-related response and are sensitive to various brain diseases and disorders such as DAT, Parkinson, etc. (see, e.g., Engel et al., 2013 for a review). More recent studies have shown that the dynamics of spontaneously generated neural activity can be informative regarding the functional organization of large-scale brain networks (Fox et al., 2005; He et al., 2008; Hipp et al., 2012), revealing intrinsically generated “coupling modes” at multiple spatial and temporal scales (Deco and Corbetta, 2011; Engel et al., 2013).
Based on the aforementioned methodological evidence in microscale, it is significant to explore the repertoire of intra- and cross frequency interactions across brain rhythms and brain areas under the same integrated graph model (Dimitriadis et al., 2016a, 2017b, 2018a; Antonakakis et al., 2017).
In a previous study, we demonstrated how to design a connectomic biomarker for MCI based on source-reconstructed MEG activity via static brain network analysis (Dimitriadis et al., 2018a). Here, we extended this work by proposing a scheme to design a dynamic connectomic biomarker under the framework of DFC analysis. Additionally, the proposed scheme will be validated in a second blind dataset (SID did not know anything about the labels).
To this aim, we analyzed the MEG activity of healthy controls and MCI patients at resting-state (eyes-open) via DFC analysis. Based on a previous approach (Dimitriadis et al., 2016a, 2017b), we detected the dominant type of interaction per pair of MEG sources and temporal segment (Dimitriadis, 2018). This approach produced a subject-specific dynamic functional connectivity graph (DFCG). This approach created a 2D matrix of size sources × temporal segments that described the evolution of the eigenvalues across experimental time. Afterward, we used neural gas to design overcomplete dictionaries for sparse representation of NMTSeigen independently for the two groups (Dimitriadis et al., 2013a). Then, we validated the whole approach in a blind dataset to quantify the generalization of the proposed method.
In the Section “Materials and Methods,” we described the data acquisition, preprocessing steps, information about the datasets and the proposed methodological scheme. The Section “Results” is devoted to describing the results—including the prototypical network FCμstates, the accuracy of prediction in a blind dataset and network-based information of brain states. Finally, the Section “Discussion” includes the discussion of the current research results with future extensions.
Materials and Methods
Subjects and Ethics Statement
The training dataset includes 18 right-handed individuals with MCI (71.89 ± 4.51 years of age), and 22 age- and gender-matched neurologically intact controls (70.91 ± 3.85 years of age) were also recorded. Table 1 summarizes their demographic characteristics. All participants were recruited from the Neurological Unit of the “The Hospital Universitario San Carlos,” Madrid, Spain. They were right-handed (Oldfield, 1971) and native Spanish speakers. We used also a set of 20 subjects of unknown label (blind author SD) for further validation of the proposed dynamic connectomic biomarker (DCB). Table 2 summarizes the mean and standard deviation of the demographic characteristics of controls and MCI subjects from the blind dataset. Including the blind subjects, the total sample consisted of 29 MCI and 31 controls. At the beginning, we used 18/22 subjects for MCI/control group, correspondingly to train the algorithm and we kept 20 (nine control subjects and 11 MCI) for blind classification.
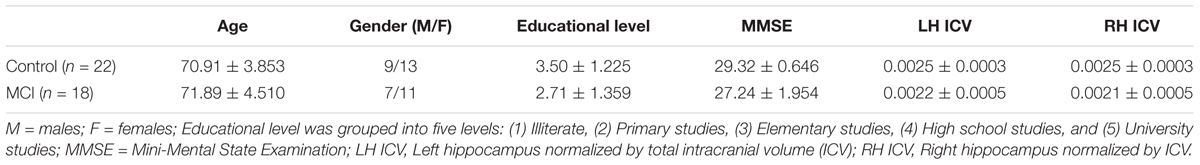
Table 1. Mean ± standard deviation of the demographic characteristics of controls and MCIs.
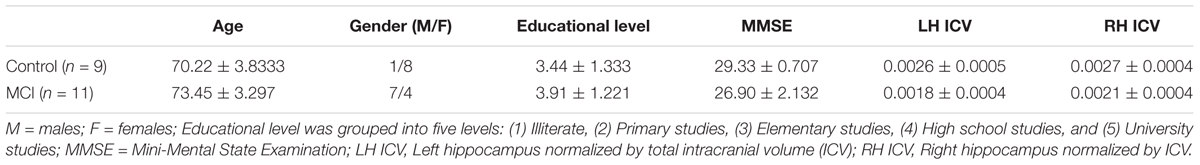
Table 2. Mean ± standard deviation of the demographic characteristics of the blind sample of controls and MCIs.
To explore their cognitive and functional status, all participants were screened by means of a variety of standardized diagnostic instruments and underwent an extensive cognitive assessment, as described in López et al. (2016).
Mild cognitive impairment diagnosis was established according to the National Institute on Aging-Alzheimer Association (NIA-AA) criteria (Albert et al., 2011), with all of them being categorized as “MCI due to AD intermediate likelihood.” They met the clinical criteria and also presented hippocampal atrophy, which was measured by magnetic resonance (MRI). According to their cognitive profile, they were also classified as amnestic subtype (Petersen et al., 2001).
The whole sample was free of significant medical, neurological and/or psychiatric diseases (other than MCI). Exclusion criteria included: a modified Hachinski Ischemic score ≥4 (Rosen et al., 1980); a geriatric depression scale short-form score ≥5 (Yesavage et al., 1983); a T2-weighted MRI within 12 months before MEG screening with indication of infection, infarction or focal lesions (rated by two independent experienced radiologists, Bai et al., 2012); and other possible causes of cognitive decline such as B12 deficit, diabetes mellitus, thyroid problems, syphilis or human immunodeficiency virus (HIV). Finally, those participants with medical treatment that could affect MEG activity (e.g., cholinesterase inhibitors) were required to interrupt it 48 h before the MEG recordings.
The present study was approved by the local ethics committee and all subjects signed an informed consent prior to their MEG recording.
MRI Acquisition and Hippocampal Volumes
Three-dimensional T1-weighted anatomical brain magnetic MRI scans were collected with a General Electric 1.5 TMRI scanner, using a high resolution antenna and a homogenization PURE filter (Fast Spoiled Gradient Echo (FSPGR) sequence with parameters: TR/TE/TI = 11.2/4.2/450 ms; flip angle 12°; 1 mm slice thickness, a 256 × 256 matrix and FOV 25 cm). Freesurfer software (version 5.1.0.; Fischl et al., 2002) was used to obtain the hippocampal volumes, which were normalized with the overall intracranial volume (ICV) of each subject.
MEG Acquisition and Preprocessing
4 min of eyes-open resting state data were recorded while the participants were seated in a 306-channel (one magnetometer and two orthogonal planar gradiometers per recording site, sampling frequency of 1 kHz) Vectorview system (Elekta Neuromag) placed in a magnetically shielded room (VacuumSchmelze GmbH, Hanau, Germany) at the “Laboratory of Cognitive and Computational Neuroscience” (Madrid, Spain). Subjects had to fix their gaze at a cross, which was projected in a screen. The position of the head relative to the sensor array was monitored by four head position indicator (HPI) coils attached to the scalp (two on the mastoids and two on the forehead). These four coils along with the head shape of each subject (referenced to three anatomical fiducials: nasion and left-right preauricular points) were acquired by using a three-dimensional Fastrak Polhemus system. Vertical ocular movements were monitored by two bipolar electrodes, which were placed above and below the left eye, and a third one on the earlobe, for electrical grounding.
Four HPI coils were placed in the head of the subject, two in the forehead and two in the mastoids, for an online estimate of the head position. The HPI coils were fed during the whole acquisition, allowing for offline estimation of the head position.
Maxfilter software (version 2.2 Elekta Neuromag) was used to remove the external noise from the MEG data using the temporal extension of signal space separation (tSSS) with movement compensation (correlation threshold = 0.9 m time window = 10 s) (Taulu and Simola, 2006). This algorithm removes the signals, whose origin is estimated outside the MEG helmet, while keeping intact the signals coming from inside the head. In addition, the continuous HPI acquisition, combined with the tSSS algorithm, allowed continuous movement compensation. As a result, the signal used in the next steps came from a set of virtual sensors whose position remained static in respect to the head of the subject. Recordings from those subjects whose movement along the recording was larger than 25 mm were discarded, following the recommendations of the manufacturer.
Source Reconstruction
We generated a volumetric grid for the MNI template by adopting a homogenous separation of 1 cm in each direction, with one source placed in (0, 0, 0) in MNI coordinates. The whole procedure resulted in a source model with 2,459 sources inside the brain surface where each one consisted of three perpendicular dipoles. Every source was then labeled using the automated anatomical labeling (AAL) atlas (Tzourio-Mazoyer et al., 2002). We finally considered 1,467 cortical sources. The computed grid was then transformed to subject specific space employing the original T1 image. The realignment of the grid and brain surface was realized manually to the Neuromag coordinate system following the three fiducials and the head shape guides. Employing a realistically shaped head, we estimated a lead field (Nolte, 2003). We source reconstructed frequency-dependent brain activity using a Linearly Constrained Minimum Variance (LCMV) beamformer (Van Veen et al., 1997). We ran the LCMV beamformer independently for the following eight frequency bands: δ (1–4 Hz), 𝜃 (4–8 Hz), α1 (8–10 Hz), α2 (10–13 Hz), β1 (13–20 Hz), β2 (20–30 Hz), γ1 (30–49 Hz), and γ2 (51–90 Hz). The resulting spatial filters were projected over the maximal radial direction, getting only one spatial filter per source. “Radial direction” means the direction of the segment connecting the dipole location to the center of the sphere best approximating the brain surface. Radial dipoles in a spherical conductor do not produce a magnetic field outside of the conductor (Sarvas, 1987), so this projection avoids the creation of undetectable sources among the target dipoles. Finally, we represented every brain area region of interest according to the AAL atlas by one source-space time series per frequency band using two alternative solutions: (1) the PCA of all the sources in the area or (2) the source closest to the centroid of the area (CENT).
Figure 1 illustrates the source-localization procedure and the different frequency-dependent representative Virtual Sensor time series for the two ROI representation schemes, PCA and the CENT.
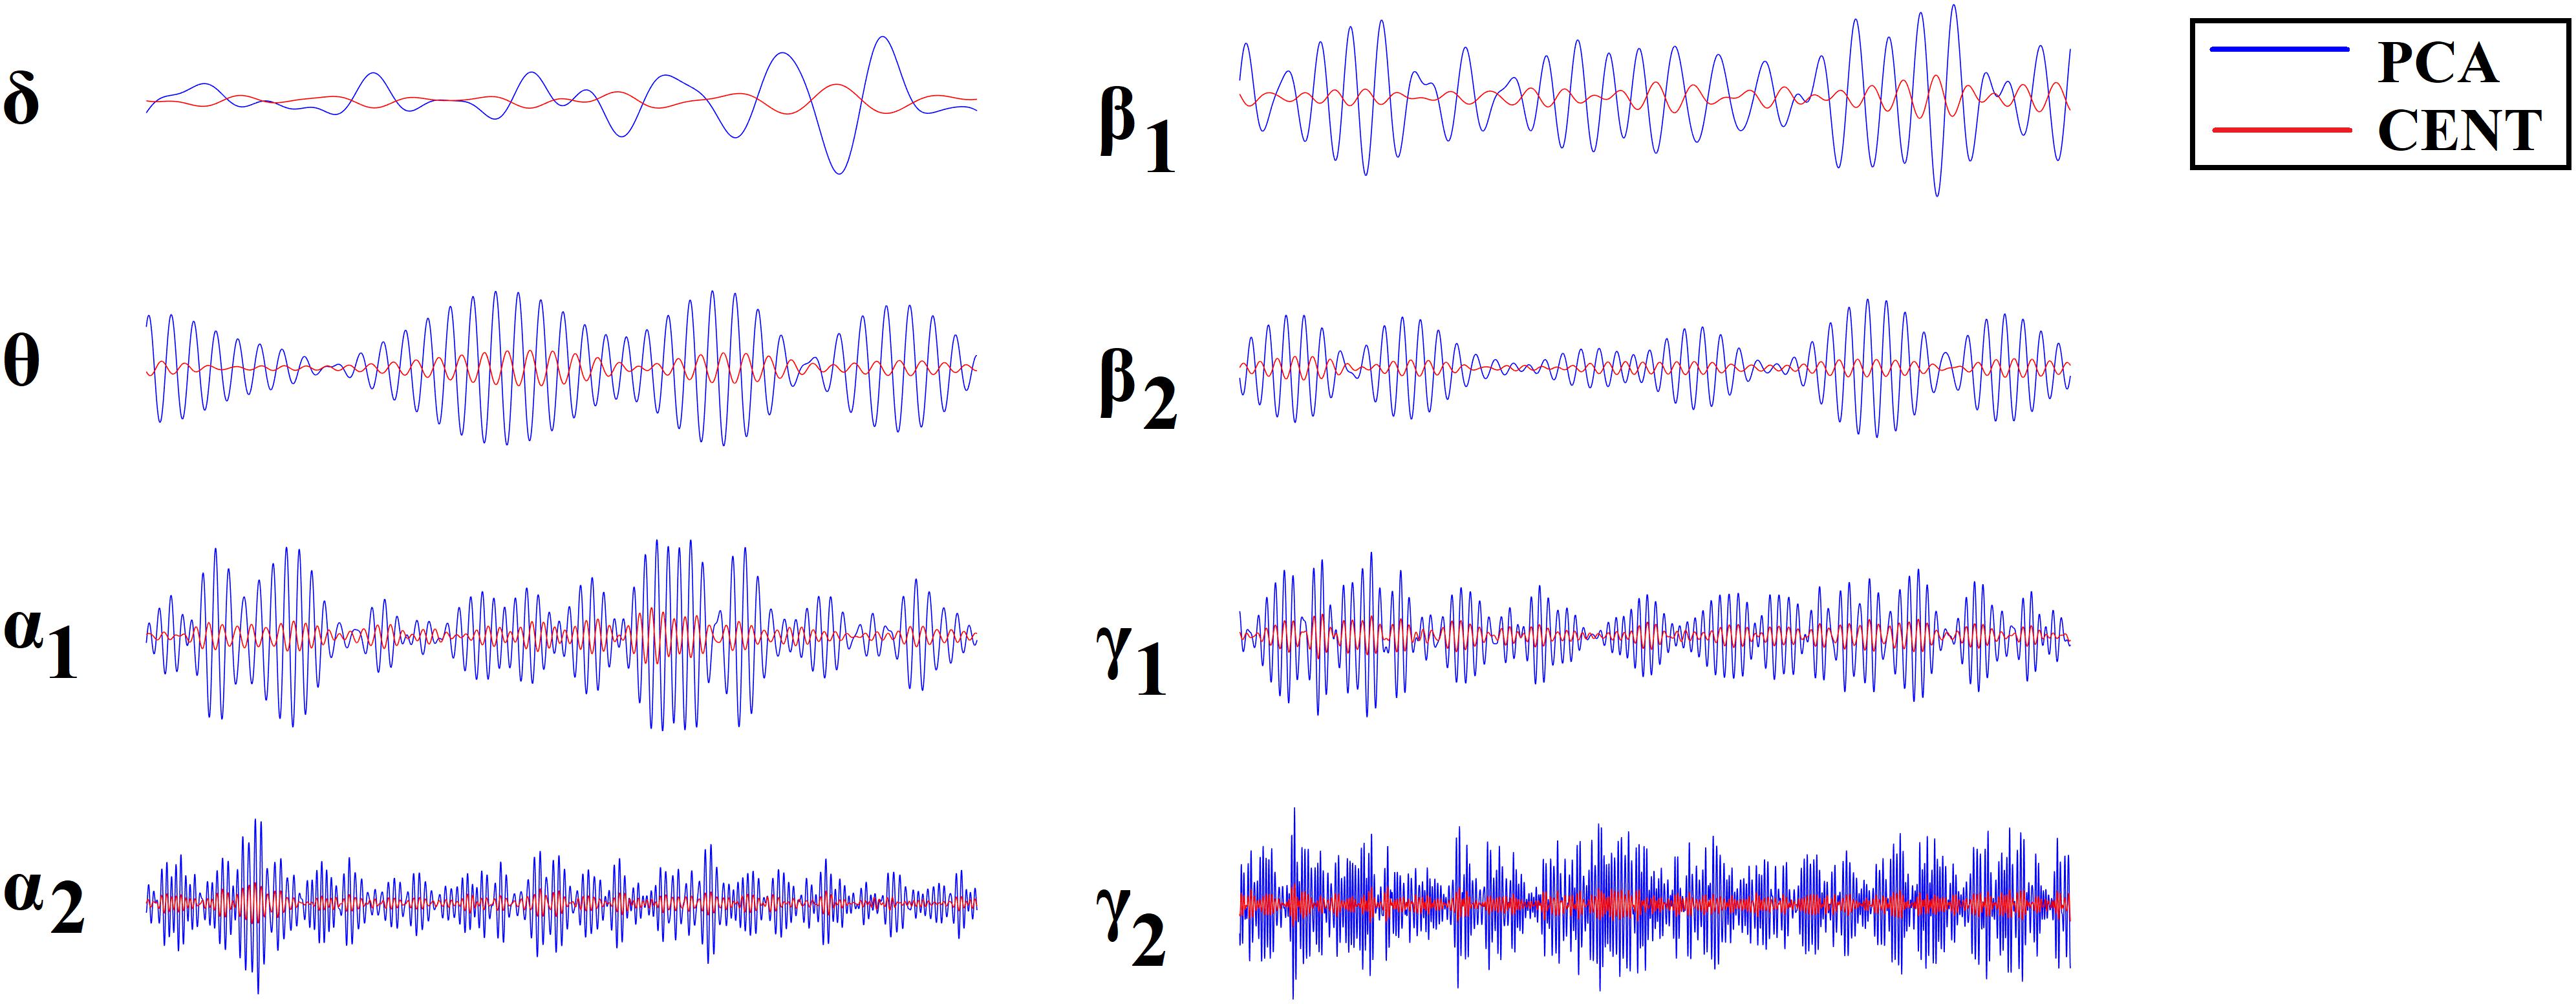
Figure 1. ROI Virtual Sensor representation of left precentral gyrus magnetoencephalographic activity from the first healthy control subject. Virtual sensor time series with blue and red color represent brain activity for (A) PCA and (B) CENT time series, respectively.
Dynamic Functional Connectivity Graphs (DFCGs)
Construction of the Integrated DFCGs
The DCFG analysis was restricted to the 90 ROIs of the AAL atlas. Adopting a common sliding window of width equal to 1 s to get at least 1 cycle of δ activity and a moving step of 50 ms, we estimated the dynamic networks for both intra-frequency (8 frequency bands) and inter-frequency coupling modes (8∗7/2 = 28 cross-frequency pairs) using the following formula of the imaginary part of phase locking value (iPLV).
where ϕ(t) is the phase of the signal in the corresponding frequency band (intra-frequency modes) and between frequencies (CFCs). For further details regarding phase-to-amplitudeCFC, see Dimitriadis et al. (2015a) and the Section “Construction of the Integrated Dynamic Functional Connectivity Graph” in Supplementary Material.
This procedure, whose implementation details can be found elsewhere (Dimitriadis et al., 2010b, 2015a, 2016a, 2017a,b, 2018b), resulted in a four-dimensional tensor of size [coupling modes × temporal segments × ROIs × ROIs] or [36 × 2,401 × 90 × 90] time-varying PAC graphs per participant (TVPAC). Following proper surrogate analysis and a framework which have been presented in a previous study (Dimitriadis et al., 2018b), we defined the dominant intrinsic coupling mode (DICM) per pair of sources and across temporal segments. This procedure generates two three-dimensional tensors of size [temporal segments × ROIs × ROIs]. The first one keeps the functional coupling strength (iPLV) across anatomical space and time, while the second tabulates the DICM using an index for every possible case : {1 for δ, 2 for 𝜃, 3 for α1, …,8 for γ2, 9 for δ-𝜃,..., 36 for γ1-γ2}. The following section describes briefly the surrogate analysis appropriate for reducing pitfalls in CFC analysis and also to define the DICM.
Statistical Filtering Scheme
First, we must identify true CFC interactions that are not driven by the changes in signal power. Secondly, following a proper surrogate analysis our DICM model can detect the DICM between every pair of sources and at every temporal segment. The whole procedure of analysis is described elsewhere in detail in Dimitriadis et al. (2016a), Dimitriadis and Salis (2017), and Dimitriadis (2018) and also in the Section “From Prominent Intrinsic Coupling Modes to Dominant Intrinsic Coupling Modes” in Supplementary Material.
Figure 2 illustrates the whole procedure of the DICM model for the first two temporal segments of resting-state activity of the first healthy control subject.
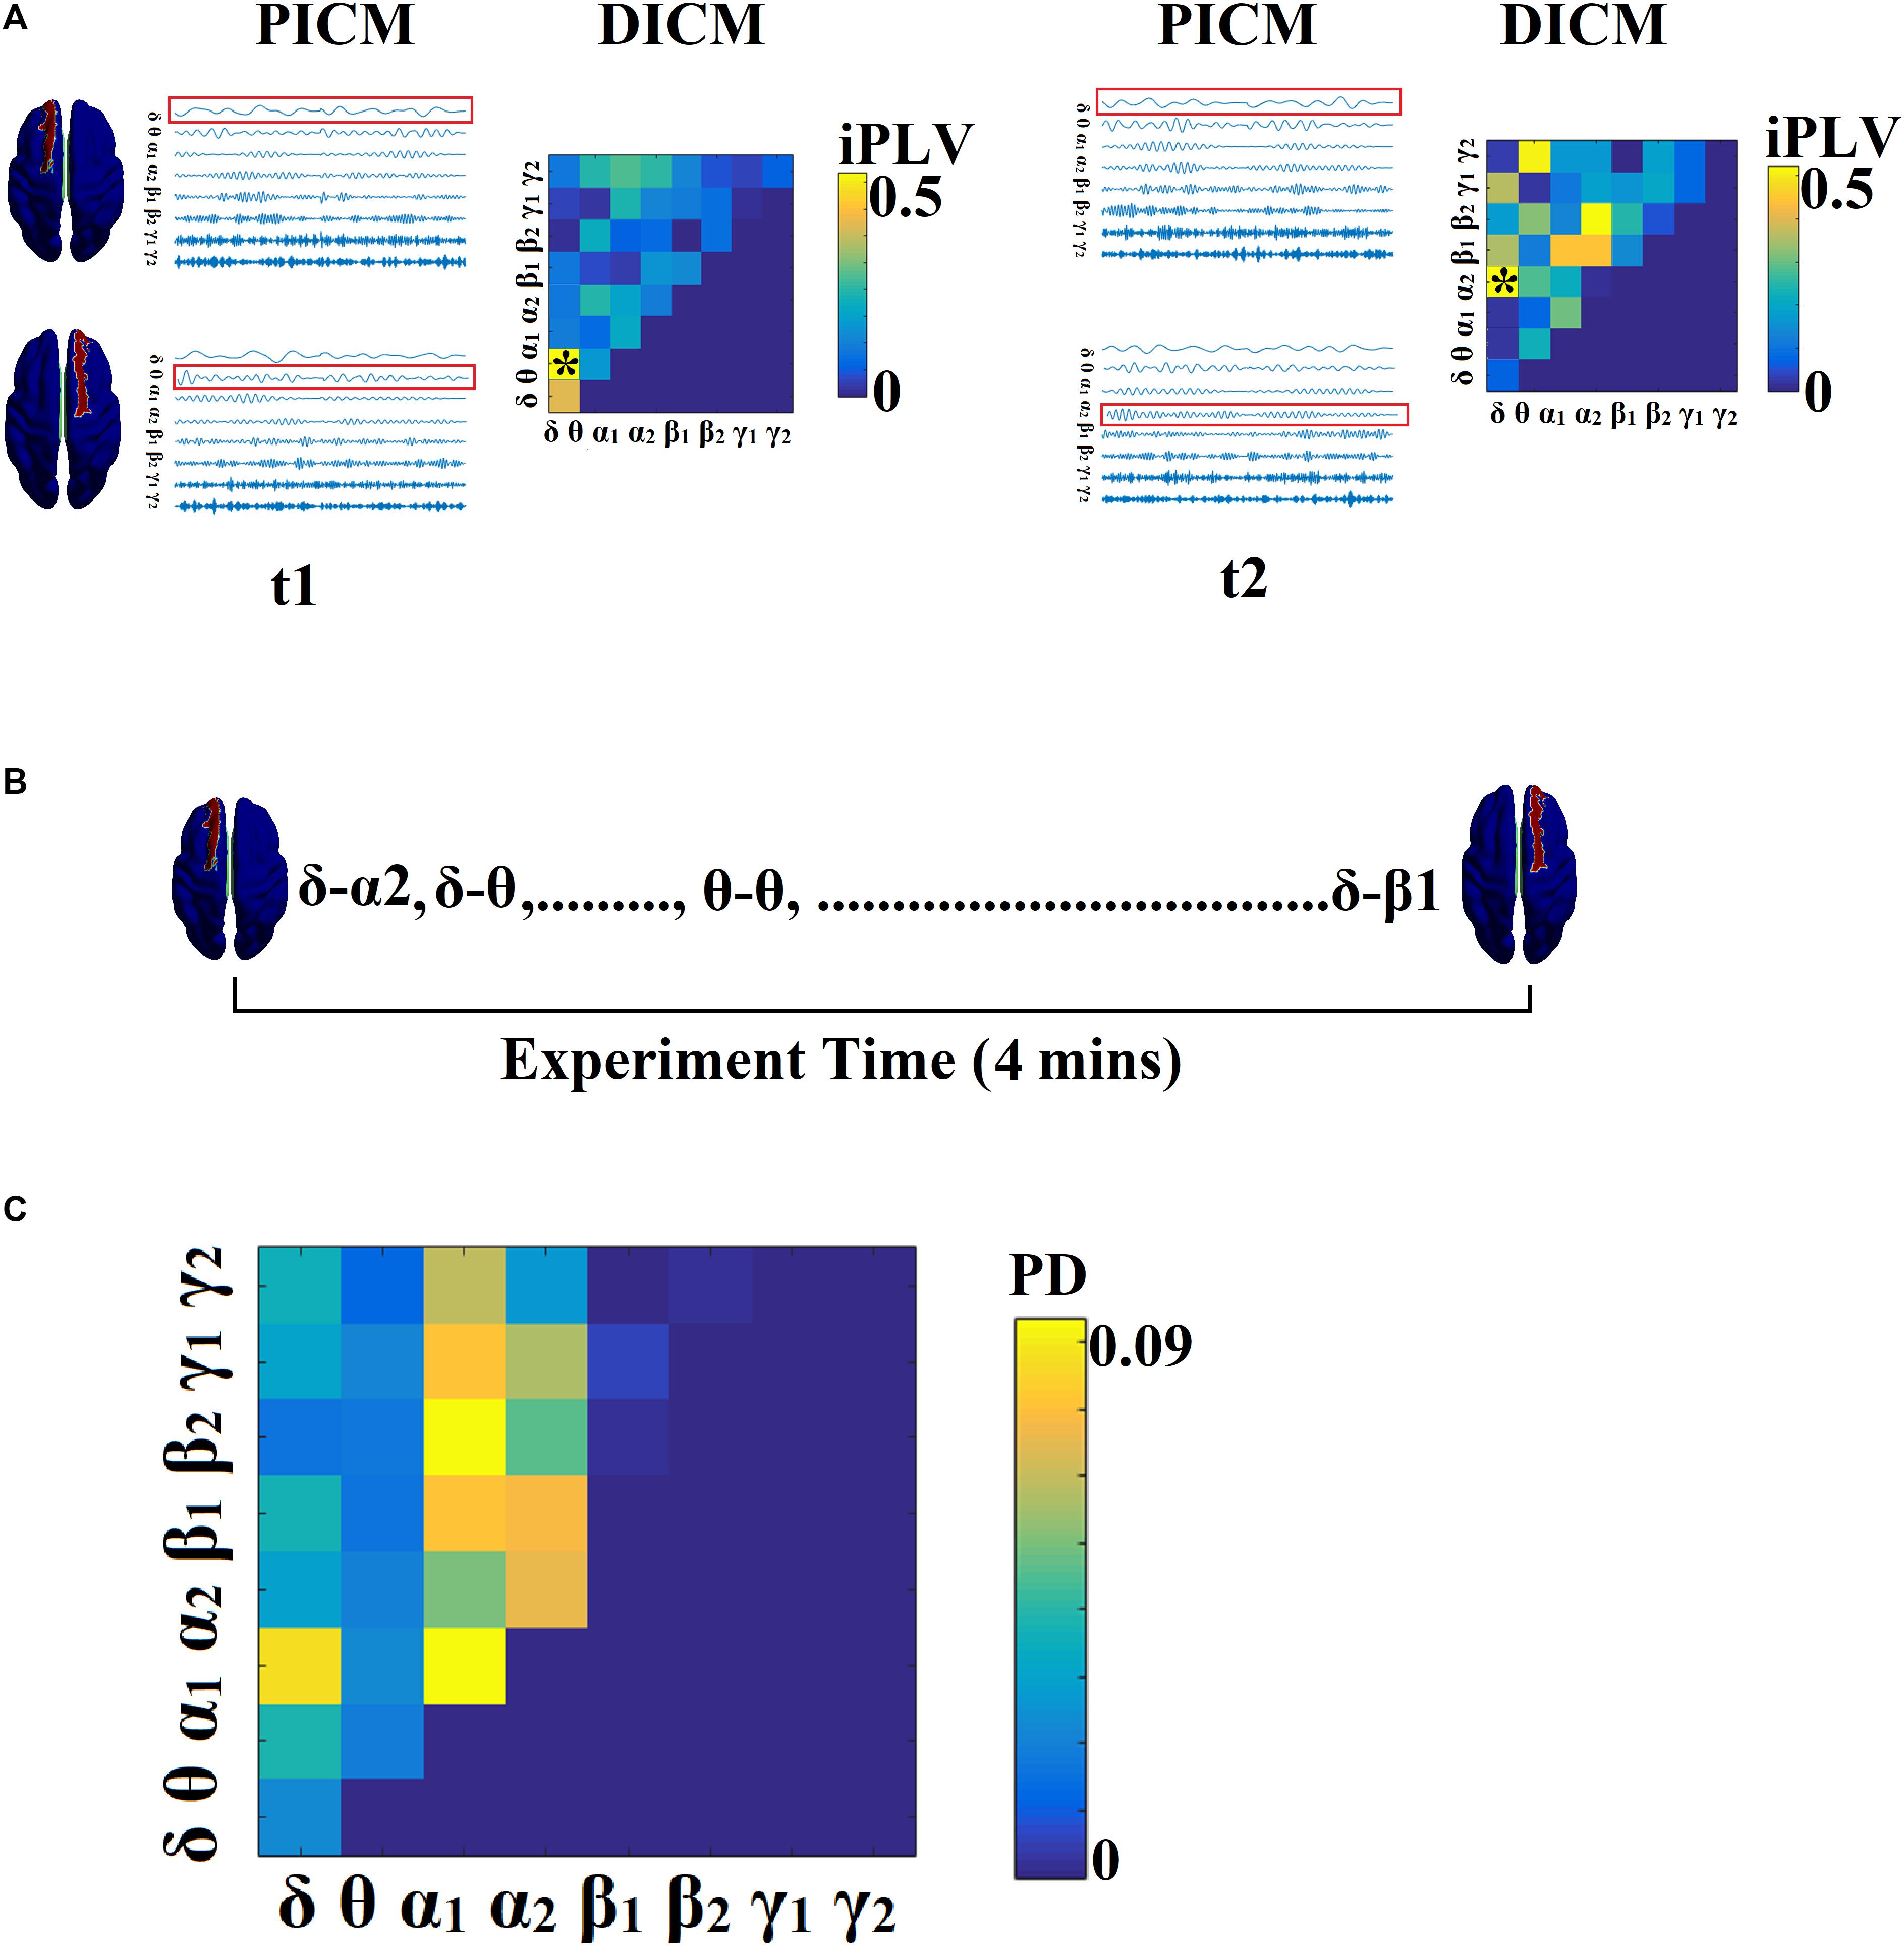
Figure 2. Determining DICM. An example for AU task derived from the first trial of the first subject. (A) Schematic illustration of our approach employed to identify the DICM between two sources (Left superior frontal gyrus, Right superior frontal gyrus) for two consecutive sliding time windows (t1, t2) during the first 4 s of resting-state activity from the first healthy control subject. In this example, the functional synchronization between band-passed signals from the two sources was estimated by imaginary Phase Locking (iPLV). In this manner iPLV was computed between the two sources either for same-frequency oscillations (e.g., δ to δ…, γ2-γ2; 8 intra-frequency couplings) or between different frequencies (e.g., δ to 𝜃, δ to α1..., γ1-γ2; 28 cross-frequency pairs). The sum of 8 + 28 = 36 refers to Potential Intrinsic Coupling Modes (PICM), which are tabulated in a matrix format. In the main diagonal, we inserted the intra-frequency couplings while in the off-diagonal the cross-frequency pairs were inserted. Statistical filtering, using surrogate data for reference, was employed to assess whether each iPLV value was significantly different from chance. During t1 the DICM reflected significant phase locking between α1 and α2 oscillations (indicated by red rectangles) in the oscillation list and a “∗” in the comodulogram. The DICM remains stable also for the t2 between α1 and α2 oscillations whereas during t3 the dominant interaction was detected between 𝜃 and α2 oscillations. (B) Burst of DICM between Left and Right superior frontal gyrus. This packing can be thought to associate the “letters” contained in the DICM series to form a neural “word,” a possible integration of many DICMs. From this burst of DICM, we can quantify the probability distribution (PD) of DICM across experimental time (see C). (C) Tabular representation of the probability distribution (PD) of DICM for left and right superior frontal gyrus across the experimental time shown in B. This matrix is called a comodulogram and keeps the information of PD from the 36 possible coupling modes. In the main diagonal the PD of the 8 possible intra-frequency coupling can be seen while in the off-diagonal are the 28 possible cross-frequency pairs. PICM, Prominent Intrinsic Coupling Modes; DICM, Dominant Intrinsic Coupling Modes; iPLV, imaginary part of Phase Locking Value; PD, probability distribution.
Figure 3A demonstrates the first 10 snapshots of the DFCG from the first healthy control subject.
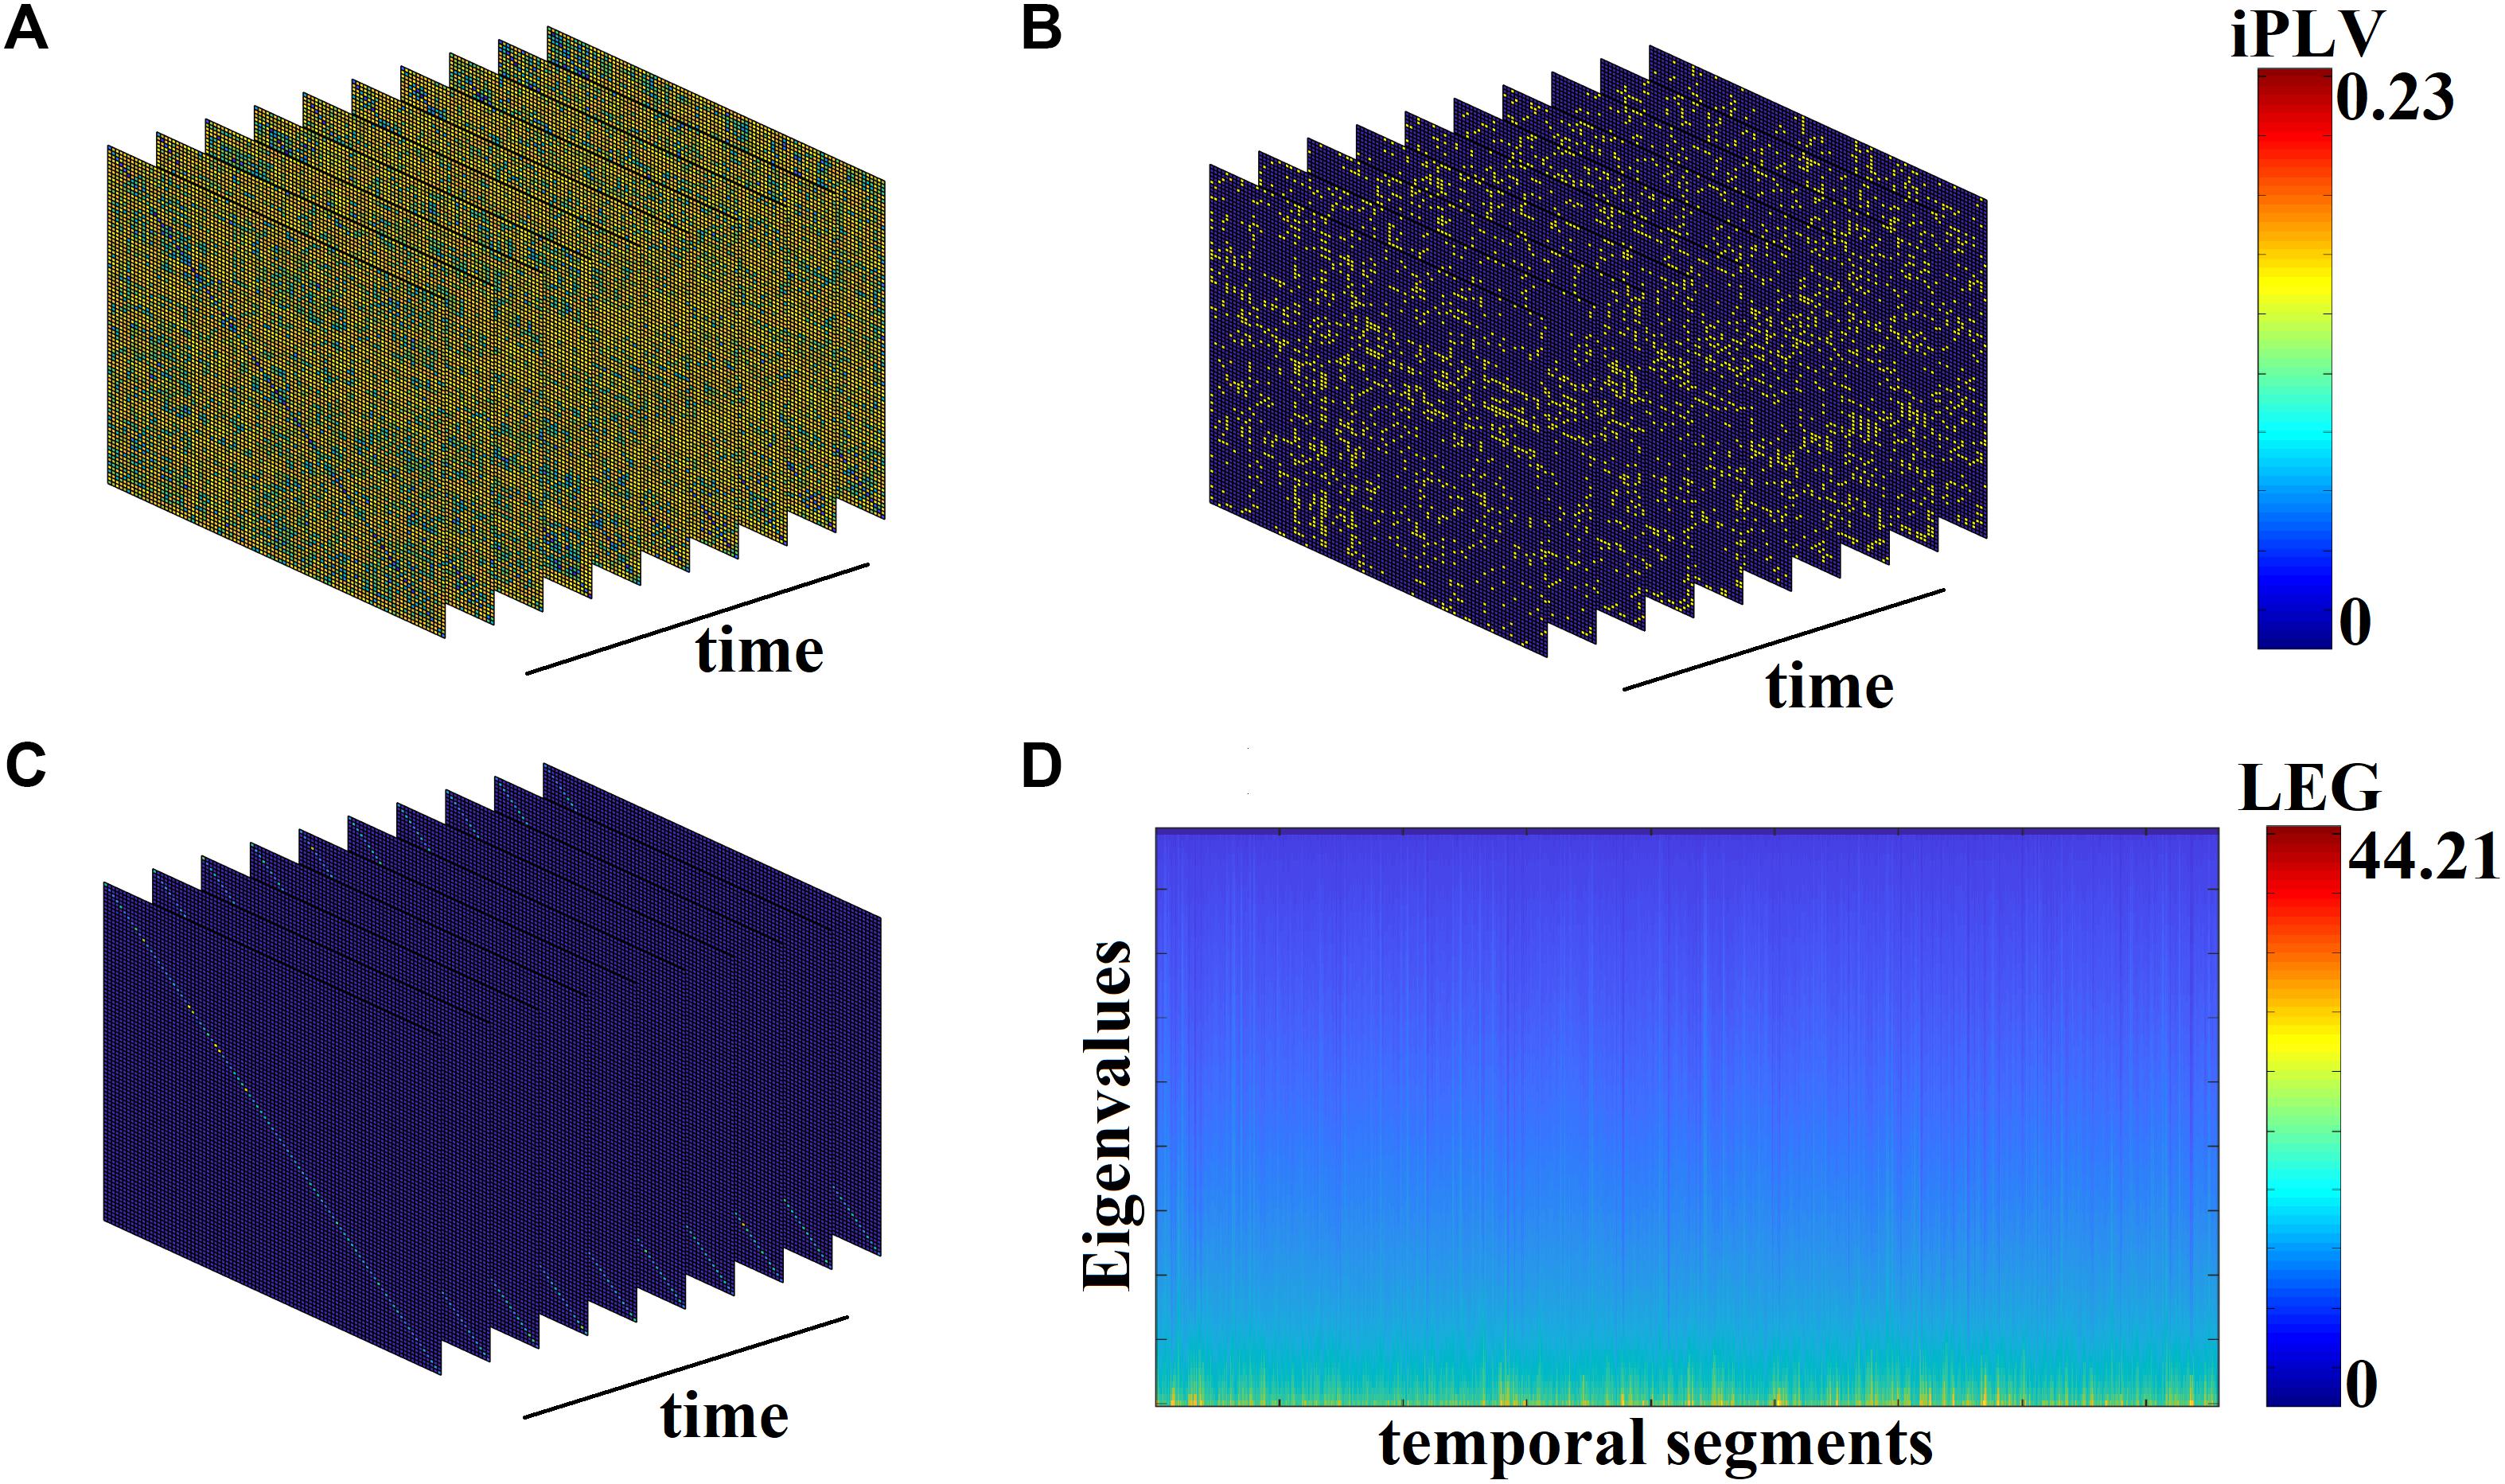
Figure 3. From DFCG to the temporal evolution of Laplacian eigenvalues (LEG; from the first healthy control subject). (A) The first 10 snapshots of DFCG. (B) The quasi-static FCGs shown in A were topologically filtered with OMST. (C) The normalized Laplacian transformation of the topologically filtered FCGs shown in B. (D) Temporal evolution of the Laplacian eigenvalues for the 2,401 temporal segments.
Topological Filtering Scheme Based on OMSTs
Apart from surrogate analysis, which is a statistical filtering procedure of the functional couplings within an FCG akin to a regularization to sparsify the 4D array described above, we adopted a topological filtering to further enhance the network topology and the most significant interactions. To this aim, we applied a novel data-driven thresholding scheme, proposed by our group and termed Orthogonal Minimal Spanning Trees (OMSTs; Dimitriadis et al., 2017a,b), to each FCG derived from each subject and temporal segment independently.
Figure 3B demonstrates the temporal evolution of the topologically filtered dFCG for the first 10 temporal segments.
Graph Signal Processing
After extracting the most significant connections in DCFGs from each individual, we transformed every snapshot of the DFCG into the graph Laplacian variant called the normalized Laplacian matrix. With A being the functional connectivity graph and D being the degree matrix containing the degree of every node in the main diagonal, graph Laplacian L can be defined as L = D – A. The normalized graph Laplacian is defined as Lsym = D-1/2LD-1/2 (Shuman et al., 2013). We estimated the sorted eigenvalues of the Lsym for every snapshot of DFCG resulting in a two-dimensional matrix of size [source (90) × temporal segments (2.401)] per subject. These two-dimensional matrices were concatenated separately for the healthy control and disease group of the training set. Practically, the concatenation was performance was performed along the temporal direction.
Figure 3C shows the temporal evolution of the normalized Laplacian transformation of the dFCG for the first 10 temporal segments while Figure 3D is dedicated to the temporal evolution of the eigenvalues.
A Vector-Quantization (VQ) Modeling of Group NMTSeigen
This subsection describes briefly our symbolization scheme, presented in greater details elsewhere (Dimitriadis et al., 2011, 2012a, 2013a,b). The group-specific NMTSeigen patterns can be modeled as prototypical FC microstates (FCμstates). In our previous studies, we demonstrated a better modeling of DFCG based on vector quantization approach (Dimitriadis et al., 2013a, 2017b, 2018b). A codebook of k prototypical FC states (i.e., functional connectivity microstates-FCμstates) was first designed by applying the neural-gas algorithm (Dimitriadis et al., 2013a). This algorithm is an artificial neural network model, which converges efficiently to a small number k of codebook vectors, using a stochastic gradient descent procedure with a soft-max adaptation rule that minimizes the average distortion error (Martinetz et al., 1993). A neural-gas algorithm has been applied independently to each group by concatenating the 2D matrix of size [2.401 × 90] that describes the fluctuation of Laplacian eigenvalues.
The outcome of the neural-gas algorithm over NMTSeigen is the construction of a symbolic sequence of group-specific prototypical FCμstates, one per subject. An example of such a symbolic time series (STS) is a Markovian chain with three FCμstates: {1, 2, 3, 2, 1, 3, 2…} where each integer defines a unique brain state (FCμstates) assigned to every quasi-static temporal segment.
External Validation in a Blind Dataset
We designed a novel approach for classifying a blind subject. We reconstructed the subject-specific NMTSeigen with both HC-based prototypical FCμstates and MCI-based prototypical FCμstates. Specifically, for every temporal segment expressed via a vector of 90 eigenvalues we estimated which of the prototypical FCμstates is much closer, employing Euclidean distance for an appropriate criterion. Under this scheme, we rebuilt the original NMTSeigen twice, once using prototypical FCμstates of HC and once using prototypical FCμstates of MCI. Then, we estimated the reconstruction mean squared error between the original NMTSeigen and the two rebuilt NMTSeigen based on prototypical FCμstates. Finally, we assigned the test sample to the class with the lowest reconstruction error (see Figure 6).
Markov Chain Modeling for Synchro State Transitions
The temporal sequence of spontaneous activity can be modeled as a Markovian process, which predicts the probabilities of several discrete states recurring or switching among themselves at different time points analyzing time-point-based brain activity (Van de Ville et al., 2010; Gärtner et al., 2015). Several studies have investigated transition probabilities between phase-synchronized states on a sub-second temporal scale, untangling the Markovian property and the switching behavior of finite network-level brain states (Dimitriadis et al., 2013c, 2015b; Baker et al., 2014; Jamal et al., 2014).
Markovian Process of Time-Sequential FCμstates
A Markov model describes the underlying dynamical nature of a system that follows a chain of linked states, where the appearance of a state at any given instant depends only on the preceding ones (Gagniuc, 2017). In the Markov chain modeling for synchrostate transitions during the deductive reasoning and task-free processes, the first order transition matrices were estimated in a probabilistic framework. According to discrete-time Markov chain theory (Jarvis and Shier, 1999), a finite number (S1, S2…, Sm) of inferred states that evolve in discrete time with a time-homogeneous transition structure can be mathematically represented by either its transition probability matrix or its directed graph (digraph). Here, the inferred states refer to the prototypical FCμstates. A feasible transition is one whose occurring probability is greater than zero. The probability of transition from node (state) i to node j is defined as
where Nij is the number of transitions from node i to node j. Obviously, the sum of the transition probabilities along each row of the transition matrix P equals one. The complete digraph for a finite-state Markov process has edges of transition probabilities between every node i and every other node j. Here, nodes refer to FCμstates in the Markov chain. In the digraphs created in this study, Pij survives a p-value derived from 10,000 shuffled-surrogates of the original STS.
Temporal Measurements of an FCμstate Symbolic Sequence
For further summarizing inter-FCμstate transition patterns, relevant temporal measurements were obtained and analyzed from the Markov chain structures of the subject-specific FCμstate sequence, including: (1) fractional occupancy for each class of FCμstate (i.e., the fraction of the number of distinct FCμstate of a given class occurring within 2,401 temporal segments), (2) dwell time for each FCμstate which gives the average time the brain spends within a specific FCμstate in consecutive temporal segments, (3) transition probabilities (TP) of a given FCμstate to any other functional connectivity state, (4) the complexity index (CI) that quantifies the richness of the spectrum of code words formed up to a length based on the symbolic time series (Dimitriadis, 2018), and (5) the flexibility index (FI) that quantifies the transition of the brain states (FCμstates) between consecutive temporal segments.
Assessing the Statistically Significant Level of the Symbolic-Based Estimates
To assess the statistically significant level of the aforementioned four estimates (excluding CI), we shuffled the group symbolic time series 10,000 times and re-estimated the surrogate-based p-values for every estimate per subject. CI is normalized by default with surrogates.
Linking MMSE With Chronnectomics
To investigate the possible relation between MMSE and the chronnectomics derived by the FCμstate symbolic sequence (see section “Temporal Measurements of an FCμstate Symbolic Sequence”), we used the canonical correlation analysis (CCA) approach to see whether MMSE correlates with seven chronnectomic variables. In our analyses, the significance of the correlation was estimated using Bartlett’s approximate chi-squared statistic as implemented in MATLAB.
Algorithms and MATLAB Code
All the algorithmic steps of constructing the DCFGs were implemented on inhouse software written in MATLAB, freely available from the first author’s website. LCMV beamformer was programmed under Fieldtrip’s environment (Oostenveld et al., 2011).
Results
Group Prototypical FCμstates
Figure 4 illustrates the prototypical group-specific FCμstates for each group by assigning the 90 AAL brain areas to five well-known brain networks. The size and color of every circle decode the mean degree within every brain network while the color of each connection defines the mean functional strength between every pair of brain networks. FCμstates can be described based on the most connected brain networks focusing on their degree. The most connected brain networks are the DMN and CO. Following a statistical test by comparing the functional coupling strength between FPN and DMN independently for every FCμstate, we found significant higher values for FCμstates 1 and 3 for HC compared to MCI (p = 0.00045 for FCμstate 1 and p = 0.000012 for FCμstates 3, Wilcoxon Rank Sum Test).
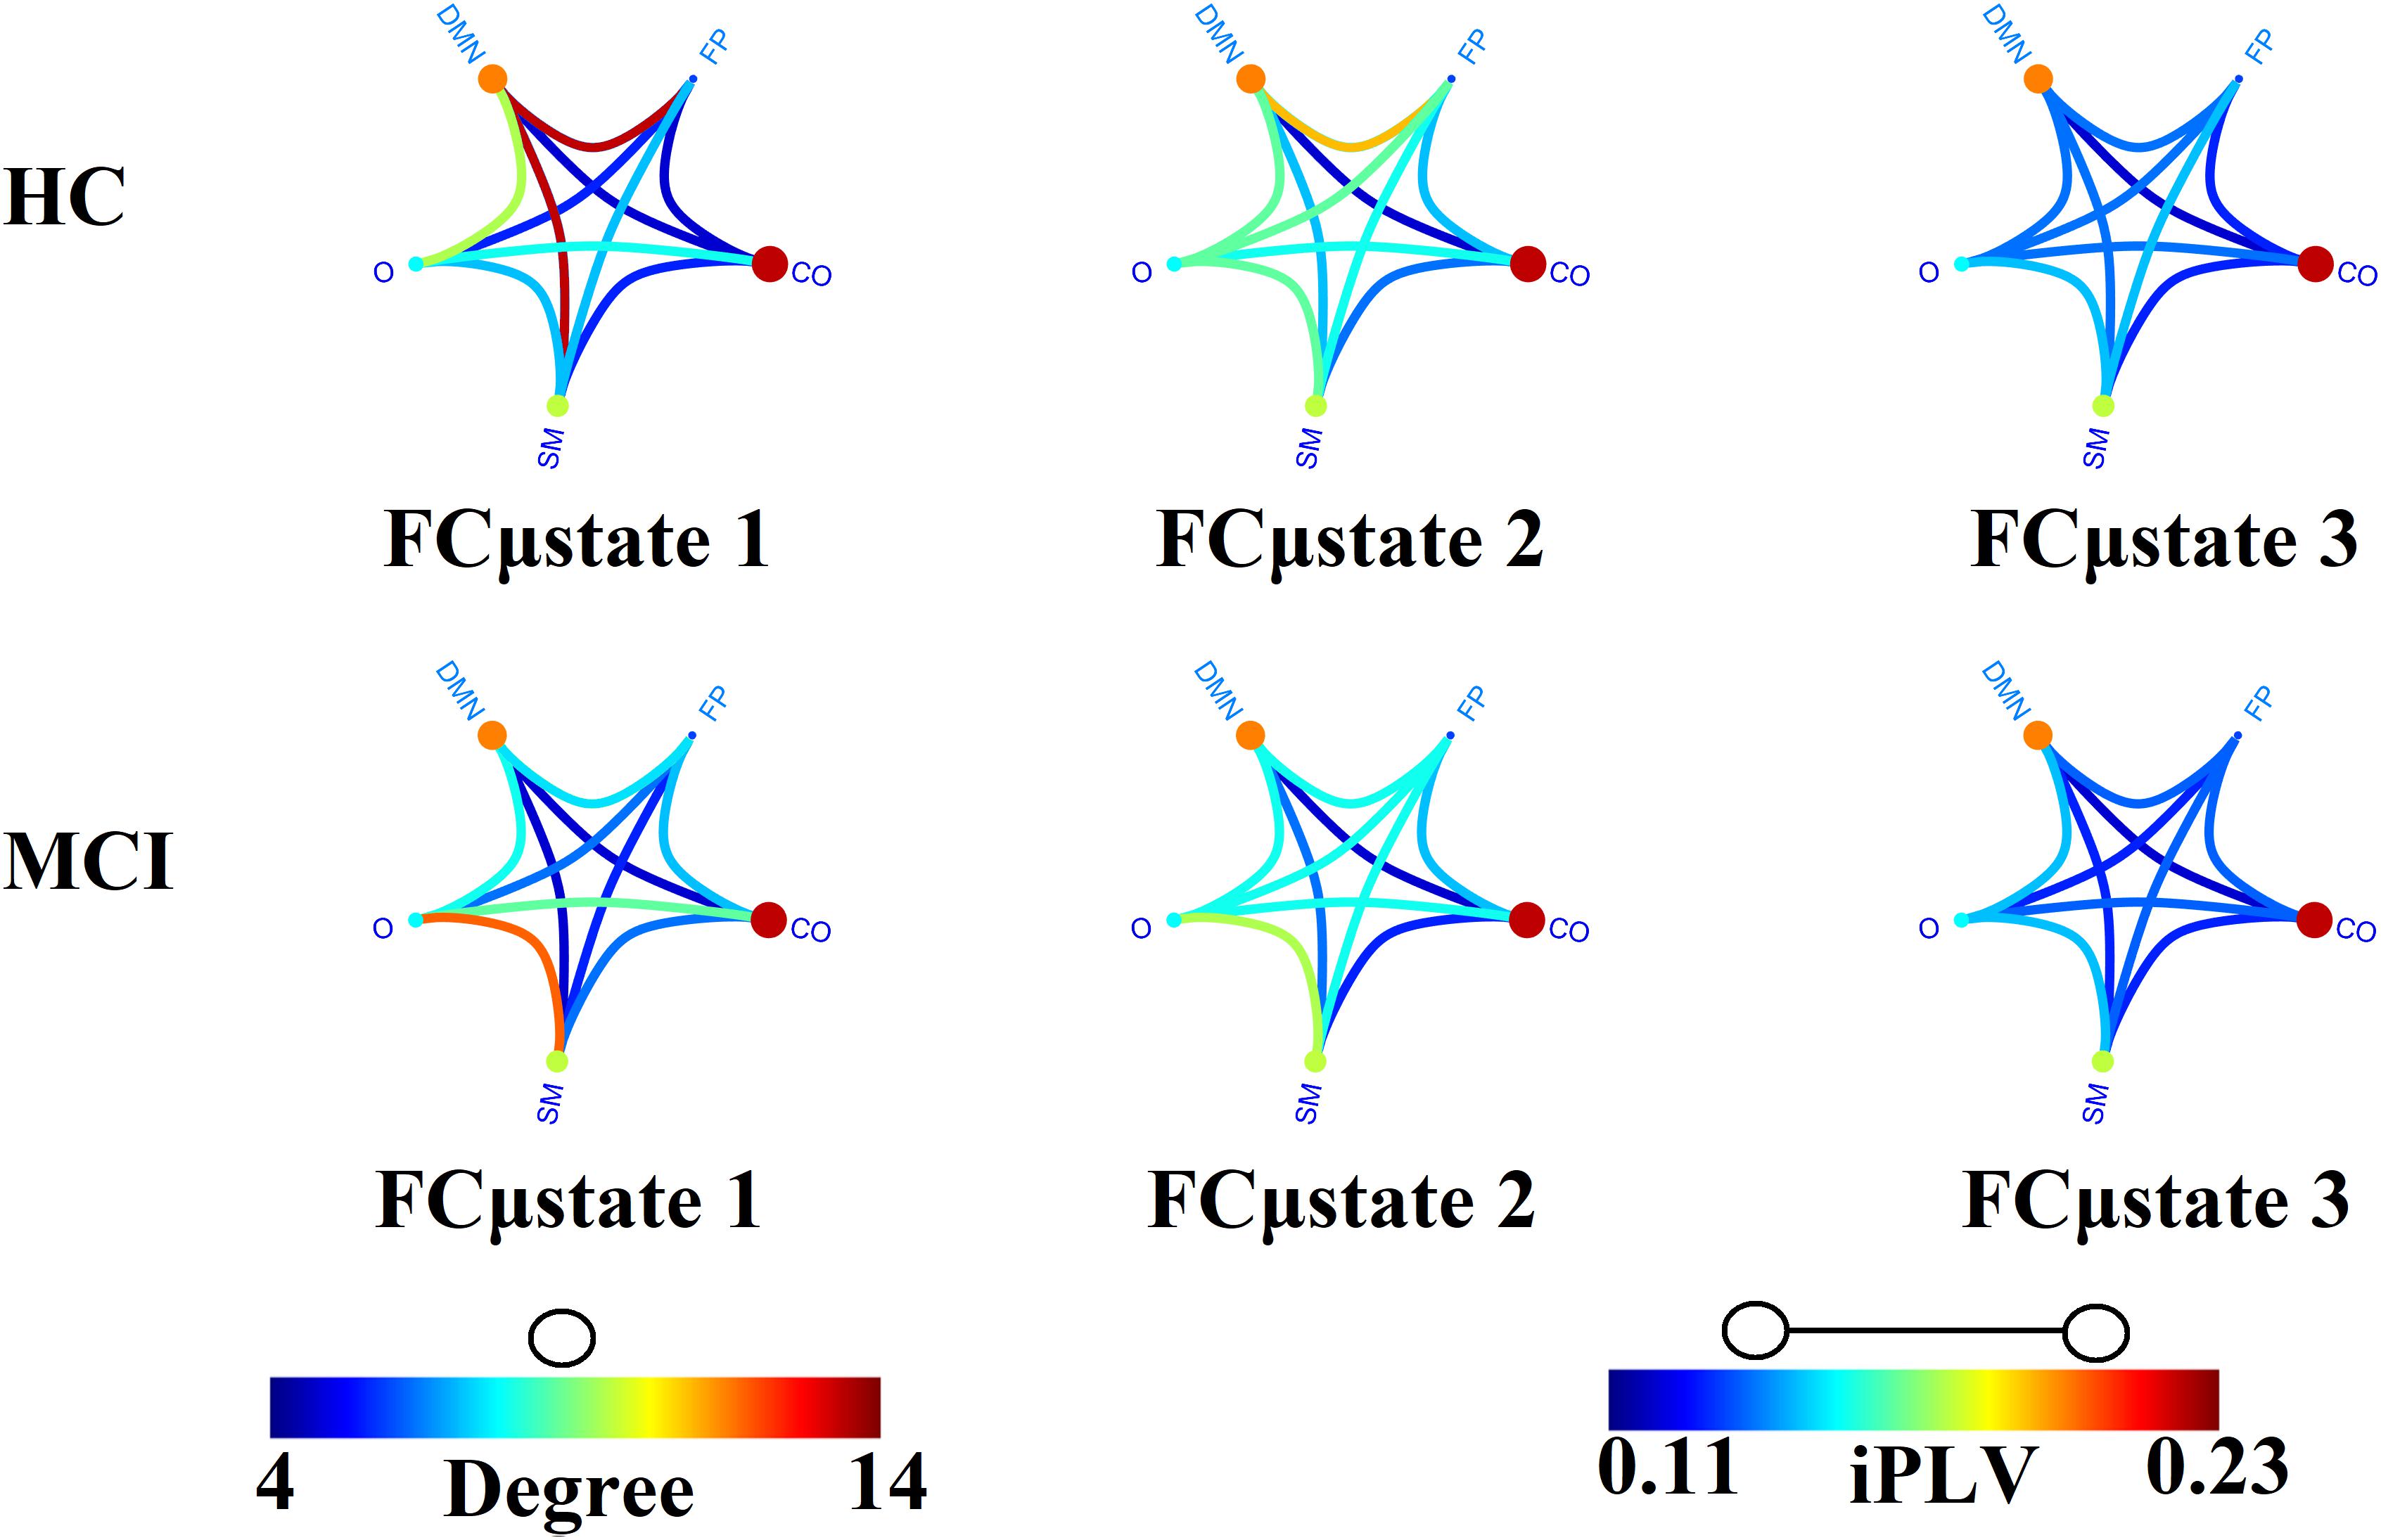
Figure 4. Prototypical FCμstates for healthy control (HC) and MCI. The neural gas algorithm revealed three prototypical FCμstates per group with different spatial patterns. FP, Fronto-Parietal; DMN, Default Mode Network; CO, Cingulo-Opercular; S, Sensorimotor; O, Occipital.
Figure 5 demonstrates the dynamic reconfiguration of prototypical FCμstates for the first subject of both groups for the 1st min.
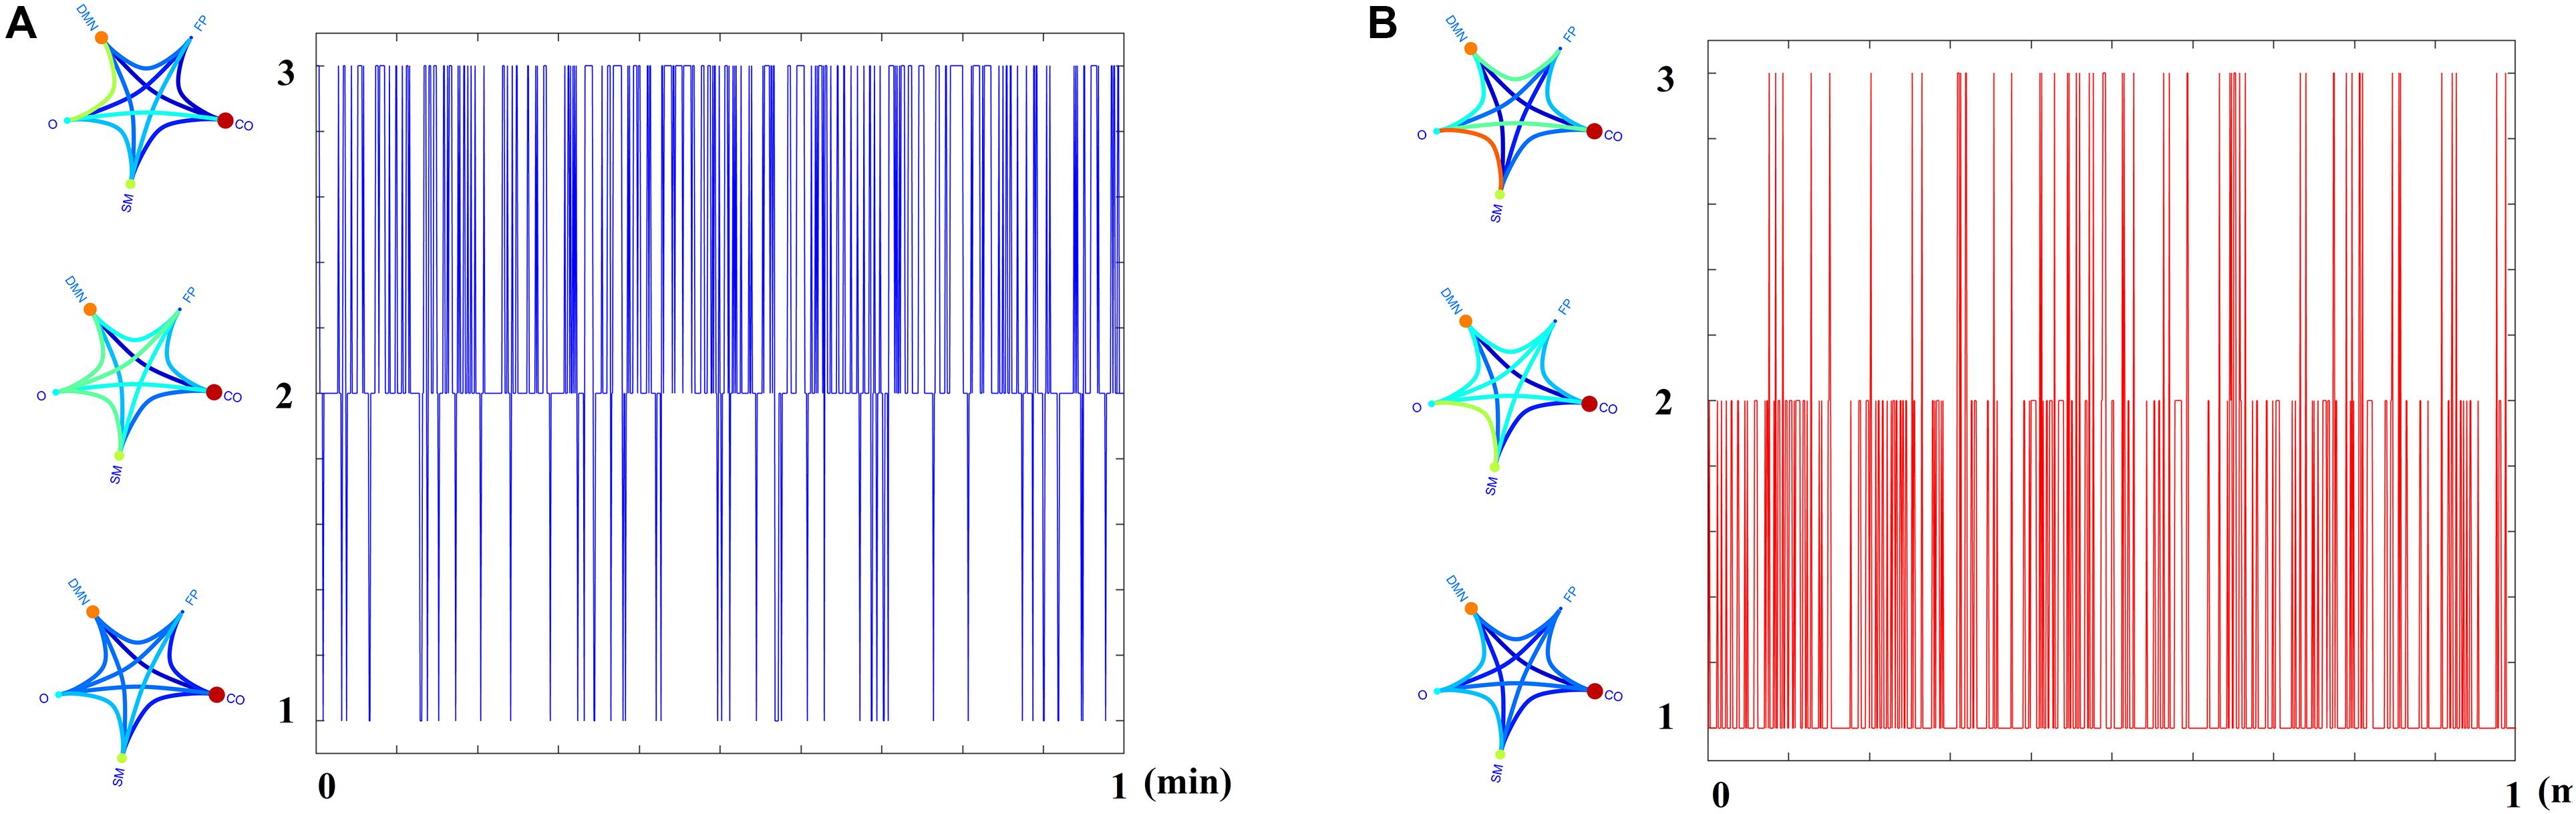
Figure 5. Temporal Evolution of Prototypical FCμstates for the first subject of (A) HC and (B) MCI group for the 1st min of resting state.
Classification of Blind Samples via Representations With Prototypical Netμstateseigen
Each test sample with an unknown label was classified to one of the two classes using as a criterion the minimization of the reconstruction error. The minimum reconstruction error denotes the class label of the sample. In our study, we used 20 samples with a distribution of 11 MCIs and 9 controls with 85% accuracy for CENT (17 out of 20) and 70% for the PCA representation scheme (14 out of 20). SID received the blind dataset from MEL, who evaluated the outcome of this research. Figure 6 illustrates the methodological approach. Figure 6A refers to the temporal resolution of the Laplacian eigenvalues of a blind HC subject while Figures 6B,C the reconstruction of Figure 6A matrix employing the Prototypical Net μstateseigen related to HC and MCI, correspondingly. Based on the reconstruction error between the original matrix (Figure 6A) and the two reconstructed matrixes (Figures 6B,C), a decision regarding the label of the blind subject was taken based on the lowest reconstruction error (Figure 6D).
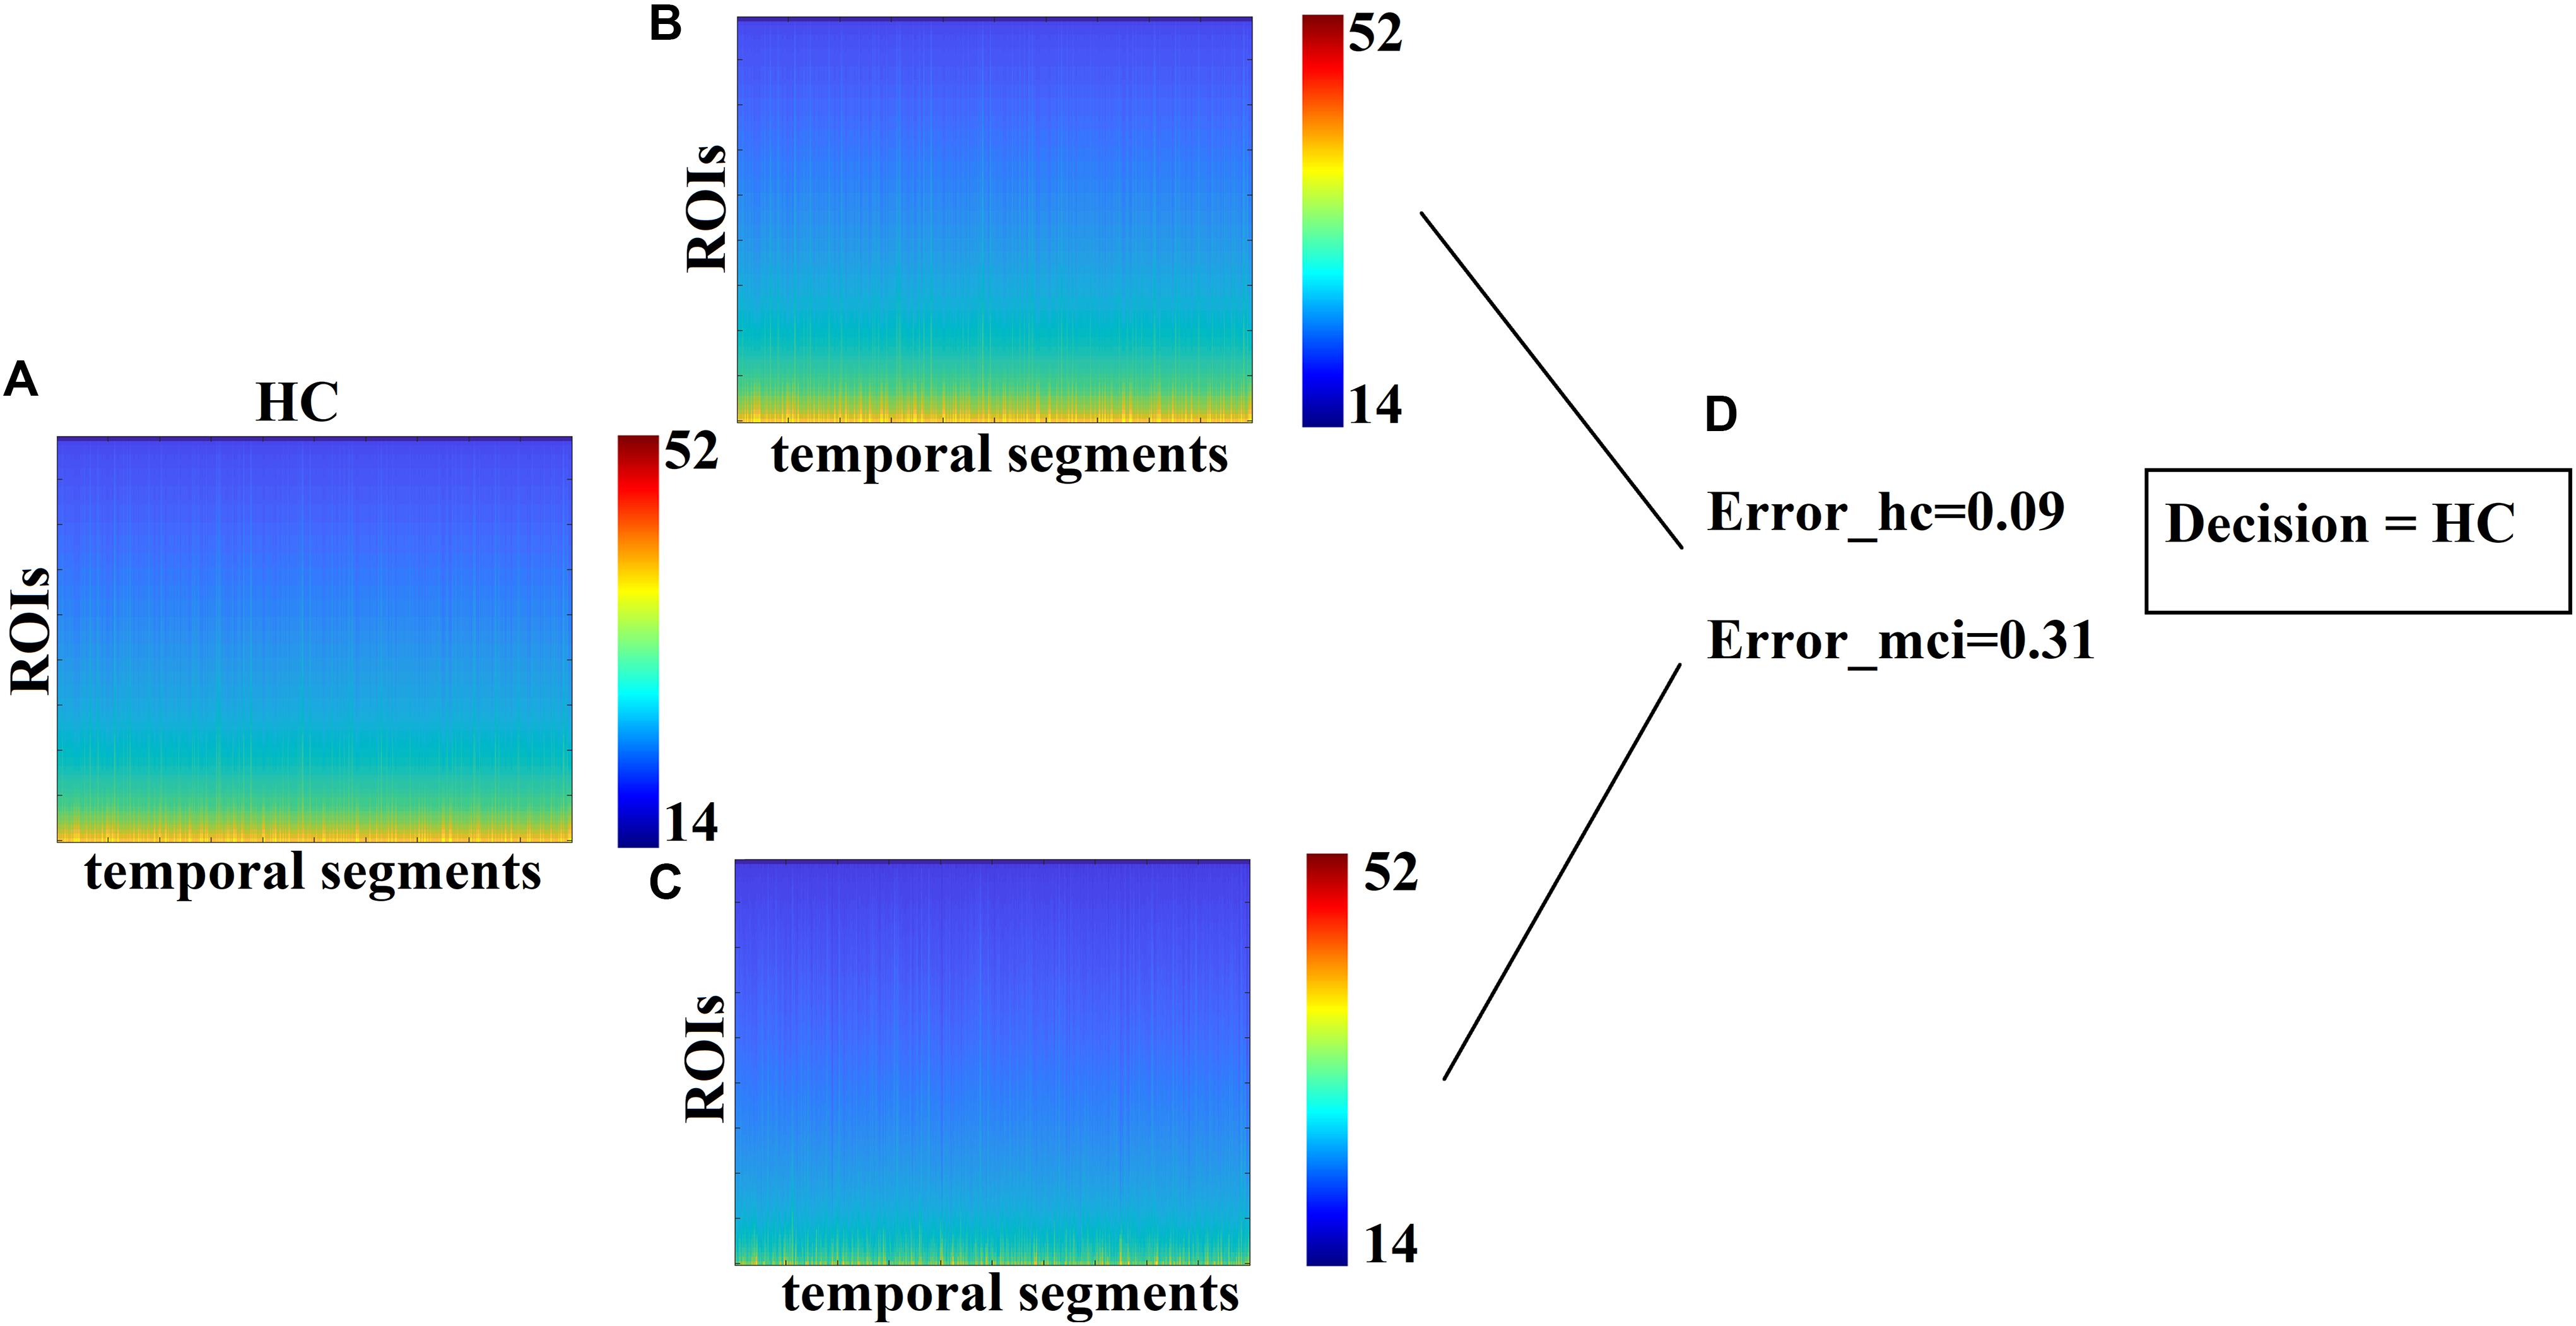
Figure 6. Classification of blind subjects via prototypical Net μstateseigen. (A) Evolution of eigenvalues for the test sample. (B,C) Reconstruction of the temporal evolution of eigenvalues of the train sample with both group-specific prototypical Net μstateseigen. (D) Estimation of the reconstruction error between the original temporal evolution of eigenvalues in A. and the two prototypical-based shown in B. The decision of the subject’s label was taken via the lower reconstruction error.
Group-Differences of Temporal Measurements Derived From FCμstate Symbolic Sequence
FI, OT, and DT were significantly higher than the surrogates based values derived from the shuffled symbolic time series (p < 0.001). We detected significant higher FI and CI for HC compared to MCI applying a Wilcoxon Rank-Sum test (Figure 7, p-value < 0.00000001). Summarizing the results from OT and DT, HC subjects spent significantly higher time compared to MCI to first and third FCμstate while MCI spent significantly more time to the second FCμstate Figure 8, p-value < 0.00000001).
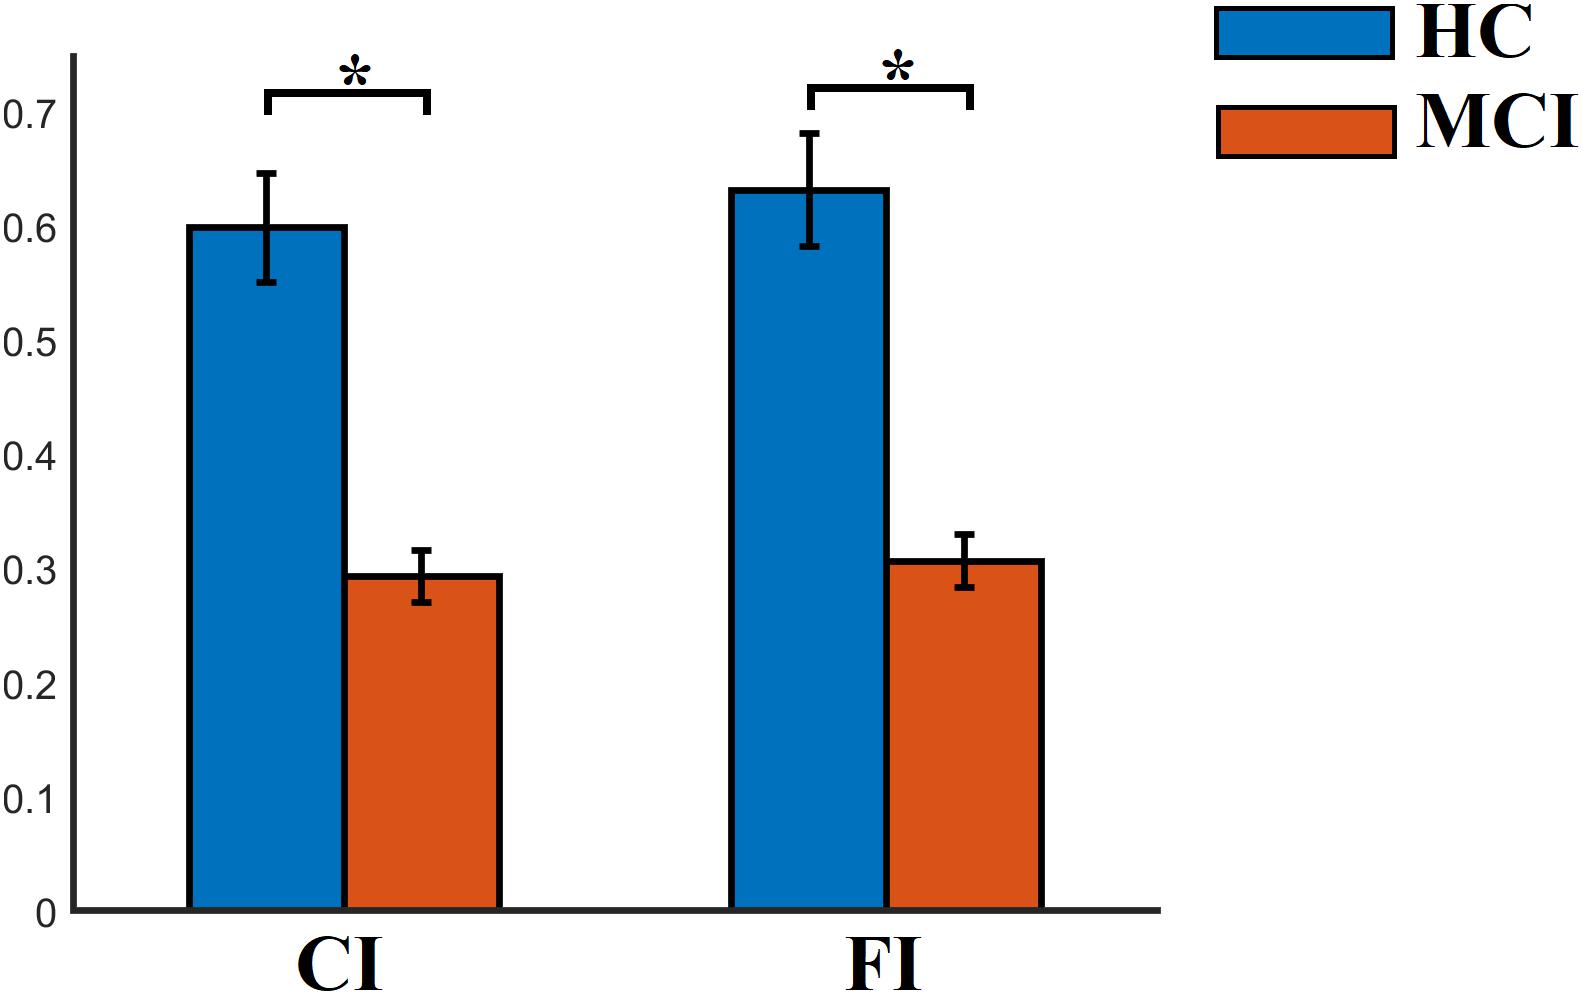
Figure 7. Group-averaged CI and FI. ∗Wilcoxon Rank-Sum Test; p-value < 0.00000001.
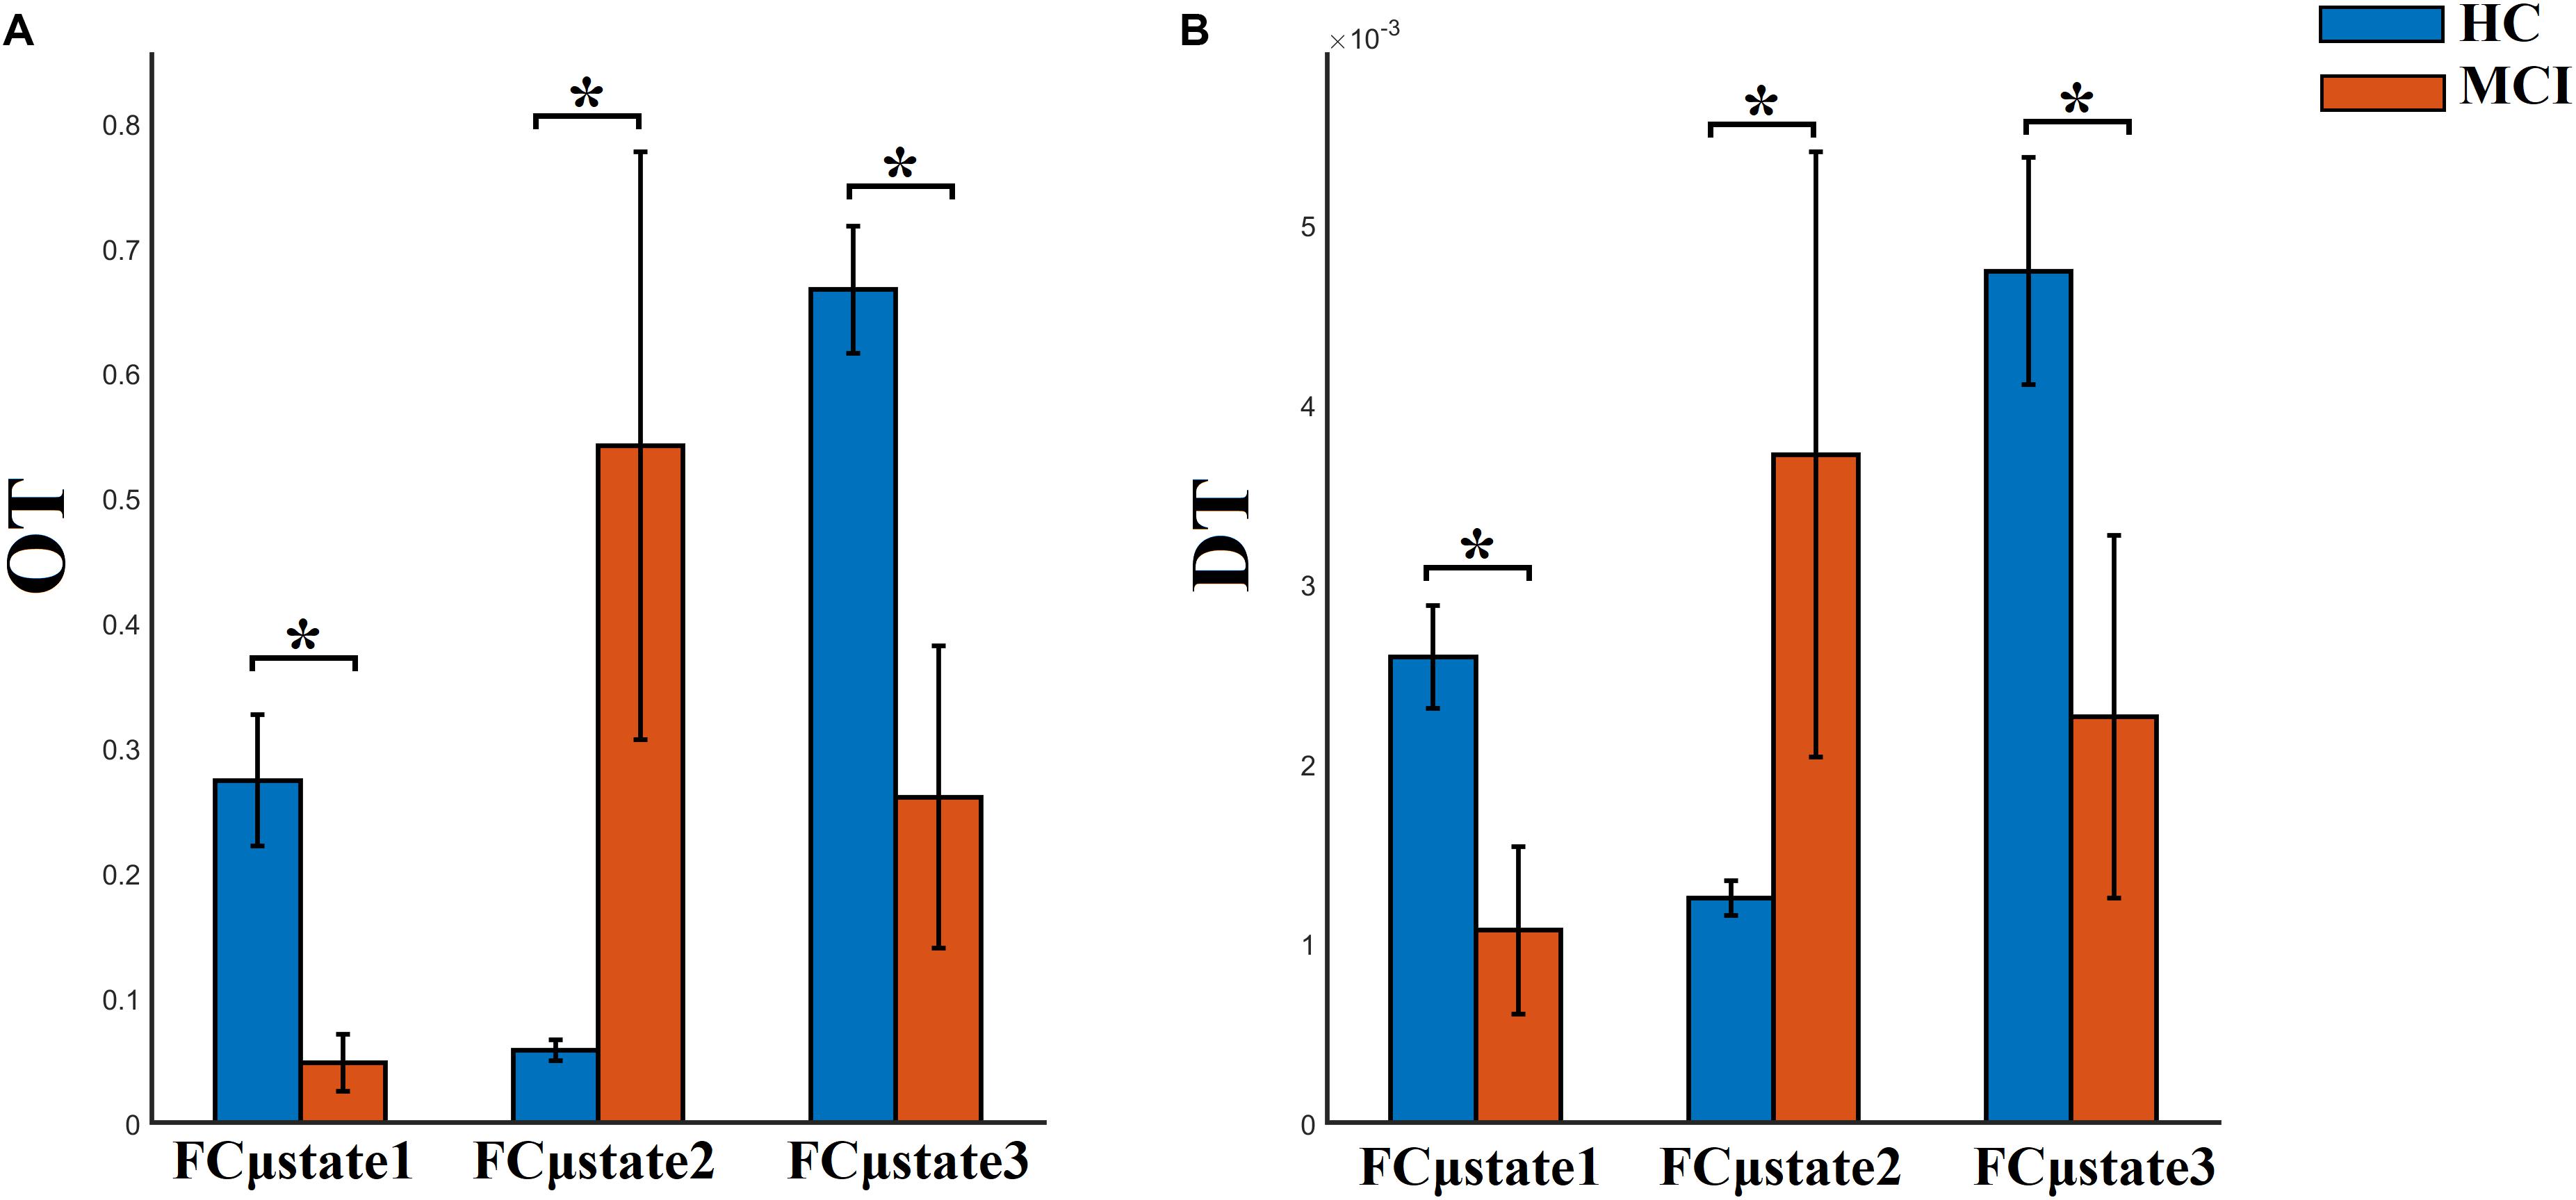
Figure 8. Group-averaged (A) OT and (B) DT per FCμstate. ∗Wilcoxon Rank-Sum Test; p-value < 0.00000001.
Modeling Dynamic Reconfiguration of Functional Connectivity Graphs as a Markovian Chain
The outcome of the VQ modeling of NMTSeigen is the derived Netμstateseigen called FCμstates (see Figure 4), where its evolution is described via a symbolic time series, a Markovian chain. Figure 9 illustrates a well-known scheme of the group-averaged transition probabilities (TP) between the three FCμstates for both groups. Our analysis revealed significant group differences in terms of TP, while the TPs were significantly different compared to the surrogates’ symbolic time series. Self-loops defined the “staying” TP of brain dynamics to the same brain state.
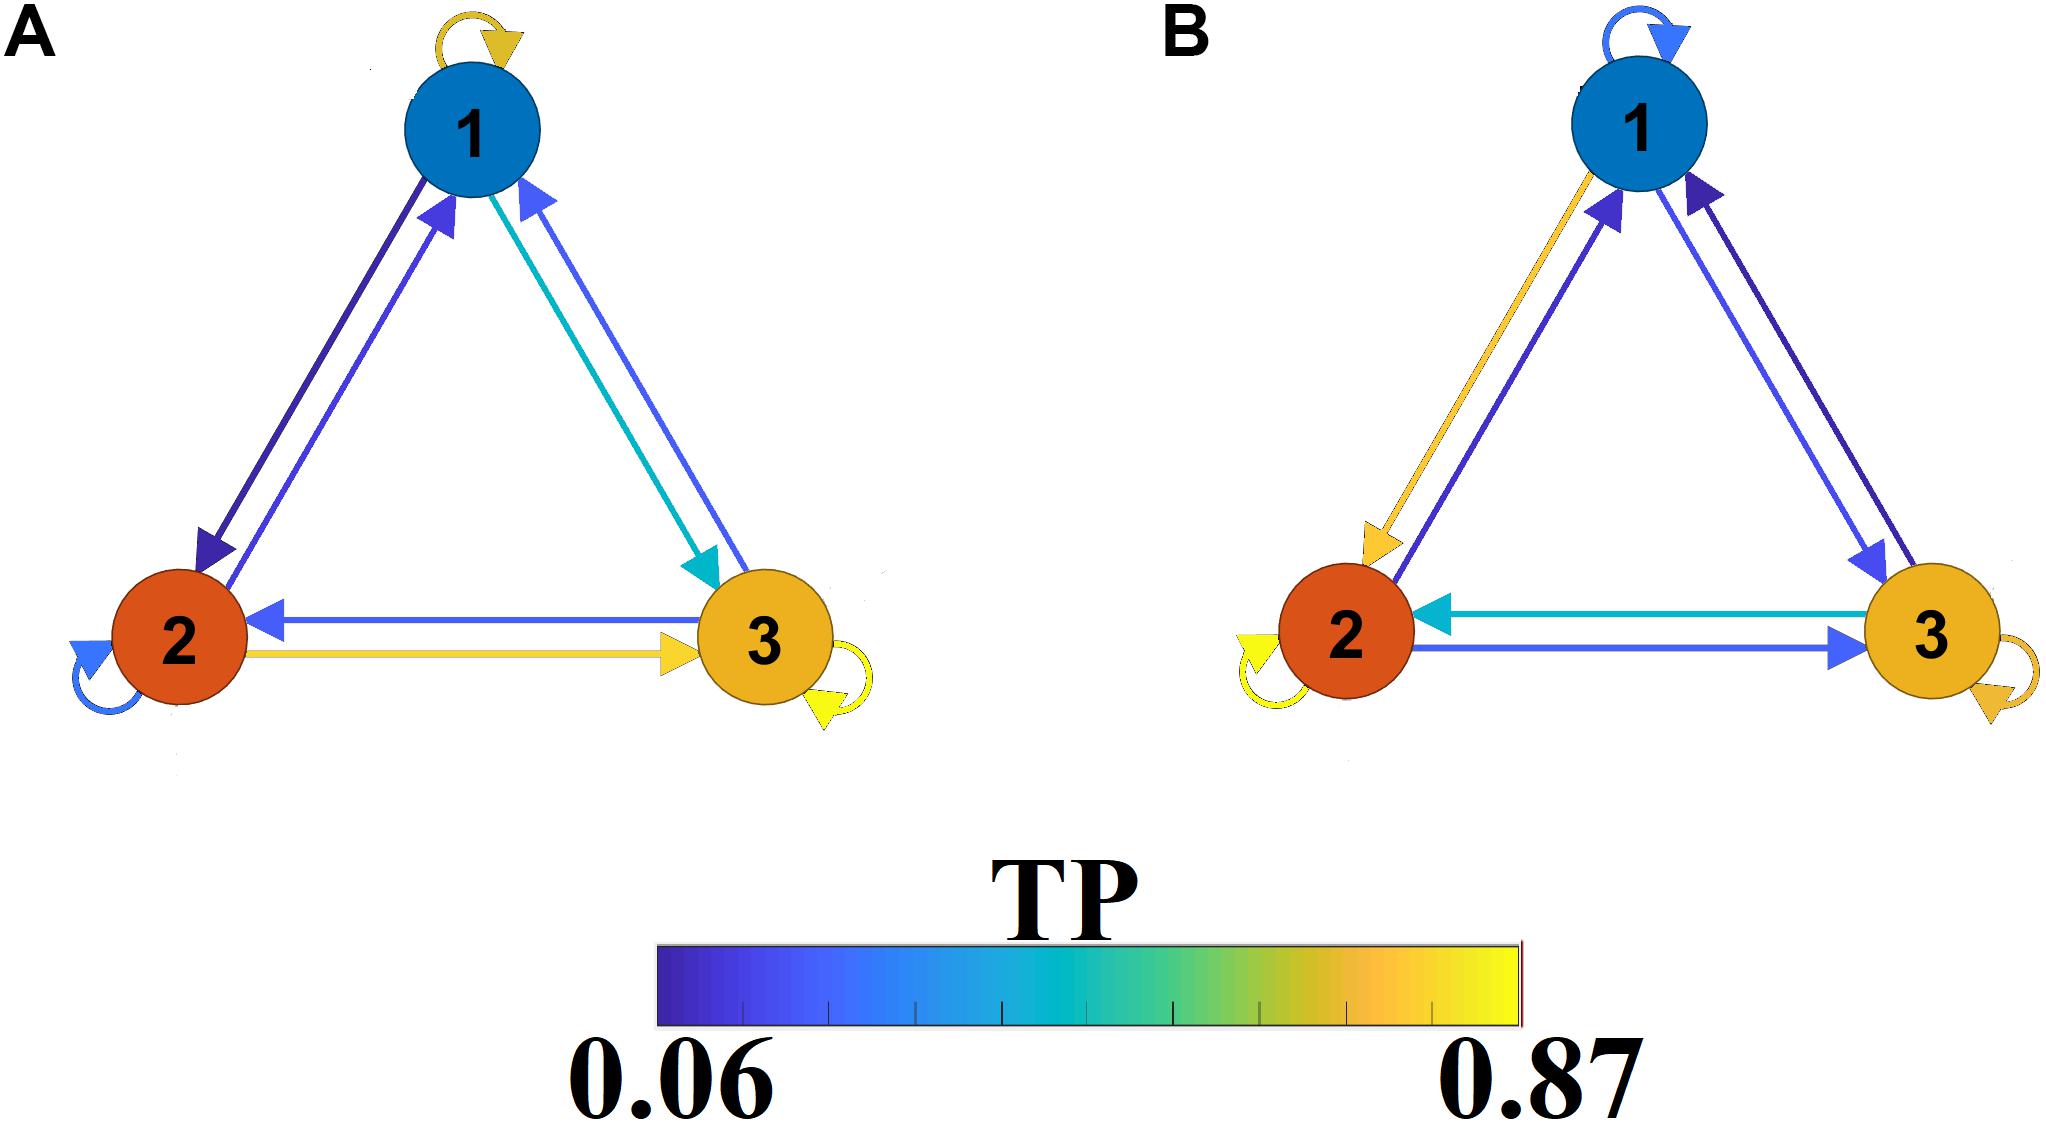
Figure 9. A finite-state diagram showing group-averaged transition probability matrix (TP) of the symbolic time series, which describes the temporal evolution of the brain, states (FCμstate). (A) For healthy control and (B) forMCI.
The symbolic time series illustrated in Figure 5 is a Markovian chain of order 1 and it is shown schematically with a diagram of three nodes defining the three FCμstates (Figures 4, 9) while the arrows from one state to the other show the TP. Our results revealed significant group differences between every possible brain state transition (Wilcoxon Rank-Sum test, p < 0.0001/9).
Comodulograms of Dominant Intrinsic Coupling Modes (DICM)
Probability distributions (PD) of prominent intrinsic coupling modes across all sources pairs and time windows were summarized for each group in the form of an 8 × 8 matrix. The horizontal axis refers to the phase modulating frequency (Hz) while the y-axis refers to the amplitude modulated frequency (Hz). The main diagonal of the comodulograms keeps the PD of intra-frequency phase-to-phase coupling. Group-averaged comodulograms in Figure 10 demonstrate the empirical PD of DICM revealing a significant role of α1 as phase modulator of the whole studying spectrum up to high-gamma (γ2) activity, which covers almost 50% of pairwise source connections and time windows. No significant trend was detected regarding the PD of each pair of frequencies between the two groups (p < 0.05, Wilcoxon rank-sum test, Bonferroni corrected). Moreover, no significant difference was found regarding the PD of the groups for every possible pair of sources (p < 0.05, Wilcoxon rank-sum test, Bonferroni corrected). Finally, transition dynamics of DICM between consecutive time windows at every source pair did not uncover any group difference (for further details, see Dimitriadis et al., 2016a).
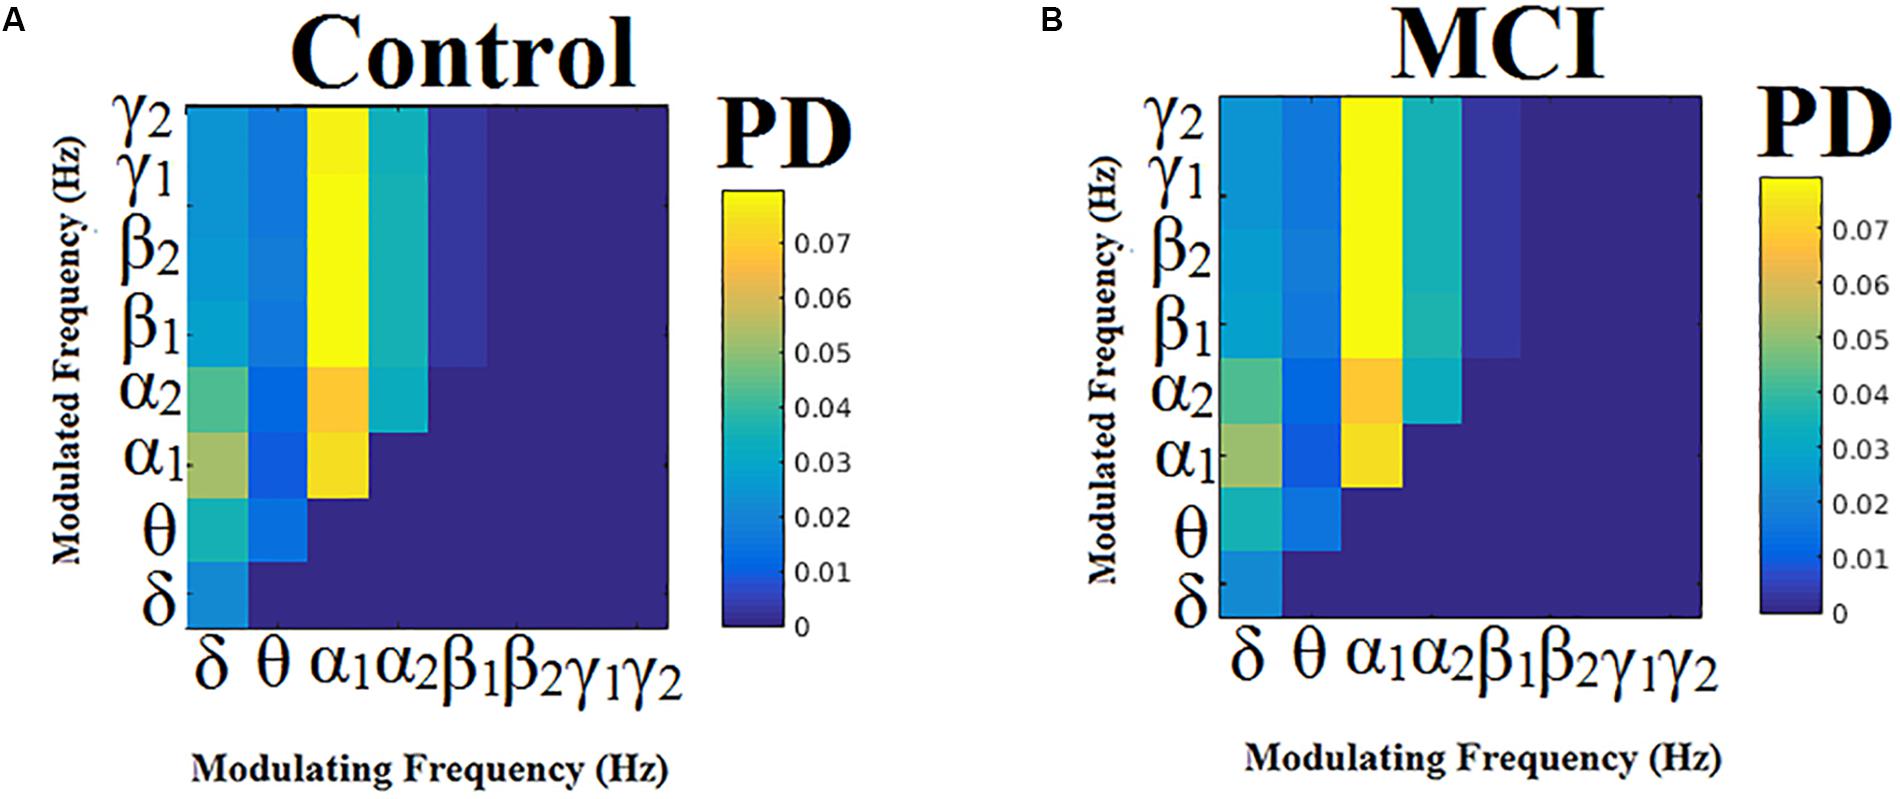
Figure 10. Group-averaged empirical Probability Distribution values of DICMs for MCI (B) compared to control group (A).
Correlation of MMSE With Chronnectomics
Figure 11 demonstrates the outcome of CCA analysis between chronnectomics and the well-known MMSE. The Chi-square was 26.95 and the related p-value = 0.00033886. x-axis refers to the canonical variable scores of the chronnectomics, where the DT of the three NMTSeigen contributes most to the maximization of their canonical correlation with MMSE. OC_2 did not associate with the CCA mode of MMSE variability. The 1st canonical component is:
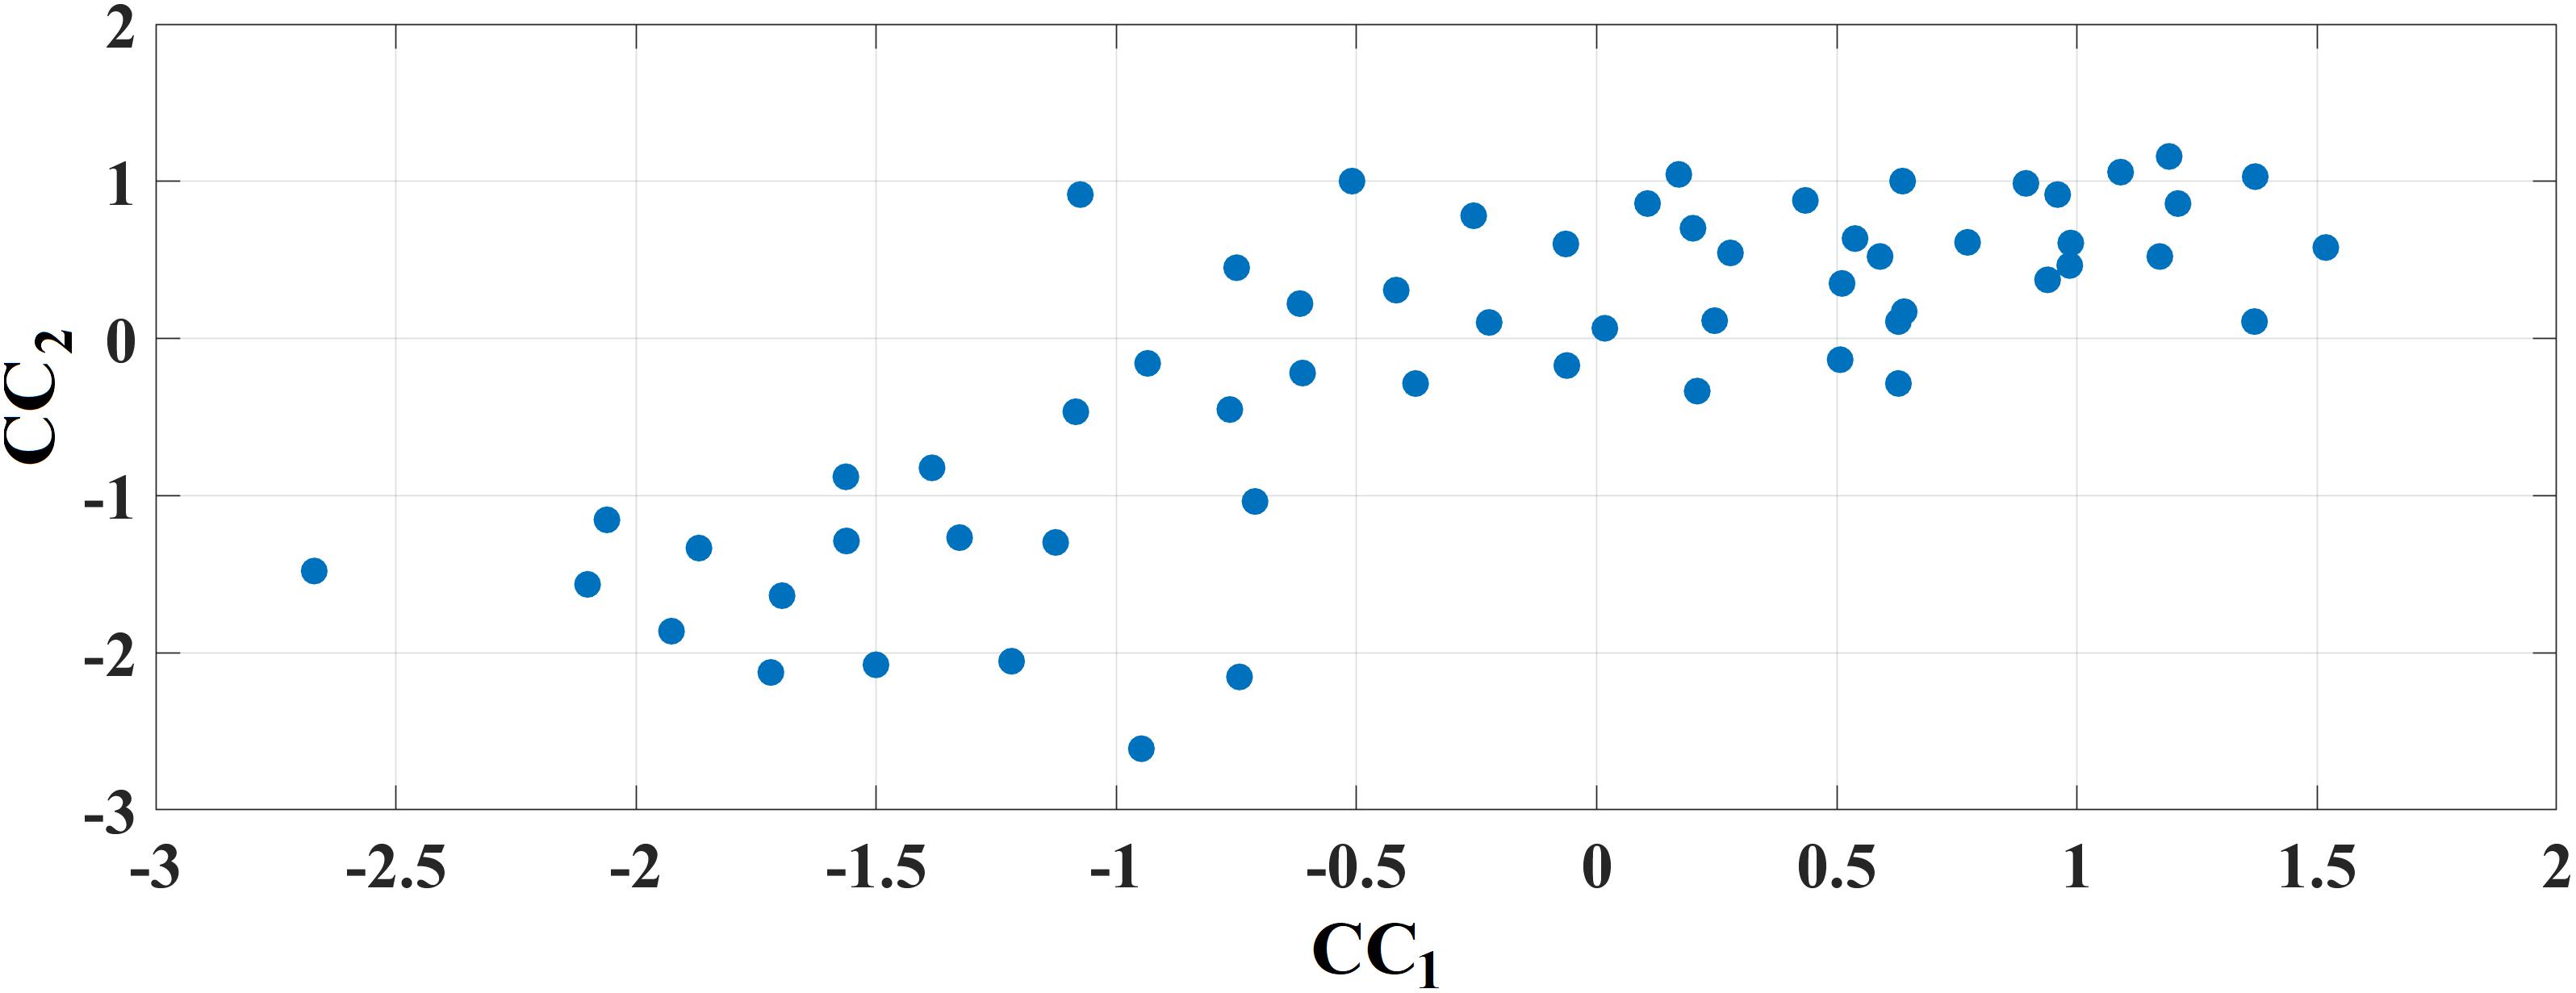
Figure 11. Canonical Correlation Analysis of Chronnectomics and MMSE. Figure plots the canonical variable scores referring to the two sets.
and the second is:
CC2 = 0.59∗MMSE.
Discussion
We have demonstrated here a novel framework for designing a proper DCB for the detection of MCI subjects from spontaneous neuromagnetic activity. The whole approach exhibits novel, data-driven, algorithmic steps that can be summarized as follows:
• The construction of a IDFCG that incorporates dominant types of interactions, either intra- (e.g., 𝜃-𝜃) or inter-frequency [phase-to-amplitude coupling (PAC) (e.g., 𝜃-γ)] coupling.
• The application of a new thresholding scheme termed OMSTs as a topological filtering applied to DFCG to extract a “true” network topology.
• The VQ modeling of network metric time series (NMTS) based on nodal Laplacian eigenvalues for prototyping the spatiotemporal dynamics of both control and MCI subjects.
• Modeling of the switching behavior of brain states as a Markovian chain
• The validation of the whole approach to a second blind dataset achieving an 85% classification accuracy for the CENT ROI representation scheme compared to 70% for the PCA scheme
• Regions of interest representation scheme matters on the designing of connectomic biomarker in general and also for MCI
• Canonical correlation analysis between chronnectomics and MMSE revealed that the DT of brain states associates strongly with the CCA mode of MMSE variability.
We proved that the VQ modeling of NMTSeigen is an effective approach to extract an overcomplete dictionary for the representation of DFC that can accurately classify subjects as either control or MCI based on their resting state MEG activity. Adopting a static network analysis, the classification accuracy was 12 out of 20, demonstrating the need of a DFC approach for studying resting brain dynamics (Dimitriadis et al., 2010b, 2012a,c, 2013a,b, 2015a,b, 2016a, 2017a,b, 2018a,b; Allen et al., 2014; Damaraju et al., 2014; Kopell et al., 2014).
The capture of time-varying coupling between variables is a topic that has been heavily studied in other fields and in communications for signal processing in particular. However, the specific application to whole-brain functional connectivity is relatively new (Sakoglu et al., 2010; Dimitriadis et al., 2013a; Calhoun et al., 2014), and its application to brain-imaging data poses particular challenges, which are the topic of active current research. One important challenge is how to best identify relevant features from the high-dimensional brain imaging data. The main algorithms used for manipulating functional brain network dynamics in fMRI are group ICA (Calhoun and Adali, 2012) or spatial-constrained ICA (Lin et al., 2013) and tensor decompositions (Acar and Yener, 2009). To characterize the dynamics of time-varying connectivity brain patterns, the basic approach is the metastate analysis based on the sliding window or more adaptive approach (Dimitriadis et al., 2013a, 2015d; Damaraju et al., 2014; Nomi et al., 2016). From the dynamic connectivity patterns, FCμstates are extracted that are “quasi-stable” distinct brain states. Then, the state vectors can be modeled via a Markovian chain (Dimitriadis et al., 2013a, 2015b; Calhoun et al., 2014; Damaraju et al., 2014).
Cross-frequency coupling mechanisms support the brain interactions across space over multiple temporal scales (Canolty and Knight, 2010; Fell and Axmacher, 2011). Computational models have explored the theoretical advantages of the existence of cross frequency coupling (Lisman and Idiart, 1995; Neymotin et al., 2011). These models untangled the major mechanisms of the importance of CFC, which may serve as the brain’s neural syntax. Segmentation of spike trains into cell clusters (“letters”) and sequences of assemblies (neural “words”) are supported by the existing syntactic rules (Buzsaki, 2010).
In the present study, we demonstrated a methodology whose main scope is to provide a framework for modeling DFCG into a repertoire of distinct “quasi-static” brain states called FCμstates. Here, we modeled the NMTS derived from the DFC patterns expressed via the Laplacian eigenvalues (Dimitriadis et al., 2015d, 2017b, 2018b). After extracting the virtual source time series, we followed an algorithmic approach with the main aim of minimizing the effect of a priori selection of variables that can minimize the reproducibility of the results. The main steps of the proposed methodology are: (1) the construction of one integrated DFC per subject—which incorporates the DICM per each pair of brain areas and at every temporal segment, (2) the application of a data-driven topological filtering scheme to reveal the backbone of the network topology at every temporal segment, (3) the estimation of Laplacian eigenvalues to extract the so-called NMTSeigen (Dimitriadis et al., 2010a, 2015d, 2017b, 2018b), (4) the modeling of these NMTSeigen via a vector-quantization approach, and (5) the validation of the whole approach to a second blind dataset.
The analysis of the spatiotemporal evolution of Laplacian eigenvalues during the training phase revealed three prototypical brain states (FCμstates). For a better illustration of the FCGs linked to the prototypical eigenvalues, we assigned the 90 AAL brain areas to five well-known brain networks. In Figure 4, we mapped the average functional strength between ROIs belonging to every pair of brain networks while the size and color of every node define the within-brain network degree. The most connected brain networks in FCμstates are the DMN and CO. CO plays a key role in working memory mechanisms (Wallis et al., 2015) while cognitive complaints related to AD are linked to alterations of resting-state brain networks and mostly FPN and DMN (Contreras et al., 2017). The functional coupling strength between FPN and DMN was significantly higher for HC compared to MCI for FCμstates 1 and 3 (Figure 4). The functional strength between FPN-DMN was positively correlated with a better episodic memory performance (Contreras et al., 2017).
Well-known and novel chronnectomics were estimated from the Markovian (symbolic) Chain that describes the evolution of brain states. We detected significantly higher flexibility and complexity for HC as compared to MCI described from FI and CI, correspondingly (Figure 7). A summarization derived from OT and DT revealed a significant trend: HC subjects spent significantly more time compared to MCI in FCμstates 1 and 3 while MCI spent significantly more time in the second FCμstate (Figure 8). Following a CCA analysis between the extracted chronnectomics and the MMSE score, we found a significant contribution of the DT for the three NMTSeigen. OC related to the 2nd NMTSeigen did not associate with the CCA mode of MMSE variability (Figure 11).
In the era of data sharing and aggregating large datasets from different research groups worldwide who contribute to large consortiums, it is important to test the reproducibility of the proposed biomarkers (Abraham et al., 2017). Our study is a first step in this direction to diminish the effect of any arbitrary selection of algorithmic steps up to the extraction of biomarkers. The next step is to extend the analysis in larger populations from different sites and MEG scanners. A recent study showed that 70 percent of the preclinical research from academic labs could not be replicated (Collins and Tabak, 2014). Abraham’s work is one of the very first neuroimaging studies that lays the ground for the reliability and reproducibility of biomarkers extracted from neuroimaging data.
There is a large body of research based on different imaging methods covering various temporal and spatial scales that documents the association of electrophysiological rhythms with distinct cognitive processes within narrowly or broadly anatomical areas (for review, see Engel et al., 2001; Buszaky, 2006; Siegel et al., 2012; Başar and Güntekin, 2013). For example, low-frequency δ rhythms (1–4 Hz) are known to coordinate large portions of the brain (Fujisawa and Buzsaki, 2011; Nacher et al., 2013) while γ oscillations play a dominant role in stimulus processing and detection is shown to be locally anatomically constrained (Engel et al., 2001). Recently, an extension of Brodmann’s areas was suggested in order to associate distinct anatomical areas with preferable connectivity estimators and cognitive functions in both normal and brain disease/disorder populations as an initial step toward summarizing the large body of current brain connectivity research (Başar and Düzgün, 2016).
In the last few years, an increasing number of studies appeared studying CFC at resting state (Antonakakis et al., 2016a), during cognitive tasks (Dimitriadis et al., 2015a,c, 2016a,b) and in various brain diseases and disorders such as mild traumatic brain injury (Antonakakis et al., 2016a), amnestic MCI (Dimitriadis et al., 2015a), dyslexia (Dimitriadis et al., 2016a), schizophrenia (Kirihara et al., 2012), etc. It has been suggested that CFC is the key mechanism for the integration of information between anatomical distribution subsystems that function on a dominant frequency (Canolty and Knight, 2010; Jirsa and Muller, 2013; Florin and Baillet, 2015). However, only a few MEG studies have explored CFC at resting state (Antonakakis et al., 2015, 2016a,b; Florin and Baillet, 2015) and especially in a more dynamic fashion (Dimitriadis et al., 2015a, 2016a; Antonakakis et al., 2016b).
MEG source connectivity is at a mature level compared to a decade ago (Ioannides et al., 2012), and it is an active research area aimed at improving many aspects of “true” brain connectivity (Schoffelen and Gross, 2009; Colclough et al., 2016). The most significant issue is the parcellation of the cerebral cortex. In many cases, the AAL template (90 ROIs) is feasible for the detection of those changes induced by a specific task or obtained after comparing different groups. But in others such as the design of a reliable connectomic biomarker, there is a need to oversample more than 90 areas. The FC, which is directly linked to functional parcellation of the cerebral cortex, is an active area, which will further improve both the interpretation and the predictive power of source connectivity of many brain diseases such as MCI. The solution of a functional parcellation template for MEG source connectivity will improve the classification performance on the source level with the additional advantage, compared to sensor level, of facilitating the anatomical interpretation of the results.
Adopting the same framework and including also stable and progressive MCI groups, we will attempt to connect DCB with neuropsychological measures and cognitive scores (Cuesta et al., 2014, 2015). It is evident that a multifactorial model that includes cognition, neuropsychological measures and anatomical information can reliably predict the conversion from MCI to DAT, while genetic variation of risk genes like the APOE-e4 allele or cognitive reserve might play a secondary role (López et al., 2016).
Going one step further from our previous studies demonstrating the significance of a DCB (Dimitriadis et al., 2013b, 2015b), where we used network microstates extracted from DFCG patterns, in the present study we introduced a modeling approach of NMTSeigen estimated over DFCGs that preserve the dominant type of coupling (intra- or inter-frequency intrinsic coupling mode). Our study demonstrates the effectiveness of the data-driven analytic pipeline tailored to DFCG to the correct classification of a blind dataset based on control and MCI subjects compared to a static connectivity approach. Given these outcomes, the need is evident over the next years to adopt data-driven techniques that will not introduce bias, subjectivity and assumptions in neuroimaging datasets and also to improve the reproducibility of the outcome in large databases.
In magnetoencephalography (MEG) the conventional approach to source reconstruction is to solve the underdetermined inverse problem independently over time and space. Different algorithms have been proposed so far with alternative regularization procedures of space and time as with a Gaussian random field model (Solin et al., 2016).
Commonly used techniques include the minimum-norm estimate (MNE) (Hämäläinen and Ilmoniemi, 1994) and Linearly Constrained Minimum-Variance (LCMV) beamformer (Van Veen et al., 1997). It is in the right direction to compare the consistency of the outcome of the current study with alternative inverse solution algorithms to measure their consistency and sensitivity to the design of connectomic biomarkers tailored to MCI.
Conclusion
In this study, we presented a novel DCM for the prediction of MCI from an age-matched control group validated over a blind dataset. The novelties of the proposed analytic scheme are the incorporation in the DFCGs of the DICM (DICM, either intra- or inter-frequency coupling based on PAC), the adaptation of a novel data-driven thresholding scheme based on OMSTs, the estimation of Laplacian eigenvalues across time and the extraction of prototypical network microstates (FCμstates) for both the control and MCI group.
It is important for the near future to work in source space on MCI subjects that convert to AD after a following up study to further validate the proposed scheme as a potential tool of clinical importance. It would also be interesting to explore how the Apoe-e4 allele can induce changes to the DFC of spontaneous activity. Moreover, multimodal neuroimaging biomarkers is a novel trend that will further be validated (Jack et al., 2016).
Data Availability
All datasets generated for this study are included in the manuscript and/or the Supplementary Files.
Author Contributions
SD conceptualized the research analysis, methods, and design, data analysis, and drafting the manuscript. ML acquired the data. ML, FM, and EP criticized the revision of the manuscript. All authors read and approved the final version of the manuscript.
Funding
This study was supported by three projects from the Spanish Ministry of Economy and Competitiveness (PSI2009-14415-C03-01, PSI2012-38375-C03-01, and TEC2016-80063-C3-2-R) and the National Centre for Mental Health (NCMH) at Cardiff University. SD was supported by MRC grant MR/K004360/1 (Behavioural and Neurophysiological Effects of Schizophrenia Risk Genes: A Multi-locus, Pathway Based Approach). SD is also supported by a MARIE-CURIE COFUND EU-UK Research Fellowship.
Conflict of Interest Statement
The authors declare that the research was conducted in the absence of any commercial or financial relationships that could be construed as a potential conflict of interest.
Acknowledgments
We would like to acknowledge RCUK of Cardiff University and the Welcome Trust for covering the publication fee. We would also like to acknowledge “Madrid Neurocenter”.
Supplementary Material
The Supplementary Material for this article can be found online at: https://www.frontiersin.org/articles/10.3389/fnins.2019.00542/full#supplementary-material
References
Abraham, A., Milham, M., Craddock, R. C., Samaras, D., Thirion, B., and Varoquaux, G. (2017). Deriving reproducible biomarkers from multi-site resting-state data: an Autism-based example. Neuroimage 147, 736–745. doi: 10.1016/j.neuroimage.2016.10.045
Acar, E., and Yener, B. (2009). Unsupervised multiway data analysis: a literature survey. IEEE Trans. Knowledge Data Eng. 21, 6–20. doi: 10.1109/tkde.2008.112
Albert, M. S., DeKosky, S. T., Dickson, D., Dubois, B., Feldman, H. H., Fox, N. C., et al. (2011). The diagnosis of mild cognitive impairment due to Alzheimer’s disease: recommendations from the National Institute on Aging-Alzheimer’s Association workgroups on diagnostic guidelines for Alzheimer’s disease. Alzheimers Dement. 7, 270–279.
Allen, E. A., Damaraju, E., Plis, S. M., Erhardt, E. B., Eichele, T., and Calhoun, V. D. (2014). Tracking whole-brain connectivity dynamics in the resting state. Cereb. Cortex 24, 663–676. doi: 10.1093/cercor/bhs352
Antonakakis, M., Dimitriadis, S. I., Zervakis, M., Micheloyannis, S., Rezaie, R., Babajani-Feremi, A., et al. (2016a). Altered cross-frequency coupling in resting-state MEG after mild traumatic brain injury. Int. J. Psychophysiol. 102, 1–11. doi: 10.1016/j.ijpsycho.2016.02.002
Antonakakis, M., Dimitriadis, S. I., Zervakis, M., Zouridakis, G., and Papanicolaou, A. C. (2016b). “Mining cross-frequency coupling microstates from resting state MEG: an application to mild traumatic brain injury,” in Proceedings of the 38th Annual International Conference of the IEEE Engineering in Medicine and Biology Society, Orlando, FL. doi: 10.1016/j.ijpsycho.2016.02.002
Antonakakis, M., Dimitriadis, S. I., Zervakis, M., Papanicolaou, A. C., and Zouridakis, G. (2017). Altered rich-club and frequency-dependent subnetwork organization in mild traumatic brain injury: a MEG resting-state study. Front. Hum. Neurosci. 11:416. doi: 10.3389/fnhum.2017.00416
Antonakakis, M., Dimitriadis, S. I., Zervakis, M., Rezaie, R., Babajani-Feremi, A., Micheloyannis, S., et al. (2015). “Uncovering the brain model of MEG brain networks from cross-frequency coupling estimates via an attacking strategy,” in Proceedings of the 37th Annual International Conference of the IEEE Engineering in Medicine and Biology Society, Milano.
Bai, F., Shu, N., Yuan, Y., Shi, Y., Yu, H., Wu, D., et al. (2012). Topologically convergent and divergent structural connectivity patterns between patients with remitted geriatric depression and amnestic mild cognitive impairment. J. Neurosci. 32, 4307–4318. doi: 10.1523/JNEUROSCI.5061-11.2012
Bajo, R., Maestú, F., Nevado, A., Sancho, M., Gutiérrez, R., Campo, P., et al. (2010). Functional connectivity in mild cognitive impairment during a memory task: implications for the disconnection hypothesis. J. Alzheimers Dis. 22, 183–193. doi: 10.3233/JAD-2010-100177
Baker, A. P., Brookes, M. J., Rezek, I. A., Smith, S. M., Behrens, T., Probert Smith, P. J., et al. (2014). Fast transient networks in spontaneous human brain activity. eLife 3:e01867. doi: 10.7554/eLife.01867
Başar, E., and Düzgün, A. (2016). The CLAIR model: extension of Brodmann’s areas based on brain oscillations and connectivity. Int. J. Psychophysiol. 103, 185–198. doi: 10.1016/j.ijpsycho.2015.02.018
Başar, E., and Güntekin, B. (2013). Review of delta, theta, alpha, beta and gamma response oscillations in neuropsychiatric disorders. Suppl. Clin. Neurophysiol. 62, 303–341. doi: 10.1016/b978-0-7020-5307-8.00019-3
Bassett, D., Wymbs, N., Porter, M., Mucha, P., Carlson, J., and Grafton, S. (2011). Dynamic reconfiguration of human brain networks during learning. Proc. Natl. Acad. Sci. U.S.A. 108, 7641–7646. doi: 10.1073/pnas.1018985108
Biswal, B., Yetkin, F. Z., Haughton, V. M., and Hyde, J. S. (1995). Functional connectivity in the motor cortex of resting human brain using echo-planar MRI. Magn. Reson. Med. 34, 537–554.
Braun, U., Muldoon, S. F., and Bassett, D. S. (eds). (2014). “On human brain networks in health and disease,” in eLS, (Chichester: Wiley), 1–9. doi: 10.1002/9780470015902.a0025783
Britz, J. D., Van De Ville, C. M., and Michel, C. M. (2010). BOLD correlates of EEG topography reveal rapid resting-state network dynamics. Neuroimage 52, 1162–1170. doi: 10.1016/j.neuroimage.2010.02.052
Brookes, M. J., Hale, J. R., Zumer, J. M., Stevenson, C. M., Francis, S. T., Barnes, G. R., et al. (2011). Measuring functional connectivity using MEG: methodology and comparison with fcMRI. Neuroimage 56, 1082–1104. doi: 10.1016/j.neuroimage.2011.02.054
Buldú, J. M., Bajo, R., Maestú, F., Castellanos, N., Leyva, I., Gil, P., et al. (2011). Reorganization of functional networks in mild cognitive impairment. PLoS One 6:e19584. doi: 10.1371/journal.pone.0019584
Buzsaki, G. (2010). Neural syntax: cell assemblies, synapsembles, and readers. Neuron 68, 362–385. doi: 10.1016/j.neuron.2010.09.023
Calhoun, V. D., and Adali, T. (2012). Multi-subject independent component analysis of fMRI: a decade of intrinsic networks, default mode, and neurodiagnostic discovery. IEEE Rev. Biomed. Eng. 5, 60–73. doi: 10.1109/rbme.2012.2211076
Calhoun, V. D., and Adali, T. (2016). Time-varying brain connectivity in fMRI data: whole-brain data-driven approaches for capturing and characterizing dynamic states. IEEE Signal Process. Mag. 33, 52–66. doi: 10.1109/MSP.2015.2478915
Calhoun, V. D., Miller, R., Pearlson, G., and Adali, T. (2014). The chronnectome: time-varying connectivity networks as the next frontier in fMRI data discovery. Neuron 84, 262–274. doi: 10.1016/j.neuron.2014.10.015
Canolty, R. T., and Knight, R. T. (2010). The functional role of cross-frequency coupling. Trends Cogn. Sci. 14, 506–515. doi: 10.1016/j.tics.2010.09.001
Chang, C., and Glover, G. (2010). Time–frequency dynamics of resting-state brain connectivity measured with fMRI. Neuroimage 50, 81–98. doi: 10.1016/j.neuroimage.2009.12.011
Colclough, G. L., Woolrich, M. W., Tewarie, P. K., Brookes, M. J., Quinn, A. J., and Smith, S. M. (2016). How reliable are MEG resting-state connectivity metrics? Neuroimage [Epub ahead of print].
Collins, F. S., and Tabak, L. A. (2014). Policy: NIH plans to enhance reproducibility. Nature 505, 612–613. doi: 10.1038/505612a
Contreras, J. A., Goni, J., Risacher, S. L., Amico, E., Yoder, K., Dzemidzic, M., et al. (2017). Cognitive complaints in older adults at risk for Alzheimer’s disease are associated with altered resting-state networks. Alzheimers Dement. 6, 40–49. doi: 10.1016/j.dadm.2016.12.004
Cuesta, P., Barabash, A., Aurtenetxe, S., Garcés, P., López, M. E., Bajo, R., et al. (2014). Source analysis of spontaneous magnetoencephalograpic activity in healthy aging and mild cognitive impairment: influence of apolipoprotein E polymorphism. J. Alzheimers Dis. 43, 259–273. doi: 10.3233/JAD-140633
Cuesta, P., Garcés, P., Castellanos, N. P., López, M. E., Aurtenetxe, S., Bajo, R., et al. (2015). Influence of the APOE 𝜀4 allele and mild cognitive impairment diagnosis in the disruption of the MEG resting state functional connectivity in sources space. J. Alzheimers Dis. 44, 493–505. doi: 10.3233/jad-141872
Damaraju, E., Allen, E., Belger, A., Ford, J., McEwen, S., Mathalon, D., et al. (2014). Dynamic functional connectivity analysis reveals transient states of dysconnectivity in schizophrenia. Neuroimage Clin. 5, 298–308. doi: 10.1016/j.nicl.2014.07.003
Deco, G., and Corbetta, M. (2011). The dynamical balance of the brain at rest. Neuroscientist 17, 107–123. doi: 10.1177/1073858409354384
Delbeuck, X., Van der Linden, M., and Collette, F. (2003). Alzheimer’s disease as a disconnection syndrome? Neuropsychol. Rev. 13, 79–92.
Dimitriadis, S. I. (2018). Complexity of brain activity and connectivity in functional neuroimaging. J. Neurosci. Res. 96, 1741–1757. doi: 10.1002/jnr.24316
Dimitriadis, S. I., Laskaris, N. A., Del Rio-Portilla, Y., and Koudounis, G. C. (2009). Characterizing dynamic functional connectivity across sleep stages from EEG. Brain Topogr. 22, 119–133. doi: 10.1007/s10548-008-0071-4
Dimitriadis, S. I., Laskaris, N. A., Simos, P. G., Micheloyannis, S., Fletcher, J. M., Rezaie, R., et al. (2013a). Altered temporal correlations in resting-state connectivity fluctuations in children with reading difficulties detected via MEG. Neuroimage 83, 307–331. doi: 10.1016/j.neuroimage.2013.06.036
Dimitriadis, S. I., Laskaris, N. A., and Tzelepi, A. (2013b). On the quantization of time-varying phase synchrony patterns into distinct functional connectivity microstates (FCμstates) in a multi-trial visual ERP paradigm. Brain Topogr. 26, 397–409. doi: 10.1007/s10548-013-0276-z
Dimitriadis, S. I., Sun, Y., Kwok, K., Laskaris, N. A., Thakor, N., and Bezerianos, A. (2013c). “A tensorial approach to access cognitive workload related to mental arithmetic from EEG functional connectivity estimates,” in Proceedings of the Annual International Conference of the IEEE Engineering in Medicine and Biology Society, Minneapolis, MN, 2940–2953.
Dimitriadis, S. I., Laskaris, N. A., Tsirka, V., Erimaki, S., Vourkas, M., Sifis, M., et al. (2011). A novel symbolization scheme for multichannel recordings with emphasis on phase information and its application to differentiate EEG activity from different mental tasks. Cogn. Neurodyn. 6, 107–113. doi: 10.1007/s11571-011-9186-5
Dimitriadis, S. I., Kanatsouli, K., Laskaris, N. A., Tsirka, V., Vourkas, M., and Micheloyannis, S. (2012a). Surface EEG shows that functional segregation via phase coupling contributes to the neural substrate of mental calculations. Brain Cogn. 80, 45–52. doi: 10.1016/j.bandc.2012.04.001
Dimitriadis, S. I., Laskaris, N. A., Tsirka, V., Vourkas, M., and Micheloyannis, S. (2012b). An EEG study of brain connectivity dynamics at the resting state. Nonlinear Dynamics Psychol. Life Sci. 16, 5–22.
Dimitriadis, S. I., Laskaris, N. A., Tzelepi, A., and Economou, G. (2012c). Analyzing functional brain connectivity by means of commute times: a new approach and its application to track event-related dynamics. IEEE Trans. Biomed. Eng. 59, 1302–1309. doi: 10.1109/TBME.2012.2186568
Dimitriadis, S. I., Laskaris, N. A., Tsirka, V., Vourkas, M., and Micheloyannis, S. (2010a). What does delta band tell us about cognitive Processes: a mental calculation study? Neurosci. Lett. 483, 11–15. doi: 10.1016/j.neulet.2010.07.034
Dimitriadis, S. I., Laskaris, N. A., Tsirka, V., Vourkas, M., Micheloyannis, S., and Fotopoulos, S. (2010b). Tracking brain dynamics via time-dependent network analysis. J. Neurosci. Methods 193, 145–155. doi: 10.1016/j.jneumeth.2010.08.027
Dimitriadis, S. I., López, M. E., Bruña, R., Cuesta, P., Marcos, A., Maestú, F., et al. (2018a). How to build a functional connectomic biomarker for mild cognitive impairment from source reconstructed MEG resting-state activity: the combination of ROI representation and connectivity estimator matters. Front. Neurosci. 12:306. doi: 10.3389/fnins.2018.00306
Dimitriadis, S. I., Routley, B., Linden, D. E., and Singh, K. D. (2018b). Reliability of static and dynamic network metrics in the resting-state: a MEG-beamformed connectivity analysis. Front. Neurosci. 12:506. doi: 10.3389/fnins.2018.00506
Dimitriadis, S. I., Antonakakis, M., Simos, P., Fletcher, J. M., and Papanicolaou, A. (2017a). Data-driven topological filtering based on orthogonal minimal spanning trees: application to multi-group MEG resting-state connectivity. Brain Connect. 7, 661–670. doi: 10.1089/brain.2017.0512
Dimitriadis, S. I., Salis, C., Tarnanas, I., and Linden, D. (2017b). Topological filtering of dynamic functional brain networks unfolds informative chronnectomics: a novel data-driven thresholding scheme based on orthogonal minimal spanning trees (OMSTs). Front. Neuroinform. 11:28. doi: 10.3389/fninf.2017.00028
Dimitriadis, S. I., and Salis, C. I. (2017). Mining time-resolved functional brain graphs to an EEG-based chronnectomic brain aged index (CBAI). Front. Hum. Neurosci. 11:423. doi: 10.3389/fnhum.2017.00423
Dimitriadis, S. I., Laskaris, N. A., Simos, P. G., Fletcher, J. M., and Papanicolaou, A. C. (2016a). Greater repertoire and temporal variability of cross-frequency coupling (CFC) modes in resting-state neuromagnetic recordings among children with reading difficulties. Front. Hum. Neurosci. 10:163. doi: 10.3389/fnhum.2016.00163
Dimitriadis, S. I., Sun, Y., Laskaris, N., Thakor, N., and Bezerianos, A. (2016b). Revealing cross-frequency causal interactions during a mental arithmetic task through symbolic transfer entropy: a novel vector-quantization approach. IEEE Trans. Neural Syst. Rehabil. Eng. 24, 1017–1028. doi: 10.1109/tnsre.2016.2516107
Dimitriadis, S. I., Laskaris, N. A., Bitzidou, M. P., Tarnanas, I., and Tsolaki, M. N. (2015a). A novel biomarker of amnestic MCI based on dynamic cross-frequency coupling patterns during cognitive brain responses. Front. Neurosci. 9:350. doi: 10.3389/fnins.2015.00350
Dimitriadis, S. I., Laskaris, N. A., and Micheloyannis, S. (2015b). Transition dynamics of EEG-based Network Microstates unmask developmental and task differences during mental arithmetic and resting wakefulness. Cogn. Neurodyn. 9, 371–387. doi: 10.1007/s11571-015-9330-8
Dimitriadis, S. I., Sun, Y., Kwok, K., Laskaris, N. A., Thakor, N., and Bezerianos, A. (2015c). Cognitive workload assessment based on the tensorial treatment of EEG estimates of cross-frequency phase interactions. Ann. Biomed. Eng. 43, 977–989. doi: 10.1007/s10439-014-1143-0
Dimitriadis, S. I., Zouridakis, G., Rezaie, R., Babajani-Feremi, A., and Papanicolaou, A. C. (2015d). Functional connectivity changes detected with magnetoencephalography after mild traumatic brain injury. Neuroimage Clin. 9, 519–531. doi: 10.1016/j.nicl.2015.09.011
Engel, A. K., Fries, P., and Singer, W. (2001). Dynamic predictions: oscillations and synchrony in top-down processing. Nat. Rev. Neurosci. 2, 704–716. doi: 10.1038/35094565
Engel, A. K., Gerloff, C., Hilgetag, C. C., and Nolte, G. (2013). Intrinsic coupling modes: multiscale interactions in ongoing brain activity. Neuron 80, 867–886. doi: 10.1016/j.neuron.2013.09.038
Fell, J., and Axmacher, N. (2011). The role of phase synchronization in memory processes. Nature Rev. Neurosci. 12, 105–118. doi: 10.1038/nrn2979
Fischl, B., Salat, D. H., Busa, E., Albert, M., Dieterich, M., Haselgrove, C., et al. (2002). Whole brain segmentation. Neuron 33, 341–355.
Florin, E., and Baillet, S. (2015). The brain’s resting-state activity is shaped by synchronized cross-frequency coupling of neural oscillations. Neuroimage 111, 26–35. doi: 10.1016/j.neuroimage.2015.01.054
Fox, M. D., Snyder, A. Z., Vincent, J. L., Corbetta, M., Van Essen, D. C., and Raichle, M. E. (2005). The human brain is intrinsically organized into dynamic, anticorrelated functional networks. Proc. Natl. Acad. Sci. U.S.A. 102, 9673–9678. doi: 10.1073/pnas.0504136102
Fujisawa, S., and Buzsaki, G. (2011). A 4 Hz oscillation adaptively synchronizes prefrontal, VTA, and hippocampal activities. Neuron 72, 153–165. doi: 10.1016/j.neuron.2011.08.018
Gagniuc, P. A. (2017). Markov Chains: From Theory to Implementation and Experimentation. Hoboken, NJ: John Wiley & Sons.
Gärtner, M., Brodbeck, V., Laufs, H., and Schneider, G. (2015). A stochastic model for EEG microstates Equence analysis. Neuroimage 104, 199–208. doi: 10.1016/j.neuroimage.2014.10.014
Gómez, C., Hornero, R., Abásolo, D., Fernández, A., and Escudero, J. (2009a). Analysis of MEG background activity in Alzheimer’s disease using nonlinear methods and ANFIS. Ann. Biomed. Eng. 37, 586–594. doi: 10.1007/s10439-008-9633-6
Gómez, C., Stam, C. J., Hornero, R., Fernández, A., and Maestú, F. (2009b). Disturbed beta band functional connectivity in patients with mild cognitive impairment: an MEG study. IEEE Trans. Biomed. Eng. 56, 1683–1690. doi: 10.1109/TBME.2009.2018454
Gómez, C., Juan-Cruz, C., Poza, J., Ruiz-Gómez, S. J., Gomez-Pilar, J., Núñez, P., et al. (2017). Alterations of effective connectivity patterns in mild cognitive impairment: an meg study. J. Alzheimers Dis. 65, 843–854. doi: 10.3233/JAD-170475
Hämäläinen, M. S., and Ilmoniemi, R. J. (1994). Interpreting magnetic fields of the brain: minimum norm estimates. Med. Biol. Eng. Comput. 32, 35–42. doi: 10.1007/bf02512476
Handwerker, D. A., Roopchansingh, V., Gonzalez-Castillo, J., and Bandettini, P. A. (2012). Periodic changes in fMRI connectivity. Neuroimage 63, 1712–1719. doi: 10.1016/j.neuroimage.2012.06.078
He, B. J., Snyder, A. Z., Zempel, J. M., Smyth, M. D., and Raichle, M. E. (2008). Electrophysiological correlates of the brain’s intrinsic large-scale functional architecture. Proc. Natl. Acad. Sci. U.S.A. 105, 16039–16044. doi: 10.1073/pnas.0807010105
Hipp, J. F., Hawellek, D. J., Corbetta, M., Siegel, M., and Engel, A. K. (2012). Large-scale cortical correlation structure of spontaneous oscillatory activity. Nat. Neurosci. 15, 884–890. doi: 10.1038/nn.3101
Hutchison, R. M., Womelsdorf, T., Allen, E. A., Bandettini, P. A., Calhoun, V. D., Corbetta, M., et al. (2013). Dynamic functional connectivity: promise, issues, and interpretations. Neuroimage 80, 360–378. doi: 10.1016/j.neuroimage.2013.05.079
Ioannides, A. A., Dimitriadis, S. I., Saridis, G. A., Voultsidou, M., Poghosyan, V., Liu, L., et al. (2012). Source space analysis of event-related dynamic reorganization of brain networks. Comput. Math. Methods Med. 2012:452503. doi: 10.1155/2012/452503
Jack, C. R., Bennett, D. A., Blennow, K., Carrillo, M. C., Feldman, H. H., Frisoni, G. B., et al. (2016). A/T/N: an unbiased descriptive classification scheme for Alzheimer disease biomarkers. Neurology 87, 539–547. doi: 10.1212/WNL.0000000000002923
Jamal, W., Das, S., Oprescu, I. A., Maharatna, K., Apicella, F., and Sicca, F. (2014). Classification of autism spectrum disorder using supervised learning of brain connectivity measures extracted from synchrostates. J. Neural Eng. 11:046019. doi: 10.1088/1741-2560/11/4/046019
Jarvis, J. P., and Shier, D. R. (1999). “Graph-theoretic analysis of finite Markov chains,” in Applied Mathematical Modeling: A Multidisciplinary Approach, eds D. R. Shier and K. T. Wallenius (Boca Raton, FL: CRC Press), 85.
Jirsa, V., and Muller, V. (2013). Cross-frequency coupling in real and virtual brain networks. Front. Comput. Neurosci. 7:78. doi: 10.3389/fncom.2013.00078
Kirihara, K., Rissling, A. J., Swerdlow, N. R., Braff, D. L., and Light, G. A. (2012). Hierarchical organization of gamma and theta oscillatory dynamics in schizophrenia. Biol. Psychiatry 71, 873–880. doi: 10.1016/j.biopsych.2012.01.016
Kitzbichler, M. G., Smith, M. L., Christensen, S. R., and Bullmore, E. (2009). Broadband criticality of human brain network synchronization. PLoS Comput. Biol. 5:e1000314. doi: 10.1371/journal.pcbi.1000314
Kopell, N. J., Gritton, H. J., Whittington, M. A., and Kramer, M. A. (2014). Beyond the connectome: the dynome. Neuron 83, 1319–1328. doi: 10.1016/j.neuron.2014.08.016
Laufs, H., Krakow, K., Sterzer, P., Eger, E., Beyerle, A., Salek-Haddadi, A., et al. (2003). Electroencephalographic signatures of attentional and cognitive default modes in spontaneous brain activity fluctuations at rest. Proc. Natl. Acad. Sci. U.S.A. 100, 11053–11058. doi: 10.1073/pnas.1831638100
Lin, Q. H., Liu, J., Zheng, Y. R., Liang, H., and Calhoun, V. D. (2013). Semiblind spatial ICA of fMRI using spatial constraints. Hum. Brain Mapp. 31, 1076–1088. doi: 10.1002/hbm.20919
Lisman, J. E., and Idiart, M. A. (1995). Storage of 7 +/- 2 short-term memories in oscillatory subcycles. Science 267, 1512–1515. doi: 10.1126/science.7878473
Liu, X., and Duyn, J. H. (2013). Time-varying functional network information extracted from brief instances of spontaneous brain activity. Proc. Natl. Acad. Sci. U.S.A. 110, 4392–4397. doi: 10.1073/pnas.1216856110
Livingston, G., Sommerlad, A., Orgeta, V., Costafreda, S. G., Huntley, J., Ames, D., et al. (2017). Dementia prevention, intervention, and care. Lancet doi: 10.1016/S0140-6736(17)31363-6 [Epub ahead of print].
López, M. E., Bruña, R., Aurtenetxe, S., Pineda-Pardo, J. A., Marcos, A., Arrazola, J., et al. (2014). Alpha-band hypersynchronization in progressive mild cognitive impairment: a magnetoencephalography study. J. Neurosci. 34, 14551–14559. doi: 10.1523/JNEUROSCI.0964-14.2014
López, M. E., Turrero, A., Cuesta, P., López-Sanz, D., Bruña, R., Marcos, A., et al. (2016). Searching for primary predictors of conversion from mild cognitive impairment to Alzheimer’s disease: a multivariate follow-up study. J. Alzheimers Dis. 52, 133–143. doi: 10.3233/JAD-151034
Maestú, F., Peña, J. M., Garcés, P., González, S., Bajo, R., Anto Bagic, A., et al. (2015). A multicenter study of the early detection of synaptic dysfunction in mild cognitive impairment using magnetoencephalography-derived functional connectivity. Neuroimage Clin. 9, 103–109. doi: 10.1016/j.nicl.2015.07.011
Mandal, P. K., Banerjee, A., Tripathi, M., and Sharma, A. (2018). A comprehensive review of magnetoencephalography (MEG) studies for brain functionality in healthy aging and Alzheimer’s disease (AD). Front. Comput. Neurosci. 12:60. doi: 10.3389/fncom.2018.00060
Mantini, D., Perrucci, M. G., Del Gratta, C., Romani, G. L., and Corbetta, M. (2007). Electrophysiological signatures of resting state networks in the human brain. Proc. Natl. Acad. Sci. U.S.A. 104, 13170–13175. doi: 10.1073/pnas.0700668104
Martinetz, T. M., Berkovich, S. G., and Schulten, K. J. (1993). ‘Neural-gas’ network for vector quantization and its application to time-series prediction. IEEE Trans. Neural Netw. 4, 558–569. doi: 10.1109/72.238311
Mylonas, D. S., Siettos, C. I., Evdokimidis, I., Papanicolaou, A. C., and Smyrnis, N. (2015). Modular patterns of phase desynchronization networks during a simple visuomotor task. Brain Topogr. 29, 118–129. doi: 10.1007/s10548-015-0451-5
Nacher, V., Ledberg, A., Deco, G., and Romo, R. (2013). Coherent delta-band oscillations between cortical areas correlate with decision making. Proc. Natl. Acad. Sci. U.S.A. 110, 15085–15090. doi: 10.1073/pnas.1314681110
Neymotin, S. A., Lazarewicz, M. T., Sherif, M., Contreras, D., Finkel, L. H., and Lytton, W. W. (2011). Ketamine disrupts 𝜃 modulation of γ in a computer model of hippocampus. J. Neurosci. 31, 11733–11743. doi: 10.1523/JNEUROSCI.0501-11.2011
Nolte, G. (2003). The magnetic lead field theorem in the quasi-static approximation and its use for magnetoencephalography forward calculation in realistic volume conductors. Phys. Med. Biol. 48, 3637–3652. doi: 10.1088/0031-9155/48/22/002
Nomi, J. S., Vij, S. G., Dajani, D. R., Steimke, D. R., Damaraju, E., Rachakonda, S., et al. (2016). Chronnectomic patterns and neural flexibility underlie executive function. Neuroimage 147, 861–871. doi: 10.1016/j.neuroimage.2016.10.026
Oldfield, R. C. (1971). The assessment and analysis of handedness: the Edinburgh inventory. Neuropsychologia 9, 97–113. doi: 10.1016/0028-3932(71)90067-4
Oostenveld, R., Fries, P., Maris, E., and Schoffelen, J. M. (2011). FieldTrip: open source software for advanced analysis of MEG, EEG, and invasive electrophysiological data. Comput. Intell. Neurosci. 2011:156869. doi: 10.1155/2011/156869
Petersen, R. C., Doody, R., Kurz, A., Mohs, R. C., Morris, J. C., Rabins, P. V., et al. (2001). Current concepts in mild cognitive impairment. Arch. Neurol. 58, 1985–1992.
Petersen, R. C., and Negash, S. (2008). Mild cognitive impairment: an overview. CNS Spectr. 13, 45–53. doi: 10.1017/s1092852900016151
Petersen, R. C., Roberts, R. O., Knopman, D. S., Boeve, B. F., Geda, Y. E., Ivnik, R. J., et al. (2009). Mild cognitive impairment: ten years later. Arch. Neurol. 66, 1447–1455. doi: 10.1001/archneurol.2009.266
Portet, F., Ousset, P. J., Visser, P. J., Frisoni, G. B., Nobili, F., Scheltens, P., et al. (2006). Mild cognitive impairment (MCI) in medical practice: a critical review of the concept and new diagnostic procedure. Report of the MCI working group of the European consortium on Alzheimer’s disease. J. Neurol. Neurosurg. Psychiatry 77, 714–718. doi: 10.1136/jnnp.2005.085332
Poza, J., Hornero, R., Abásolo, D., Fernández, A., and García, M. (2007). Extraction of spectral based measures from MEG background oscillations in Alzheimer’s disease. Med. Eng. Phys. 29, 1073–1083. doi: 10.1016/j.medengphy.2006.11.006
Qiu, C., Kivipelto, M., and von Strauss, E. (2009). Epidemiology of Alzheimer’s disease: occurrence, determinants, and strategies toward intervention. Dial. Clin. Neurosci. 11, 111–128.
Richiardi, J., Eryilmaz, H., Schwartz, S., Vuilleumier, P., and Van De Ville, D. (2011). Decoding brain states from fMRI connectivity graphs. Neuroimage 56, 616–626. doi: 10.1016/j.neuroimage.2010.05.081
Rosen, W. G., Terry, R. D., Fuld, P. A., Katzman, R., and Peck, A. (1980). Pathological verification of ischemic score in differentiation of dementias. Ann. Neurol. 7, 486–488. doi: 10.1002/ana.410070516
Sakoglu, U., Pearlson, G. D., Kiehl, K. A., Wang, Y. M., Michael, A. M., and Calhoun, V. D. (2010). A method for evaluating dynamic functional network connectivity and task-modulation: application to schizophrenia. Magn. Reson. Mater. Phys. 23, 351–366. doi: 10.1007/s10334-010-0197-8
Sarvas, J. (1987). Basic mathematical and electromagnetic concepts of the biomagnetic inverse problem. Phys. Med. Biol. 32, 11–22. doi: 10.1088/0031-9155/32/1/004
Schoffelen, J. M., and Gross, J. (2009). Source connectivity analysis with MEG and EEG. Hum. Brain Mapp. 30, 1857–1865. doi: 10.1002/hbm.20745
Shirer, W. R., Ryali, S., Rykhlevskaia, E., Menon, V., and Greicius, M. D. (2012). Decoding subject-driven cognitive states with whole-brain connectivity patterns. Cereb. Cortex 22, 158–165. doi: 10.1093/cercor/bhr099
Shuman, D. I., Narang, S. K., Frossard, P., Ortega, A., and Vandergheynst, P. (2013). The emerging field of signal processing on graphs: extending high-dimensional data analysis to networks and other irregular domains. IEEE Signal Process. Mag. 30, 83–98. doi: 10.1109/msp.2012.2235192
Siegel, M., Donner, T. H., and Engel, A. K. (2012). Spectral fingerprints of large-scale neuronal interactions. Nat. Rev. Neurosci. 13, 121–134. doi: 10.1038/nrn3137
Solin, A., Jylänki, P., Kauramäki, J., Heskes, T., van Gerven, M. A. J., and Särkkä, S. (2016). Regularizing solutions to the MEG inverse problem using space–time separable covariance functions. arXiv [preprint]. arXiv:1604.04931
Stam, C. J., de Haan, W., Daffertshofer, A., Jones, B. F., Manshanden, I., van Cappellen van Walsum, A. M., et al. (2009). Graph theoretical analysis of magnetoencephalographic functional connectivity in Alzheimer’s disease. Brain 132, 213–224. doi: 10.1093/brain/awn262
Taulu, S., and Simola, J. (2006). Spatiotemporal signal space separation method for rejecting nearby interference in MEG measurements. Phys. Med. Biol. 51, 1759–1768. doi: 10.1088/0031-9155/51/7/008
Tewarie, P., Hillebrand, A., van Dijk, B. W., Stam, C. J., O’Neill, G. C., Van Mieghem, P., et al. (2016). Integrating cross-frequency and within band functional networks in resting-state MEG: a multi-layer network approach. Neuroimage 142, 324–336. doi: 10.1016/j.neuroimage.2016.07.057
Toppi, J., Astolfi, L., Poudel, G. R., Innes, C. R., Babiloni, F., and Jones, R. D. (2015). Time-varying effective connectivity of the cortical neuroelectric activity associated with behavioural microsleeps. Neuroimage 124, 421–432. doi: 10.1016/j.neuroimage.2015.08.059
Tzourio-Mazoyer, N., Landeau, B., Papathanassiou, D., Crivello, F., Etard, O., Delcroix, N., et al. (2002). Automated anatomical labeling of activations in SPM using a macroscopic anatomical parcellation of the MNI MRI single-subject brain. NeuroImage 15, 273–289. doi: 10.1006/nimg.2001.0978
Van de Ville, D., Britz, J., and Michel, C. M. (2010). EEG microstate sequences in healthy humans at rest reveal scale-free dynamics. Proc. Natl. Acad. Sci. U.S.A. 107, 18179–18184. doi: 10.1073/pnas.1007841107
Van Veen, B. D., van Dronglen, W., Yuchtman, M., and Suzuki, A. (1997). Localization of brain electric activity via linearly constrained minimum variance spatial filtering. IEEE Trans. Biomed. Eng. 44, 867–880. doi: 10.1109/10.623056
van Wijk, B. C., and Fitzgerald, T. H. (2014). Thalamo-cortical cross-frequency coupling detected with MEG. Front. Hum. Neurosci. 8:187. doi: 10.3389/fnhum.2014.00187
Wallis, G., Stokes, M., Cousijn, H., Woolrich, M., and Nobre, A. C. (2015). Frontoparietal and cingulo-opercular networks play dissociable roles in control of working memory. J. Cogn. Neurosci. 27, 2019–2034. doi: 10.1162/jocn_a_00838
Yang, C. Y., and Lin, C. P. (2015). Time-varying network measures in resting and task states using graph theoretical analysis. Brain Topogr. 28, 529–540. doi: 10.1007/s10548-015-0432-8
Yesavage, J. A., Brink, T. L., Rose, T. L., Lum, O., Huang, V., Adey, M., et al. (1983). Development and validation of a geriatric depression screening scale: a preliminary report. J. Psychiatr. Res. 17, 37–49. doi: 10.1016/0022-3956(82)90033-4
Keywords: magnetoencephalography, mild cognitive impairment, dynamic functional connectivity, resting state, brain states, chronnectome analysis, symbolic dynamics, connectomic biomarker
Citation: Dimitriadis SI, López ME, Maestu F and Pereda E (2019) Modeling the Switching Behavior of Functional Connectivity Microstates (FCμstates) as a Novel Biomarker for Mild Cognitive Impairment. Front. Neurosci. 13:542. doi: 10.3389/fnins.2019.00542
Received: 14 February 2019; Accepted: 09 May 2019;
Published: 11 June 2019.
Edited by:
Filippo Cieri, Cleveland Clinic, United StatesReviewed by:
Marios Antonakakis, University of Münster, GermanyHan Zhang, The University of North Carolina at Chapel Hill, United States
Copyright © 2019 Dimitriadis, López, Maestu and Pereda. This is an open-access article distributed under the terms of the Creative Commons Attribution License (CC BY). The use, distribution or reproduction in other forums is permitted, provided the original author(s) and the copyright owner(s) are credited and that the original publication in this journal is cited, in accordance with accepted academic practice. No use, distribution or reproduction is permitted which does not comply with these terms.
*Correspondence: Stavros I. Dimitriadis, c3RpZGltaXRyaWFkaXNAZ21haWwuY29t; RGltaXRyaWFkaXNTQGNhcmRpZmYuYWMudWs=