 Ingrid Kreimerman1
 Ana Laura Reyes1
 Andrea Paolino1
 Tania Pardo1Williams Porcal1,2Manuel Ibarra3
 Patricia Oliver1
 Eduardo Savio1*
 Henry Engler1
- 1Radiopharmacy Department, Uruguayan Centre of Molecular Imaging (CUDIM), Montevideo, Uruguay
- 2Department of Organic Chemistry, Faculty of Chemistry, University of the Republic (UdelaR), Montevideo, Uruguay
- 3Pharmaceutical Sciences Department, Faculty of Chemistry, University of the Republic (UdelaR), Montevideo, Uruguay
Neurodegenerative diseases have mainly been associated with neuronal death. Recent investigations have shown that astroglia may modulate neuroinflammation in the early and late stages of the disease. [11C]Deuterodeprenyl ([11C]DED) is a tracer that has been used for reactive astrocyte detection in Alzheimer’s disease, Creutzfeldt–Jakob disease and amyotrophic lateral sclerosis, among others, with some limitations. To develop a new radiotracer for detecting astrocytosis and overcoming associated difficulties, we recently reported the synthesis of a sulfonamide derivative of Sulforhodamine 101 (SR101), labeled with 18F, namely SR101 N-(3-[18F]Fluoropropyl) sulfonamide ([18F]2B-SRF101). The red fluorescent dye SR101 has been used as a specific marker of astroglia in the neocortex of rodents using in vivo models. In the present work we performed a biological characterisation of the new tracer including biodistribution and micro-PET/computed tomography (CT) images. PET/CT studies with [11C]DED were also done to compare with [18F]2B-SRF101 in order to assess its potential as an astrocyte marker. Biodistribution studies with [18F]2B-SRF101 were carried out in C57BL6J black and transgenic (3xTg) mice. A hepatointestinal metabolization as well as the pharmacokinetic profile were determined, showing appropriate characteristics to become a PET diagnostic agent. Dynamic PET/CT studies were carried out with [18F]2B-SRF101 and [11C]DED to evaluate the distribution of both tracers in the brain. A significant difference in [18F]2B-SRF101 uptake was especially observed in the cortex and hippocampus, and it was higher in 3xTg mice than it was in the control group. These results suggested that [18F]2B-SRF101 is a promising candidate for more extensive evaluation as an astrocyte tracer. The difference observed for [18F]2B-SRF101 was not found in the case of [11C]DED. The comparative studies between [18F]2B-SRF101 and [11C]DED suggest that both tracers have different roles as astrocytosis markers in this animal model, and could provide different and complementary information at the same time. In this way, by means of a multitracer approach, useful information could be obtained for the staging of the disease.
Introduction
Alzheimer’s disease (AD) is a progressive neurodegenerative disorder. It is the most common form of dementia in the aging population, and it has no prevention or cure (James et al., 2015). The disease is clinically characterized by memory loss, dementia, and progressive cognitive impairment. Anatomopathological changes include the presence of amyloid plaques containing amyloid-β peptide fibrils and hyperphosphorylated tau neurofibrillary tangles. The physiopathological changes are characterized by neurotransmitter deficits (Mukaetova-Ladinska et al., 1993; Näslund et al., 2000; Nordberg, 2004; Archer et al., 2006). The widespread neuronal degeneration is accompanied by widespread astrocytosis, surrounding amyloid plaques (Overmyer et al., 1999; Kadir et al., 2011). New imaging technologies are important for detecting the disease in the early stages, following the evolution of the disease, and evaluating possible treatments.
Molecular imaging by positron emission tomography (PET) is a minimally invasive technique that generates three-dimensional (3D) images of physiological processes at the molecular and cellular levels (Li and Conti, 2010). 2-Fluoro-2-deoxy-D-glucose ([18F]FDG) is one of the most frequently employed radiotracers for different pathologies’ diagnosis. It is useful in the estimation of brain regional glucose metabolism, as it is an analog of glucose normally consumed by the brain. In typical cases of AD, declines of glucose metabolism (hypometabolism) and cerebral blood flow initially occur in the posterior parietotemporal cortex and posterior cingulate cortex, which is associated with various vulnerability factors. Although [18F]FDG PET is a useful diagnostic tool for AD, its diagnostic value is limited, as regional hypometabolism is not a specific finding of AD. Thus, several PET tracers for targeting specific aspects of AD have been developed (Shimojo et al., 2015; Villemagne et al., 2018). The first was [18F]FDDNP, a PET tracer developed by Barrio et al. (1999) that binds non-selectively to both Aβ plaques and neurofibrillary tangles in AD. The second was the 11C-labeled Pittsburgh compound B ([11C]PIB), which binds to β-sheets in Aβ plaques with high affinity (Engler et al., 2004; Klunk et al., 2004). More recently, other 18F-labeled amyloid PET tracers have been developed, which specifically bind to amyloid aggregates and not neurofibrillary tangles (Fodero-Tavoletti et al., 2012; Teipel et al., 2015). Several tau tracers have also been developed and described in preclinical and clinical studies (Villemagne et al., 2015). These tracers are currently in clinical trials, and the US Food and Drug Administration (FDA) has not yet approved any of them.
For a long time, neurodegenerative diseases have mainly been associated with neuronal death. Recent investigations have shown that astroglia may modulate neuroinflammation in the early and late stages of the disease (Verkhratsky et al., 2010). Monoamine oxidase B (MAO-B), an enzyme overexpressed in reactive astrocytes, is blocked irreversibly by [11C]deuterodeprenyl ([11C]DED). This tracer has been used for detection of reactive astrocytes in AD (Santillo et al., 2011; Carter et al., 2012; Choo et al., 2014), Creutzfeldt–Jakob disease (Engler et al., 2003, 2012) and amyotrophic lateral sclerosis (Johansson et al., 2007), among others.
One of the limitations of this radiotracer is that levels of MAO-B decrease up to 40% in smokers relative to non-smokers or former smokers. This reduction of MAO-B activity influences the pattern of brain biodistribution, thereby complicating the image interpretation (Fowler et al., 1996). Quantification of [11C]DED binding to MAO-B, as well as the initial tracer distribution, has been analyzed via the Patlak method (Patlak et al., 1983), which has been previously described (Engler et al., 2003) indicating that the intercepts provide a measure of the blood flow, and the slope is a measure of the MAO-B binding. Despite the value of this double information obtained with only one tracer, the imaging analysis results are more complex.
To develop a new agent for detecting astrocytosis and overcoming the difficulties previously described, we recently reported the synthesis of a sulfonamide derivative of Sulforhodamine 101 (SR101) labeled with 18F, namely SR101 N-(3-[18F]Fluoropropyl) sulfonamide ([18F]2B-SRF101). In vitro studies of this compound indicated physicochemical and biological properties appropriate for neuroimaging (Kreimerman et al., 2017). The red fluorescent dye, SR101, has been used as a specific marker of astroglia in the neocortex of rodents using in vivo models (Nimmerjahn et al., 2004; Nimmerjahn and Helmchen, 2012). SR101, Sulforhodamine B and G have also been reported for in vivo staining of astrocytes after intravenous (i.v.) injection in rodents (Vérant et al., 2008; Appaix et al., 2012). However, the dye uptake processes are still under discussion, being recently identified the thyroid hormone transporter OATP1C1 as the SR101-uptake transporter in hippocampus and cortex (Schnell et al., 2012, 2015). Different authors have postulated that this dye labels not only astrocytes, but also mature myelinating oligodendrocytes, diffusing via gap junctions from astrocytes to oligodendrocytes. Thus, it has been proposed that astrocytes are labeled before oligodendrocytes (Wasseff and Scerer, 2011; Hill and Grutzendler, 2014; Anderova et al., 2016; Hagos and Hülsmann, 2016). We have confirmed 2B-SRF101’s ability to detect astrocytes in cell cultures with a higher affinity than that of SR101 (Kreimerman et al., 2017). In the present work we performed a biological characterisation of the new tracer including biodistribution and micro-PET/computed tomography (CT) images. PET/CT studies with [11C]DED were also done to compare with [18F]2B-SRF101 in order to assess its potential as an astrocyte marker.
Materials and Methods
Animals
Astrocytosis was assessed in 9- to 10-month-old mice. A male triple-transgenic mouse (3xTg) model of AD (PS1M146V, APPSwe, and tauP301L) (Oddo et al., 2003) was used for ex vivo and in vivo studies. Aged-matched C57BL6J black mice were used as controls. The animals were housed under 12:12-h light/dark cycles; food and water were given ad libitum in rooms with controlled temperature and humidity at the Uruguayan Centre of Molecular Imaging (CUDIM) animal facility. The research protocol was carried out in accordance with the National Bioethics Committee requirements and under the current ethical regulations of the national law on animal experimentation no. 18.611 (National Commission of Animal Experimentation, CNEA, Uruguay). CUDIM’s Animal Bioethics Committee approved these protocols.
Radiochemical Synthesis
The synthetic processes were performed using automated synthetic platforms, namely GE TRACERlab® FX-FN (18F-labeling) and GE TRACERlab® FX C Pro (11C-labeling). Radionuclides were produced in a PET Trace 16.5 MeV cyclotron (GE Healthcare).
[18F]2B-SRF101 was synthesized according to the method previously reported by our group (Kreimerman et al., 2017). A solution of the precursor SR101 N-(3-Bromopropyl) sulfonamide (1 mg in 1 mL of dimethyl sulfoxide, DMSO) was added to a preactivated and dried [18F]-fluoride solution. The labeling was carried out at 160°C for 10 min. After labeling, the crude reaction mixture was diluted and injected into a semipreparative HPLC for purification (see Table 1). The fraction corresponding to [18F]2B-SRF101 was collected and diluted in water. The product was then purified using a Sep-Pak® C18 light cartridge (Waters). Finally, formulation was carried out, and the solution was passed through a 0.2-μm hydrophilic sterilizing filter (Millex-LG, Millipore). The radiochemical purity of the end product was analyzed via analytical HPLC (see Table 1); it exceeded 95%, while the specific activity was variable (15.7–405.2 GBq/μmol) at the end of synthesis.
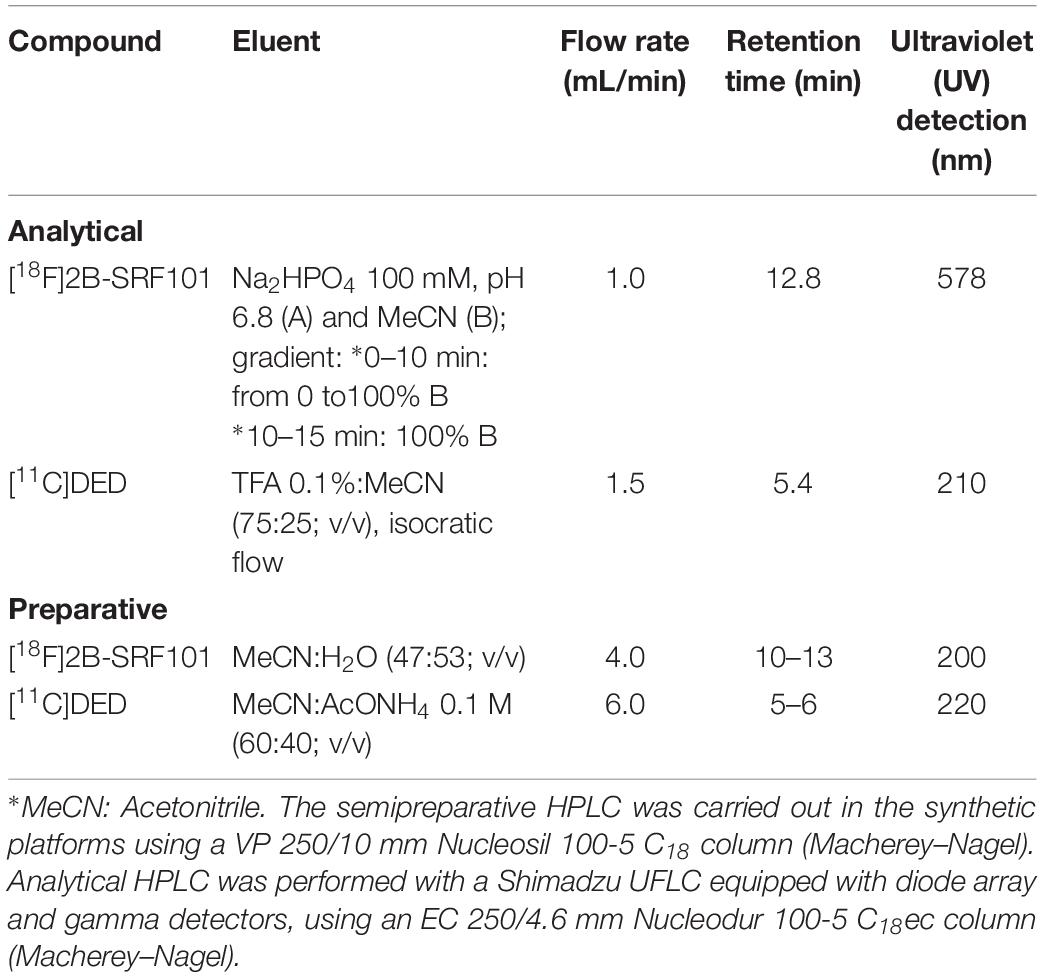
Table 1. Conditions employed for semipreparative and analytical HPLC.
[11C]DED was synthesized according to the method previously reported by our group (Buccino et al., 2016). [11C]CH3OTf was bubbled into the organic precursor solution to react with 1 mg of the precursor nor-DED.HCl in 350 μL butanone (MEK) for 1 min at 80°C. The addition of 3 μL of 3 M NaOH was needed to neutralize the hydrochloride form of the precursor. The crude product was separated from impurities using semipreparative HPLC (see Table 1). The fraction containing [11C]DED was collected in water and further purified using a Sep-Pak C18 light cartridge (Waters). Formulation was done and the solution was passed through a 0.22-μm sterilizing filter (Millex-GV, Millipore). The radiochemical purity of the resultant compound (determined by HPLC, Table 1) exceeded 95%, and the specific activity was variable (37.0–918.1 GBq/μmol) at the end of synthesis.
Biological Studies
Ex vivo fluorescence imaging was performed with the unlabeled 2B-SRF101 as a screening method to determine whether this new compound could cross the BBB (see Supplementary Material).
Ex vivo and in vivo studies were done with [18F]2B-SRF101 in the mouse model previously described in section “Animals.”
[11C]DED was used as a well-known astrocyte radiomarker to assess the performance of the new tracer in the PET studies.
Ex vivo Studies: Biodistributions
The biological profile and pharmacokinetics of [18F]2B-SRF101 were determined via biodistribution studies in the 3xTg mouse model and control group. Both animal models were injected i.v. with 1.5–38.2 MBq (100–250 μL) of [18F]2B-SRF101 into the caudal tail vein and sacrificed by cervical dislocation at 14, 30, 65, and 110 min after injection (n = 2–4 animals in each injection time). Organs, tissues, and blood samples were obtained (lung, heart, spleen, liver, kidneys, muscle, bone, stomach, gut, bladder, and brain), weighed and assayed for radioactivity in a gamma counter (a 3″ × 3″ well-type NaI [Tl] solid scintillation detector coupled to a multichannel analyser, ORTEC). The total urine volume was collected during the biodistribution period and removed from the bladder after sacrifice, and its activity was measured. The percent of injected dose per gram of tissue (%ID/g) and injected dose in the whole organ (%ID) was calculated. Corrections by different sample geometry were applied when necessary.
In vivo Studies: Micro-PET/CT Imaging
Image acquisition
Small animal PET imaging was performed in a tri-modality PET/SPECT/CT scanner (TriumphTM, TriFoil, Inc., United States), based on the Quad-APD detector modules coupled with LYSO/LGSO scintillators. This scanner has a spatial resolution of 1.0 mm and an axial field of view (FOV) of 3.75 cm.
The data were acquired in list mode in a 184 × 184 × 31 matrix with a pixel size of 0.25 × 0.25 × 1.175 mm and a coincidence window width of 22.22 ns. The animals were anaesthetized with 2% isofluorane in an oxygen flow of 2 L/min, placed in prone position on the scanner bed and injected i.v. via the caudal vein tail with 100–200 μL of [18F]2B-SRF101 (21.7–39.3 MBq; n = 7 in each animal model) or [11C]DED (11.5–28.0 MBq; n = 6 in each animal model). Dynamic brain PET studies were performed during 90 or 60 min after i.v. injection of [18F]2B-SRF101 (one frame × 5 min, two frames × 30 min, and one frame × 25 min) or [11C]DED (one frame × 5 min, one frame × 30 min, and one frame × 25 min), respectively. Sinograms were reconstructed using 3D maximum likelihood expectation maximization (MLEM) with 30 iterations.
Image analysis
Semiquantitative analysis was done using PMOD software, v. 3.301 (PMOD Technologies, Ltd., Zurich, Switzerland). PET studies were co-registered with the corresponding CT scan studies for anatomical localisation. The images were displayed as coronal, sagittal, and axial slices. Using the PFUS module, the brain images were spatially normalized to the mouse brain magnetic resonance imaging (MRI) template included in the PMOD software, to scale the images to the Paxinos and Watson coordinate system (Paxinos and Watson, 1998). The images were previously masked to exclude extracerebral activity and enhance the normalization data. The inverse mathematical transformation was estimated and applied to the volumes-of-interest (VOIs) included in the PMOD mouse brain atlas to fit the VOIs for each animal. An averaged 35- to 65-min frame was used for quantifying the radiotracer uptake. The average activity per volume unit (kBq/cc) was subsequently corrected for injected radioactivity and mouse weight and expressed in standardized uptake value (SUV) units. Eight VOIs were selected for further evaluation, as follows: the striatum, cortex, hippocampus, hypothalamus, thalamus, amygdala, olfactory bulb, and midbrain. The cerebellum was used as a reference, and the target to cerebellum ratio was calculated for each VOI. The results were expressed as the mean of the semi-quantitative target to cerebellum ratio in SUV ratio (SUVR) units for each VOI ± standard error of the mean (SEM).
Statistical Analyses
In the PET/CT image analysis, data between groups were analyzed by the non-parametric Mann–Whitney U test, using a two-tailed test. Significance was accepted at the 95% probability level.
Results
Ex vivo Studies: Biodistributions
Biodistribution studies with [18F]2B-SRF101 were carried out in C57BL6J black mice to determine its pharmacokinetic profile. The results are summarized in Figure 1 and Table 2. The tracer uptakes in the liver and gut at different injection times of [18F]2B-SRF101 are shown in Figure 2. [18F]2B-SRF101’s activity in the gut was relatively high at 14 min post-injection (p.i.; 61.7 ± 2.4%ID), reaching a plateau of 85.3 ± 7.1%ID after 30 min p.i.; this remained essentially constant over the entire 110-min study period.
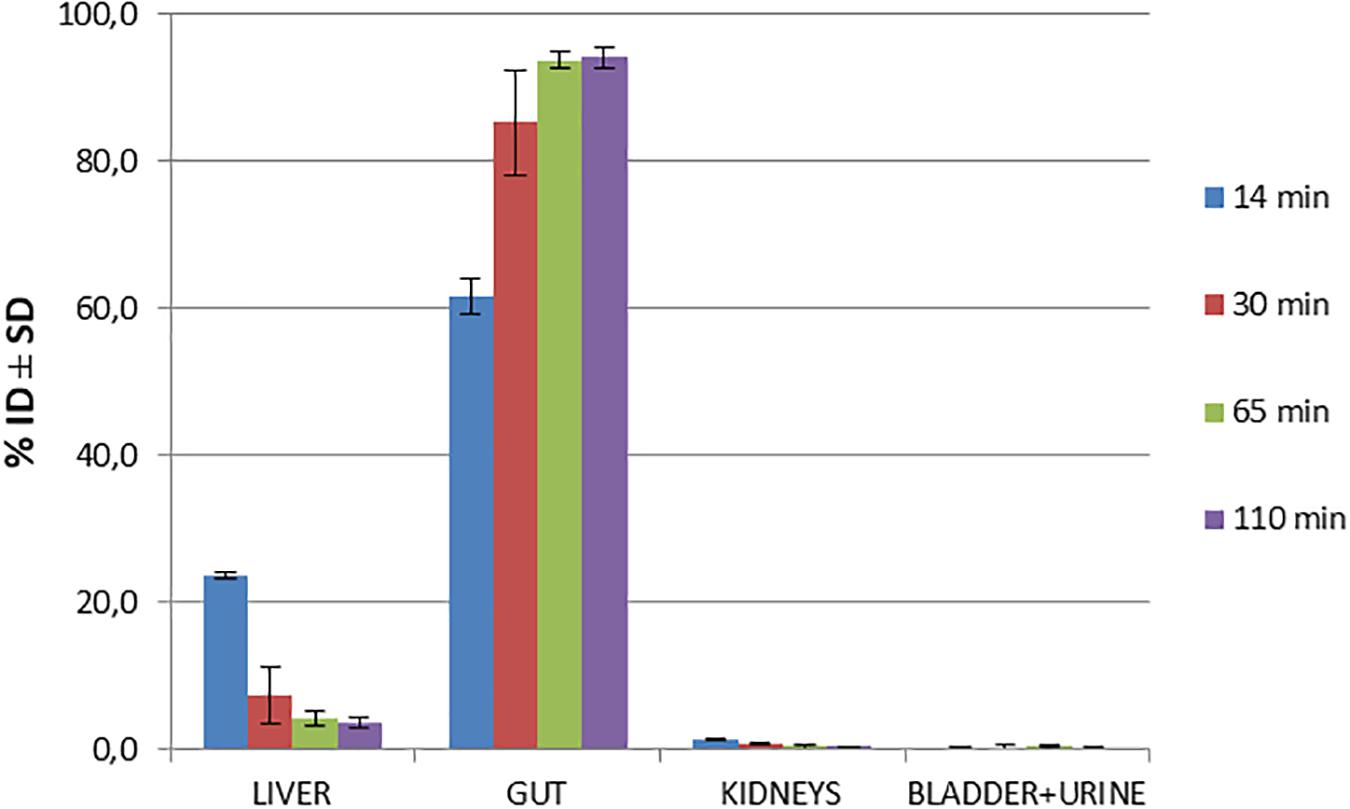
Figure 1. Biodistribution of [18F]2B-SRF101 in healthy C57BL6J black mice at different injection times.
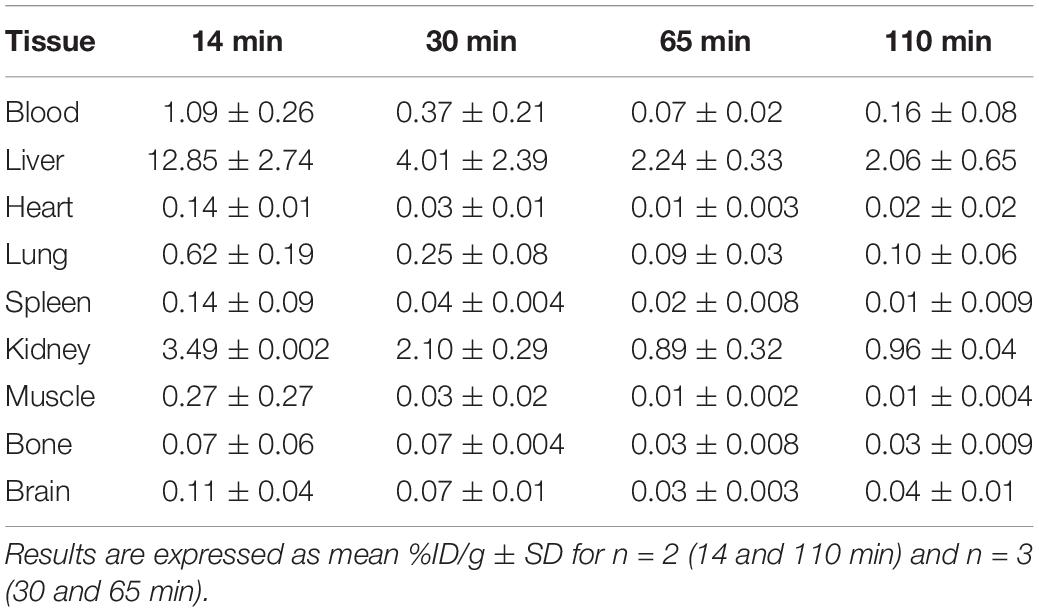
Table 2. Biodistribution of radioactivity after intravenous (i.v.) injection of [18F]2B-SRF101 in healthy C57BL6J black mice.
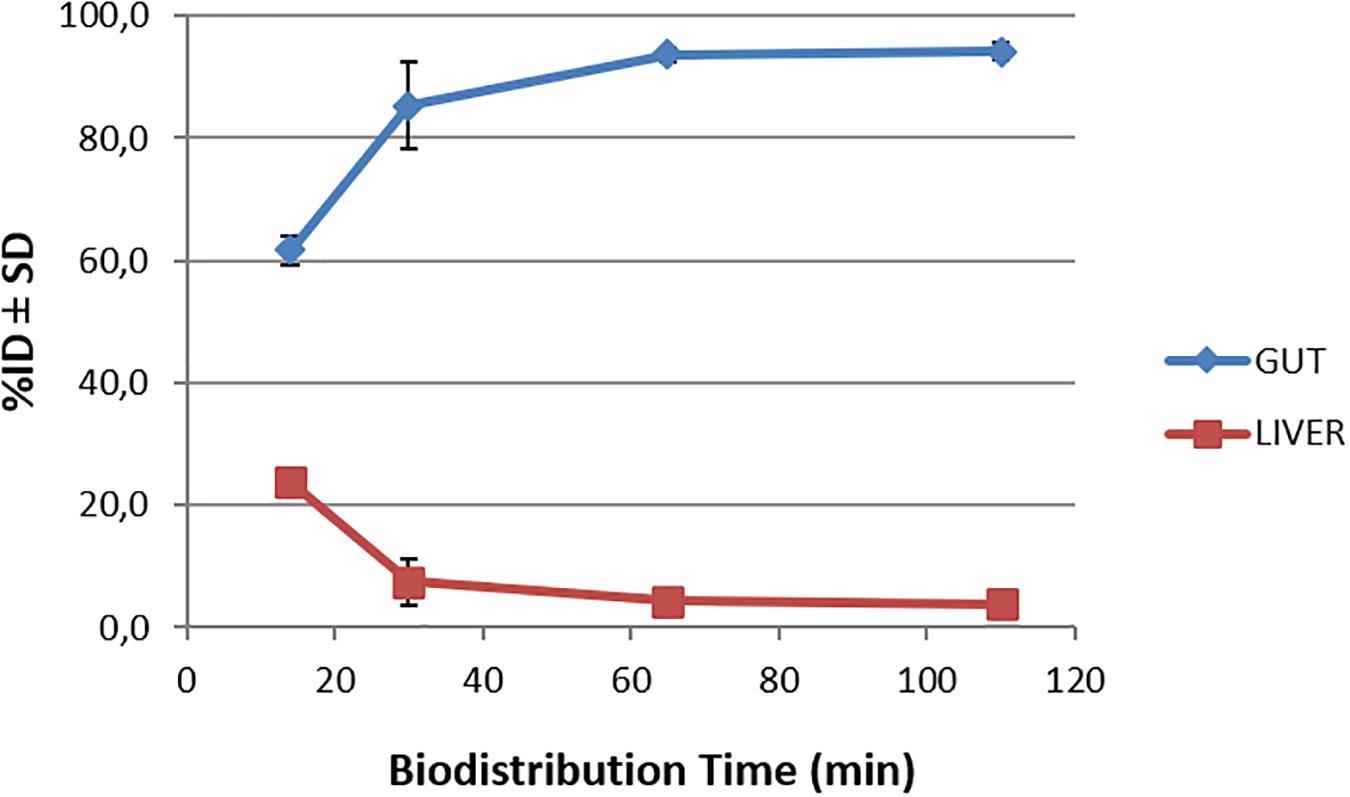
Figure 2. Time-activity curves for the liver and gut after injection of [18F]2B-SRF101 until 110 min.
Biodistribution studies were also performed in the 3xTg mouse model of AD at 14, 30, 65, and 110 min after [18F]2B-SRF101 injection. The results are summarized in Figure 3.
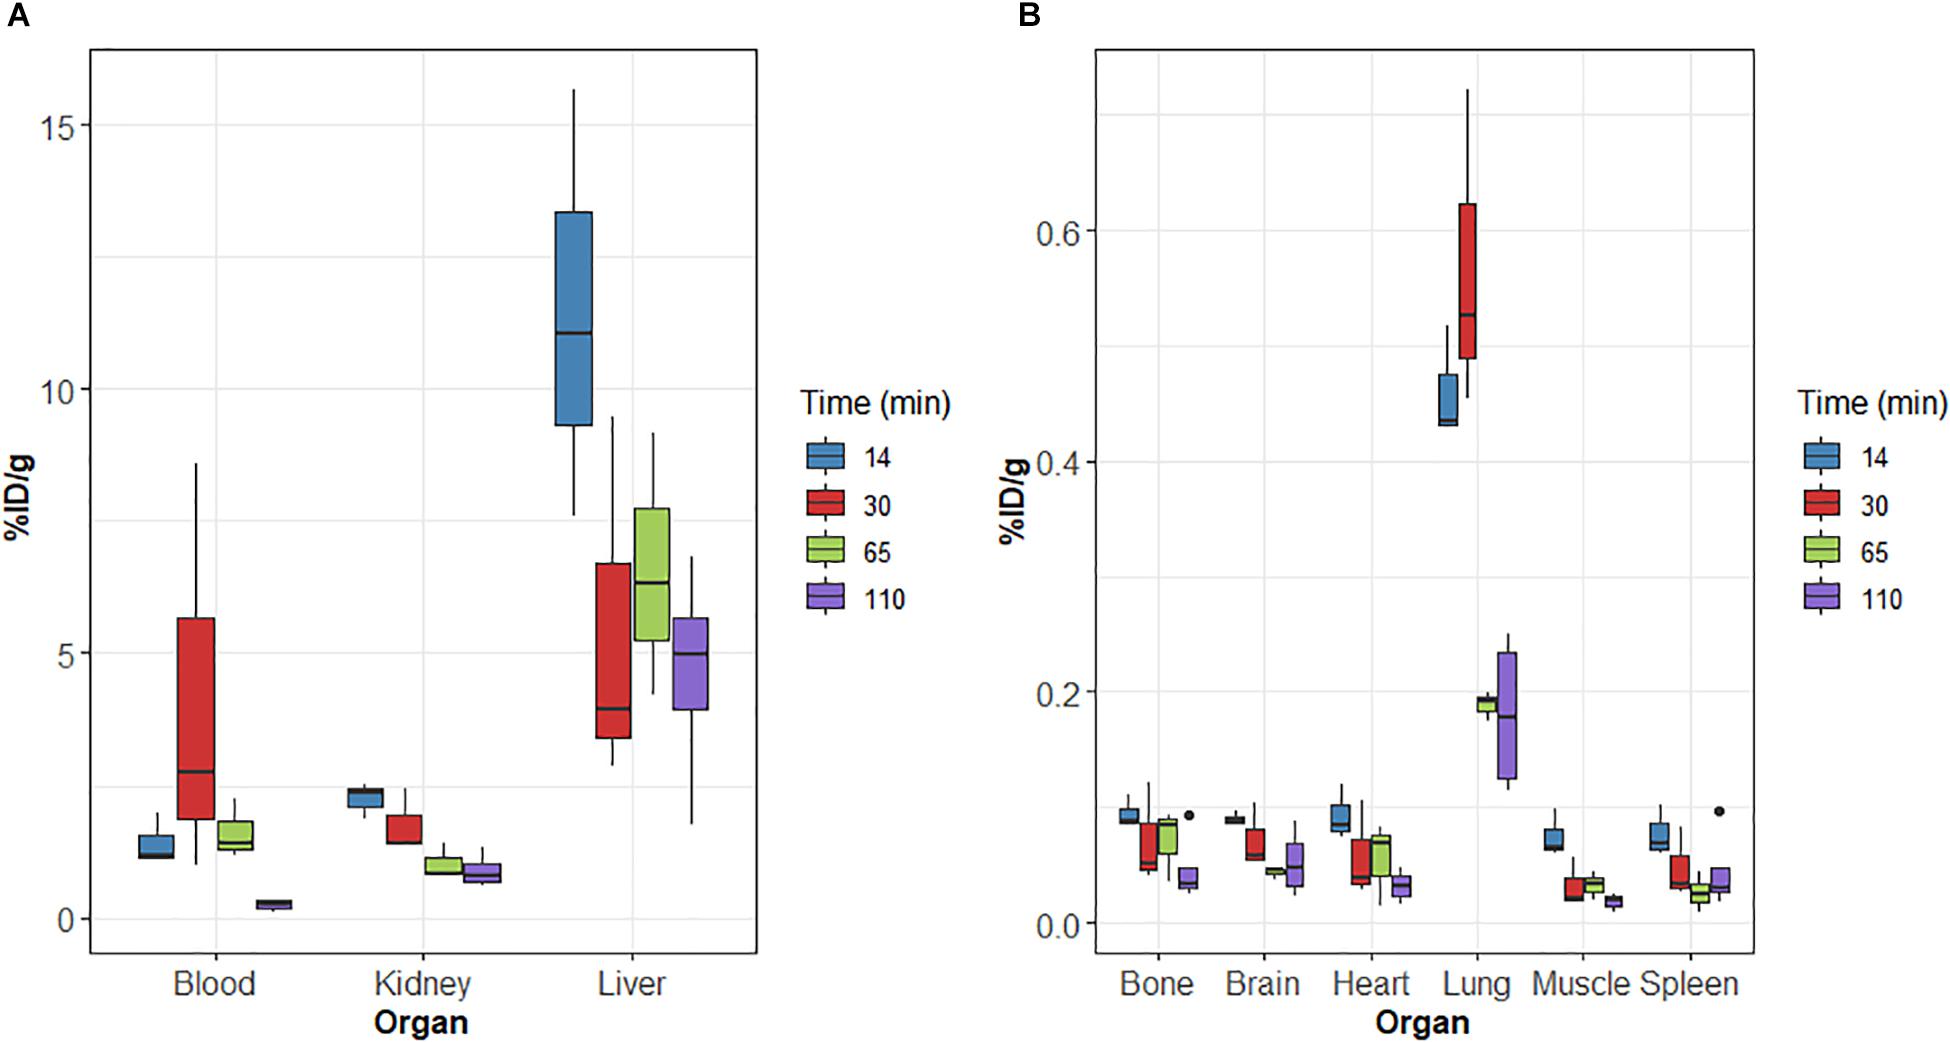
Figure 3. (A,B) Biodistribution of radioactivity after intravenous (i.v.) injection of [18F]2B-SRF101 in 3xTg mice. Results expressed as %ID/g for n = 3 (14, 30, and 65 min) and n = 4 (110 min).
On relation to metabolisation, similar results were obtained for 3xTg than those of the control group. Initially, [18F]2B-SRF101’s activity in the gut was 61.1 ± 3.5%ID at 14 min p.i., reaching a value of 79.7 ± 16.6%ID after 110 min p.i.
Brain uptake at 65 min p.i. was compared between the 3xTg mice and control group. A higher uptake was found in the case of the 3xTg group, and the difference was significant (p < 0.05). Timepoint selection was performed, considering that PET/CT analysis was carried out in the frame covering from 35 to 65 min of the study.
In vivo Studies: Micro-PET/CT Imaging
Dynamic PET/CT studies were carried out with [18F]2B-SRF101 and [11C]DED to evaluate the distribution of the tracers in the brain. For the analysis and quantification, the cerebellum was used as the reference because astrocytes are sparse in this region.
Figure 4 shows the SUVR in different brain regions of the 3xTg mice and control group after injection of [18F]2B-SRF101. A significant difference in [18F]2B-SRF101 uptake was observed in the striatum, cortex, hippocampus, and midbrain, and this was higher in the 3xTg mice than it was in the control group (p < 0.05). PET images of [18F]2B-SRF101 are shown in Figure 5.
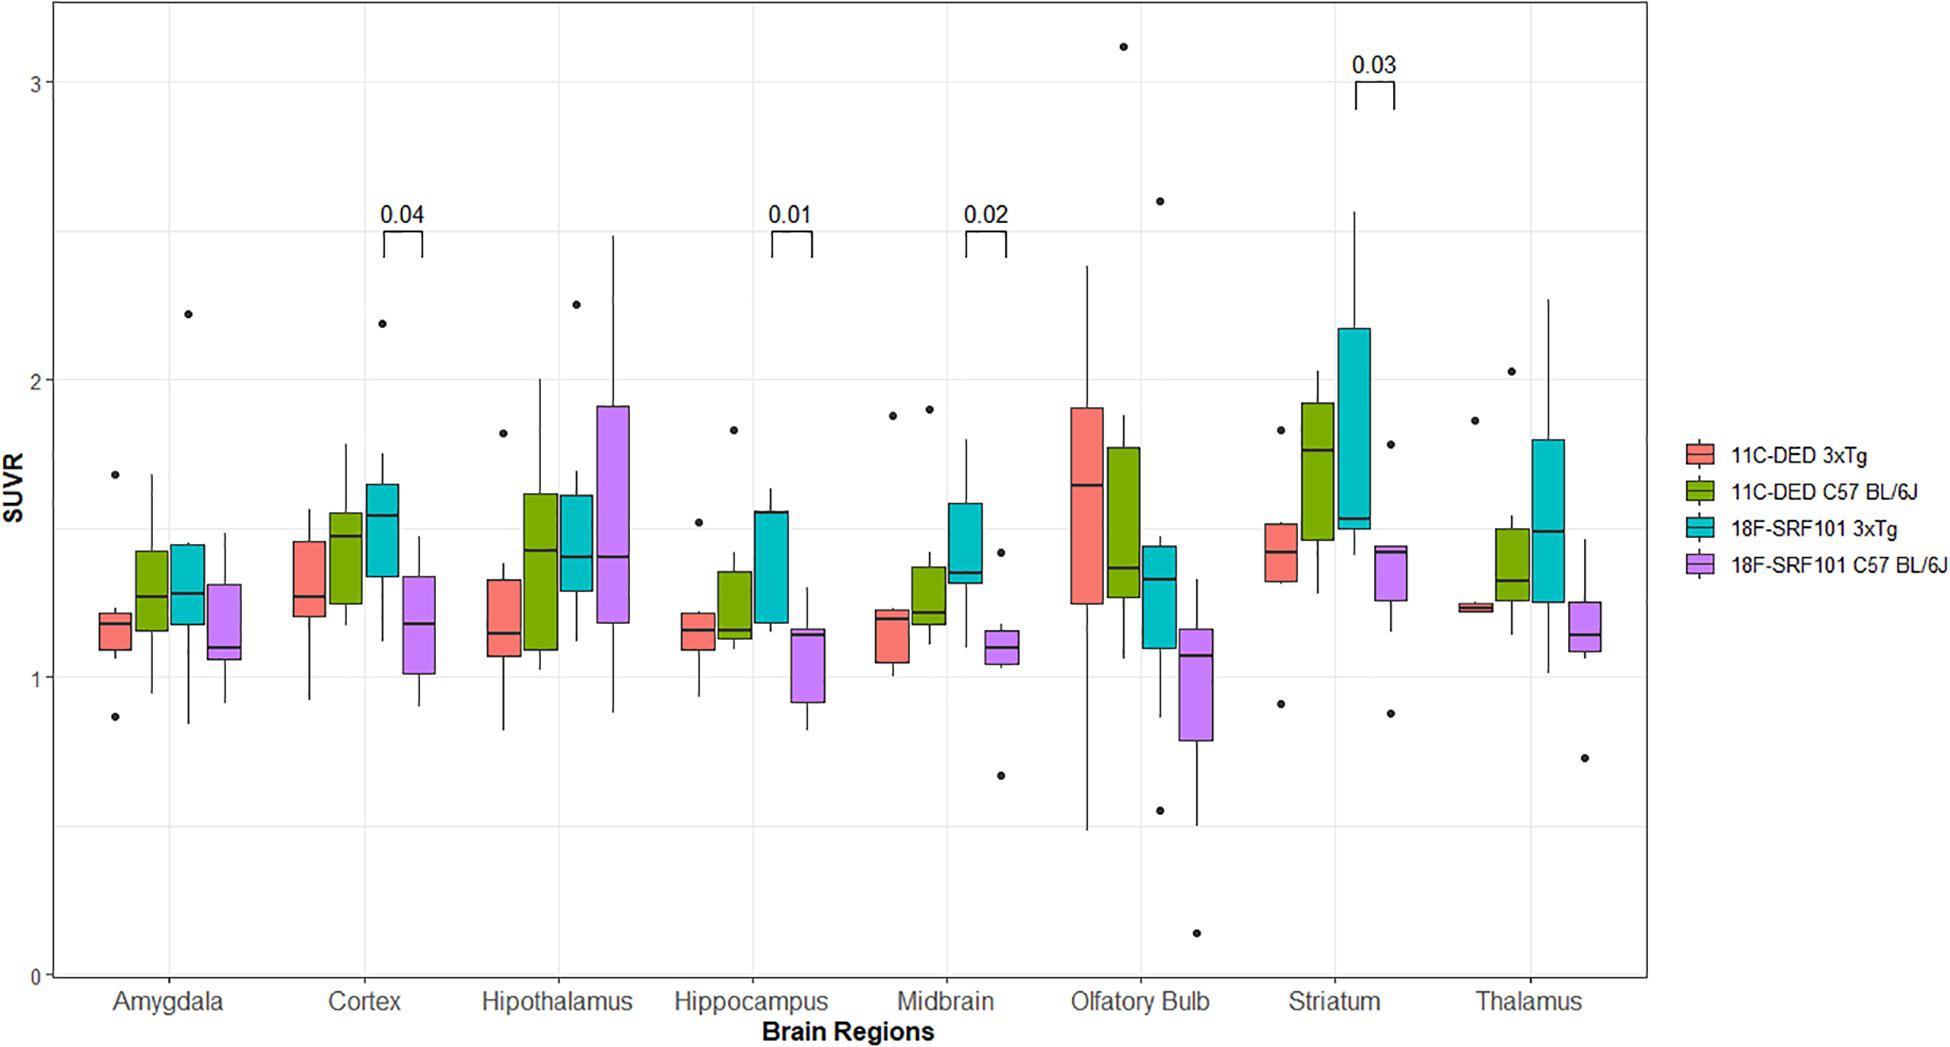
Figure 4. Standardized uptake value ratio (SUVR) of different brain regions analyzed between 35 and 65 min, from micro-PET/CT images with: [18F]2B-SRF101 in 3xTg mice (n = 7) and controls (n = 7) and [11C]DED in 3xTg mice (n = 6) and controls (n = 6). Significant difference between groups are indicated by p < 0.05.
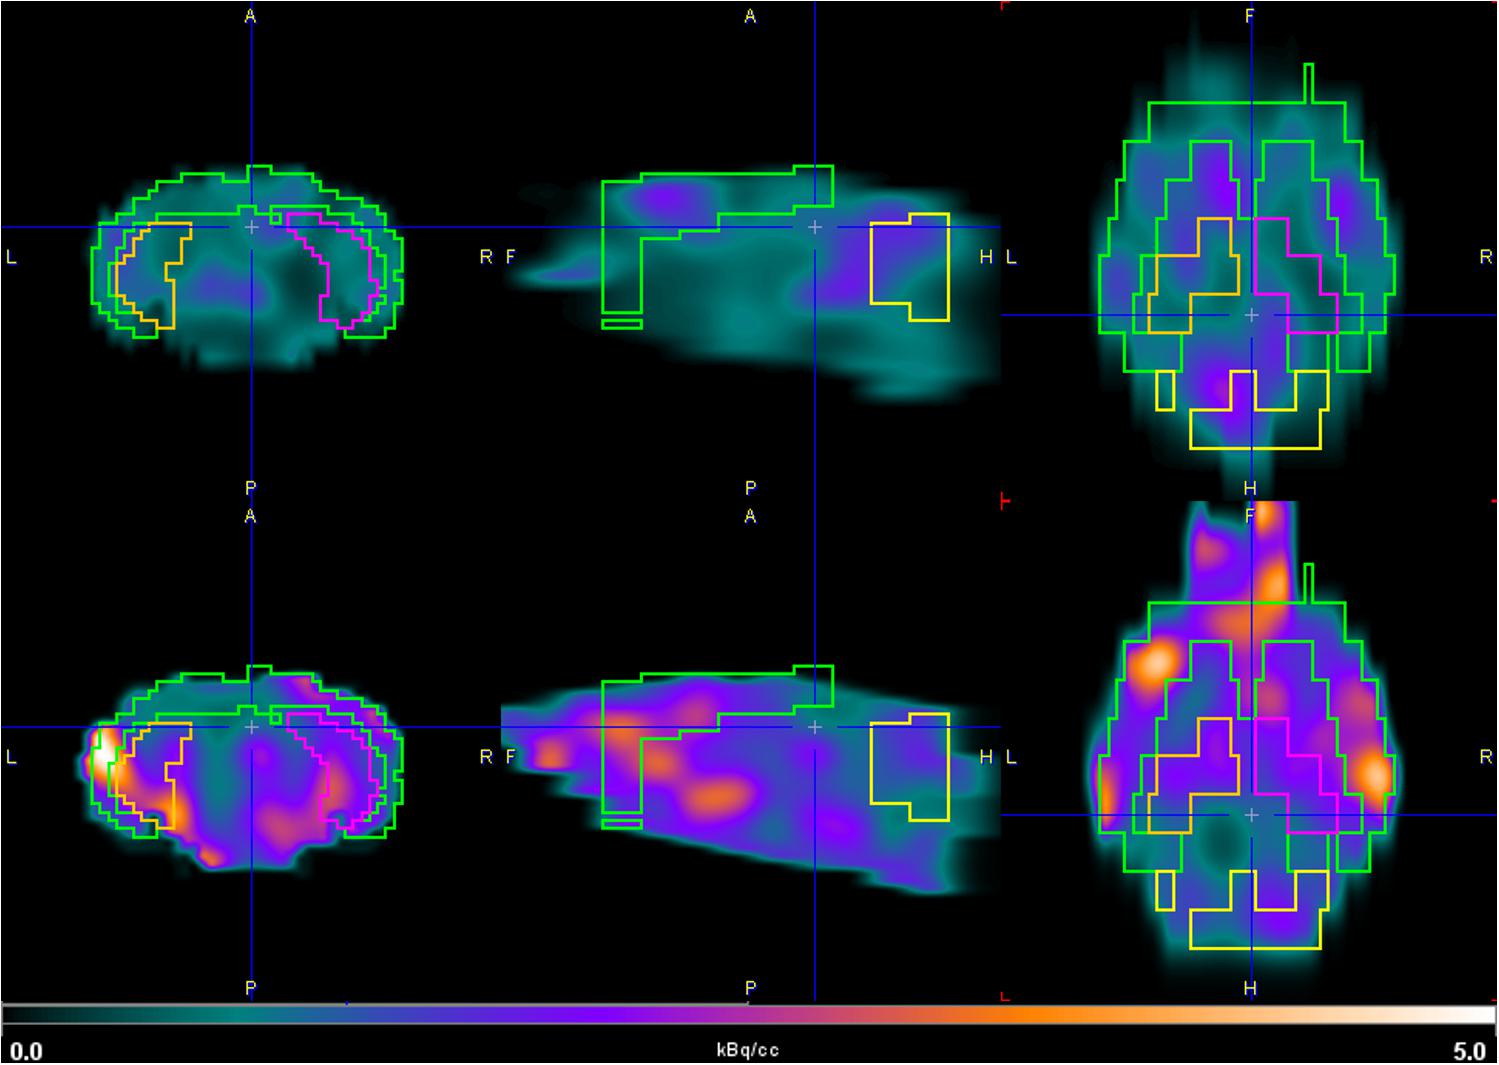
Figure 5. Coronal (left), sagittal (middle), and axial (right) PET images of [18F]2B-SRF101. Brain uptake of 3xTg mouse model (down) and control group (up) in the hippocampus and cortex between 35 and 65 min, depicted using a common scale from 0.0 to 5.0 kBq/cc.
Besides, the SUVR values for hippocampus and cortex over time were analyzed. Figure 6 illustrates a tendency along the 90 min of the study, where the [18F]2B-SRF101 uptake in the 3xTg mice was higher than that in the control group. A statistical analysis was performed, which showed a significant difference in [18F]2B-SRF101 uptake from 35 to 90 min in hippocampus and from 5 to 65 min in cortex (p < 0.05). There was no significative difference at early frame (up to 5 min) for both tracers, which may be due to the initial blood tracer disposition.
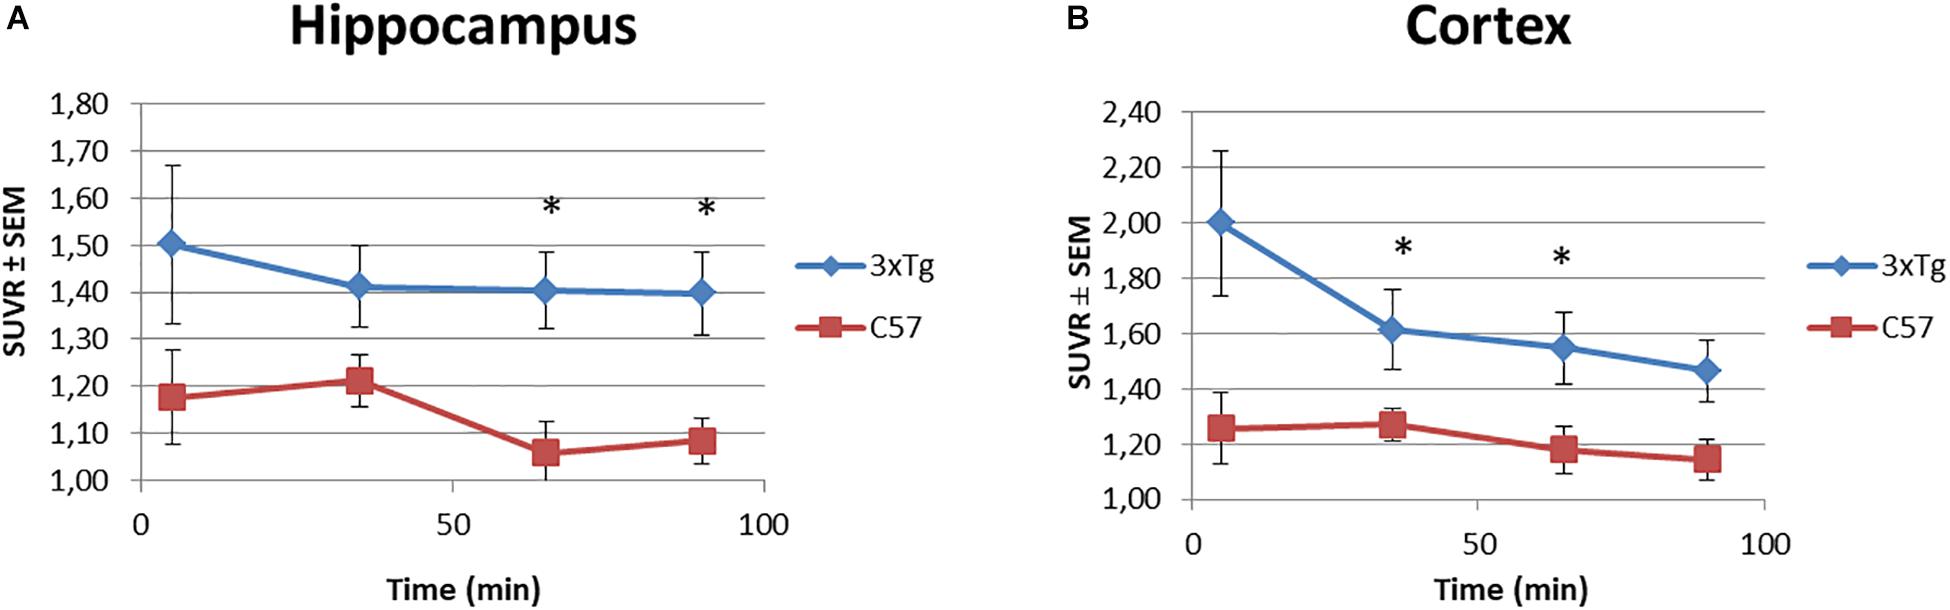
Figure 6. Time-SUVR curves for [18F]2B-SRF101 in the hippocampus (A) and cortex (B), derived from small animal PET/CT images. Significant difference between groups are indicated by *p < 0.05.
In the comparative studies between [18F]2B-SRF101 and [11C]DED uptake in the 3xTg mice, no significant difference was observed in any of the analyzed regions (p > 0.05; Figure 4).
Finally, the [11C]DED uptake between 3xTg mice and control group was compared, and no significant difference was found in any of the analyzed regions (p > 0.05; Figure 4).
Discussion
Ex vivo Studies: Biodistributions
The preclinical characterisation of [18F]2B-SRF101 was performed after the novel compound’s ability to cross the BBB was confirmed by ex vivo brain fluorescence imaging (see Supplementary Material). Biodistribution profile in the control group showed a high concentration of the tracer in the liver and gut throughout the study, together with the low uptake in the kidneys and bladder (Figure 1). This suggest a primarily hepatointestinal metabolisation. These results are consistent with the following lipophilic properties of the compound, as previously determined by our group: log POCT [18F]2B-SRF101 = (1.88 ± 0.14) (Kreimerman et al., 2017). Figure 2 shows that the gut concentration of the tracer increased as the liver concentration decreased, which is in agreement with the previously mentioned hepatointestinal metabolisation. The high percentage of activity in gut shows that, at 30 min p.i., nearly 90% of the compound was metabolized, reflecting the absence of non-specific binding. This could also be observed in terms of the low activity concentration of the tracer in the non-target tissues, such as the heart, bones, lungs, spleen and muscles, at all analyzed times (Table 2). It is also important to note that the concentration of [18F]2B-SRF101 in the blood was extremely low, at 1.1 ± 0.3%ID/g at 14 min p.i.; this level decreased further throughout the study (0.16 ± 0.08%ID/g at 110 min p.i.), denoting the tracer’s quick washout in the blood. It is worth noting that there was minimal uptake in bone (∼0.05%ID/g), and this did not increase during the study. This suggests that there is no appreciable loss of [18F] from the compound.
The distribution of the compound in the 3xTg mouse model showed a similar pattern to that observed in the control group. In the study, a high accumulation in the gut and liver was observed, confirming the hepatointestinal metabolisation mentioned above. Non-specific binding in other tissues was not found, and a rapid washout of the tracer in the blood was also observed in this mouse model (Figure 3). Based on these results, [18F]2B-SRF101 showed suitable characteristics to be considered a potential PET tracer.
In vivo Studies: Micro-PET/CT Imaging
Dynamic PET/CT studies with [18F]2B-SRF101 showed a higher uptake in some regions, particularly in cortex and hippocampus, in the 3xTg mice than in control group. These two regions are of special interest as it has been reported that this transgenic mouse model develops astrocytosis from 7 months of age, mainly in the hippocampus and cortex (Oddo et al., 2003). The mentioned difference between both groups could be observed in PET images of [18F]2B-SRF101 shown in Figure 5. Besides, a significant difference in [18F]2B-SRF101 uptake was found for hippocampus from 35 to 90 min and for cortex from 5 up to 65 min (Figure 6).
The comparative studies between [18F]2B-SRF101 and [11C]DED suggest that both tracers have different roles as astrocytosis markers in this animal model. In any case, it should be considered that both radiotracers labeled astrocytes through different molecular targets. [18F]2B-SRF101 was expected to detect astrocytes by a direct mechanism of binding/entry to them, so it would probably label both reactive and non-reactive astrocytes. In contrast, [11C]DED presents an indirect mechanism of astrocyte labeling, as it binds to MAO-B, which is mainly increased in reactive astrocytes. Therefore, astrocyte labeling with [11C]DED may be related to the stage of the disease, which determines the astrocyte activation level. In fact, in a recently reported study, it was shown that [11C]DED is a useful tool for the diagnosis of neuroinflammation in the early stages of the disease (Olsen et al., 2018). The authors stated that changes in MAO-B levels and glial fibrillary acidic protein (GFAP)/vimentin expression (astrocyte marker) do not occur simultaneously. Apparently, elevated MAO-B levels are an early event during Aβ pathology progression, but they remain practically unchanged thereafter. In contrast, GFAP and vimentin appear to increase later, most likely as a consequence of abundant Aβ plaque formation. The researchers even concluded that both markers did not co-localize to the same cell population. Thus, a single marker, such as MAO-B, GFAP or vimentin, may not be sufficient to estimate the total astrogliosis level. Based on a similar analogy with [18F]2B-SRF101 and [11C]DED, both radiotracers could provide different and complementary information at the same time. In this way, by means of a multitracer approach (Engler, 2008; Rodriguez-Vieitez and Nordberg, 2018), useful information could be obtained for the staging of the disease, thereby contributing to its early, accurate diagnosis.
Considering the postulation by some authors that SR101 labels not only astrocytes, but also mature myelinating oligodendrocytes, [18F]2B-SRF101’s ability to diffuse from astrocytes to oligodendrocytes should be evaluated in future works. As a breakdown of myelin is observed in AD, induced by the vulnerability of the oligodendrocytes in this disease (Cai and Xiao, 2016; Hülsmann et al., 2017), having a tracer that labels both cells (oligodendrocytes and astrocytes) could be a useful tool for detecting the chronic inflammation observed in the pathological process of AD.
Finally, we compared the [11C]DED uptake between 3xTg mice and control group, finding no significant difference in any of the analyzed regions (Figure 4). Recently, an evaluation of [11C]DED uptake on a similar AD animal model was performed (Rodriguez-Vieitez et al., 2015). In that work, the researchers demonstrated that tracer uptake decreased markedly with the age of the transgenic mice, especially in the cortex and hippocampus, while it was not age dependent in the control group. These authors even observed that [11C]DED activity in these areas was higher in the transgenic mice at 6 months than it was at 8 or 15 months of age. In our work, the studies were carried out with 9- and 10-month-old animals. Thus, the lower uptake observed for [11C]DED in comparison with [18F]2B-SRF101 in the 3xTg mice could be explained by the observation mentioned above. It is important to consider that several transgenic mouse models harboring familial AD mutations are currently available. They provide useful insights into the pathophysiology of the human disease, but none completely replicate it. Therefore, when analyzing the results, the model characteristics must be carefully considered for a better understanding of them.
In conclusion, the preclinical characterisation of [18F]2B-SRF101 was performed. Biodistribution studies allowed evaluation of the pharmacokinetic profile and verification that [18F]2B-SRF101 presented appropriate characteristics to become a PET diagnostic agent. A hepatointestinal metabolisation of the compound was observed, consistent with its lipophilic feature. The micro-PET/CT imaging with [18F]2B-SRF101 revealed that the novel tracer may be an astrocytosis marker in the animal model used in the present work.
In combination, the results suggested that [18F]2B-SRF101 is a promising candidate for more extensive evaluation as an astrocyte tracer. In addition, comparing the micro-PET/CT studies performed with [18F]2B-SRF101 and [11C]DED, we concluded that both tracers could provide different and complementary data. In that sense, they could be useful tools for carrying out a better assessment of the AD pathology in a multitracer approach.
Ethics Statement
The research protocol was carried out in accordance with the National Bioethics Committee requirements and under the current ethical regulations of the national law on animal experimentation no. 18.611 (National Commission for Animal Experimentation, CNEA, Uruguay). CUDIM’s Animal Bioethics Committee approved these protocols.
Author Contributions
HE, ES, PO, and IK designed the study. IK performed the radiolabeling and animal care. TP carried out ex vivo imaging studies. AR, AP, and IK performed the biodistribution and molecular imaging acquisition studies. IK, AR, and PO performed the data analysis. IK drafted the initial manuscript version. WP, AR, and PO contributed to the data analysis and manuscript revision. MI contributed with statistical analysis, data processing, and graphic design. ES and HE revised and approved the final draft of the manuscript.
Funding
This work was supported by CUDIM, ANII Grant Number POS_NAC_2012_1_8771 for a grant to IK as research fellowship and PEDECIBA – Química granted funds for Ph.D. students to support their studies.
Conflict of Interest Statement
The authors declare that the research was conducted in the absence of any commercial or financial relationships that could be construed as a potential conflict of interest.
The reviewer, VK, declared a past co-authorship, with several of the authors, ES, HE, and TP, to the handling Editor.
Acknowledgments
The authors would like to thank Andrea Boné for her support in radiotracer’s quality control, Koresh Shogi for guiding animal studies carried out in Washington University (United States), and Centro Uruguayo de Imagenología Molecular for its support in all the synthesis, preclinical experiments, and research staff.
Supplementary Material
The Supplementary Material for this article can be found online at: https://www.frontiersin.org/articles/10.3389/fnins.2019.00734/full#supplementary-material
References
Anderova, M., Butenko, O., Harantova, L., and Dzamba, D. (2016). Glial cells - the key elements of Alzheimer‘s disease. Curr. Alzheimer Res. 13, 894–911. doi: 10.2174/1567205013666160129095924
Appaix, F., Girod, S., Boisseau, S., Römer, J., Vial, J. C., Albrieux, M., et al. (2012). Specific in vivo staining of astrocytes in the whole brain after intravenous injection of sulforhodamine dyes. PLoS One 7:e35169. doi: 10.1371/journal.pone.0035169
Archer, H. A., Edison, P., Brooks, D. J., Barnes, J., Frost, C., Yeatman, T., et al. (2006). Amyloid load and cerebral atrophy in Alzheimer’s disease: an [11C]PIB positron emission tomography study. Ann. Neurol. 60, 145–147. doi: 10.1002/ana.20889
Barrio, J., Huang, S. C., Cole, G., Satyamurthy, N., Petric, A., Phelps, M., et al. (1999). PET imaging of tangles and plaques in Alzheimer disease with a highly hydrophobic probe. J. Label. Comp. Radiopharm. 42, S194–S195.
Buccino, P., Kreimerman, I., Zirbesegger, K., Porcal, W., Savio, E., and Engler, H. (2016). Automated radiosynthesis of 11C-L-deprenyl-D2 and 11C-D-deprenyl using a commercial platform. Appl. Radiat. Isot. 110, 47–62. doi: 10.1016/j.apradiso.2015.12.051
Cai, Z., and Xiao, M. (2016). Oligodendrocytes and Alzheimer’s disease. Int. J. Neurosci. 126, 97–104. doi: 10.3109/00207454.2015.1025778
Carter, S. F., Schöll, M., Almkvist, O., Wall, A., Engler, H., Långström, B., et al. (2012). Evidence for astrocytosis in prodromal Alzheimer disease provided by 11C-deuterium-L-deprenyl: a multitracer PET paradigm combining 11C-Pittsburgh compound B and 18F-FDG. J. Nucleic Med. 53, 37–46. doi: 10.2967/jnumed.110.087031
Choo, I. L., Carter, S. F., Schöll, M. L., and Nordberg, A. (2014). Astrocytosis measured by 11C-deprenyl PET correlates with decrease in gray matter density in the parahippocampus of prodromal Alzheimer’s patients. Eur. J. Nucleic Med. Mol. Imaging 41, 2120–2126. doi: 10.1007/s00259-014-2859-7
Engler, H. (2008). PET and the Multitracer Concept: An Approach to Neuroimaging Pathology. Uppsala: Acta Universitatis Upsaliensis.
Engler, H., Klunk, W., Nordberg, A., Blomqvist, G., Holt, D., Wang, Y., et al. (2004). “The Living Brain and Alzheimer’s Disease. First PET Study with a Benzothiazol Amyloidimaging Agent (PIB) in Alzheimer’s Disease Patients and Healthy Volunteers,” in The Living Brain and Alzheimer’s Disease, eds B. T. Hyman, J. F. Demonet, and Y. Christen (Berlin: Springer), 123–137. doi: 10.1007/978-3-642-59300-0_10
Engler, H., Lundberg, P. O., Ekbom, K., Nennesmo, I., Nilsson, A., Bergström, M., et al. (2003). Multitracer study with positron emission tomography in Creutzfeldt-Jakob disease. Eur. J. Nucleic Med. Mol. Imaging 30, 85–95. doi: 10.1007/s00259-002-1008-x
Engler, H., Nennesmo, I., Kumlien, E., Gambini, J. P., Lundberg, P., Savitcheva, I., et al. (2012). Imaging astrocytosis with PET in Creutzfeldt-Jakob disease: case report with histopathological findings. Int. J. Clin. Exp. Med. 5, 201–217.
Fodero-Tavoletti, M. T., Brockshnieder, D., Villemagne, V. L., Martin, L., Connor, A. R., Thiele, A., et al. (2012). In vitro characterization of 18F-Florebetaben, an Aβ imaging, radiotracer. Nucleic Med. Biol. 39, 1042–1048. doi: 10.1016/j.nucmedbio.2012.03.001
Fowler, J. S., Volkow, N. D., Wang, G. J., Pappas, N., Logan, J., MacGregor, R., et al. (1996). Inhibition of monoamine oxidase B in the brains of smokers. Nature 379, 733–736. doi: 10.1038/379733a0
Hagos, L., and Hülsmann, S. (2016). Unspecific labelling of oligodendrocytes by sulforhodamine 101 depends on astrocytic uptake via the thyroid hormone transporter OATP1C1 (SLCO1C1). Neurosci. Lett. 631, 13–18. doi: 10.1016/j.neulet.2016.08.010
Hill, R. A., and Grutzendler, I. (2014). In vivo imaging of oligondendrocytes with sulforhodamine. Nat. Methods 11, 1081–1082. doi: 10.1038/nmeth.3140
Hülsmann, S., Hagos, L., Heuer, H., and Schnell, C. (2017). Limitations of Sulforhodamine 101 for brain imaging. Front. Cell. Neurosci. 11:44. doi: 10.3389/fncel.2017.00044
James, O., Doraiswamy, P., and Borges-Neto, S. (2015). PET imaging of tau pathology in Alzheimer‘s disease and tauopathies. Front. Neurol. 6:38. doi: 10.3389/fneur.2015.00038
Johansson, A., Engler, H., Blomquist, G., Scott, B., Wall, A., Aquilonius, S. M., et al. (2007). Evidence for astrocytosis in ALS demonstrated by 11[C](L)-deprenyl-D2 PET. J. Neurol. Sci. 255, 17–22. doi: 10.1016/j.jns.2007.01.057
Kadir, A., Marutle, A., Gonzalez, D., Schöll, M., Almkvist, O., Mousavi, M., et al. (2011). Positron emission tomography imaging and clinical progression in relation to molecular pathology in the first Pittsburgh compound B positron emission tomography patient with Alzheimer’s disease. Brain 134, 301–317. doi: 10.1093/brain/awq349
Klunk, W., Engler, H., Nordberg, A., Wang, Y., Blomqvist, G., Holt, D. P., et al. (2004). Imaging Brain Amyloid in Alzheimer’s disease with Pittsburgh compound-B. Ann. Neurol. 55, 306–319. doi: 10.1002/ana.20009
Kreimerman, I., Porcal, W., Olivera, S., Oliver, P., Savio, E., and Engler, H. (2017). Synthesis of [18F]2B-SRF101: a sulfonamide derivative of the fluorescent dye Sulforhodamine 101. Curr. Radiopharm. 10, 212–220. doi: 10.2174/1874471010666170928112853
Li, Z., and Conti, P. S. (2010). Radiopharmaceutizal chemistry for positron emission tomography. Adv. Drug. Deliv. Rev. 62, 1031–1051. doi: 10.1016/j.addr.2010.09.007
Mukaetova-Ladinska, E. B., Harrington, C. R., Roth, M., and Wischik, C. M. (1993). Biochemical and anatomical redistribution of tau protein in Alzheimer’s disease. Am. J. Pathol. 143, 565–578.
Näslund, J., Haroutunian, V., Mohs, R., Davis, K. L., Davies, P., and Greengard, P. (2000). Correlation between elevated levels of amyloid beta-peptide in the brain and cognitive decline. J. Am. Med. Assoc. 283, 1571–1577. doi: 10.1001/jama.283.12.1571
Nimmerjahn, A., and Helmchen, F. (2012). In vivo labeling of cortical astrocytes with sulforhodamine 101 (SR101). Cold Spring Harb. Protoc. 3, 326–334. doi: 10.1101/pdb.prot068155
Nimmerjahn, A., Kirchhoff, F., Kerr, J. N., and Helmchen, F. (2004). Sulforhodamine 101 as a specific marker of astroglia in the neocortex in vivo. Nat. Methods 1, 1–7. doi: 10.1038/nmeth706
Nordberg, A. (2004). PET imaging of amyloid in Alzheimer‘s disease. Lancet Neurol. 3, 519–527. doi: 10.1016/S1474-4422(04)00853-1
Oddo, S., Caccamo, A., Shepherd, J. D., Murphy, M. P., Golde, T. E., Kayed, R., et al. (2003). Triple-transgenic model of Alzheimer’s disease with plaques and tangles: intracellular Aβ and synaptic dysfunction. Neuron 39, 409–421. doi: 10.1016/S0896-6273(03)00434-3
Olsen, M., Aguilar, X., Sehlin, D., Fang, X. T., Antoni, G., Erlandsson, A., et al. (2018). Astroglial reponses to Amyloid-Beta progression in a mouse model of Alzheimer’s disease. Mol. Imaging Biol. 20, 605–614. doi: 10.1007/s11307-017-1153-z
Overmyer, M., Helisalmi, S., Soininen, H., Laakso, M., Riekkinen, P., and Alafuzoff, I. (1999). Astrogliosis and the ApoE genotype. An immunohistochemical study of postmortem human brain tissue. dement. Geriatr. Cogn. Disord. 10, 252–257. doi: 10.1159/000017128
Patlak, C. S., Blasberg, R. G., and Fenstermacher, J. D. (1983). Graphical evaluation of blood-to-brain transfer constants from multiple time uptake data. J. Cereb. Blood Flow. Metab. 3, 1–7. doi: 10.1038/jcbfm.1983.1
Paxinos, G., and Watson, C. (1998). The Rat Brain in Stereotaxic Coordinates, 3rd Edn. Orlando: Academic Press.
Rodriguez-Vieitez, E., Ni, R., Gulyás, B., Tóth, M., Haggkvist, J., Halldin, C., et al. (2015). Astrocytosis precedes amyloid depositiomn in Alzheimer APPswe transgenic mouse brain: a correlative positron emission tomography and in vitro imaging study. Eur. J. Nucleic Med. Mol. Imaging 42, 1119–1132. doi: 10.1007/s00259-015-3047-0
Rodriguez-Vieitez, E., and Nordberg, A. (2018). “Imaging Neuroinflammation: Quantification of Astrocytosis in a Multitracer PET Approach,” in Biomarkers for Alzheimer’s Disease Drug Development. Methods in Molecular Biology, Vol. 1750, ed. R. Perneczky (New York, NY: Humana Press), 231–251. doi: 10.1007/978-1-4939-7704-8_16
Santillo, A. F., Gambini, J. P., Lannfelt, L., Långström, B., Ulla-Marja, L., Kilander, L., et al. (2011). In vivo imaging of astrocytosis in Alzheimer’s disease: an11C-L-deuteriodeprenyl and PIB PET study. Eur. J. Nucleic Med. Mol. Imaging 38, 2202–2208. doi: 10.1007/s00259-011-1895-9
Schnell, C., Hagos, Y., and Hülsmann, S. (2012). Active Sluforhodamine 101 uptake into hippocampal astrocytes. PLoS One 7:e49398. doi: 10.1371/journal.pone.0049398
Schnell, C., Shahmoradi, A., Wichert, S., Mayerl, S., Hagos, Y., Heuer, H., et al. (2015). The multispecific thyroid hormone transporter OATP1C1 mediates cell-specific sulforhodamine 101-labelling of hippocampal astrocytes. Brain. Struct. Funct. 220, 193–203. doi: 10.1007/s00429-013-0645-0
Shimojo, M., Higuchi, M., Suhara, T., and Sahar, N. (2015). Imaging multimodalities for dissecting Alzheimer’s disease: advanced technologies of positron emission tomography and fluorescence imaging. Front. Neurosci. 9:482. doi: 10.3389/fnins.2015.00482
Teipel, S., Drzazga, A., Grothe, M. J., Barthel, H., Chételat, G., Schuff, N., et al. (2015). Multimodal imaging in Alzheimer’s disease: validity and usefulness for early detection. Lancet Neurol. 14, 1037–1053. doi: 10.1016/S1474-4422(15)00093-9
Vérant, P., Ricard, C., Serduc, R., Vial, J. C., and Van der Sanden, B. (2008). In vivo staining of neocortical astrocytes via the cerebral microcirculation using Sulforhodamine B. J. Biomed. Opt. 13:064028. doi: 10.1117/1.3041163
Verkhratsky, A., Olabarria, M., Noristani, H., Yeh, C. Y., and Rodriguez, J. J. (2010). Astrocytes in Alzheimer‘s Disease. Neurotherapeutics 7, 399–412. doi: 10.1016/j.nurt.2010.05.017
Villemagne, V., Fodero-Tavoletti, M., Masters, C., and Rowe, C. C. (2015). Tau imaging: early progress and future directions. Lancet Neurol. 14, 114–121. doi: 10.1016/S1474-4422(14)70252-2
Villemagne, V. L., Doré, V., Burnham, S. C., Masters, C. L., and Rowe, C. C. (2018). Imaging tau and amyloid-β proteinopathies in Alzheimer disease and other conditions. Nat. Rev. Neurol. 14, 225–236. doi: 10.1038/nrneurol.2018.9
Keywords: [18F]2B-SRF101, [11C]deuterodeprenyl, PET radiopharmaceutical, astrocytosis, Sulforhodamine 101, astrocyte tracer
Citation: Kreimerman I, Reyes AL, Paolino A, Pardo T, Porcal W, Ibarra M, Oliver P, Savio E and Engler H (2019) Biological Assessment of a 18F-Labeled Sulforhodamine 101 in a Mouse Model of Alzheimer’s Disease as a Potential Astrocytosis Marker. Front. Neurosci. 13:734. doi: 10.3389/fnins.2019.00734
Received: 24 September 2018; Accepted: 01 July 2019;
Published: 16 July 2019.
Edited by:
Adriaan Anthonius Lammertsma, VU University Medical Center Amsterdam, NetherlandsReviewed by:
Ronald Boellaard, VU University Medical Center Amsterdam, NetherlandsVasko Kramer, Positronpharma SA, Chile
Copyright © 2019 Kreimerman, Reyes, Paolino, Pardo, Porcal, Ibarra, Oliver, Savio and Engler. This is an open-access article distributed under the terms of the Creative Commons Attribution License (CC BY). The use, distribution or reproduction in other forums is permitted, provided the original author(s) and the copyright owner(s) are credited and that the original publication in this journal is cited, in accordance with accepted academic practice. No use, distribution or reproduction is permitted which does not comply with these terms.
*Correspondence: Eduardo Savio, ZWR1YXJkby5zYXZpb0BjdWRpbS5vcmc=