 Ying Yang1†Dao-min Zhu2,3,4†Cun Zhang1Yu Zhang2,3,4Chunli Wang5Biao Zhang1Wenming Zhao1Jiajia Zhu1*
 Yongqiang Yu1*
- 1Department of Radiology, The First Affiliated Hospital of Anhui Medical University, Hefei, China
- 2Department of Sleep Disorders, Affiliated Psychological Hospital of Anhui Medical University, Hefei, China
- 3Hefei Fourth People’s Hospital, Hefei, China
- 4Anhui Mental Health Center, Hefei, China
- 5Department of Clinical Laboratory, The First Affiliated Hospital of Anhui Medical University, Hefei, China
Background: Sleep disturbance is common in patients with major depressive disorder (MDD), but the exploration of its neural underpinnings is limited by subjective sleep measurement and single-modality neuroimaging analyses.
Methods: Ninety six patients with MDD underwent polysomnography examinations and multi-modal magnetic resonance imaging (MRI) scans. According to sleep efficiency, patients were subdivided into well-matched normal sleep efficiency (NSE, N = 42; 14 men; aged 43 ± 10 years) and low sleep efficiency (LSE, N = 54; 23 men; aged 45 ± 12 years) groups. Inter-group differences in brain structure and function were examined by applying voxel-based morphometry (VBM), regional homogeneity (ReHo) and functional connectivity strength (FCS), and tract-based spatial statistics (TBSS) approaches to structural, functional, and diffusion MRI data, respectively.
Results: There was no significant difference in gray matter volume (GMV) between the NSE and LSE groups. Compared with the NSE group, the LSE group showed increased axial diffusivity in the left superior and posterior corona radiata, and left posterior limb and retrolenticular part of internal capsule. In addition, the LSE group exhibited decreased ReHo in the bilateral lingual gyri and right postcentral gyrus yet increased FCS in the left angular gyrus relative to the NSE group. Moreover, validation analyses revealed that these results remained after adjusting for the medication effect.
Conclusion: Our data indicate that preserved gray matter morphology, impaired white matter integrity, and decreased local synchronization degree yet increased FCS are specific to low SE in MDD patients. These findings of disassociation between structural and functional alterations might provide insights into the neural mechanisms of sleep disturbance in depression.
Introduction
Major depressive disorder (MDD) is a prevalent psychiatric illness affecting more than 300 million people of all ages worldwide, and it is characterized by abnormalities in mood, cognition, neurovegetative function, and psychomotor activity (American Psychiatric Association, 2013; World Health Organization [WHO], 2017; Frankish et al., 2018). It is well established that sleep problems (e.g., difficulty in falling asleep, difficulty in maintaining asleep or poor sleep quality, and difficulty in returning to sleep after early morning awakenings) are common complaints in MDD patients and up to 90% of the patients may experience sleep problems at some points of their illness trajectory (Tsuno et al., 2005). Thus, identification of relevant features specific to sleep disturbance in MDD is important for precise clinical diagnosis, treatment, and research.
Several predisposing factors including genetical determined dysfuntions (e.g., adenosine, gamma-aminobutyric acid receptor polymorphisms, and Clock genes), neurobiological mechanisms (e.g., homeostatic and circadian dysregulation), and personality characteristics (e.g., emotional suppression, maladaptive perfectionism, and neuroticsm) might contribute to the etiology and pathophysiology of sleep disturbance in MDD (Tsuno et al., 2005; Riemann et al., 2019). Importantly, previous neuroimaging studies using [18F]fluorodeoxyglucose positron emission tomography (PET) techniques have reported a reduction in brain glucose metabolism changes during the wake-sleep cycle in depressed patients relative to healthy subjects (Germain et al., 2004; Nofzinger et al., 2004, 2005).
The advent of magnetic resonance imaging (MRI) techniques and numerous methodological advances have provided a safe, non-invasive, and easily repeated neuroimaging avenue to exploring brain structural and functional changes in patients with psychiatric disorders (Agarwal et al., 2010; Lui et al., 2016). More recently, an increasing number of MRI research has emerged to investigate the neural mechanisms underlying various sleep disturbances in MDD. For example, Yu et al. (2018) found that patients with co-occurring depression and insomnia [Hamilton Rating Scale for Depression (HAMD) sleep subscale score > 3] showed smaller brain volume in the right orbitofrontal cortex when compared to patients with lower insomnia/depression. Liu et al. (2018) reported patients with MDD and high insomnia (HAMD sleep subscale score ≥ 4) had increased amplitude of low-frequency fluctuations in the right inferior frontal gyrus/anterior insula when compared with patients with MDD and low insomnia (HAMD sleep subscale score ≤ 3). Tao et al. (2018) found that functional connectivity alterations of the suprachiasmatic nuclei were associated with early-wakening symptom (HAMD-6 score = 1 or 2 for waking early in the morning) in MDD. McKinnon et al. (2018) suggested that sleep disturbance [the total score of Pittsburgh Sleep Quality Index (PSQI) > 5] in older people with a lifetime history of depression was related to increased functional connectivity in the default mode network. Notably, these studies measured sleep quality using subjective scales (e.g., PSQI) rather than objective tools [e.g., polysomnography (PSG)] and the neuroimaging analyses only focused on a single MRI modality.
PSG-derived sleep efficiency (SE), defined as the ratio of total sleep time (TST) to time in bed (TIB), is the most commonly used quantitative measure to objectively evaluate sleep quality (Akerstedt et al., 1994; Jung et al., 2017). A higher value of SE indicates more consolidated sleep because SE considers all sleep continuity variables (sleep latency, final wake time, and wake after sleep onset) in its calculation (Akerstedt et al., 1994; Hasler and Troxel, 2010). For MDD patients, depressive symptoms such as fatigue, anhedonia, and physical inactivity may lead to more time spent sleeping throughout the night and day, but less time obtaining efficient, restful, and uninterrupted sleep (Patel et al., 2006; Lacruz et al., 2016). SE can better capture this core feature of sleep disturbance in MDD. In light of evidence that SE decreases with age in healthy individuals (Ohayon et al., 2004) and SE is greater than 90% in normal young and middle-aged adults (Carrier et al., 2001; Gaudreau et al., 2001), a cutoff point of 90% was used to differentiate MDD patients with normal and low SE in the current study. With respect to MRI techniques, we adopted structural, functional and diffusion MRI (sMRI, fMRI, and dMRI) to assess brain structure and function. Specifically, gray matter volume (GMV) was measured by applying voxel-based morphometry (VBM) approach to sMRI (Ashburner and Friston, 2000). For resting-state fMRI, regional homogeneity (ReHo) and functional connectivity strength (FCS) approaches were employed to assess gray matter function. ReHo measures the degree of functional synchronization between a given voxel and its neighboring voxels (Zang et al., 2004; Liu et al., 2012). FCS is a graph theory measure that evaluates functional connectivity of each voxel with all other voxels across the whole brain (Tomasi and Volkow, 2010; Zuo et al., 2012; Liu et al., 2015; Zhu et al., 2017). In addition, tract-based spatial statistics (TBSS) analysis of diffusion MRI allows us to examine changes in multiple diffusion parameters, which reflect white matter integrity (Smith et al., 2006).
Collectively, the objective of this study was to test brain structural and functional differences between MDD patients with normal and low SE using a combined method of PSG and multi-modal MRI. We hypothesized that MDD patients with low SE would exhibit more severe brain aberrations than those with normal SE.
Materials and Methods
Participants
A total of 96 right-handed MDD patients with age between 18 and 60 years old were enrolled in this study. Patients were recruited from Department of Sleep Disorders, Affiliated Psychological Hospital of Anhui Medical University. The diagnosis of MDD was determined by two well-trained clinical psychiatrists according to the International Classification of Diseases (ICD-10). Exclusion criteria were (1) the presence of other psychiatric disorders such as schizophrenia, bipolar disorder, substance-induced mood disorder, anxiety disorders, substance abuse or dependence; (2) a history of significant neurological or physical diseases; (3) a history of head injury with loss of consciousness; (4) pregnancy or any contraindications for MRI. 24-item HAMD and 14-item Hamilton Rating Scale for Anxiety (HAMA) were used to assess the severity of depression and anxiety symptoms (Hamilton, 1967; Thompson, 2015). Subjective sleep quality and excessive daytime sleepiness were evaluated by using PSQI and Epworth Sleepiness Scale (ESS), respectively. All patients were receiving their regular antidepressant medications, either with selective serotonin reuptake inhibitors (SSRIs), serotonin norepinephrine reuptake inhibitors (SNRIs) or noradrenergic and specific serotonergic antidepressant (NaSSA). This study was approved by the Ethics Committee of The First Affiliated Hospital of Anhui Medical University and written informed consent was obtained from each participant.
Polysomnography Examination
Full overnight PSG monitoring was performed on the patients using an Embla N7000 instrument (New York, NY, United States) according to the American Academy of Sleep Medicine (AASM) rules (Berry et al., 2012). All participants had to refrain from alcohol, caffeine and tea during the recording days. Neurophysiological variables [electroencephalogram (EEG), electrooculogram (EOG), chin electromyogram (EMG), and lower extremity movement], cardiorespiratory variables [electrocardiogram (ECG), thoracic and abdominal movements, oxygen saturation (SpO2), oronasal flow], and other variables such as body position were recorded. The signals were automatically recorded and subsequently analyzed. In our design, the following variables were extracted: TIB, TST, sleep time in non-rapid eye movements (NREM), and rapid eye movements (REM) periods. TIB was defined as the time from “lights out” to “lights on.” TST was defined as the sum of sleep time in NREM and REM periods. SE was defined as the ratio of TST to TIB. According to the value of SE, MDD patients were further divided into normal sleep efficiency (NSE) group of 42 patients with SE ≥ 90% and low sleep efficiency (LSE) group of 54 patients with SE < 90%.
Image Acquisition
All MDD patients underwent MRI scanning in the morning after PSG recordings. MRI scans were obtained using a 3.0-Tesla MR system (Discovery MR750w, General Electric, Milwaukee, WI, United States) with a 24-channel head coil. High-resolution 3D T1-weighted structural images were acquired using a brain volume (BRAVO) sequence with the following parameters: repetition time (TR) = 8.5 ms; echo time (TE) = 3.2 ms; inversion time (TI) = 450 ms; flip angle (FA) = 12°; field of view (FOV) = 256 mm × 256 mm; matrix = 256 × 256; slice thickness = 1 mm, no gap; 188 sagittal slices; and acquisition time = 296 s. Resting-state blood-oxygen-level-dependent (BOLD) data were acquired using a gradient-echo single-shot echo planar imaging (GRE-SS-EPI) sequence with the following parameters: TR = 2000 ms; TE = 30 ms; FA = 90°; FOV = 220 mm × 220 mm; matrix = 64 × 64; slice thickness = 3 mm, slice gap = 1 mm; 35 interleaved axial slices; 185 volumes; and acquisition time = 370 s. DTI data were acquired using a spin-echo single-shot echo planar imaging (SE-SS-EPI) sequence with the following parameters: TR = 10,000 ms; TE = 74 ms; FA = 90°; FOV = 256 mm × 256 mm; matrix = 128 × 128; slice thickness = 3 mm without gap; 50 axial slices; 64 diffusion gradient directions (b = 1000 s/mm2) plus five b = 0 reference images; and acquisition time = 700 s. Before the scanning, all subjects were instructed to keep their eyes closed, relax, move as little as possible, think of nothing in particular, and not fall asleep during the scans. During and after scanning, we asked subjects whether they had fallen asleep to confirm that none of them had done so. None of the participants were excluded for visually inspected imaging artifacts.
Voxel-Based Morphometry Analysis
The 3D T1-weighted structural images were processed using the VBM8 toolbox1 in Statistical Parametric Mapping software (SPM8)2. First, all the structural images were visually inspected to screen for artifacts or gross anatomical abnormalities. Then, all the structural images were segmented into gray matter, white matter and cerebrospinal fluid using the standard segmentation model. After an initial affine registration of the gray matter concentration map into Montreal Neurological Institute (MNI) space, the gray matter concentration images were non-linearly warped using the diffeomorphic anatomical registration through the exponentiated Lie algebra (DARTEL) technique and then resampled to a voxel size of 1.5 mm × 1.5 mm × 1.5 mm. The GMV map was obtained by multiplying the gray matter concentration map by the non-linear determinants that were derived from the spatial normalization step. Finally, the resultant GMV images were smoothed with a 6 mm full-width at half-maximum (FWHM) Gaussian kernel. The aims of smoothing were (1) to improve the signal to noise ratio; (2) to make the imaging data satisfy a Gaussian distribution, which is the prerequisite for parametric statistics; and (3) to further overcome the alignment problem in the spatial normalization step.
DTI Data Preprocessing
The DTI datasets were pre-processed with the FMRIB Software Library (FSL v5.0.9)3. First, eddy current distortion and head motion were corrected by registering the diffusion-weighted images to the first b0 image through the affine transformations. Second, the data were skull-stripped by using the FMRIB Brain Extraction Tool. Finally, diffusion parameters of fractional anisotropy (FA), axial diffusivity (AD), radial diffusivity (RD), and mean diffusivity (MD) were calculated by using the DTIFIT toolbox.
Tract-Based Spatial Statistics Analysis
Voxel-wise statistical analyses of the diffusion parameters were performed by using TBSS pipeline (Smith et al., 2006). First, individual FA images were aligned to the MNI space by using FMRIB Non-linear Imaging Registration Tool. After transformation into the MNI space, mean FA image was created and thinned to generate a mean FA skeleton. Then, individual aligned FA, AD, RD, and MD images were projected onto this common skeleton.
fMRI Data Preprocessing
Resting-state BOLD data were preprocessed using Data Processing and Analysis for Brain Imaging (DPABI)4 (Yan et al., 2016). The first 10 volumes for each participant were discarded to allow the signal to reach equilibrium and the participants to adapt to the scanning noise. The remaining volumes were corrected for the acquisition time delay between slices. Then, realignment was performed to correct the motion between time points. Head motion parameters were computed by estimating the translation in each direction and the angular rotation on each axis for each volume. All participants’ BOLD data were within the defined motion thresholds (i.e., translational or rotational motion parameters less than 2.5 mm or 2.5°). We also calculated frame-wise displacement (FD), which indexes the volume-to-volume changes in head position. Several nuisance covariates (the linear drift, the estimated motion parameters based on the Friston-24 model, the spike volumes with FD > 0.5, the white matter signal, and the cerebrospinal fluid signal) were regressed out from the data. The datasets were then band-pass filtered using a frequency range of 0.01–0.1 Hz. In the normalization step, individual structural images were firstly co-registered with the mean functional image; then the transformed structural images were segmented and normalized to the MNI space using the DARTEL technique. Finally, each filtered functional volume was spatially normalized to MNI space using the deformation parameters estimated during the above step and resampled into a 3 mm cubic voxel.
Regional Homogeneity Analysis
The ReHo calculation procedure was the same as that reported in previous studies (Zang et al., 2004). ReHo can be used to measure the degree of local regional neural activity coherence. In short, it was calculated as the Kendall’s coefficient of concordance (or Kendall’s W) of the time course of a given voxel with those of its nearest neighbors (26 voxels). For the purpose of standardization, the ReHo value of each voxel was divided by the global mean ReHo value. Finally, the resulting ReHo images were spatially smoothed with a 6 mm FWHM Gaussian kernel.
Functional Connectivity Strength Analysis
We computed Pearson’s correlation coefficients between the BOLD time courses of all pairs of voxels and obtained a whole gray matter functional connectivity matrix for each participant (Tomasi and Volkow, 2010; Zuo et al., 2012; Liu et al., 2015; Zhu et al., 2017). For a given voxel, FCS was computed as the sum of positive functional connectivity above a threshold of 0.6 between that voxel and all other voxels within the whole gray matter. Then, we normalized the FCS value of each voxel by dividing it by the global mean FCS value. Finally, the resultant FCS maps were spatially smoothed with a 6 mm FWHM Gaussian kernel.
Statistical Analyses
Demographic variables [age, years of education, body mass index (BMI), total intracranial volume (TIV), and FD], clinical parameters (onset age, illness duration, HAMD, HAMA, PSQI, and ESS), and PSG parameters (TIB, TST, NREM duration, REM duration, and SE) were compared between the NSE and LSE groups using two sample t-tests. Group difference in gender was tested by using Pearson Chi-square test. Pearson correlation analyses were used to examine the associations between SE and self-report sleep measures of PSQI and ESS. These statistical analyses were performed by using the SPSS 23.0 software package (SPSS, Chicago, β).
Voxel-based comparisons of GMV, ReHo, and FCS between the NSE and LSE groups were conducted by using the parametric two sample t-tests in the SPM8 software. Multiple comparisons were corrected using a cluster-level family-wise error (FWE) method, resulting in a cluster defining threshold of P = 0.001 and a corrected cluster significance of P < 0.05. For TBSS analyses of four DTI parameters (FA, AD, RD and MD), the non-parametric permutation testing (permutation number = 5000) and threshold-free cluster enhancement (TFCE) in the FSL software were used for statistical inference. The FWE method was also used to correct for multiple comparisons with a corrected significance threshold of P < 0.05. If a measure exhibited a significant between-group difference in a cluster, the mean value within this cluster was extracted for subsequent region of interest (ROI)-based analysis. To validate the group comparison results, Pearson correlation analyses were also used to test the relationship between SE and ROI mean values.
In addition, since previous studies have indicated that antidepressant medication may affect brain structure and function in MDD (Dusi et al., 2015; Brakowski et al., 2017), we considered antidepressant types (SSRIs, SNRIs, and NaSSA) as a categorical variable and then repeated the ROI-based inter-group comparisons in GMV, ReHo, FCS, and DTI parameters by using a general linear model with antidepressant types as a nuisance covariate to exclude its potential influence.
Results
Demographic, Clinical, and PSG Characteristics
Demographic, Clinical and PSG data of the sample are listed in Table 1. For the demographic and clinical data, the NSE and LSE groups did not differ in age (two-sample t-test, t = −0.849, P = 0.398), education (t = −0.240, P = 0.811), BMI (t = −0.885, P = 0.379), TIV (t = −1.621, P = 0.108), FD (t = 1.189, P = 0.238), onset age (t = −1.341, P = 0.183), duration of illness (t = 0.954, P = 0.343), HAMD (t = −0.335, P = 0.739), HAMA (t = −0.814, P = 0.417), PSQI (t = −0.162, P = 0.872), ESS (t = −0.608, P = 0.545) and sex (Chi-square test, χ2 = 0.855, P = 0.355). For the PSG data, although the two groups did not differ in TIB (t = −1.135, P = 0.259), the LSE group had decreased TST (t = 5.811, P < 0.001), NREM duration (t = 4.121, P < 0.001), REM duration (t = 3.075, P = 0.003), and SE (t = 13.135, P < 0.001) relative to the NSE group. In addition, Pearson correlation analyses revealed that there were no significant correlations between SE and self-report sleep measures of PSQI (r = −0.001, P = 0.990) and ESS (r = −0.025, P = 0.810).
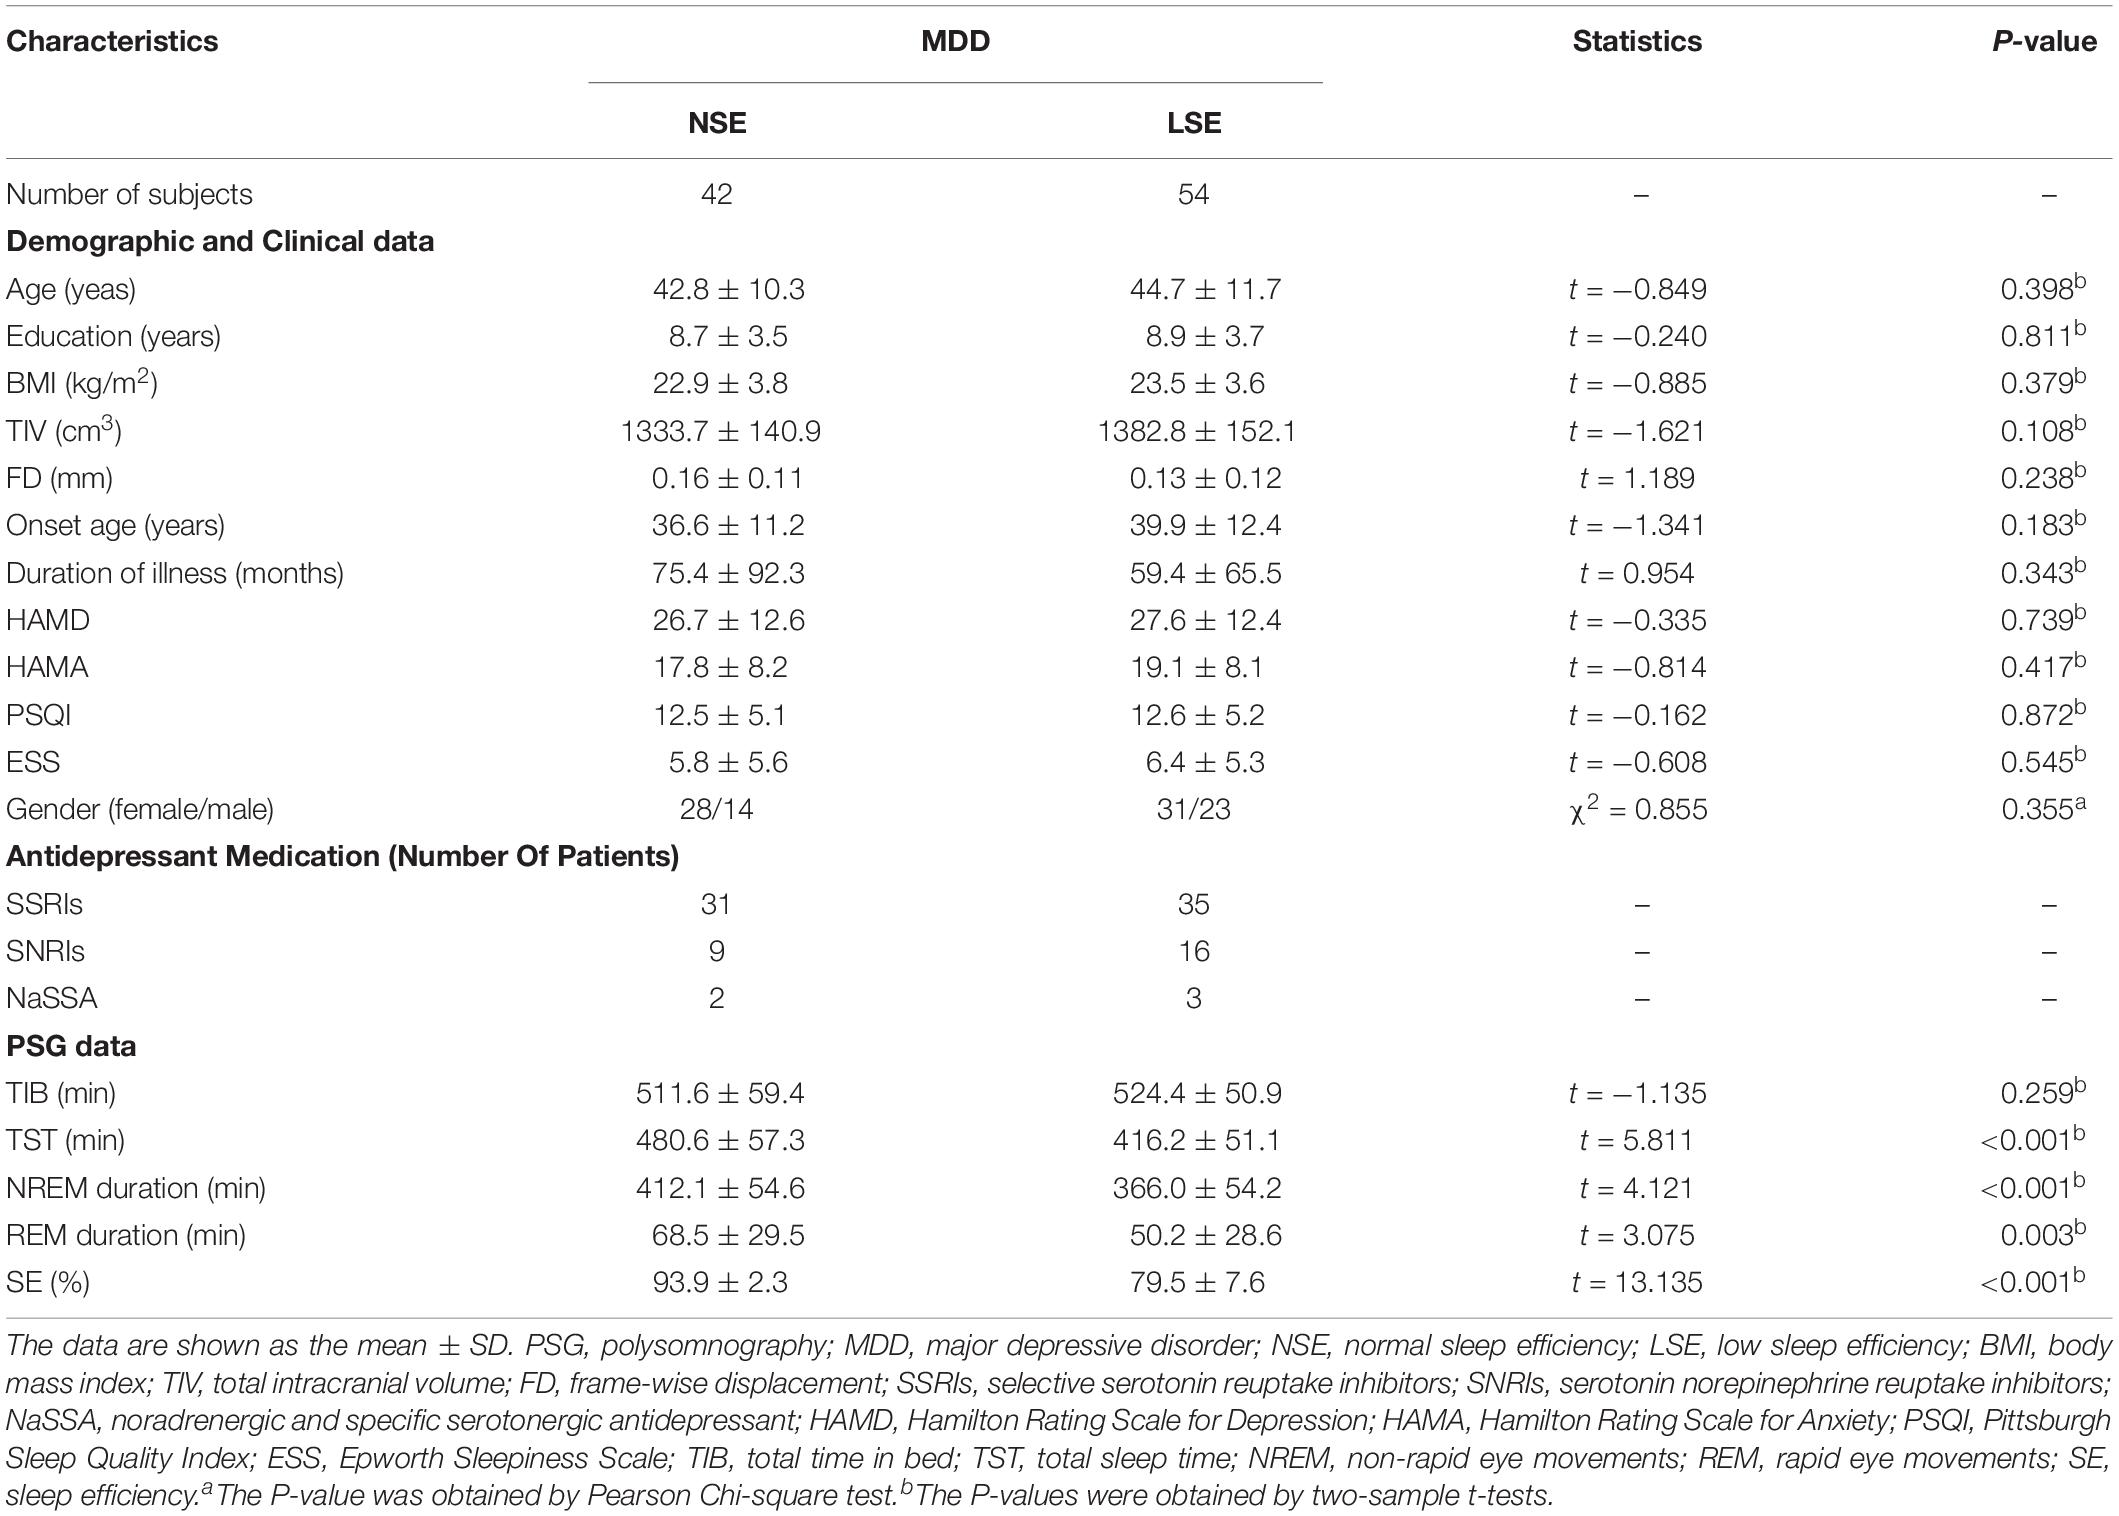
Table 1. Demographic, clinical, and PSG characteristics.
Intergroup Comparison in GMV
For the VBM analysis, we found that there was no significant difference in GMV between the NSE and LSE groups (P > 0.05, cluster-level FWE-corrected).
Intergroup Differences in Diffusion Parameters
Compared to the NSE group, the LSE group showed higher AD in the left superior corona radiata (SCR), left posterior corona radiata (PCR), left posterior limb of internal capsule (PLIC), and left retrolenticular part of internal capsule (RLIC) (P < 0.05, TFCE-FWE-corrected) (Figure 1). Further ROI-based analyses validated the TBSS comparison results (Figure 1); moreover, the significant inter-group differences in AD of the left SCR (F = 12.641, P = 0.001), left PCR (F = 8.261, P = 0.005), left PLIC (F = 14.974, P < 0.001), and left RLIC (F = 22.606, P < 0.001) were preserved after adjustment for the medication effect. However, there were no significant inter-group differences in other diffusion parameters including FA, RD, and MD (P > 0.05, TFCE-FWE-corrected).
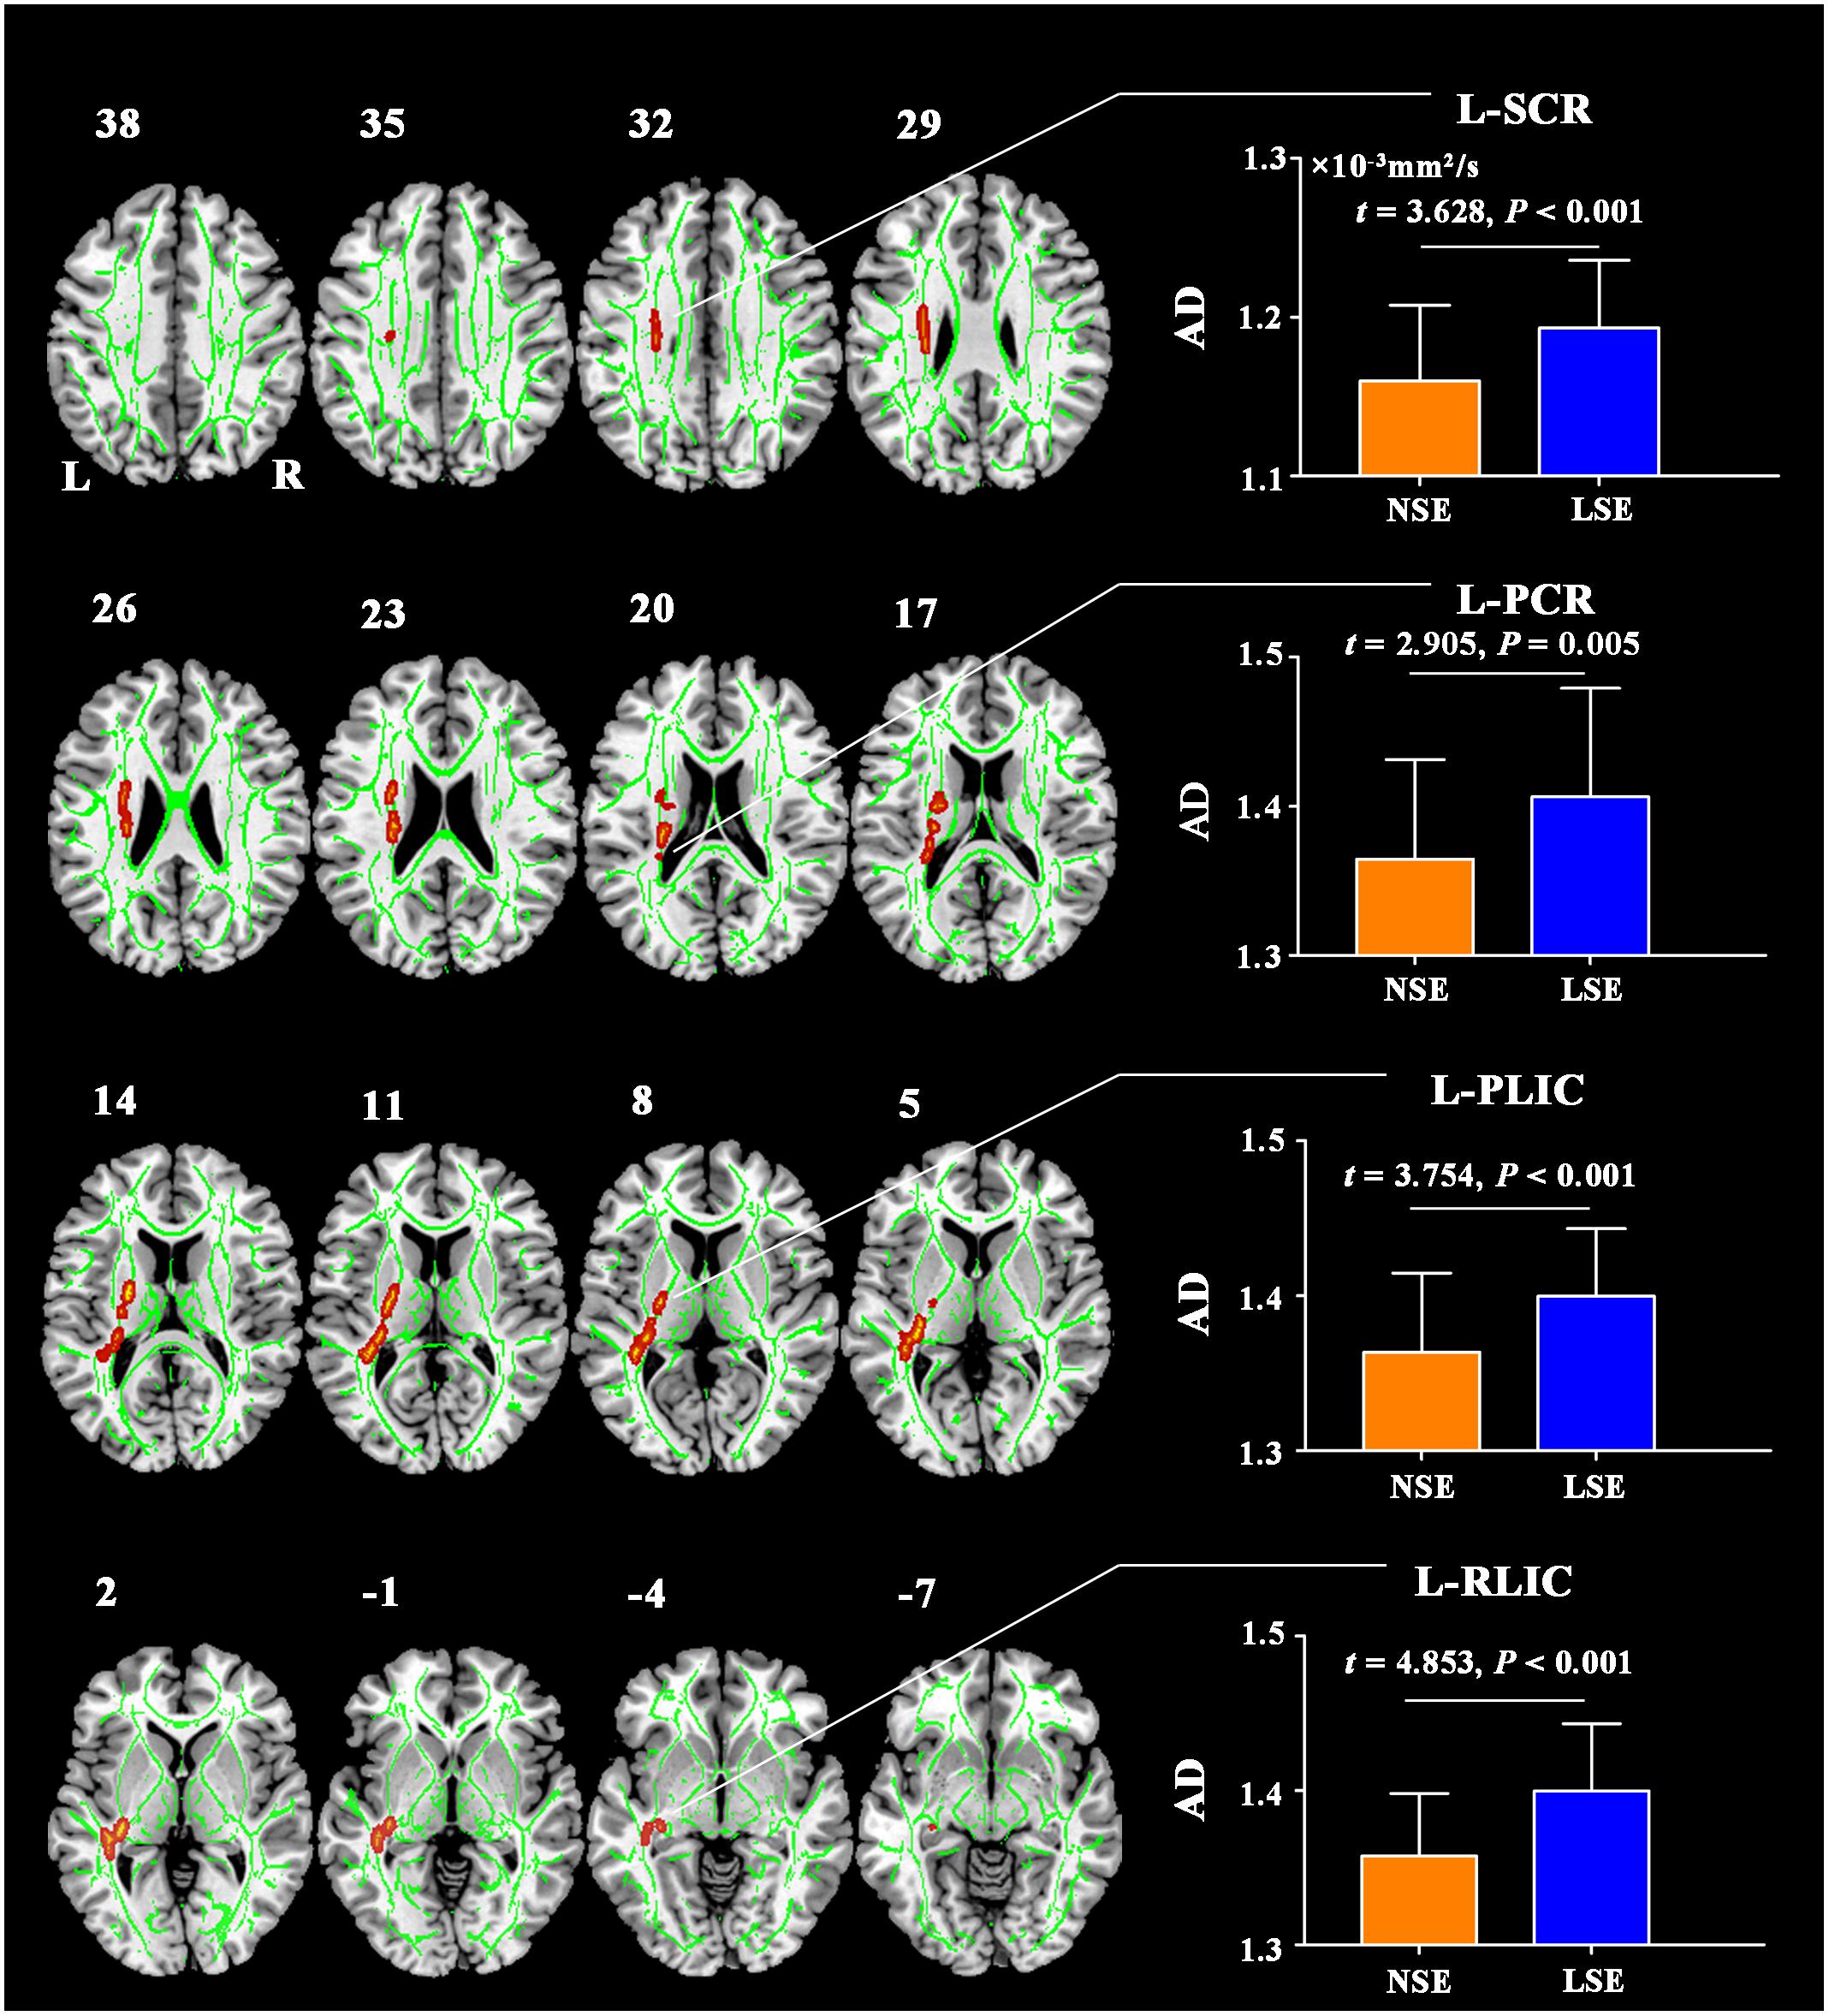
Figure 1. AD differences between the NSE and LSE groups. The numbers indicate the z-coordinates in the MNI space. Error bars indicate the standard deviation. AD, axial diffusivity; FA, fractional anisotropy; MNI, Montreal Neurological Institute; SCR, superior corona radiata; PCR, posterior corona radiata; PLIC, posterior limb of internal capsule; RLIC, retrolenticular part of internal capsule; NSE, normal sleep efficiency; LSE, low sleep efficiency; L, left; R, right.
Intergroup Differences in ReHo
Compared to the NSE group, the LSE group exhibited lower ReHo in the left lingual gyrus (cluster size = 152 voxels; peak MNI coordinates: x/y/z = −18/−60/−6; peak t = −4.2), right lingual gyrus (cluster size = 68 voxels; peak MNI coordinates: x/y/z = 21/−60/−9; peak t = −3.8) and right postcentral gyrus (cluster size = 179 voxels; peak MNI coordinates: x/y/z = 51/−18/51; peak t = −4.8) (P < 0.05, cluster-level FWE-corrected) (Figure 2). Further ROI-based analyses validated the voxel-based comparison results (Figure 2); moreover, the significant inter-group differences in ReHo of the left lingual gyrus (F = 16.727, P < 0.001), right lingual gyrus (F = 13.013, P = 0.001) and right postcentral gyrus (F = 20.558, P < 0.001) remained after controlling for the medication effect.
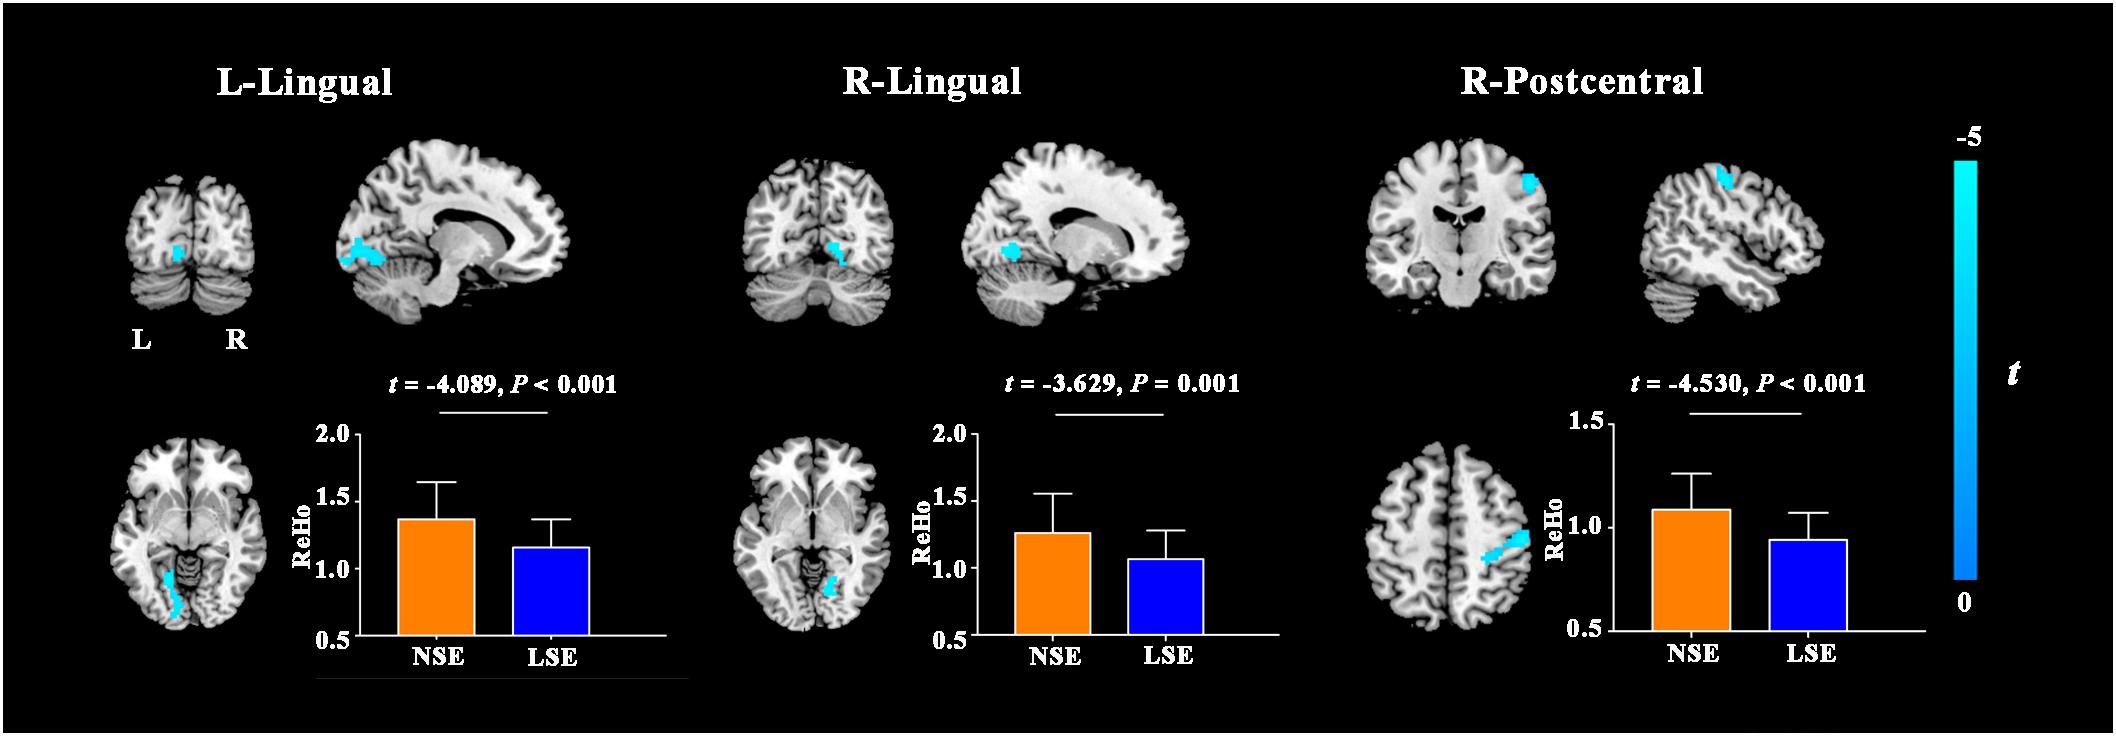
Figure 2. ReHo differences between the NSE and LSE groups. Error bars indicate the standard deviation. ReHo, regional homogeneity; NSE, normal sleep efficiency; LSE, low sleep efficiency; L, left; R, right.
Intergroup Differences in FCS
Compared with the NSE group, the LSE group presented with higher FCS in the left angular gyrus (cluster size = 101 voxels; peak MNI coordinates: x/y/z = −45/−69/33; peak t = 4.6) (P < 0.05, cluster-level FWE-corrected) (Figure 3). Further ROI-based analyses validated the voxel-based comparison results (Figure 3); moreover, the inter-group difference in FCS of the left angular gyrus was still significant after adjusting for the medication effect (F = 22.362, P < 0.001).
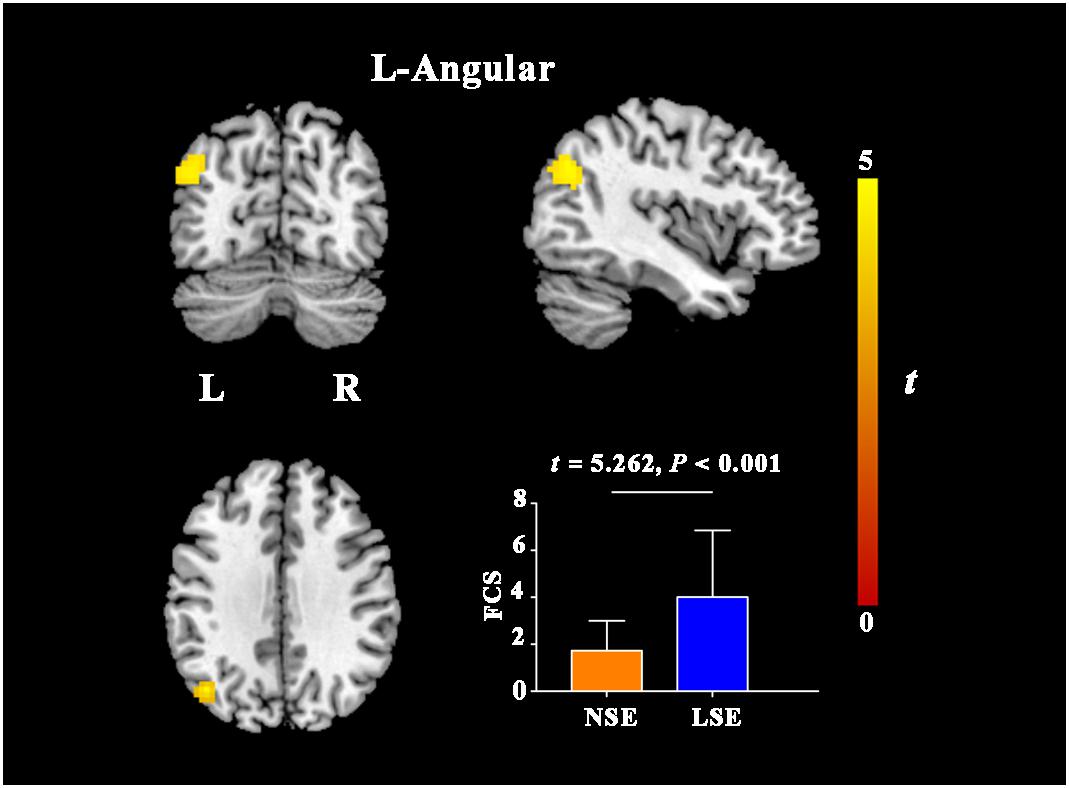
Figure 3. FCS differences between the NSE and LSE groups. Error bar indicates the standard deviation. FCS, functional connectivity strength; NSE, normal sleep efficiency; LSE, low sleep efficiency; L, left; R, right.
Correlations Between SE and Neuroimaging Parameters
We also validated the group comparison results by conducting correlation analyses between SE and ROI mean values. There were significantly negative correlations between SE and AD in the L-PLIC (r = −0.204, P = 0.046) and L-RLIC (r = −0.357, P < 0.001), and marginally negative correlations between SE and AD values in the L-SCR (r = −0.194, P = 0.059) and L-PCR (r = −0.180, P = 0.079) (Supplementary Figure S1). Additionally, there were significant positive correlations between SE and ReHo in the left lingual gyrus (r = 0.314, P = 0.002), right lingual gyrus (r = 0.319, P = 0.002) and right postcentral gyrus (r = 0.395, P < 0.001) (Supplementary Figure S2), as well as a significant negative correlation between SE and FCS in the left angular gyrus (r = −0.266, P = 0.009) (Supplementary Figure S3).
Discussion
By using PSG to objectively assess sleep quality and multimodal MRI techniques to comprehensively measure brain properties, we conducted the first exploratory analyses to investigate the neural substrates of low SE in MDD. Three major findings were recorded in our study. First, there was no significant difference in GMV between the NSE and LSE groups. Second, the LSE group exhibited increased AD in the left SCR, PCR, PLIC, and RLIC compared with the NSE group. Third, MDD patients with low SE showed decreased ReHo in the bilateral lingual gyri and right postcentral gyrus, and increased FCS in the left angular gyrus. These findings suggest that relative preservation of gray matter morphology, impaired white matter integrity, and decreased local synchronization degree yet increased FCS may represent the characteristic brain changes associated with low SE in MDD.
Our current observation that GMV did not differ between MDD patients with normal and low SE seems to be in contradiction with a previous study highlighting that smaller GMV in the OFC played a critical role in the neuropathology of the comorbidity of insomnia and depression (Yu et al., 2018). Difference in the sleep quality measurement is a highly likely source of the result inconsistency: in the Yu et al. study, insomnia in MDD was determined by HAMD sleep subscale score > 3; in our design, SE in the MDD patients was derived from the PSG. Other potential sources include differences in patient characteristics (e.g., MDD sample heterogeneity in medication), sMRI data processing approaches (VBM vs. FreeSurfer), and statistical analysis methods (direct inter-group comparison vs. two-factor analysis based on a general linear model) (Yu et al., 2018).
Compared to those with normal SE, MDD patients with low SE exhibited increased AD in the corona radiata (SCR and PCR) and internal capsule (PLIC and RLIC), implying that impaired axonal integrity (Song et al., 2002) in these white matter fibers may be specific to sleep disturbance in depression. The corona radiata is composed of ascending and descending fibers that relay information to and from the cerebral cortex, and is functionally implicated in emotional and executive processing (Karababa et al., 2015; Stave et al., 2017). The internal capsule is an important component of the thalamo-cortical circuits, and therefore plays a pivotal role in the processing of sensory and motor function, development of depressed mood or suicide, and even the regulation of daily cycles of sleep and wakefulness (Jia et al., 2010; Emos and Agarwal, 2019). In previous studies, impaired white matter integrity in the corona radiata and internal capsule has been demonstrated in both depressed patients and patients with primary insomnia (Li et al., 2016; Jiang et al., 2017). Combined, our current findings, coupled with the prior evidence, support the notion that white matter integrity impairments in the corona radiata and internal capsule may partly account for the disturbance in wake-sleep cycles in MDD patients.
The findings of reduced ReHo in the lingual and postcentral gyri in MDD patients with low SE suggest that decreased local synchronization degree in brain regions related to visual and somatosensory processing might be implicated in sleep disturbance in depression. In agreement with our reports, a resting-state fMRI study on MDD patients documented that decreased functional connectivity of the suprachiasmatic nuclei with the lingual gyrus and calcarine sulcus was linked to early wakening symptom (Tao et al., 2018). A prior PET study revealed that after sleep deprivation, depressed patients showed alterations in relative cerebral glucose metabolism in the visual areas and these metabolism alterations were associated with changes in depressive symptom severity (Wu et al., 2008). In addition, previous large sample brain imaging studies have consistently found structural (i.e., lower surface area; Schmaal et al., 2017) and functional (i.e., decreased neural activity and functional connectivity; Xia et al., 2019) deficits in the visual and somatosensory areas in MDD patients. On the basis of these findings, it is reasonable to assume that decreased local synchronization degree in the sensory system might cause visual and somatosensory processing dysfunctions, which in turn result in low SE in MDD. The underlying mechanism may be that impairment in sustained sensory processing of environmental stimuli may lead to a disruption of circadian rhythm and hamper the ability to initiate or maintain sleep.
In this study, we also found increased FCS in the angular gyrus [a core region of the default mode network (DMN)] in MDD patients with low SE, indicating the role of functional connectivity increase of the DMN in depression-associated sleep disturbance. Similarly, using ROI-to-ROI functional connectivity analyses, McKinnon and colleagues (McKinnon et al., 2018) showed that depression individuals with current sleep disturbance (PSQI > 5) had increased functional connectivity within the DMN relative to those without sleep disturbance (PSQI ≤ 5). The DMN is highly activated at rest but deactivated during goal-directed cognitive tasks, and thus is thought to be mainly engaged in internally directed cognitions such as emotional processing and self-referential activity (Buckner et al., 2008; Raichle, 2015). Moreover, there is evidence that the DMN also has prominent implications in sleep initiating and maintenance (Koenigs et al., 2010). In prior studies, depression and its related cognitive rumination have been attributed to increased DMN activity (Sheline et al., 2010; Zhang et al., 2011; Kuhn and Gallinat, 2013; Cheng et al., 2016). Of note, altered functional connectivity and regional neural activity in the DMN were also observed in patients with primary insomnia (Zhou et al., 2017; Yan et al., 2018). In normal subjects, there is a decrease in regional cerebral blood flow in the DMN regions during sleep (Maquet et al., 1996, 1997). However, a hyperarousal state (“over excitation of the nerves”) caused by acute stressors and cognitive rumination is considered a key component in all modern etiological models of insomnia disorder (Perlis et al., 1997; Buysse, 2013). Taken together with these previous findings, our data suggest that increased FCS of the DMN in MDD may be associated with the emergence of the hyperarousal state that in turn leads to the observed low SE in this disorder.
In our analyses, there were no significant differences in the PSQI and ESS between the NSE and LSE groups. There is evidence for a discrepancy between subjective and objective assessments of sleep in patients with MDD (Rezaie et al., 2018). Self-reported sleep rating can be affected by mood and memory biases (Weiss et al., 1973; Bliwise and Young, 2007). In patients with MDD, the perception of sleep is a function of depression severity, cognition, and actual sleep, rather than actual sleep alone (Tsuchiyama et al., 2003). Previous studies have demonstrated that depressed patients could not accurately estimate their sleep time and they are more likely to poorly recall aspects of sleep (Rotenberg et al., 2000). This may lead to some clinical reports of MDD patients complaining of poor sleep without any abnormal polysomnographic findings (Castro et al., 2013), which are in agreement with the current observation.
There are several limitations that should be acknowledged in this study. First, the sample size is fairly modest, which may limit the statistical power in detecting subtle brain alterations and uncovering potential depression-brain-sleep relationship. Furthermore, we cannot absolutely rule out the influence of antidepressant medication and illness duration on our results. However, the validation analyses showed that our results were not changed by medication and the NSE and LSE groups were well-matched in illness duration, which may alleviate concerns about these confounding factors. Future studies are warranted to test the reproducibility of our findings by using a larger sample of first-episode, medication-naive MDD patients. Second, we did not exclude some sleep disorders such as insomnia, obstructive sleep apnea and periodic leg movements in sleep, which may affect our interpretation. Future studies in MDD patients without any sleep disorders are required to validate our findings. Third, relative to hospitalized MDD patients, healthy subjects are more affected by the “first-night effect” of PSG, characterized by a disruption of sleep on the initial PSG recording compared to those from subsequent nights (Song et al., 2013). This may result in unreliable PSG variables in healthy subjects, so we did not include healthy controls in this study. In future studies, adding an adaptation night or alternative sleep measurement approaches such as actigraphy are potential methods for addressing the “first-night effect.” Finally, our cross-sectional design does not allow inference on causality. Longitudinal studies with intervention targeted toward improving SE in depression patients are needed to establish the direction of causality.
Conclusion
In conclusion, this study systematically investigated brain structural and functional substrates of low SE in MDD using a combination of PSG and multi-modal MRI. Our data indicate that MDD patients with low SE have relatively preserved gray matter morphology but impaired white matter integrity in the corona radiata and internal capsule relative to patients with normal SE. In addition, decreased local synchronization degree in the sensory system yet increased FCS in the default mode network are specific to low SE in MDD patients. These findings of disassociation between structural and functional alterations might provide insights into the neural mechanisms of sleep disturbance in depression.
Data Availability Statement
The datasets generated for this study are available on request to the corresponding author.
Ethics Statement
The studies involving human participants were reviewed and approved by the Ethics Committee of The First Affiliated Hospital of Anhui Medical University. The patients/participants provided their written informed consent to participate in this study.
Author Contributions
D-MZ, JZ, and YYu conceptualized and designed the study. YYa was responsible for conducting the analyses, preparing the first draft of the manuscript, and preparing the manuscript for submission. JZ was responsible for obtaining funding for the study, supervising the analyses, and editing drafts of the manuscript. WZ, YZ, CZ, and BZ were responsible for data collection and initial data preprocessing. All authors contributed to and approved the final manuscript.
Funding
The work was supported by the National Natural Science Foundation of China (Grant Nos. 81801679, 81571308, and 81771817), the Key Research and Development Projects of Anhui Province (Grant No. 1804h08020251), the Intercollegiate Key Projects of Nature Science of Anhui Province (Grant No. KJ2018A0197), and the Anhui Natural Science Foundation (Grant No. 201904a07020060).
Conflict of Interest
The authors declare that the research was conducted in the absence of any commercial or financial relationships that could be construed as a potential conflict of interest.
Supplementary Material
The Supplementary Material for this article can be found online at: https://www.frontiersin.org/articles/10.3389/fnins.2020.00050/full#supplementary-material
Footnotes
- ^ http://dbm.neuro.uni-jena.de/vbm.html
- ^ http://www.fil.ion.ucl.ac.uk/spm
- ^ www.fmrib.ox.ac.uk/fsl
- ^ http://rfmri.org/dpabi
References
Agarwal, N., Port, J. D., Bazzocchi, M., and Renshaw, P. F. (2010). Update on the use of MR for assessment and diagnosis of psychiatric diseases. Radiology 255, 23–41. doi: 10.1148/radiol.09090339
Akerstedt, T., Hume, K., Minors, D., and Waterhouse, J. (1994). The meaning of good sleep: a longitudinal study of polysomnography and subjective sleep quality. J. Sleep Res. 3, 152–158. doi: 10.1111/j.1365-2869.1994.tb00122.x
American Psychiatric Association (2013). Diagnostic and Statistical Manual of Mental Disorders, (DSM-5), 5th Edn. Washington, DC: American Psychiatric Association.
Ashburner, J., and Friston, K. J. (2000). Voxel-based morphometry–the methods. Neuroimage 11(6 Pt 1), 805–821. doi: 10.1006/nimg.2000.0582
Berry, R. B., Budhiraja, R., Gottlieb, D. J., Gozal, D., Iber, C., Kapur, V. K., et al. (2012). Rules for scoring respiratory events in sleep: update of the 2007 AASM manual for the scoring of sleep and associated events. Deliberations of the sleep apnea definitions task force of the American academy of sleep medicine. J. Clin. Sleep Med. 8, 597–619. doi: 10.5664/jcsm.2172
Bliwise, D. L., and Young, T. B. (2007). The parable of parabola: what the U-shaped curve can and cannot tell us about sleep. Sleep 30, 1614–1615. doi: 10.1093/sleep/30.12.1614
Brakowski, J., Spinelli, S., Dorig, N., Bosch, O. G., Manoliu, A., Holtforth, M. G., et al. (2017). Resting state brain network function in major depression - depression symptomatology, antidepressant treatment effects, future research. J. Psychiatr. Res. 92, 147–159. doi: 10.1016/j.jpsychires.2017.04.007
Buckner, R. L., Andrews-Hanna, J. R., and Schacter, D. L. (2008). The brain’s default network: anatomy, function, and relevance to disease. Ann. N. Y. Acad. Sci. 1124, 1–38. doi: 10.1196/annals.1440.011
Carrier, J., Land, S., Buysse, D. J., Kupfer, D. J., and Monk, T. H. (2001). The effects of age and gender on sleep EEG power spectral density in the middle years of life (ages 20-60 years old). Psychophysiology 38, 232–242. doi: 10.1111/1469-8986.3820232
Castro, L. S., Castro, J., Hoexter, M. Q., Quarantini, L. C., Kauati, A., Mello, L. E., et al. (2013). Depressive symptoms and sleep: a population-based polysomnographic study. Psychiatry Res. 210, 906–912. doi: 10.1016/j.psychres.2013.08.036
Cheng, W., Rolls, E. T., Qiu, J., Liu, W., Tang, Y., Huang, C. C., et al. (2016). Medial reward and lateral non-reward orbitofrontal cortex circuits change in opposite directions in depression. Brain 139(Pt 12), 3296–3309. doi: 10.1093/brain/aww255
Dusi, N., Barlati, S., Vita, A., and Brambilla, P. (2015). Brain structural effects of antidepressant treatment in major depression. Curr. Neuropharmacol. 13, 458–465. doi: 10.2174/1570159x1304150831121909
Emos, M. C., and Agarwal, S. (2019). Neuroanatomy, internal(capsule). Jacksonville: StatPearls Publishing, Treasure Island (FL).
Frankish, H., Boyce, N., and Horton, R. (2018). Mental health for all: a global goal. Lancet 392, 1493–1494. doi: 10.1016/s0140-6736(18)32271-2
Gaudreau, H., Carrier, J., and Montplaisir, J. (2001). Age-related modifications of NREM sleep EEG: from childhood to middle age. J. Sleep Res. 10, 165–172. doi: 10.1046/j.1365-2869.2001.00252.x
Germain, A., Nofzinger, E. A., Kupfer, D. J., and Buysse, D. J. (2004). Neurobiology of non-REM sleep in depression: further evidence for hypofrontality and thalamic dysregulation. Am. J. Psychiatry 161, 1856–1863. doi: 10.1176/ajp.161.10.1856
Hamilton, M. (1967). Development of a rating scale for primary depressive illness. Br. J. Soc. Clin. Psychol. 6, 278–296. doi: 10.1111/j.2044-8260.1967.tb00530.x
Hasler, B. P., and Troxel, W. M. (2010). Couples’ nighttime sleep efficiency and concordance: evidence for bidirectional associations with daytime relationship functioning. Psychosom. Med. 72, 794–801. doi: 10.1097/PSY.0b013e3181ecd08a
Jia, Z., Huang, X., Wu, Q., Zhang, T., Lui, S., Zhang, J., et al. (2010). High-field magnetic resonance imaging of suicidality in patients with major depressive disorder. Am. J. Psychiatry 167, 1381–1390. doi: 10.1176/appi.ajp.2010.09101513
Jiang, J., Zhao, Y. J., Hu, X. Y., Du, M. Y., Chen, Z. Q., Wu, M., et al. (2017). Microstructural brain abnormalities in medication-free patients with major depressive disorder: a systematic review and meta-analysis of diffusion tensor imaging. J. Psychiatry Neurosci. 42, 150–163. doi: 10.1503/jpn.150341
Jung, D. W., Lee, Y. J., Jeong, D. U., and Park, K. S. (2017). New predictors of sleep efficiency. Chronobiol. Int. 34, 93–104. doi: 10.1080/07420528.2016.1241802
Karababa, I. F., Bayazit, H., Kilicaslan, N., Celik, M., Cece, H., Karakas, E., et al. (2015). Microstructural changes of anterior corona radiata in bipolar depression. Psychiatry Investig. 12, 367–371. doi: 10.4306/pi.2015.12.3.367
Koenigs, M., Holliday, J., Solomon, J., and Grafman, J. (2010). Left dorsomedial frontal brain damage is associated with insomnia. J. Neurosci. 30, 16041–16043. doi: 10.1523/JNEUROSCI.3745-10.2010
Kuhn, S., and Gallinat, J. (2013). Resting-state brain activity in schizophrenia and major depression: a quantitative meta-analysis. Schizophr. Bull. 39, 358–365. doi: 10.1093/schbul/sbr151
Lacruz, M. E., Schmidt-Pokrzywniak, A., Dragano, N., Moebus, S., Deutrich, S. E., Mohlenkamp, S., et al. (2016). Depressive symptoms, life satisfaction and prevalence of sleep disturbances in the general population of Germany: results from the Heinz Nixdorf Recall study. BMJ Open 6:e007919. doi: 10.1136/bmjopen-2015-007919
Li, S., Tian, J., Bauer, A., Huang, R., Wen, H., Li, M., et al. (2016). Reduced integrity of right lateralized white matter in patients with primary insomnia: a diffusion-tensor imaging study. Radiology 280, 520–528. doi: 10.1148/radiol.2016152038
Liu, C. H., Guo, J., Lu, S. L., Tang, L. R., Fan, J., Wang, C. Y., et al. (2018). Increased salience network activity in patients with insomnia complaints in major depressive disorder. Front. Psychiatry 9:93. doi: 10.3389/fpsyt.2018.00093
Liu, F., Hu, M., Wang, S., Guo, W., Zhao, J., Li, J., et al. (2012). Abnormal regional spontaneous neural activity in first-episode, treatment-naive patients with late-life depression: a resting-state fMRI study. Prog. Neuropsychopharmacol. Biol. Psychiatry 39, 326–331. doi: 10.1016/j.pnpbp.2012.07.004
Liu, F., Zhu, C., Wang, Y., Guo, W., Li, M., Wang, W., et al. (2015). Disrupted cortical hubs in functional brain networks in social anxiety disorder. Clin. Neurophysiol. 126, 1711–1716. doi: 10.1016/j.clinph.2014.11.014
Lui, S., Zhou, X. J., Sweeney, J. A., and Gong, Q. (2016). Psychoradiology: the frontier of neuroimaging in psychiatry. Radiology 281, 357–372. doi: 10.1148/radiol.2016152149
Maquet, P., Degueldre, C., Delfiore, G., Aerts, J., Peters, J. M., Luxen, A., et al. (1997). Functional neuroanatomy of human slow wave sleep. J. Neurosci. 17, 2807–2812. doi: 10.1523/jneurosci.17-08-02807.1997
Maquet, P., Peters, J., Aerts, J., Delfiore, G., Degueldre, C., Luxen, A., et al. (1996). Functional neuroanatomy of human rapid-eye-movement sleep and dreaming. Nature 383, 163–166. doi: 10.1038/383163a0
McKinnon, A. C., Hickie, I. B., Scott, J., Duffy, S. L., Norrie, L., Terpening, Z., et al. (2018). Current sleep disturbance in older people with a lifetime history of depression is associated with increased connectivity in the Default Mode Network. J. Affect. Disord. 229, 85–94. doi: 10.1016/j.jad.2017.12.052
Nofzinger, E. A., Buysse, D. J., Germain, A., Carter, C., Luna, B., Price, J. C., et al. (2004). Increased activation of anterior paralimbic and executive cortex from waking to rapid eye movement sleep in depression. Arch. Gen. Psychiatry 61, 695–702.
Nofzinger, E. A., Buysse, D. J., Germain, A., Price, J. C., Meltzer, C. C., Miewald, J. M., et al. (2005). Alterations in regional cerebral glucose metabolism across waking and non-rapid eye movement sleep in depression. Arch. Gen. Psychiatry 62, 387–396.
Ohayon, M. M., Carskadon, M. A., Guilleminault, C., and Vitiello, M. V. (2004). Meta-analysis of quantitative sleep parameters from childhood to old age in healthy individuals: developing normative sleep values across the human lifespan. Sleep 27, 1255–1273. doi: 10.1093/sleep/27.7.1255
Patel, S. R., Malhotra, A., Gottlieb, D. J., White, D. P., and Hu, F. B. (2006). Correlates of long sleep duration. Sleep 29, 881–889. doi: 10.1093/sleep/29.7.881
Perlis, M. L., Giles, D. E., Mendelson, W. B., Bootzin, R. R., and Wyatt, J. K. (1997). Psychophysiological insomnia: the behavioural model and a neurocognitive perspective. J. Sleep Res. 6, 179–188. doi: 10.1046/j.1365-2869.1997.00045.x
Raichle, M. E. (2015). The brain’s default mode network. Annu. Rev. Neurosci. 38, 433–447. doi: 10.1146/annurev-neuro-071013-014030
Rezaie, L., Fobian, A. D., McCall, W. V., and Khazaie, H. (2018). Paradoxical insomnia and subjective-objective sleep discrepancy: a review. Sleep Med. Rev. 40, 196–202. doi: 10.1016/j.smrv.2018.01.002
Riemann, D., Krone, L. B., Wulff, K., and Nissen, C. (2019). Sleep, insomnia, and depression. Neuropsychopharmacology 45, 74–89.
Rotenberg, V. S., Indursky, P., Kayumov, L., Sirota, P., and Melamed, Y. (2000). The relationship between subjective sleep estimation and objective sleep variables in depressed patients. Int. J. Psychophysiol. 37, 291–297. doi: 10.1016/s0167-8760(00)00110-0
Schmaal, L., Hibar, D. P., Samann, P. G., Hall, G. B., Baune, B. T., Jahanshad, N., et al. (2017). Cortical abnormalities in adults and adolescents with major depression based on brain scans from 20 cohorts worldwide in the ENIGMA major depressive disorder working group. Mol. Psychiatry 22, 900–909. doi: 10.1038/mp.2016.60
Sheline, Y. I., Price, J. L., Yan, Z., and Mintun, M. A. (2010). Resting-state functional MRI in depression unmasks increased connectivity between networks via the dorsal nexus. Proc. Natl. Acad. Sci. U.S.A. 107, 11020–11025. doi: 10.1073/pnas.1000446107
Smith, S. M., Jenkinson, M., Johansen-Berg, H., Rueckert, D., Nichols, T. E., Mackay, C. E., et al. (2006). Tract-based spatial statistics: voxelwise analysis of multi-subject diffusion data. Neuroimage 31, 1487–1505. doi: 10.1016/j.neuroimage.2006.02.024
Song, S., Geng, Z., Zhai, S., Xu, J., Hou, G., and Zhang, X. (2013). Changes of sleep adaptation in hospitalized patients with depression. Cell Biochem. Biophys. 66, 347–350. doi: 10.1007/s12013-012-9454-y
Song, S. K., Sun, S. W., Ramsbottom, M. J., Chang, C., Russell, J., and Cross, A. H. (2002). Dysmyelination revealed through MRI as increased radial (but unchanged axial) diffusion of water. Neuroimage 17, 1429–1436. doi: 10.1006/nimg.2002.1267
Stave, E. A., De Bellis, M. D., Hooper, S. R., Woolley, D. P., Chang, S. K., and Chen, S. D. (2017). Dimensions of attention associated with the microstructure of corona radiata white matter. J. Child Neurol. 32, 458–466. doi: 10.1177/0883073816685652
Tao, S., Chattun, M. R., Yan, R., Geng, J., Zhu, R., Shao, J., et al. (2018). TPH-2 gene polymorphism in major depressive disorder patients with early-wakening symptom. Front. Neurosci. 12:827. doi: 10.3389/fnins.2018.00827
Thompson, E. (2015). Hamilton rating scale for anxiety (HAM-A). Occup. Med. 65:601. doi: 10.1093/occmed/kqv054
Tomasi, D., and Volkow, N. D. (2010). Functional connectivity density mapping. Proc. Natl. Acad. Sci. U.S.A. 107, 9885–9890. doi: 10.1073/pnas.1001414107
Tsuchiyama, K., Nagayama, H., Kudo, K., Kojima, K., and Yamada, K. (2003). Discrepancy between subjective and objective sleep in patients with depression. Psychiatry Clin. Neurosci. 57, 259–264. doi: 10.1046/j.1440-1819.2003.01114.x
Tsuno, N., Besset, A., and Ritchie, K. (2005). Sleep and depression. J. Clin. Psychiatry 66, 1254–1269.
Weiss, B. L., McPartland, R. J., and Kupfer, D. J. (1973). Once more: the inaccuracy of non-EEG estimations of sleep. Am. J. Psychiatry 130, 1282–1285. doi: 10.1176/ajp.130.11.1282
Wu, J. C., Gillin, J. C., Buchsbaum, M. S., Schachat, C., Darnall, L. A., Keator, D. B., et al. (2008). Sleep deprivation PET correlations of Hamilton symptom improvement ratings with changes in relative glucose metabolism in patients with depression. J. Affect. Disord. 107, 181–186. doi: 10.1016/j.jad.2007.07.030
Xia, M., Si, T., Sun, X., Ma, Q., Liu, B., Wang, L., et al. (2019). Reproducibility of functional brain alterations in major depressive disorder: evidence from a multisite resting-state functional MRI study with 1,434 individuals. Neuroimage 189, 700–714. doi: 10.1016/j.neuroimage.2019.01.074
Yan, C. G., Wang, X. D., Zuo, X. N., and Zang, Y. F. (2016). DPABI: data processing & analysis for (resting-state) brain imaging. Neuroinformatics 14, 339–351. doi: 10.1007/s12021-016-9299-4
Yan, C. Q., Wang, X., Huo, J. W., Zhou, P., Li, J. L., Wang, Z. Y., et al. (2018). Abnormal global brain functional connectivity in primary insomnia patients: a resting-state functional MRI study. Front. Neurol. 9:856. doi: 10.3389/fneur.2018.00856
Yu, S., Shen, Z., Lai, R., Feng, F., Guo, B., Wang, Z., et al. (2018). The orbitofrontal cortex gray matter is associated with the interaction between insomnia and depression. Front. Psychiatry 9:651. doi: 10.3389/fpsyt.2018.00651
Zang, Y., Jiang, T., Lu, Y., He, Y., and Tian, L. (2004). Regional homogeneity approach to fMRI data analysis. Neuroimage 22, 394–400. doi: 10.1016/j.neuroimage.2003.12.030
Zhang, J., Wang, J., Wu, Q., Kuang, W., Huang, X., He, Y., et al. (2011). Disrupted brain connectivity networks in drug-naive, first-episode major depressive disorder. Biol. Psychiatry 70, 334–342. doi: 10.1016/j.biopsych.2011.05.018
Zhou, F., Huang, S., Zhuang, Y., Gao, L., and Gong, H. (2017). Frequency-dependent changes in local intrinsic oscillations in chronic primary insomnia: a study of the amplitude of low-frequency fluctuations in the resting state. Neuroimage Clin. 15, 458–465. doi: 10.1016/j.nicl.2016.05.011
Zhu, J., Zhuo, C., Xu, L., Liu, F., Qin, W., and Yu, C. (2017). Altered coupling between resting-state cerebral blood flow and functional connectivity in schizophrenia. Schizophr. Bull. 43, 1363–1374. doi: 10.1093/schbul/sbx051
Keywords: brain, major depressive disorder, magnetic resonance imaging, polysomnography, sleep efficiency
Citation: Yang Y, Zhu D-m, Zhang C, Zhang Y, Wang C, Zhang B, Zhao W, Zhu J and Yu Y (2020) Brain Structural and Functional Alterations Specific to Low Sleep Efficiency in Major Depressive Disorder. Front. Neurosci. 14:50. doi: 10.3389/fnins.2020.00050
Received: 30 October 2019; Accepted: 13 January 2020;
Published: 31 January 2020.
Edited by:
Ritchie Edward Brown, VA Boston Healthcare System, United StatesReviewed by:
Kate Sprecher, University of Wisconsin-Madison, United StatesChanghong Li, Jülich Research Centre, Germany
Copyright © 2020 Yang, Zhu, Zhang, Zhang, Wang, Zhang, Zhao, Zhu and Yu. This is an open-access article distributed under the terms of the Creative Commons Attribution License (CC BY). The use, distribution or reproduction in other forums is permitted, provided the original author(s) and the copyright owner(s) are credited and that the original publication in this journal is cited, in accordance with accepted academic practice. No use, distribution or reproduction is permitted which does not comply with these terms.
*Correspondence: Jiajia Zhu, emh1amlhamlhZ3JhZHVhdGVAMTYzLmNvbQ==; Yongqiang Yu, Y2pyLnl1eW9uZ3FpYW5nQHZpcC4xNjMuY29t
†These authors have contributed equally to this work