 Frank Klefenz1*
 Tamas Harczos1,2,3
- 1Fraunhofer Institute for Digital Media Technology IDMT, Ilmenau, Germany
- 2Auditory Neuroscience and Optogenetics Laboratory, German Primate Center, Göttingen, Germany
- 3audifon GmbH & Co. KG, Kölleda, Germany
This study presents a computational model to reproduce the biological dynamics of “listening to music.” A biologically plausible model of periodicity pitch detection is proposed and simulated. Periodicity pitch is computed across a range of the auditory spectrum. Periodicity pitch is detected from subsets of activated auditory nerve fibers (ANFs). These activate connected model octopus cells, which trigger model neurons detecting onsets and offsets; thence model interval-tuned neurons are innervated at the right interval times; and finally, a set of common interval-detecting neurons indicate pitch. Octopus cells rhythmically spike with the pitch periodicity of the sound. Batteries of interval-tuned neurons stopwatch-like measure the inter-spike intervals of the octopus cells by coding interval durations as first spike latencies (FSLs). The FSL-triggered spikes synchronously coincide through a monolayer spiking neural network at the corresponding receiver pitch neurons.
Introduction
Pitches span a scale from lowest to highest pitch. The frequencies of the pitches are determined by adjusting them to an absolute reference pitch (e.g., the concert pitch A4 = 440 Hz) and the chosen temperament. Very seldom the reciprocal interval duration time is annotated for a given frequency. By doing this, it becomes clear that the 25 notes in the mostly played range from C4 to C6 populate an interval time range of about 3 ms only. Periodicity pitch detectors need as prerequisite precise stopwatch-like timers (Buonomano, 2017; Buzsáki and Llinás, 2017; derNederlanden et al., 2018). Our self-developed ANF spike from audio generation program SAM is used as audio front end (Harczos et al., 2013a). We recently extended SAM by model octopus cells innervated by ANFs (Harczos and Klefenz, 2018). These models are shortly summarized for better comprehensibility in see section “Materials and Methods.” Batteries of interval-tuned neurons (ITNs) stopwatch-like measure the inter-spike intervals (ISIs) of assigned octopus cells. An ITN responds to a range of interval durations of a rhythmically spiking octopus cell by coding interval durations as first spike latencies (FSLs) (Aubie et al., 2009, 2012). We model interval-tuned microcircuits by adapting Aubie’s model to be ready for use in the microsecond operating range (Aubie et al., 2012). Aubie’s model is formulated in NEURON with excitatory NMDARs/AMPARs and GABAergic inhibition (Kirst et al., 2017). The parameter search space of the modified model is pruned by various simulation runs led by optimality criteria. ITNs are star-wise connected to short-term pitch neurons in a monolayer spiking neural network (SNN), which processes synchronously arriving spikes from the ITNs.
Materials and Methods
We like to show a bio-plausible way of F0 estimation as a possible starting point for novel research. As a prerequisite, auditory models of pitch perception have been created, implemented, and discussed (Patterson et al., 2002; Laudanski et al., 2014; Langner, 2015; Stolzenburg, 2015; Ahmad et al., 2016; Joris, 2016; McLachlan, 2016; Barzelay et al., 2017; Friedrichs et al., 2017; Saeedi et al., 2017; Tang et al., 2017; Todd et al., 2017; Harczos and Klefenz, 2018; Oxenham, 2018; Peng et al., 2018).
Neuro-physiologically parameterized auditory models mimic the dynamics of the basilar membrane, the mechano-electrical coupling of inner hair cells to it, and the membrane voltage regulated vesicle rate kinetics into the synaptic cleft between them and the associated auditory nerve fibers (Baumgarte, 1997; Sumner et al., 2002; Yu et al., 2009; Meaud and Grosh, 2012; Harczos et al., 2013a; Zilany et al., 2014; Cerezuela-Escudero et al., 2015; Lee et al., 2015; Ó’Maoiléidigh and Hudspeth, 2015; Saremi et al., 2016; Rudnicki and Hemmert, 2017; Manis and Campagnola, 2018; Saremi and Lyon, 2018; Xu et al., 2018; Liu et al., 2019).
Stimulation based on auditory modeling (SAM) – developed at Fraunhofer IDMT as a cochlear implant sound-processing strategy – converts sounds to parallel spike trains along the auditory nerve fibers (ANFs) (Harczos et al., 2013b; Harczos, 2015). With SAM’s auditory model, cochleagrams with characteristic repetitive latency-phase trajectories can be generated as shown in Figure 1.
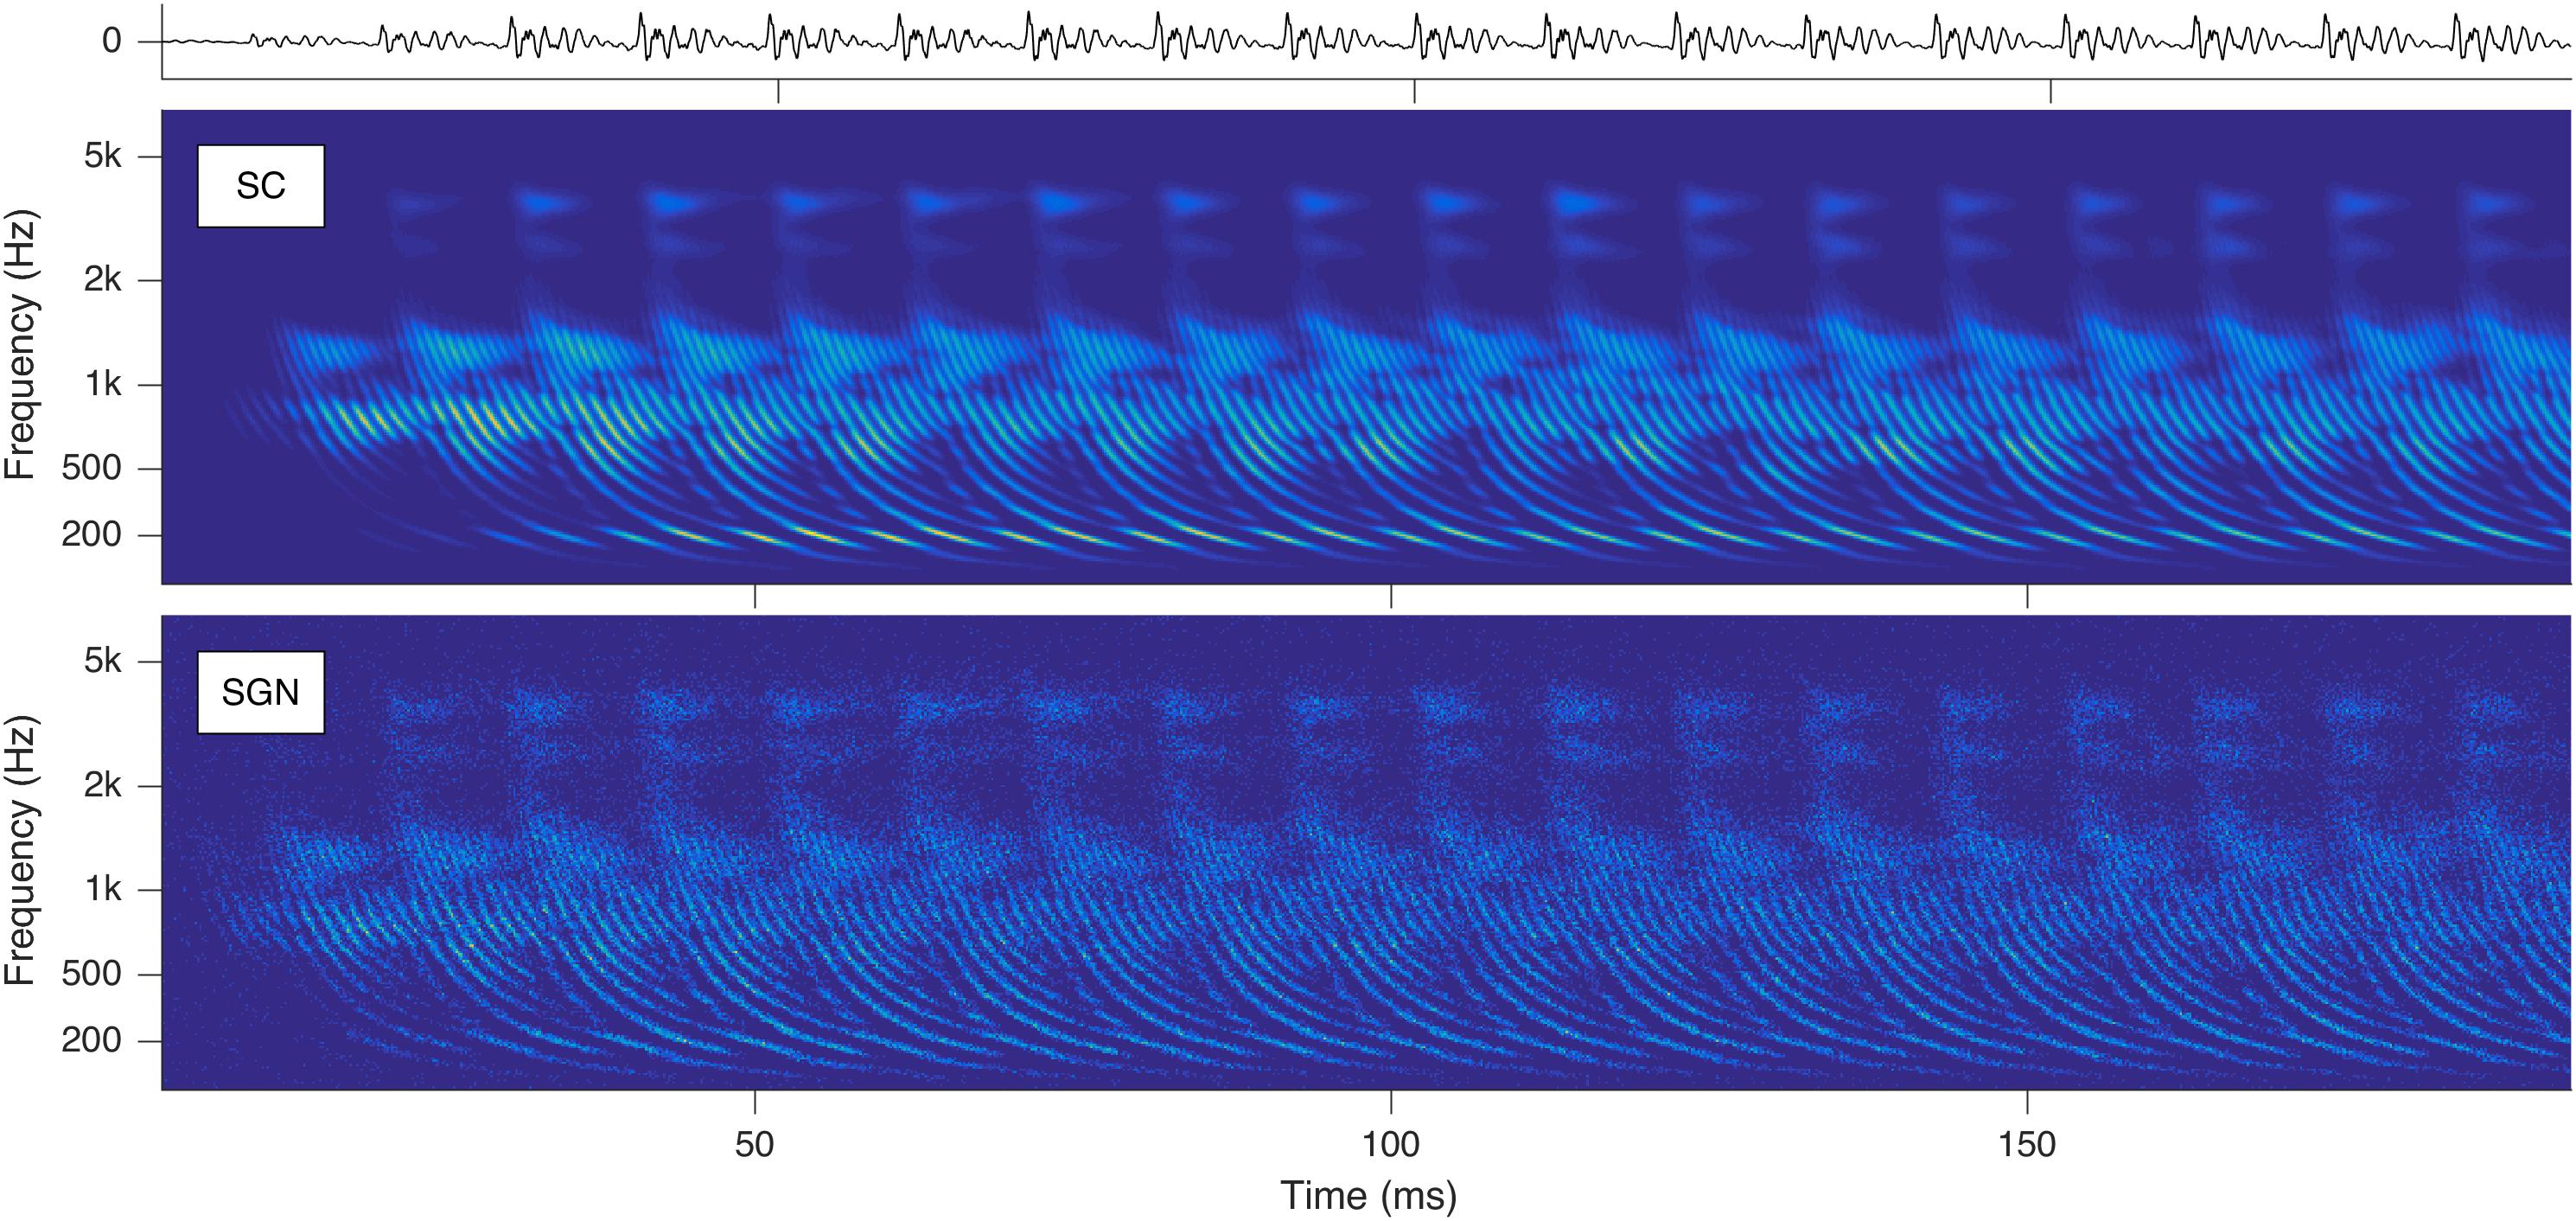
Figure 1. Cochleagrams with quasi-stationary repetitive patterns for a short snippet of the vowel a: sung by a male singer at the note of G2. Top: Sound signal waveform. Middle: Probability (ascending from blue over green to yellow) of neurotransmitter substance release into the synaptic cleft (SC) as a function of time and place within the cochlea. Bottom: Action potentials of the spiral ganglion neurons (SGN). Note that the ordinate shows the characteristic frequency of the basilar membrane model at the corresponding cochlear position (Reprint from Harczos and Klefenz, 2018).
Stimulation based on auditory modeling has been extended step by step by further modules of the auditory periphery. Octopus cells are topologically arranged in frequency-ordered laminae and locally wired to bundles of ANFs. The wiring patterns’ scheme constitutes their temporal receptive fields (TRFs) (Oertel et al., 2017; Spencer et al., 2018). Octopus cells latency-phase rectify space–time trajectories in their TRFs (Golding and Oertel, 2012; McGinley et al., 2012). Octopus cells rhythmically spike with the pitch periodicity of the sound because they decode repetitively occurring latency-phase trajectories (Harczos and Klefenz, 2018).
The processing chain employed in this paper can be summarized as shown in Figure 2. A random (uniformly distributed) offset is selected for the specified input sound file. Starting from there, a 250-ms-long snippet is cropped from the file. Then, the sound snippet’s amplitude is normalized to yield around 65 dB SPL in the subsequent auditory model. Next, a 50-ms-long linear fade-in is applied to the snippet, which is then fed to the auditory model introduced above. The output of the auditory encoder, a spectro-temporal representation of sound, is reduced to a pitch-relevant (Fmin = 75 Hz and Fmax = 1500 Hz in the current implementation) 11 Bark frequency range, each of which we address as one of 11 auditory image (AI) patches, the RMS energy of which are stored to be used later as weights for the final F0 estimate. The 11 AI patches are analyzed by an ensemble of dedicated octopus cells. Each octopus cell is tuned for a specific local hyperbolic shape section and is, therefore, part of the distributed Hough-transform execution. This step results in 11 Hough-space (HS) patches, which, based on the maximal variance across the time axes, get reduced to narrower sub-patches. Corresponding to Aubie’s model (as mentioned above and explained in more detail in see section “Interval-Tuned Microcircuits”), we introduce a stochastic processing in the form of Poisson-type jitter added to the timing of the sub-patches. Subsequently, we look for periods using autocorrelation-based interval estimation to yield 11 interval duration estimates, one for each sub-patch. In the present study, the above process is repeated 100 times using 100 different processing offsets within the same input sound file. The aggregated 100 × 11 interval duration estimates along with the 100 × 11 weights (based on the AI patches) are used in the final step to calculate the F0 estimate for the sound file.
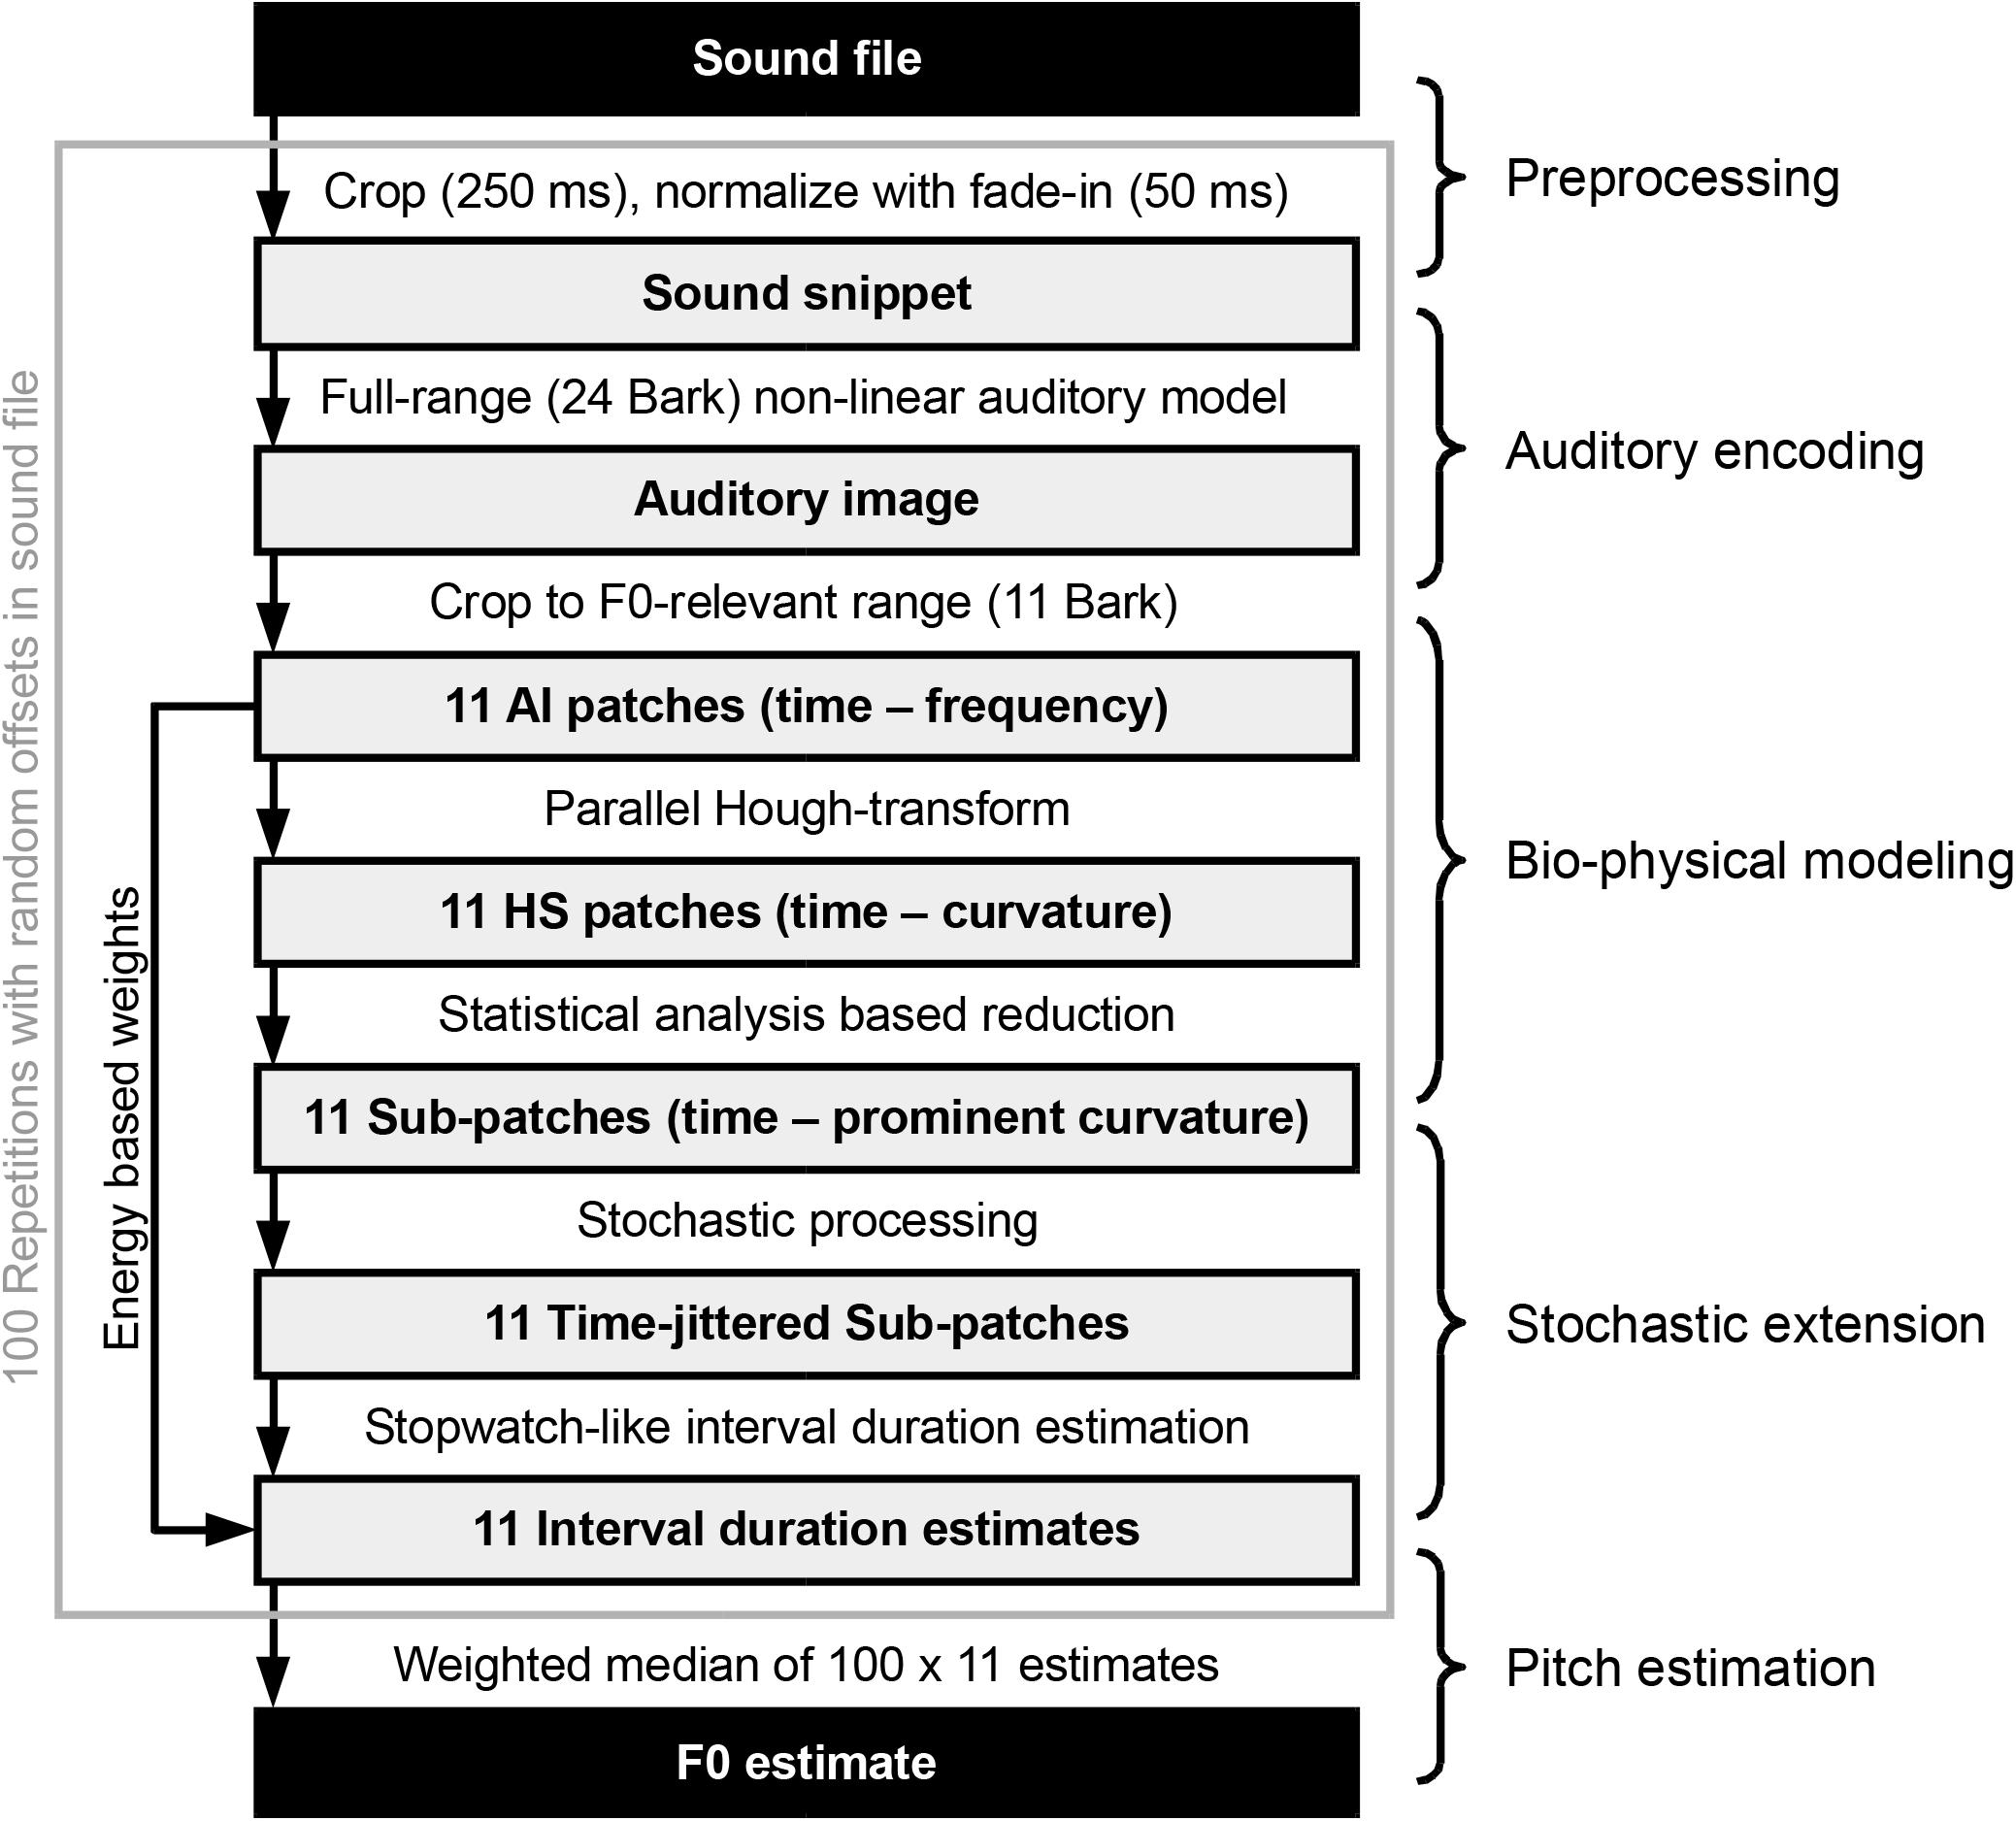
Figure 2. Overview of the processing steps from a single sound file to the pitch estimate (Adapted from Harczos and Klefenz, 2018).
For the bio-physical modeling part of the extended SAM front-end, we kindly refer to our previous open access paper (Harczos and Klefenz, 2018), the mathematical notation and symbols of which we continue using throughout the rest of this paper.
Test Corpora
For testing the presented system, we used three kinds of sounds: pure tones, sung vowels (a: and i: sung by a female as well as a male singer), and solo instruments (violin, flute, and piano). The latter were taken from the McGill University master samples (MUMS) CDs (Opolko and Wapnick, 1987) and correspond to CD1 Track 6 (violin, bowed), CD2 Track 5 (alto flute), and CD3 Track 3 (9′ Steinway grand piano, plucked). The sung vowel database was created at the Fraunhofer Institute for Digital Media Technology (IDMT) and can be obtained free of charge by contacting the authors.
Interval-Tuned Microcircuits
Periodicity pitch is derived from joint analysis of octopus inter-spike intervals (ISIs), where the reciprocal of the dominant interval is considered to be the pitch. Octopus ISIs are measured by interval duration metering units, which operate in the range between a shortest interval duration tmin and a largest interval duration tmax (Paton and Buonomano, 2018). Interval-tuned neurons (ITNs) have been identified in various species (Hedwig, 2016; Rose, 2018; Yamada et al., 2018). The interval duration metering unit is a stopwatch started by interval onset and stopped by interval offset. The stopwatch is triggered by a first spike of an octopus cell and stopped by the consecutive one, thus metering the time interval between them. The interval measuring unit is effectuated by an IC neuron. We name the IC neuron from here on as the intermittently interval-tuned neuron (ITN).
The stopwatch requires three start/stop control signals to the ITN: onset-evoked excitation, offset-evoked excitation, and onset-evoked inhibition, which is sustained for equally long or longer than the interval duration. The axons of octopus cells trifurcate to excitatory MSO_ON neurons, excitatory MSO_OFF neurons, and inhibitory DNNL_ON neurons, whose outputs, in turn, project to the associated ITNs as common terminals.
The interval duration registering timer unit has an internal sandglass-like mechanism substituting metaphorically sand particles by neurotransmitter vesicles (Figure 3). Any spillover vesicle tilts the excitatory/inhibitory balance (Gandolfi et al., 2020).
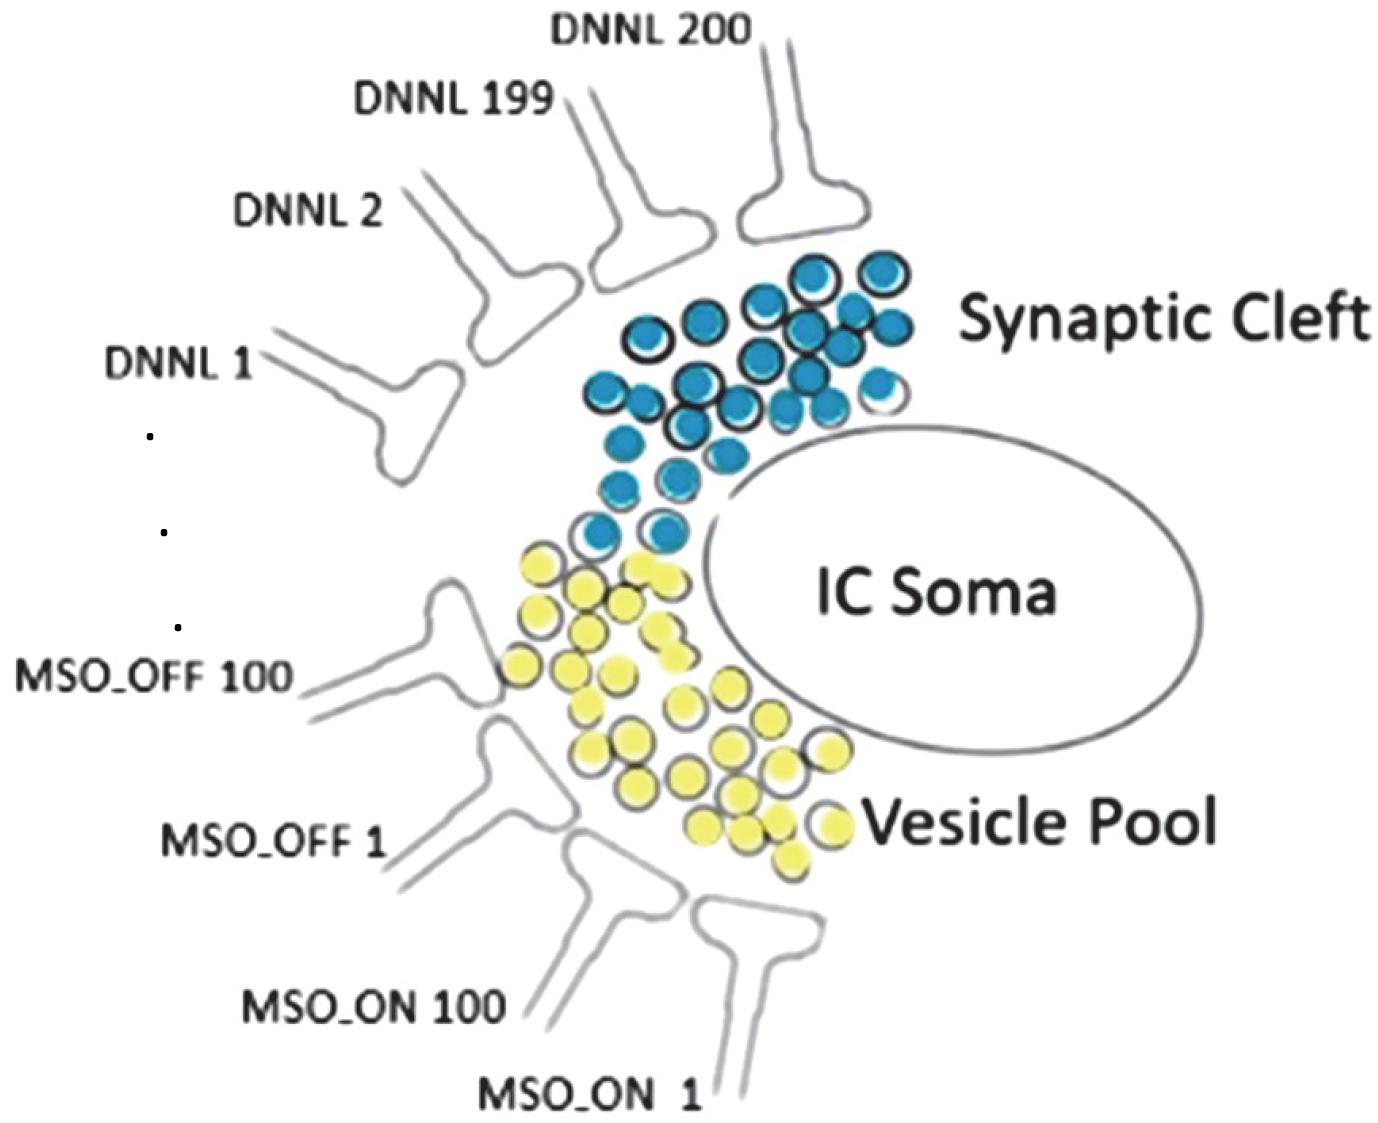
Figure 3. Synaptic cleft neurotransmitter releases (light yellow: glutamate, light blue: GABA) sourced from 100 MSO_ON, 100 MSO_OFF, and 200 DNLLs synapses; each neurotransmitter release from an exocytosed vesicle is indicated by a black surrounding circle; any spillover vesicle tilts the excitatory/inhibitory balance and triggers a spike at the IC soma with high temporal fidelity.
The complex temporal interplay of ON/OFF excitation and ON inhibition makes the timer unit selective for interval durations (Wehr and Zador, 2003; Edwards et al., 2008; Simen et al., 2011; Takizawa et al., 2012; Naud et al., 2015; Majoral et al., 2018; Rajaram et al., 2019). At the start, the IC soma is charged by mini EPSCs by MSO neurons and discharged by IPSCs by DNLL neurons. If the critical total equilibrium of balanced net EPSC and IPSC inputs passes threshold, a highly timely precise IC soma-initiated spike is triggered.
In principle, an onset-evoked excitation temporally coincides with an offset-evoked excitation and produces spikes in an ITN when the onset-evoked excitation has a compensatory latency equal to the interval duration (Simmons and Simmons, 2011). In the presence of inhibition, neither the onset- nor offset-evoked excitations are supra-threshold on their own and cannot evoke spiking in the ITN; however, when the onset- and offset-evoked excitations temporally coincide, the summed excitation can overcome inhibition and evokes spiking in the ITN (Aubie et al., 2009, 2012; George et al., 2011; Buhusi et al., 2016; Akimov et al., 2017; Kopp-Scheinpflug et al., 2018; Baker et al., 2019; Felmy, 2019).
For a computational stopwatch implementation, we take over and adapt Aubie’s timer model (Aubie et al., 2012). The ITN is composed as a single-compartment IC soma with a diameter of 13 μm equipped with glutamate-activated excitatory depolarizing AMPA, NMDA, and inhibitory hyperpolarizing GABAA ion channels. Receptor kinetics is based on the simplified versions of postsynaptic currents from the study by Destexhe et al. (1998). Briefly, presynaptic spikes trigger a 1-ms release of a 1-mM neurotransmitter that activates postsynaptic receptor currents with kinetics specified in Aubie et al. (2012). A spike is triggered at the time step in which the membrane potential of the ITN neuron crosses 0 mV. The rates of neurotransmitter binding α and unbinding β determine the rise and decay kinetics of each postsynaptic receptor conductance gAMPA, gNMDA, and gGABAA (Rowat and Greenwood, 2014). Fitted parameter values for α and β were previously determined from whole-cell current recordings (Destexhe et al., 1998). NMDA receptors exhibited a voltage-dependent Mg2+ block characterized by the function B(V) as defined by Jahr and Stevens (1990). The membrane also contains passive channels that conduct leak current Ileak and channels for fast Hodgkin–Huxley-type sodium INa and potassium IK currents based on the kinetics described by Traub and Miles (1991) and implemented by Destexhe et al. (1996). Voltage dynamics of the model IC cell membrane potential dV/dt were determined by the following equation:
where Cm is the membrane capacitance; Ileak the passive membrane leak current; INa the sodium channel current; IK the potassium channel current; and IAMPA, INMDA, and IGABAA the corresponding receptor-mediated currents.
Presynaptic spikes that activate glutamatergic AMPA and NMDA receptors on the ITN are generated by two single-compartment excitatory neurons: one providing excitation timed relative to a first octopus spike (onset-evoked stimulus, MSO_ON) and the consecutive offset-evoked stimulus (MSO_OFF) (Oertel et al., 2019). Presynaptic neurons were modeled with fast-spiking kinetics such that a 1-ms, 0.1-nA injected current pulse produces exactly one spike in the neuron. IPSPs are modeled with GABAA receptor kinetics. Inhibitory presynaptic inputs to the ITN are generated by a population of single-compartment presynaptic inhibitory neurons with fast-spiking kinetics that activate GABAA receptors on the model ITN. A current of discrete 1-nA square pulse in a simulation time step of 0.05 ms is injected into each inhibitory presynaptic neuron. In Aubie’s model, the inhibitory DNNL neurons randomly fire with a Poisson distribution. This is simulated by injection times following a Poisson distribution with a mean probability of 0.05 events per time step (i.e., on average, each presynaptic neuron received 1 nA of current for 0.05 ms per 20 simulation time steps).
Pitch Estimation Monolayer SNN
Several octopus cells observe local segments of a common global trajectory in their TRFs. Each global trajectory is, therefore, represented by its unique set of spiking octopus cells. In the narrower mathematical sense, the TRFs are time-shifted relative to an imaginary vertical zero line according to their lateral spatial positions. For a given set, all relative time shifts are set to zero in order to achieve a common synchronization.
For quasi-stationary tones, global trajectories are repeated almost identically, and almost always the same octopus cells spike. The intra-synchronization for each set assures common arrival times at the ITNs, and in turn, the synchronized FSLs allow a spiking coincidence processing at the pitch neurons (Bagheri et al., 2017). The template matching of global trajectories is transposed to local distributed processing in spiking neural network architectures. A simple monolayer spiking neural network (SNN) with interval-tuned neurons in the input layer, star-wise connected to pitch neurons in the output layer, is constructed (Figure 4; Calixto et al., 2012; Bidelman, 2013; Baumann et al., 2015; Ranjan et al., 2019). Due to the star connectivity, ITNs can contribute to all pitch decisions, and the pitch neurons can collect votes from all ITNs. Each ITN contributes at a specific interval duration FSL time t with a spike, which is weighted by its actual synaptic connection strengths to pitch neurons. Each pitch neuron synchronously receives spikes at the same FSL time t for a set of ITNs of the same interval duration. The sum of the activated synaptic weights at isochronous FSL time t determines if a pitch neuron reaches threshold and, in turn, spikes (poly-pitch mode).
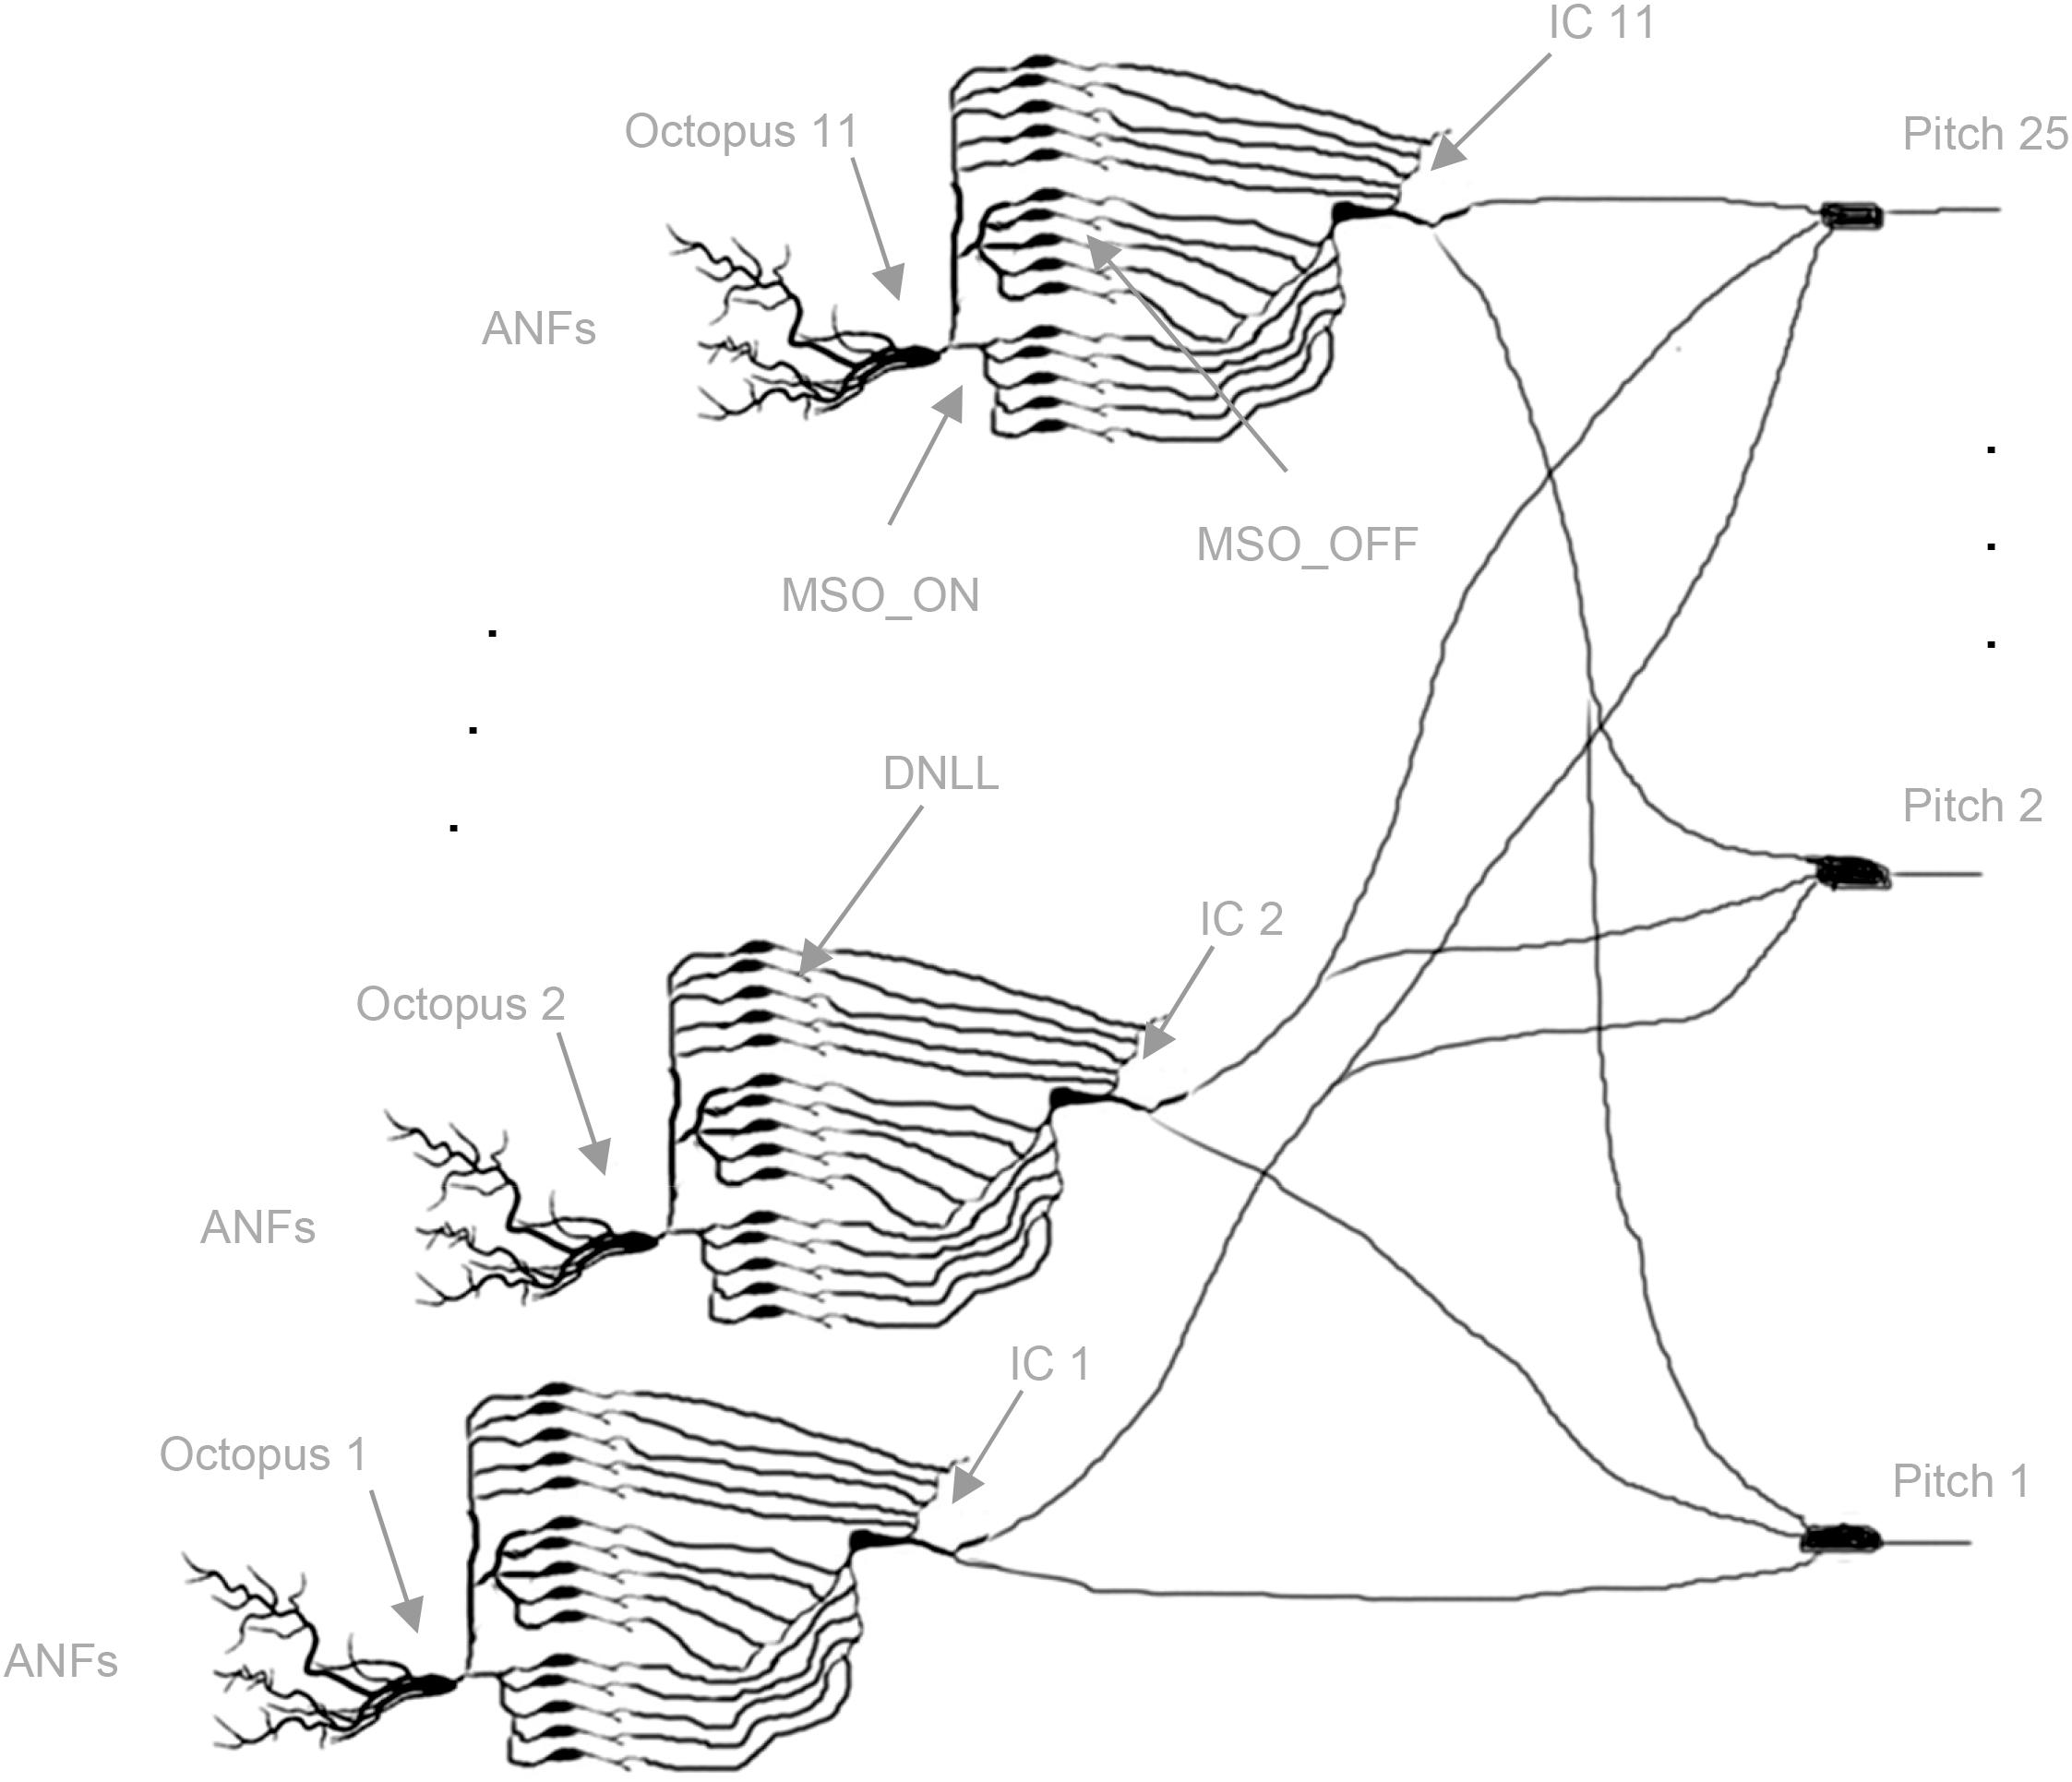
Figure 4. Topology of the neural network. Starting from left, octopus cells receive input from ANFs in their temporal receptive fields (three out of 11 are shown); each dendritic end branch connects to an ANF (not shown). Octopus cells trifurcate to MSO_ON neurons (bottom blocks: five out of 100 shown), MSO_OFF neurons (middle blocks: five out of 100 shown), DNLL neurons (top blocks: five out of 200 shown); MSO_ON, MSO_OFF, and DNLL neurons connect to the bottom, middle, and top dendritic branches of the inferior colliculus (IC) neurons, respectively; IC neurons connect star-like to pitch neurons (three out of 25 are shown) (Cells redrawn from Siveke et al., 2006; Bal and Baydas, 2009; Wallace et al., 2012).
If only the dominant pitch is to be determined, a softmax operation is applied. The standard SNN is replicated n times, and each SNN is trained individually for template matching for each global trajectory. Mono and poly pitches can be learned by adjusting the synaptic weights, but learning is outside the scope of this article and is deferred for a subsequent article.
Implementation Details
The auditory encoder as well as the simulation of the bio-physical model of the pitch estimation has been implemented on a PC platform in an interplay of parts implemented in C, C++, MATLAB, NEURON, and Python languages. For evaluation and data visualization, we used MATLAB R2019a from MathWorks and Microsoft Excel 2010. The network models used in the present study were obtained from ModelDB “Duration-tuned neurons from the inferior colliculus of vertebrates,” accession number 144511 (Aubie et al., 2012). We used NEURON version 7.7 (McDougal et al., 2017) and Python Anaconda 3 (both 64-bit versions) on a Dell Optiplex 7010 under Microsoft Windows 10. NEURON simulations were run with a time step resolution of 0.05 ms.
Results
Optimality Criterion
Aubie’s model has a lot of adjustable parameters. To adapt the model to interval duration estimation, the first criterion is to define the operation range by choosing adequate parameter settings that show FSL behavior in response to applied interval durations. The second criterion is to change the original parameter space as little as necessary. The third criterion is optimality by minimization of the mean of FSL standard deviations of a simulation run with pre-given parameter set. To reliably distinguish semitones at the 95% confidence level (±2σ), the condition {2σtone+1 + 2σtone < |FSLtone+1–FSLtone|} must hold for the two adjacent halves of neighboring distributions.
Parameter Search Space
Aubie’s model is species-specific, and models for bat, rat, mouse, and anuran are given. As bats rely on hearing, our initial guess was to adopt bat mode, and it turned out to be the best one for the task. Bat mode is defined in module C_BAT_JUN2. Various coincidence mechanisms are proposed and evaluated in Aubie’s model, for instance, anti-coincidence and excitatory onset/offset with inhibitory onset. We found that the coincidence mechanism as defined in network.DTN_Coincidence works best by minimizing overall mean FSLs in conjunction with C_BAT_JUN2.
Starting initially with the mouse model, we ran many simulations with many different parameter settings, and we realized in frustration that we never met the optimality criterion as standard deviations were always too high for the original model. Switching to bat mode helped a little, but still, standard deviations were too high. We decided to systematically search the parameter space by continuously varying a single parameter and clamping it if we found a local minimum. With this fixed parameter, we iterated the simulation and fixed the next parameter and so on.
The operation range in which FSL is a linear function of interval duration could be easily found, and the optimum values are given by gmaxAMPA = 0.006, gmaxNMDA = 0.035, gmaxGABAA = 0.001 (see Aubie et al., 2012 for discussion).
The variations of soma time constants t of ITNs and presynaptic neurons had little effect on the standard deviation criterion. Local minima have been reached by setting excitatory MSO_ON neuron soma t to 1 ms, DNLL neuron soma t to 1 ms, and ITN soma t to 5 ms.
We tried to identify those parameters that have a big impact on the results. We realized that the limiting factor of precision is the stochastic process with the Poisson distributed jitter term of varied injection times. To dampen the jitter noise, we changed the model by setting the number of inhibitory neurons to numDNLL = 200, excitatory ON neurons to numMSO_ON = 100, and excitatory OFF neurons to numMSO_OFF = 100. The random jitter of IC soma spiking is attenuated by the high number of 200 DNNLs. The DNLLs fill the vesicle pool (Figure 3). As soon as the vesicle pool reaches subthreshold, the next spillover vesicle excites a spike initiating from the IC soma. The IC soma spike time is very precise as it doesn’t matter which individual DNNL neuron released the spillover vesicle.
Estimation of Interval Durations
Interval duration times are annotated for semitones and frequencies over two octaves from C4 to C6, in which most melodies are notated (Table 1).
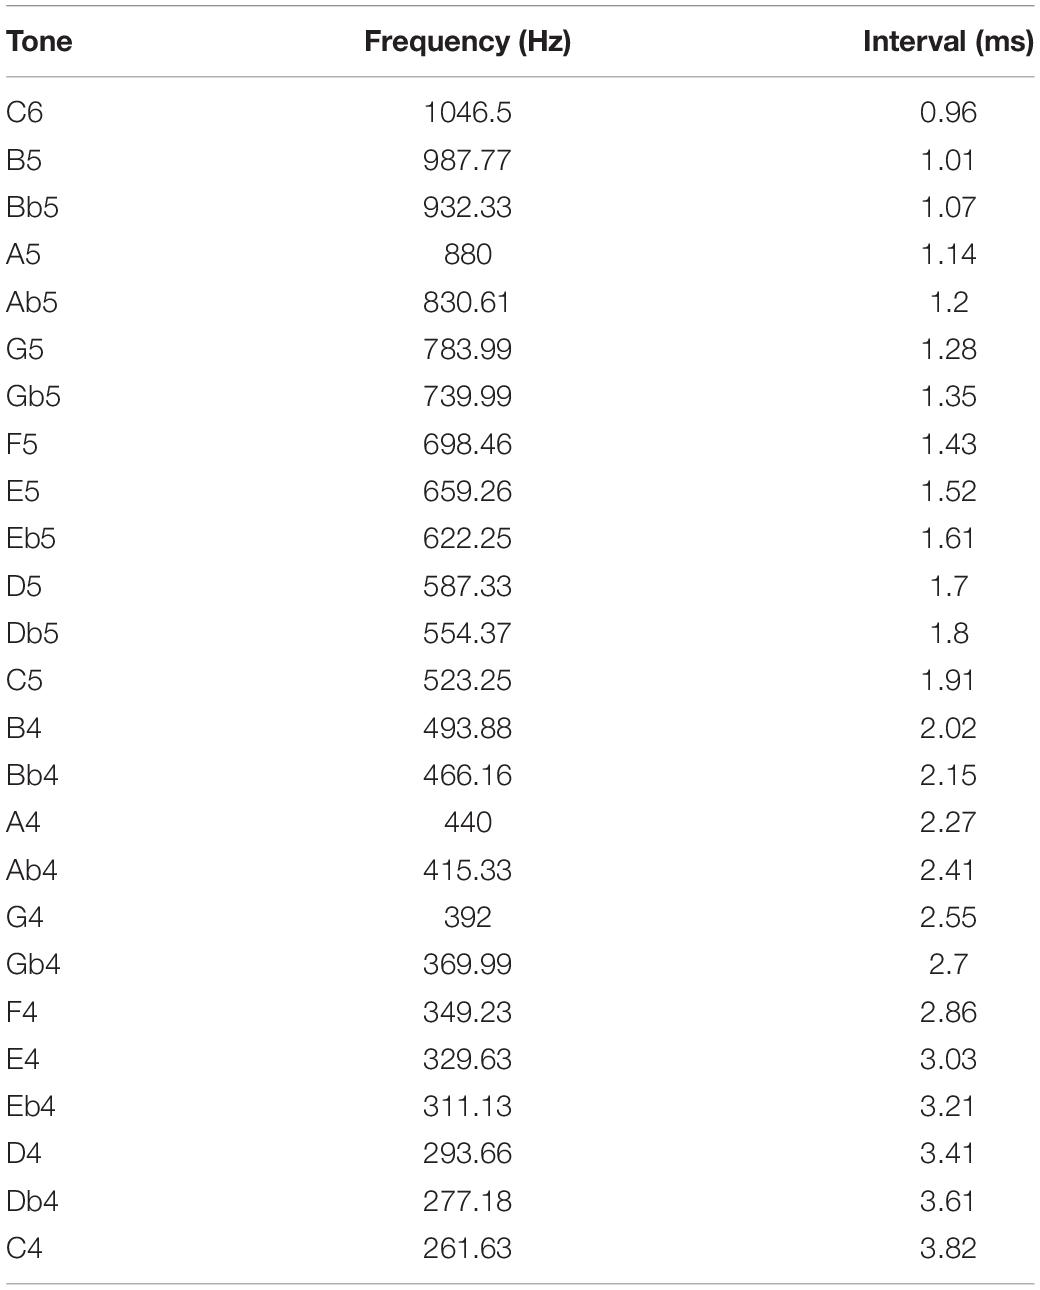
Table 1. Annotated time interval durations referring to a 12-tone equal temperament relative to A4 (440 Hz).
The time difference from tone C4 (261.63 Hz) to tone C6 (1046.5 Hz) is 2.86 ms. Twenty-five semitone intervals are allocated within this time span. Due to the reciprocal ratio between interval time and interval frequency, the tone intervals aggregate more densely at short tone intervals and distribute more loosely at longer tone intervals.
These 25 tones are applied to Aubie’s model as the ultimate test of its robustness and reliability to distinguish tone interval durations. In order to mimic the stochastic behavior of neurons, each interval duration trial is repeated 20 times with a randomly varying current injection time (Fisch et al., 2012). The random injection time follows a Poisson distribution effectuated by NEURON pseudo-random generator Mcell4. For each interval duration, mean FSL time and standard deviation over 20 trials are computed. This amounts, with 25 note interval times and 20 repetition trials each, to 500 simulations per run.
Only minor task-specific changes have to be made to the original model. Most parameters of the model, explicitly the AMPA, NMDA, and GABAA receptor kinetics and the sodium, potassium, and passive leakage channel kinetics as well as the channel kinetics of the presynaptic excitatory and inhibitory model neurons, remain unchanged. All necessary parameter changes are explicitly indicated so that results are externally reproducible by third parties.
First Spike Latency (FSL)
The interplay of onset-/offset-evoked excitations and onset inhibitions triggers response stimulus onset times in ITNs relative to onset-evoked excitation trigger time. The difference of response stimulus onset time and onset-evoked excitation time is defined as first spike latency (FSL). FSLs systematically increase for ascending tone-interval durations. FSL starts with FSLmindur for the best matching interval and ends with FSLmaxdur for the largest deviant interval duration. FSL depends on the species and the chosen coincidence mechanism.
Other influential parameters on response stimulus onset time and, hence, FSL are the membrane time constant t of the soma of the ITN, which is the product of membrane resistance rm and membrane capacitance cm; others are receptor conductances g of AMPA, NMDA, and GABAA receptors (see Aubie et al., 2012 for discussion). For the best parameter setting, we determined C6 produces the minimal mean first spike latency FSLmindur of 43.3 ms and C4 the maximal mean first spike latency FSLmaxdur of 46.22 ms. The FSLs over two octaves C4 to C6 with 25 semitone intervals fall between FSLmindur and FSLmaxdur. The data points are plotted with ±2 σ error bars in a common diagram and a regression line is fitted (Figure 5).
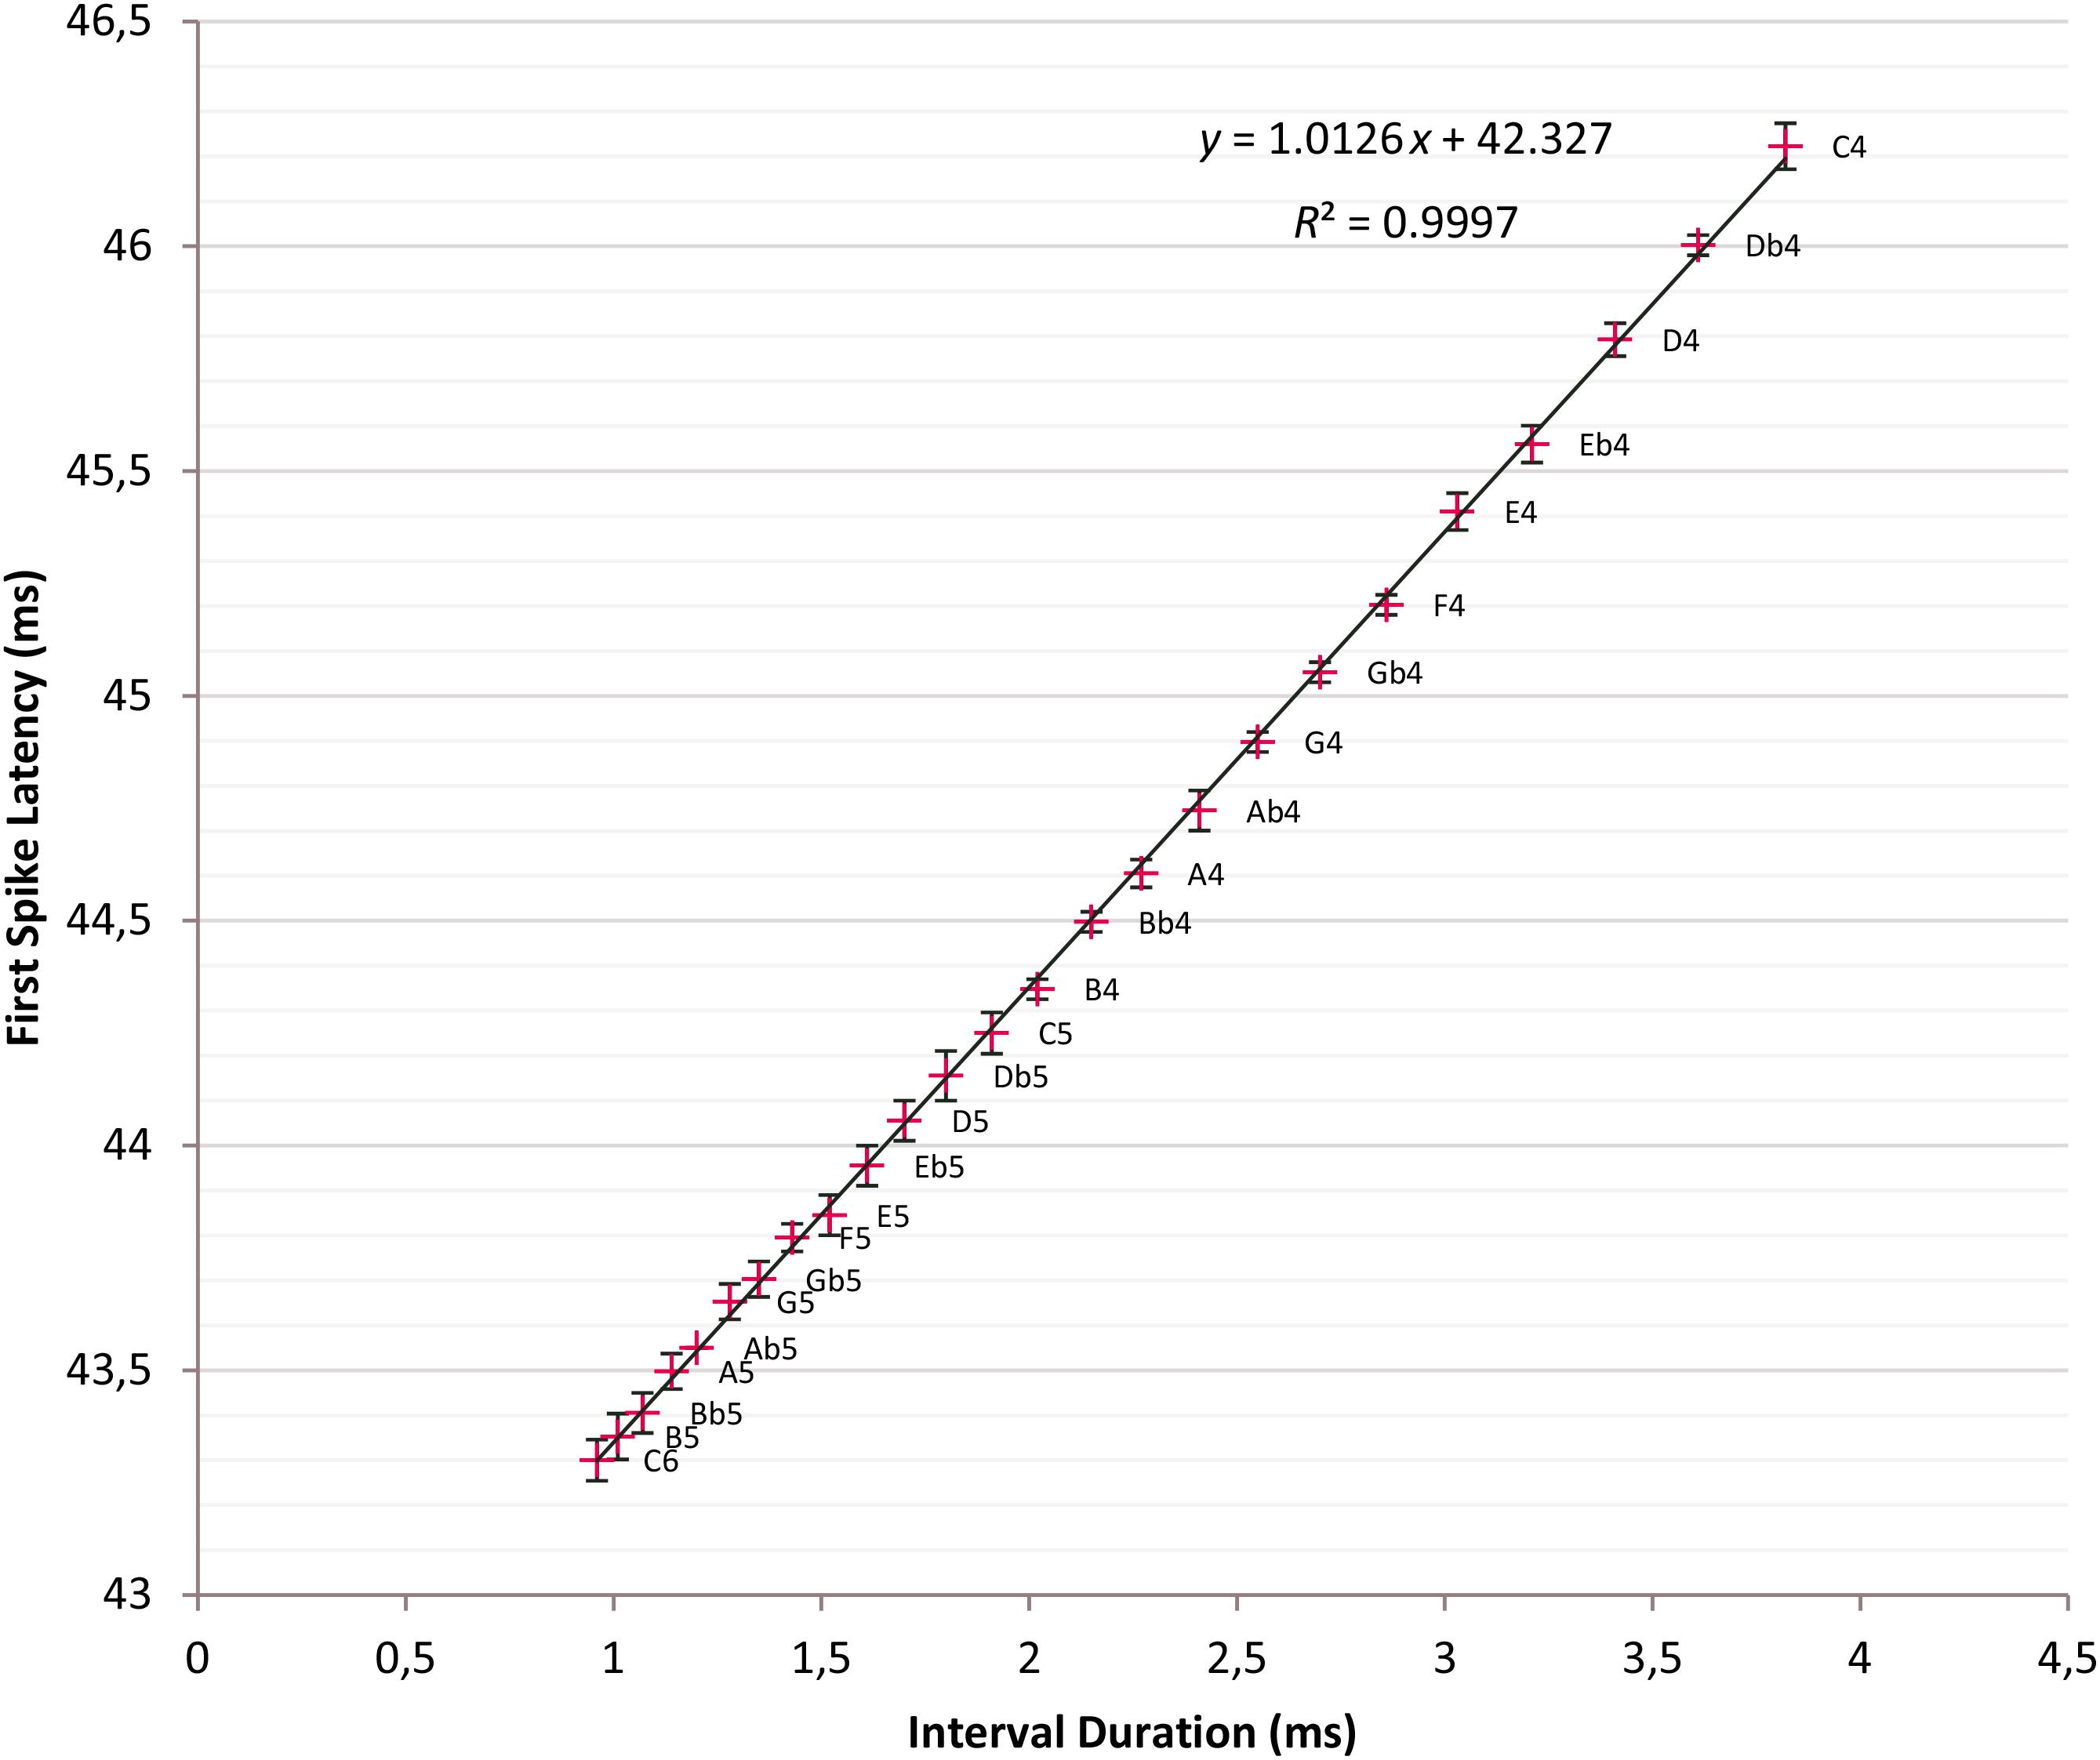
Figure 5. Time intervals versus first spike latencies (FSLs). Crosses: Tone intervals and corresponding FSLs; t = 5 ms; linear regression line fitted: y = 1.0126x + 42.327, R2 = 0.9997; error bars ±2σ; 95% confidence interval.
First spike latencies is a linear function of the tone interval with the regression line given as y = 1.0126x + 42.327; R2 = 0.9997. Interval durations and FSLs are nearly identical because of the slope 1.0126 of the regression line. This setting has a drastic impact and minimizes the mean standard deviation over C4 to C6 to 18.11 μs, which is an indicator for the high precision of the timers. From C4 until F5, except a single slight overlap {Db5, D5}, there is no overlap of the ±2 σ error bars so that tones are distinguishable with high fidelity at the 95% confidence level.
Stochastic Term Modeling
The adapted Aubie’s model responds with a mean FSL SD derived from all intervals of 18.11 μs. To circumvent the CPU’s time-consuming interval duration computation in NEURON, for every ISI we replace Aubie’s model by formulating an equivalent stochastic computation input/output function with a Poisson distribution of ±20 μs and apply it to the test corpora. We take audio snippets with a length of 100 consecutive octopus spike intervals for a selected patch. For each interval, we compute a mean F0 for each patch. The computation of the weight of a patch is the same as in our previous article (Harczos and Klefenz, 2018).
Individual Sound Categories
To understand the inner workings as well as the strengths and weaknesses of our compound model, we tracked and visualized both the weights and the F0 estimates for each patch in every one of the 100 iterations for all the test files. Without claiming completeness, below in Figures 6–11, we present a few examples for each tested category along with an overview of the weights for all test sounds (median over all iterations). In these figures, the central marks of the boxes (colored in red) indicate the medians. The 25th and 75th percentiles are represented by the bottom and the top edges of the boxes, respectively. The whiskers extend to the extreme data points, which are not yet considered outliers. Outliers are at least 1.5 interquartile ranges away from either end of the box.
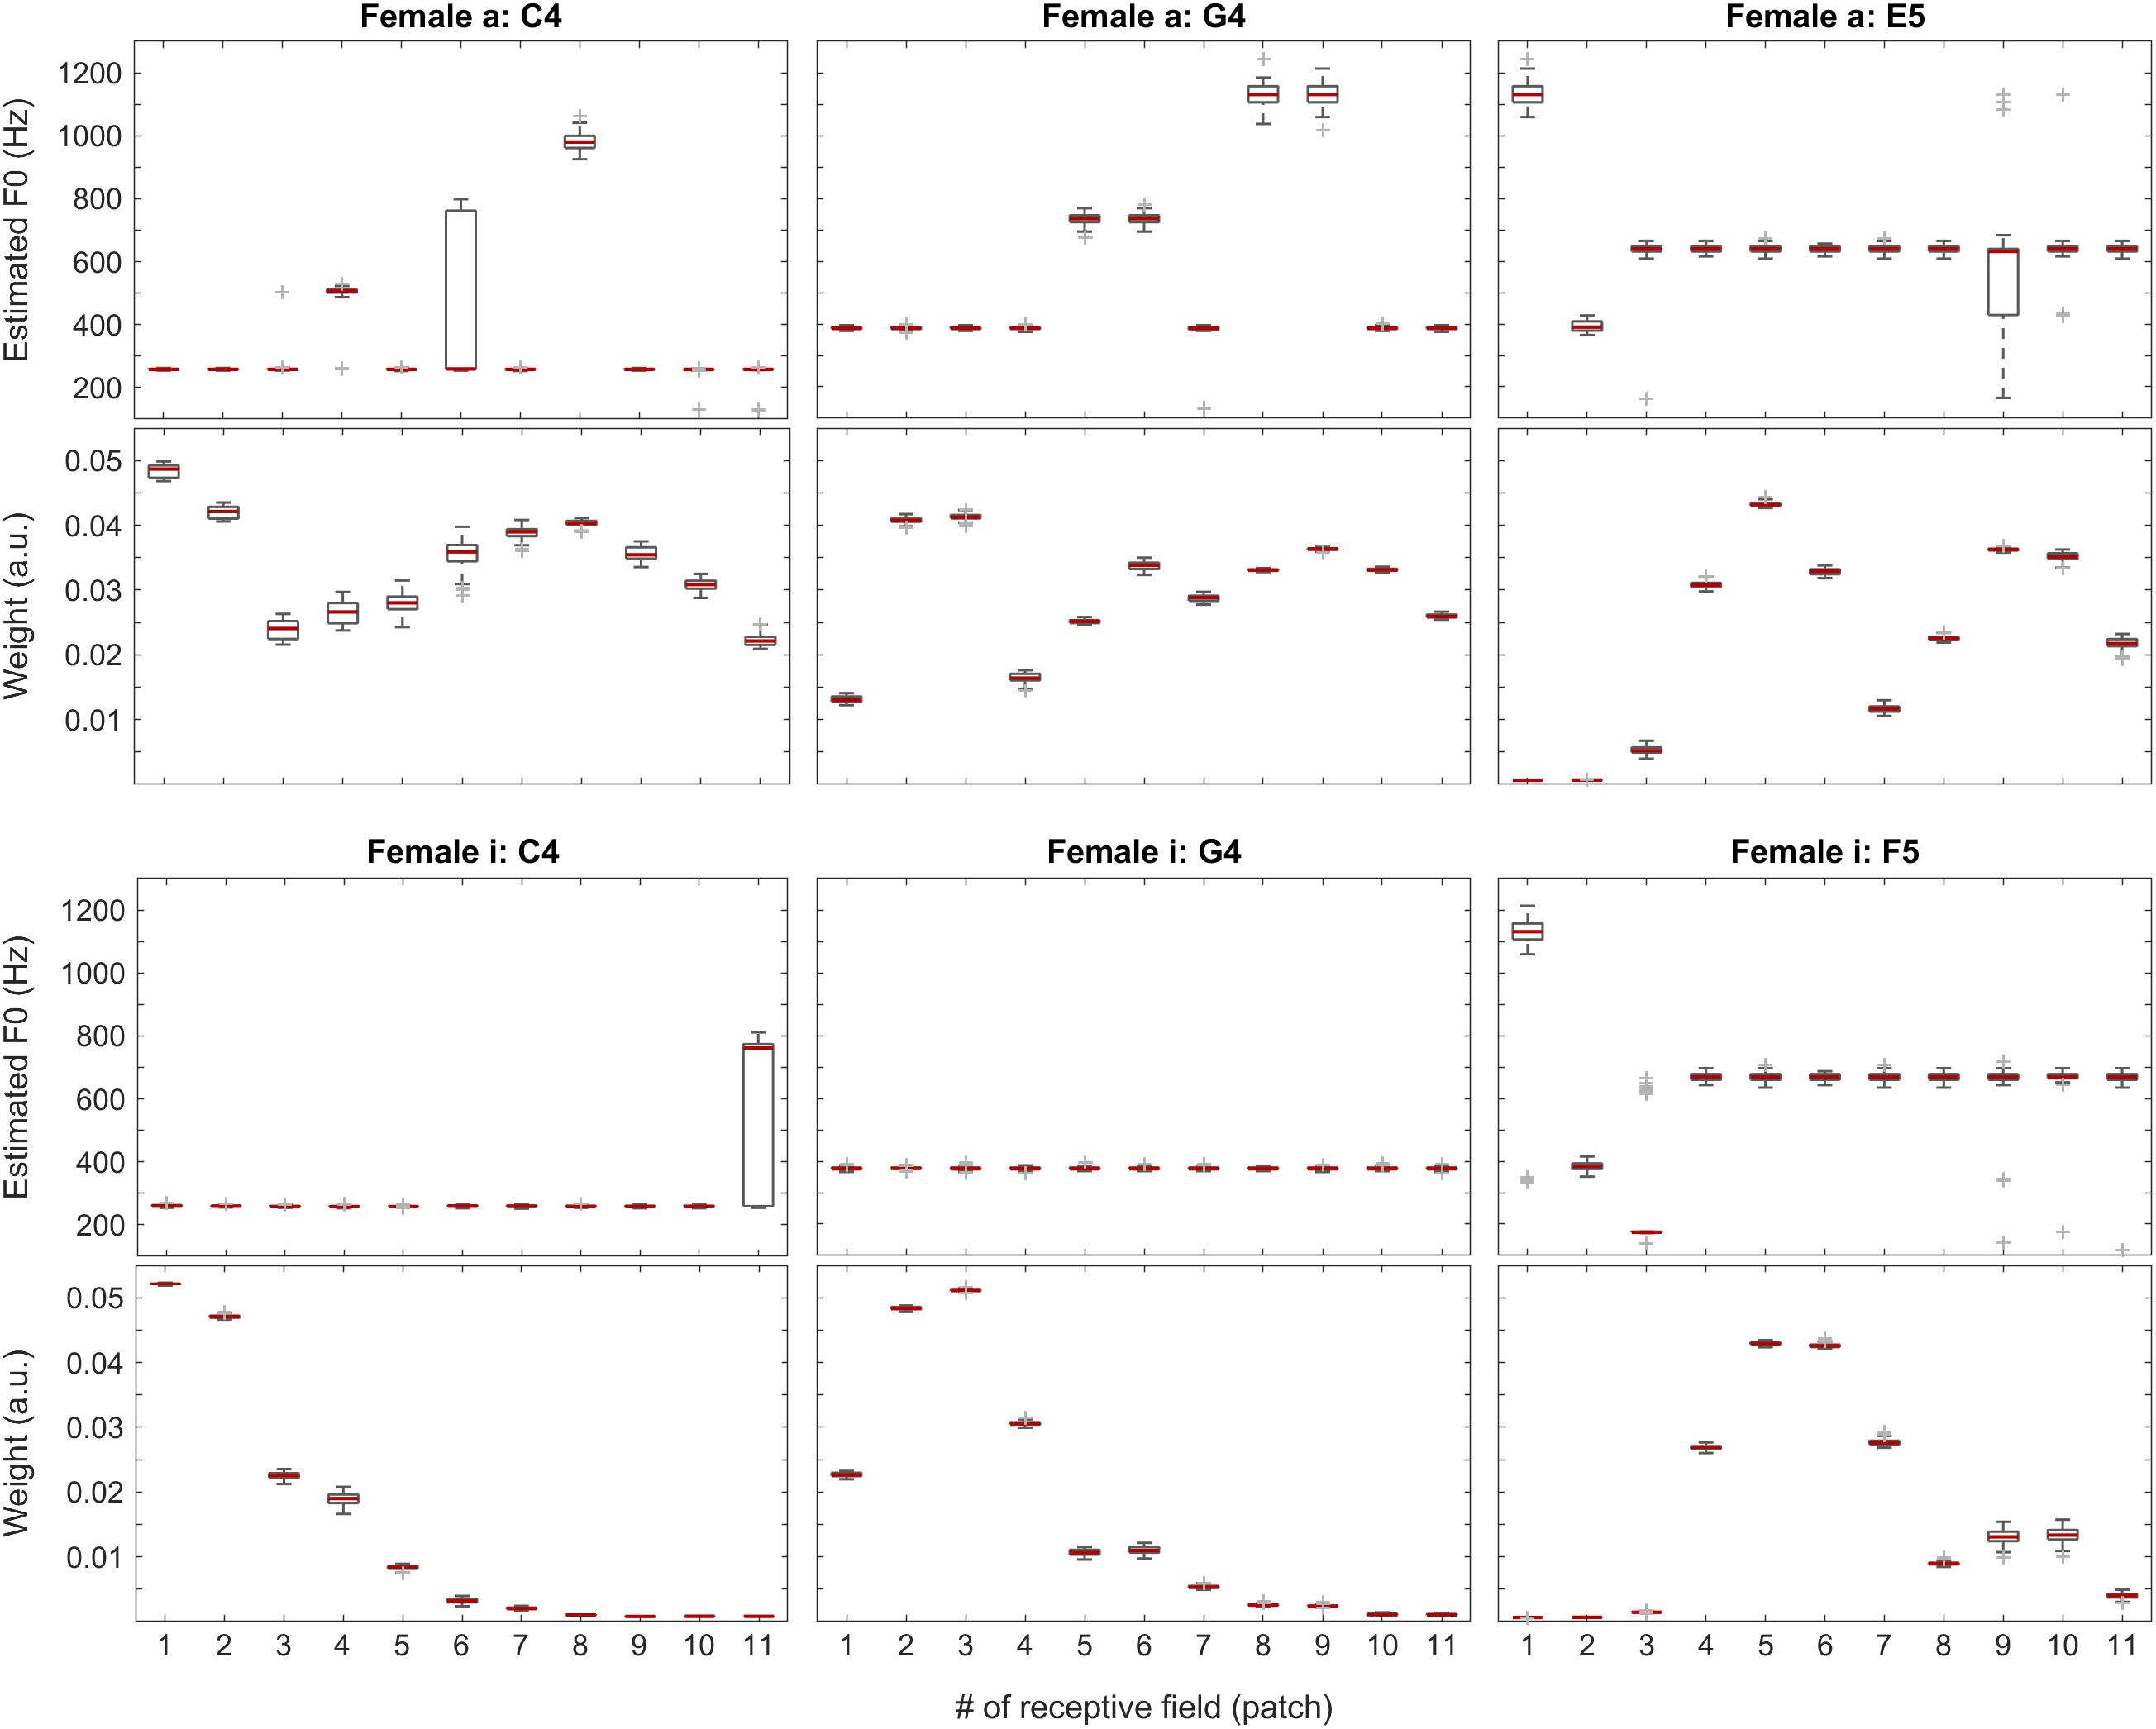
Figure 6. F0 estimates (first and third rows) and weights (second and fourth rows) for all patches over all 100 iterations for the vowels a: (top two rows) and i: (bottom two rows) sung by a female singer.
In Figure 6, positions of the maximum weights seem to follow F0 nicely, whereas the profiles of the weights also correlate well with the formants of the given vowels. When looking at the single-patch F0 estimates, on one hand, we find a few instances deviating from the correct F0 estimate, which, on the other hand, is represented by the majority of the receptive fields. When we attach the weights to the F0 estimates, i.e., when we calculate the Edgeworth type weighted median as the aggregate fundamental frequency estimate for the given sound snippet (not shown here), we get the correct F0 estimate in all the above cases.
During our tests, weights proved to be very stable (i.e., have low spread around their median) over the iterations, so we decided to also visualize the median weights alone for all tested pitches for all sound categories. In Figures 7, 11, pitch increases from bottom to top. The heat-map colors ranging from white over yellow and red to black correspond to increasing weights. Because the weight units are arbitrary, plots are normalized separately and do not necessarily cover the same range of weights.
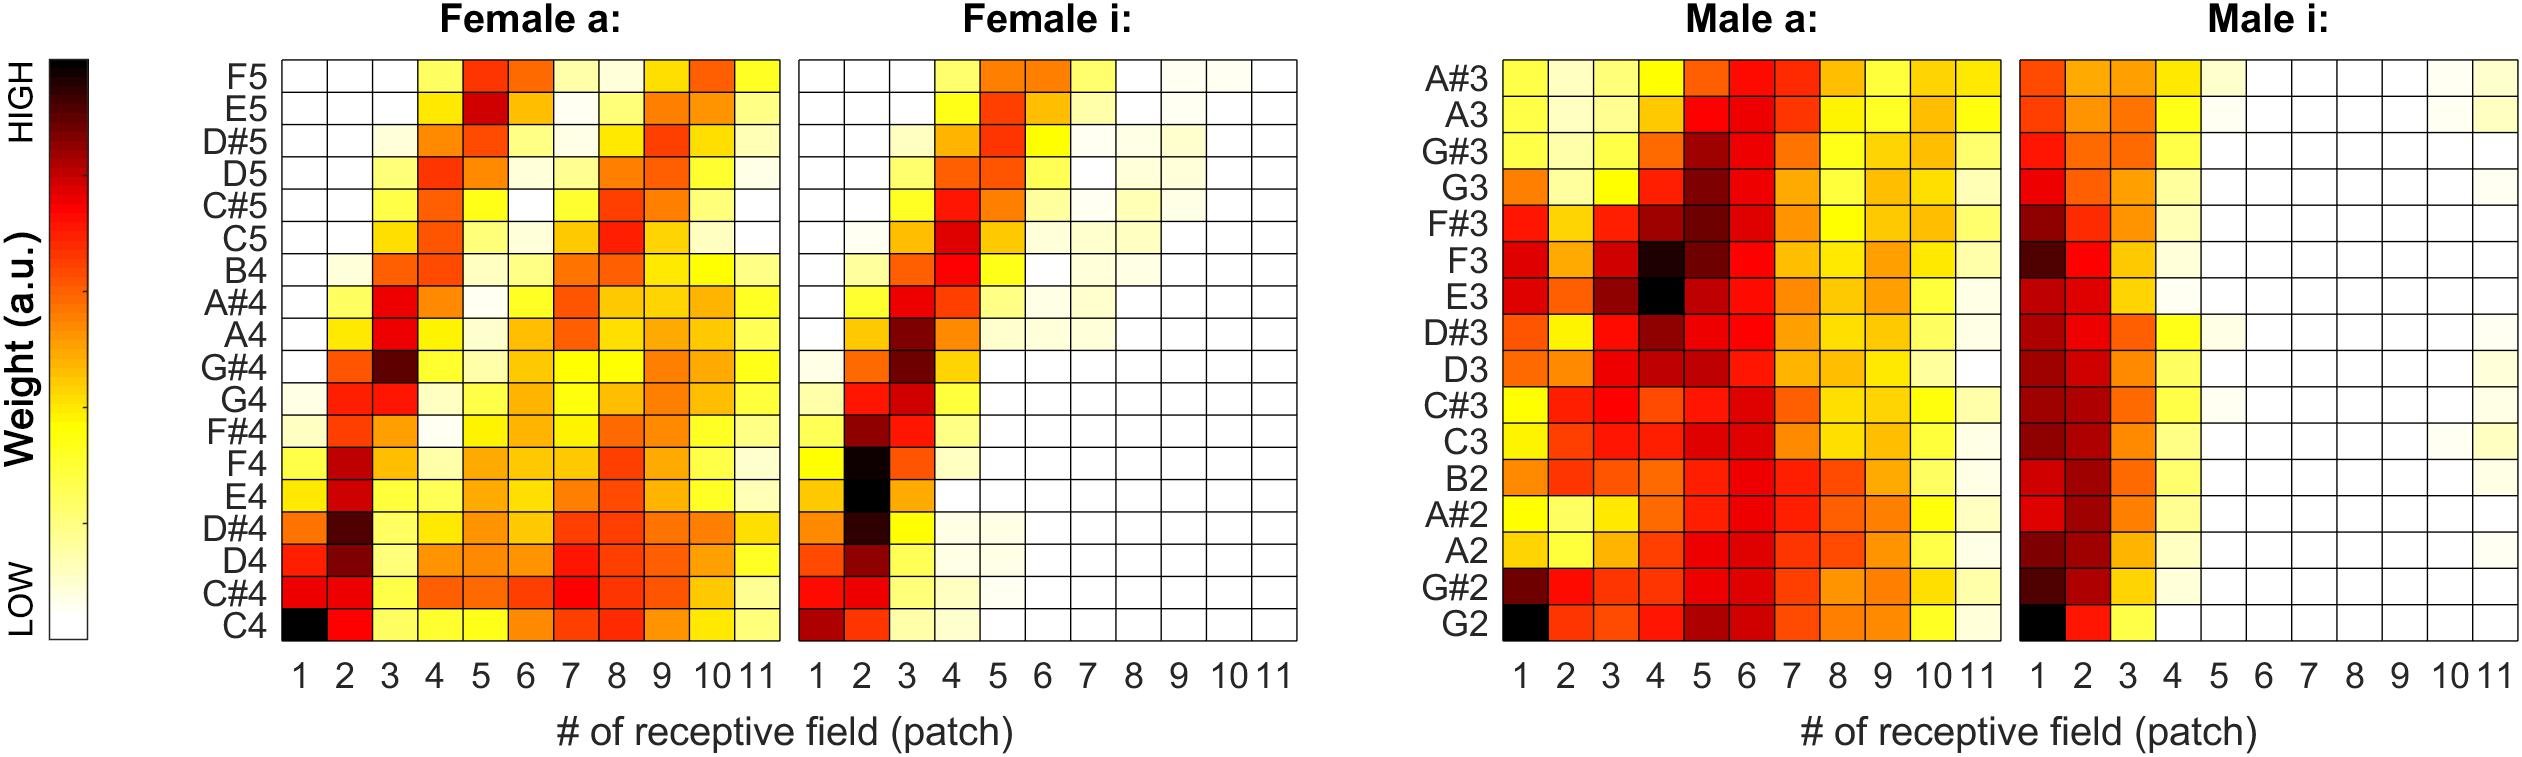
Figure 7. Median of the weights (over all 100 iterations) for the complete tested pitch range for the sung vowel recordings. From left to right: a: and i: by female singer, then a: and i: by male singer.
As apparent from Figure 7, the weights can provide a beneficial extension to the single-patch F0 estimates by prioritizing those belonging to high-energy auditory image patches. This applies particularly to the vowels sung by the female singer (see left two plots in Figure 7), and the resolution of formants was far less efficient for the much lower pitched male singer (see right two plots in Figure 7). For details, please also evaluate Figure 8.
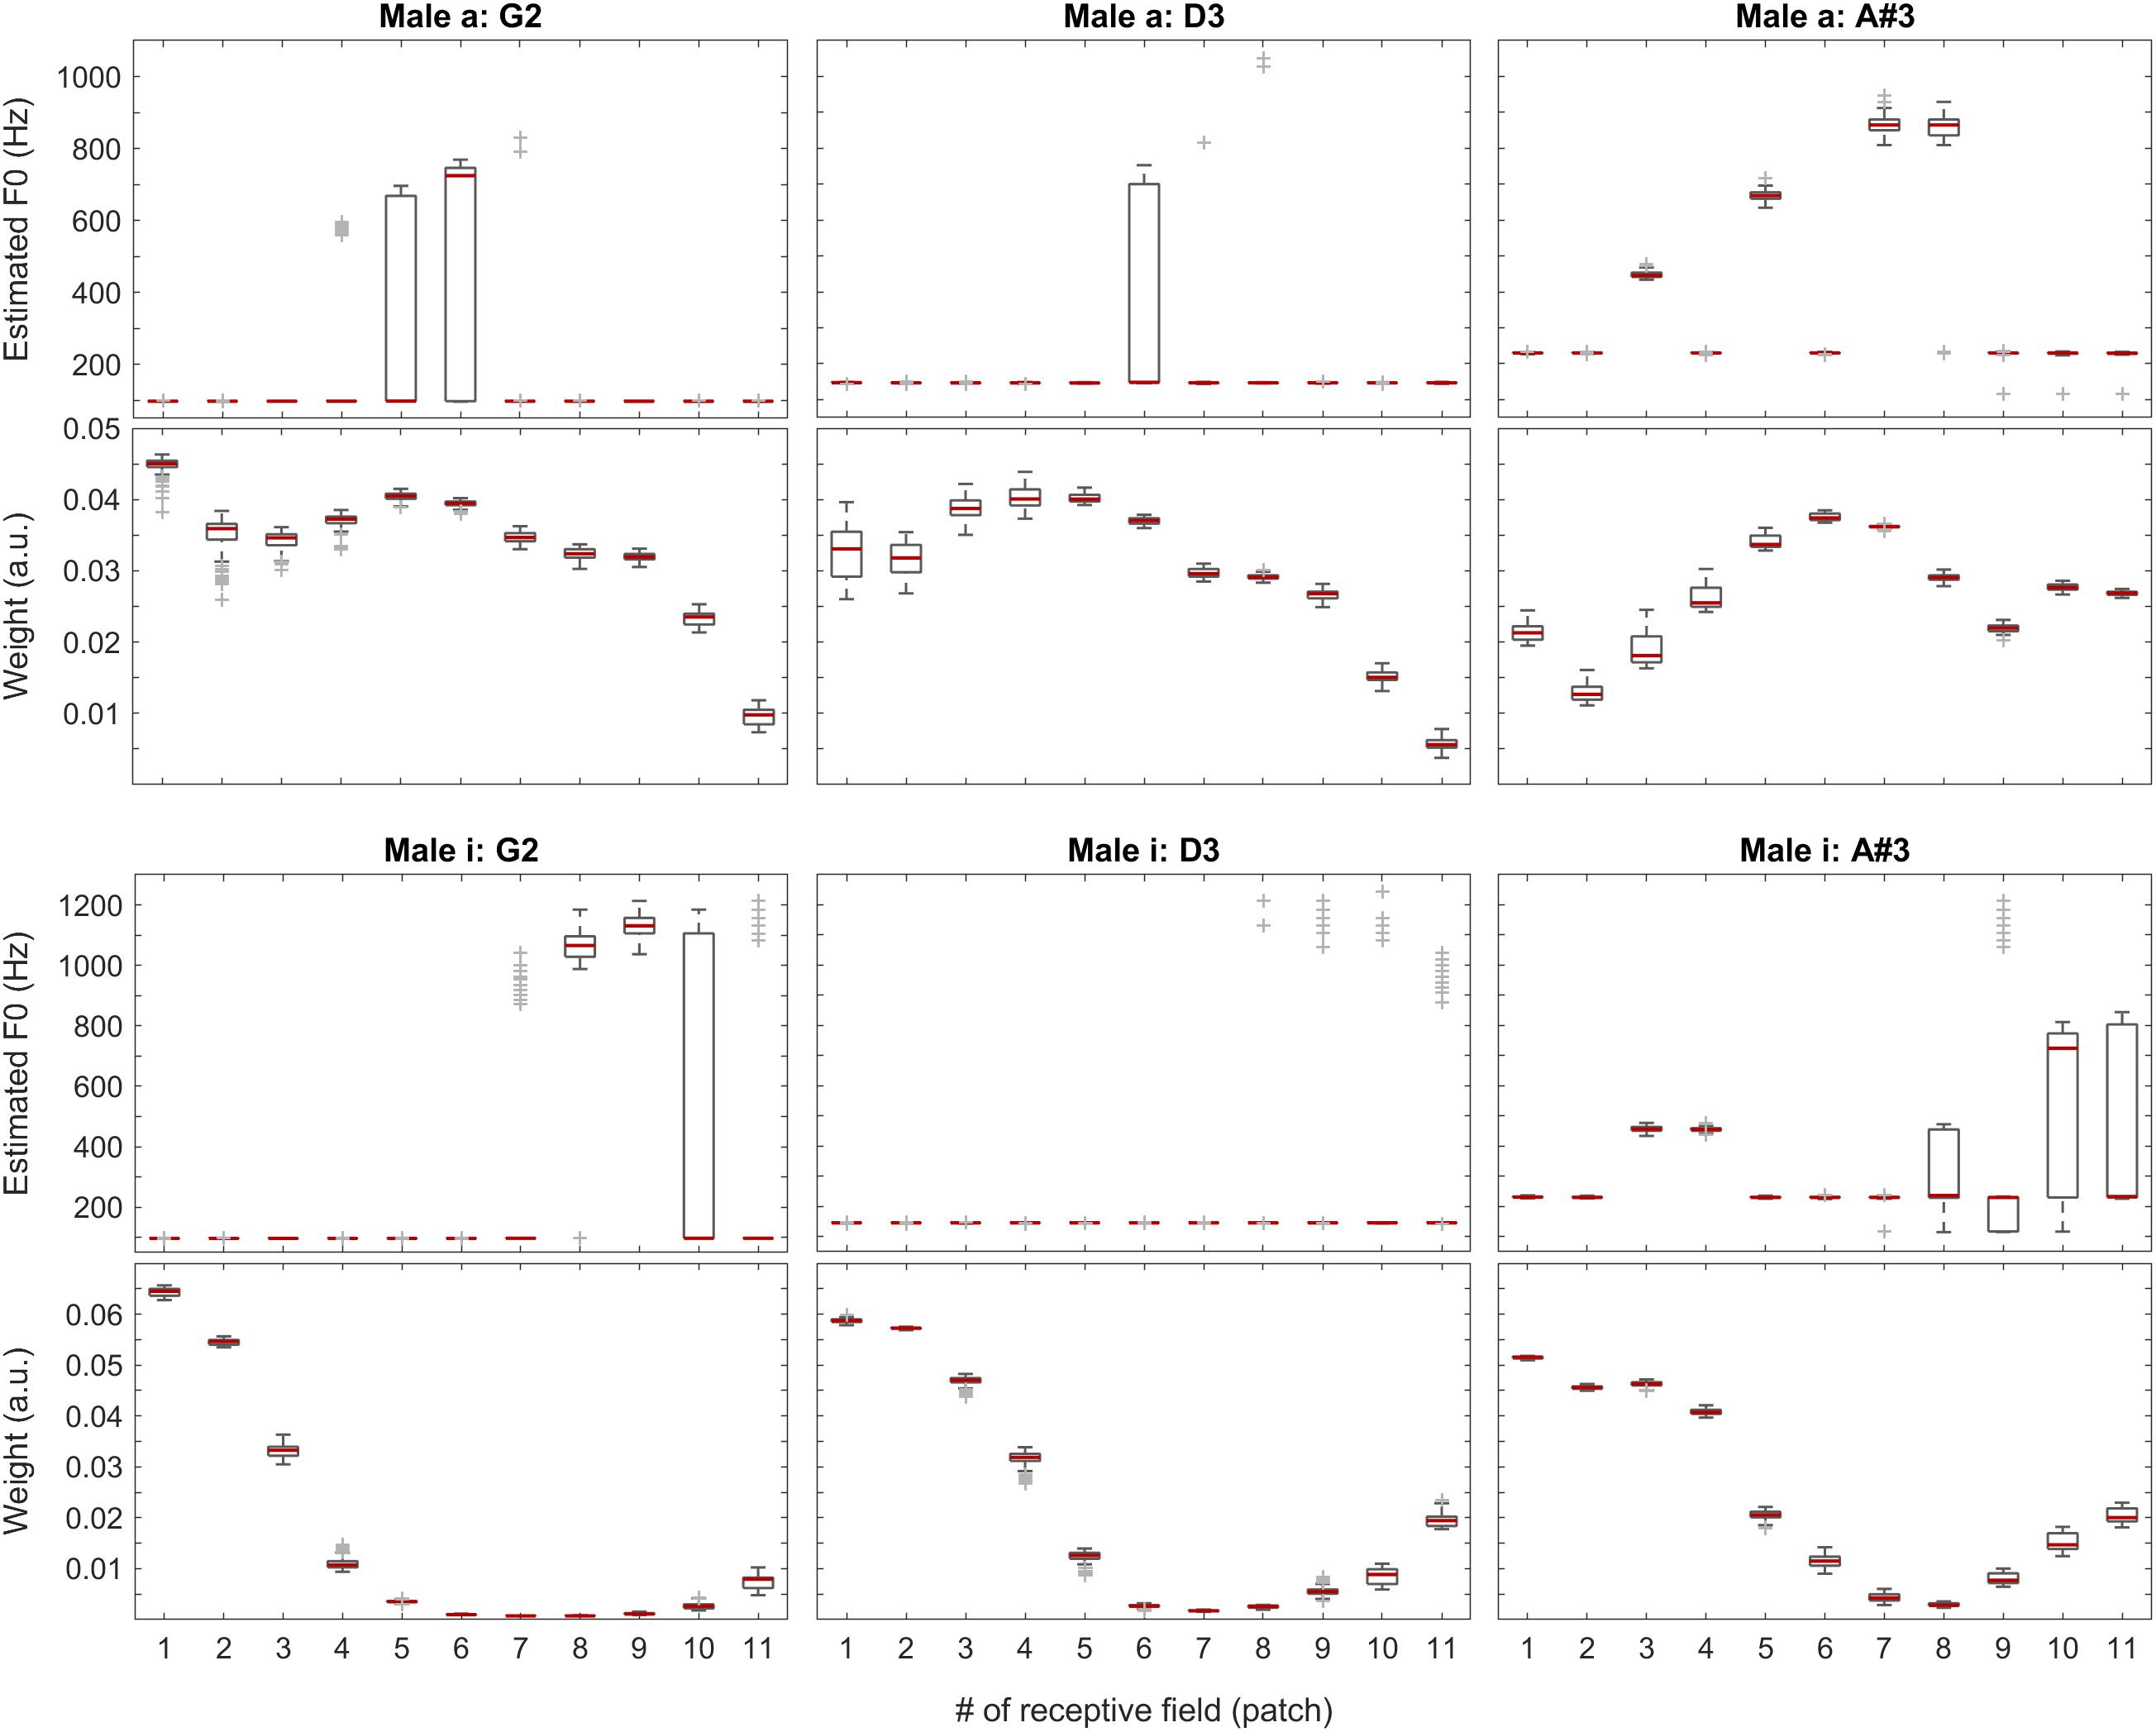
Figure 8. F0 estimates (first and third rows) and weights (second and fourth rows) for all patches over all 100 iterations for the vowels a: (top two rows) and i: (bottom two rows) sung by a male singer.
With the instruments piano and violin, we observed similar performance of the system: although the F0 of low-pitched sounds are estimated accurately in all receptive fields, with higher-pitched notes, the extent of ambiguity and the number of mispredictions increase as shown in Figure 9, below. Nevertheless, when we attach the weights (see also the first two plots in Figure 11) to the single-patch F0 estimates (Edgeworth type weighted median as discussed above), the combined F0 estimates are correct in all cases.
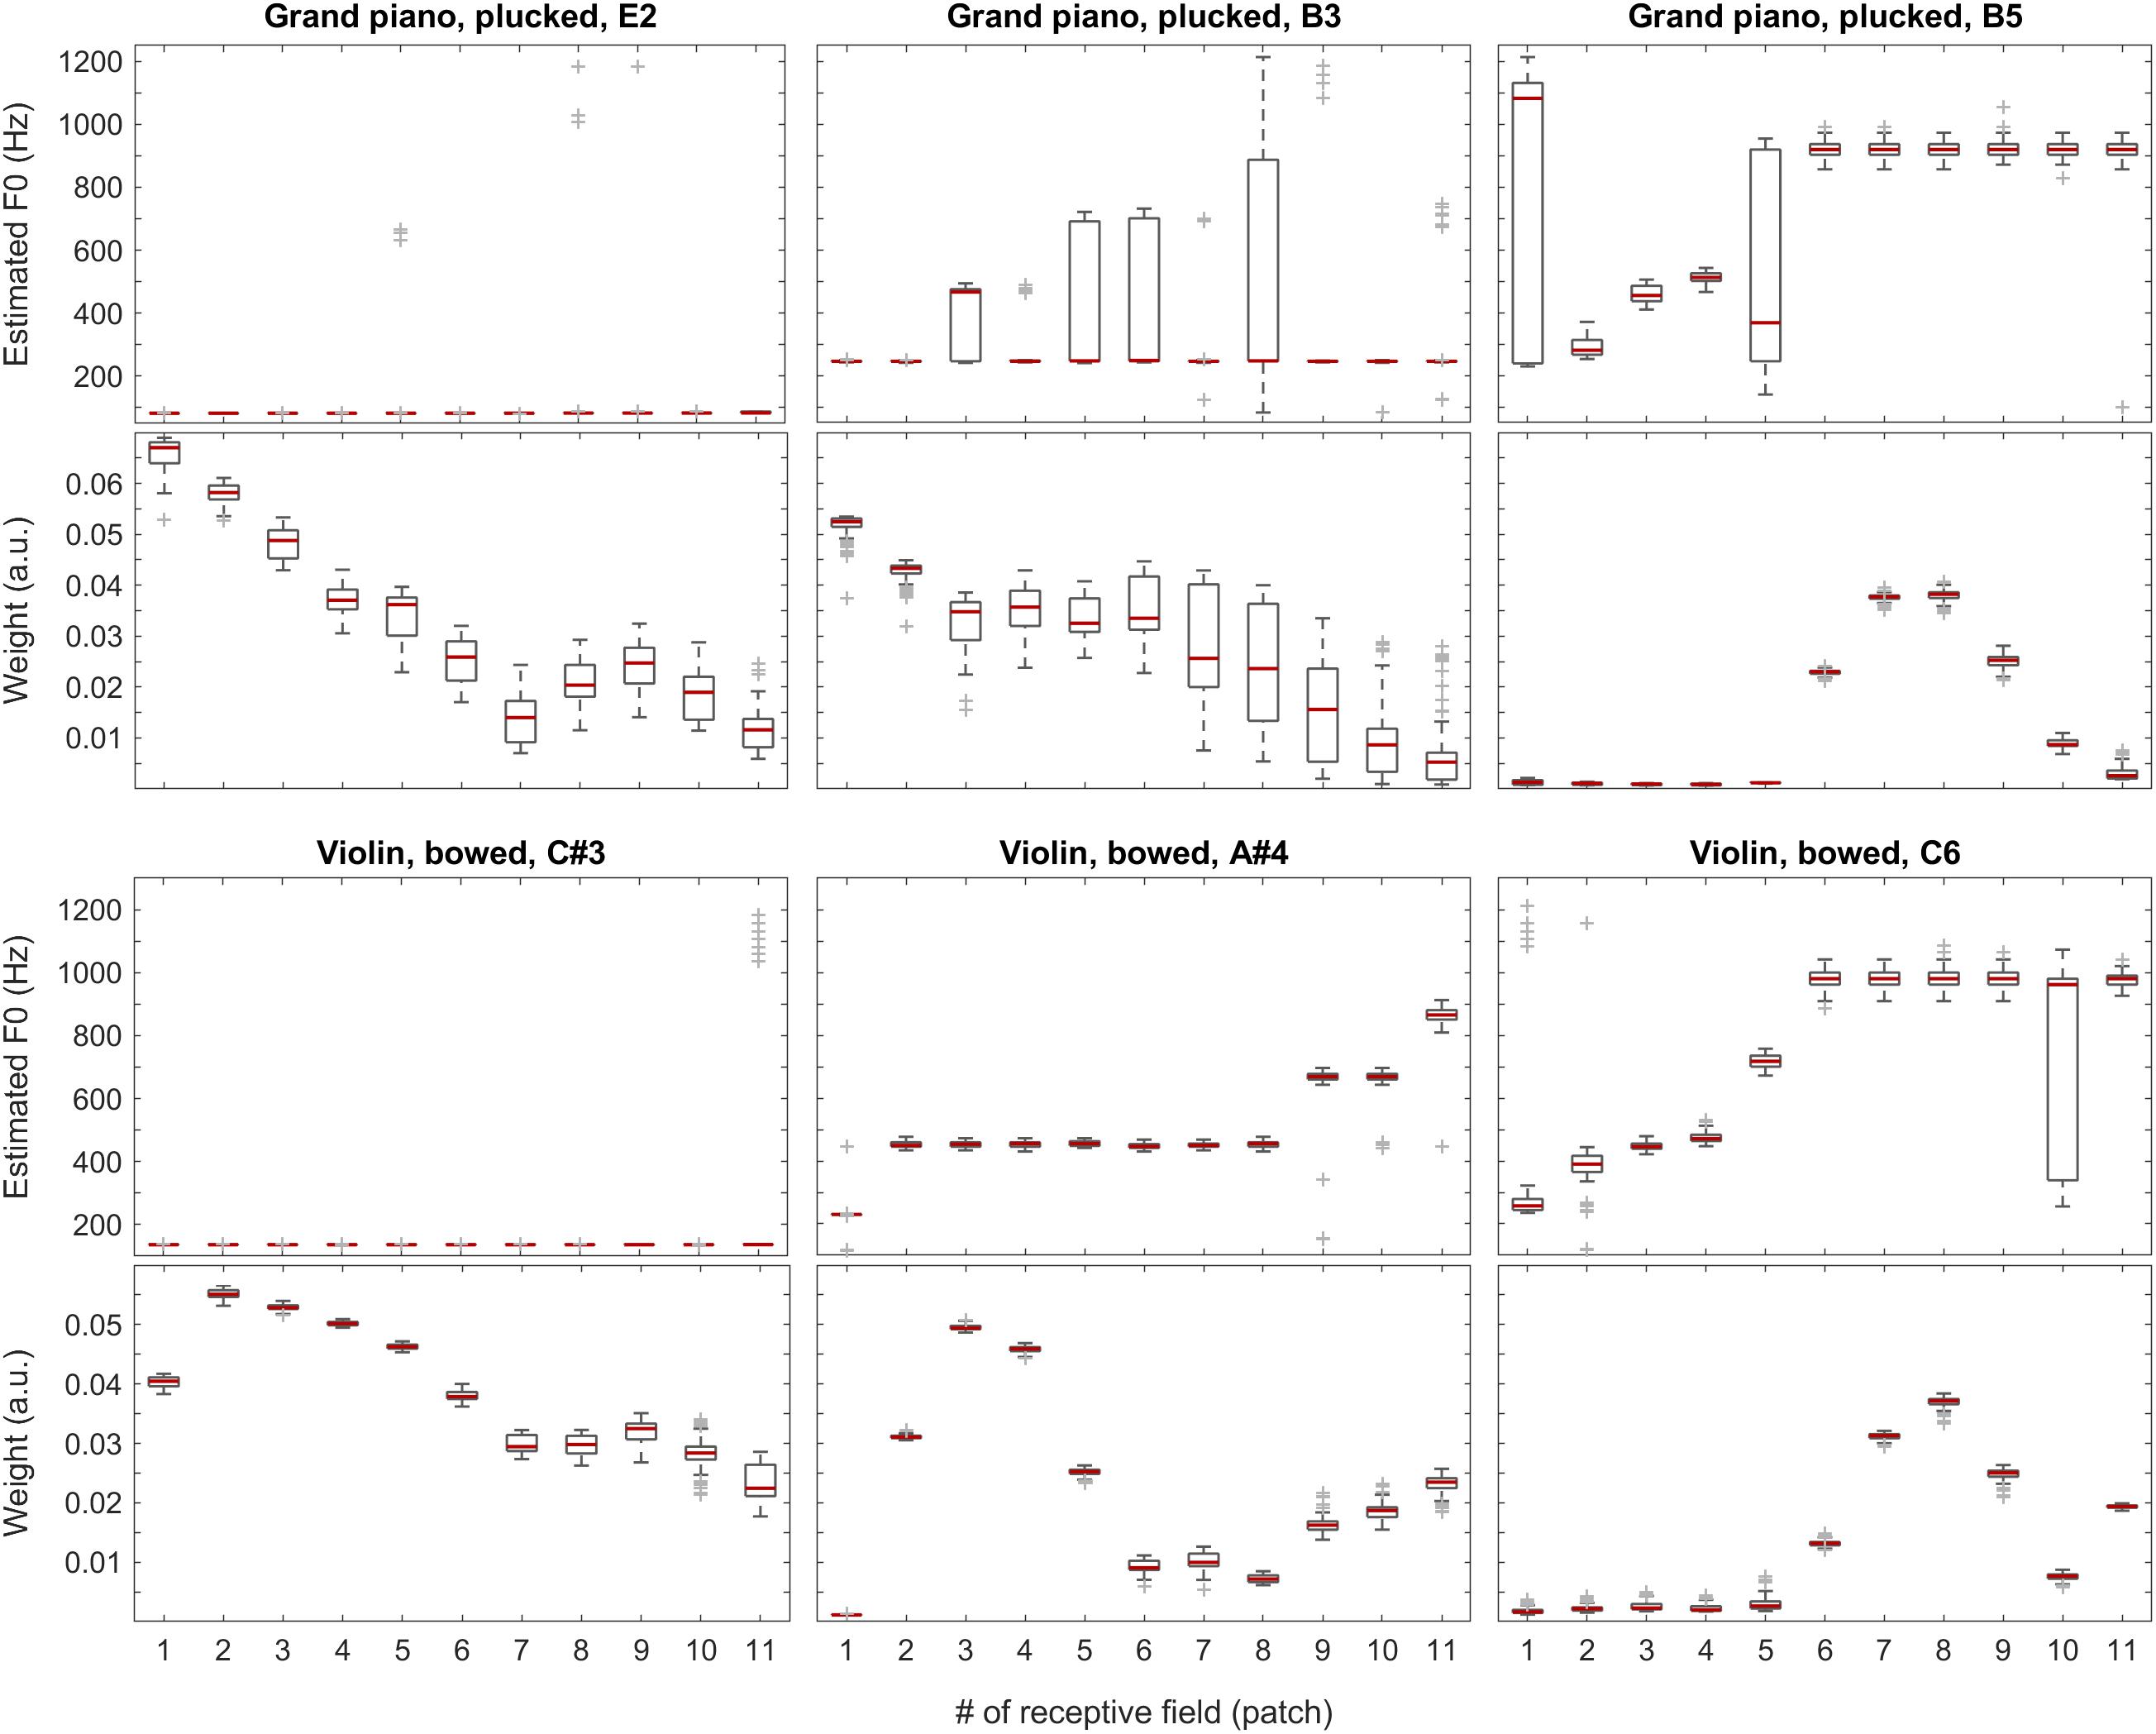
Figure 9. F0 estimates (first and third rows) and weights (second and fourth rows) for all patches over all 100 iterations for the grand piano (top two rows) and violin (bottom two rows) recordings.
The sound of the alto flute instrument is characterized by its rich, mellow tone, at least in the lower portion of its range, which is also represented by the weights shown in the second row of Figure 10 and the third plot in Figure 11. Although, with increasing pitch, the single-patch F0 estimates diverge more, the weight profiles get peakier and increasingly localized at the same time. Thus, the combined F0 estimates tend to remain accurate.
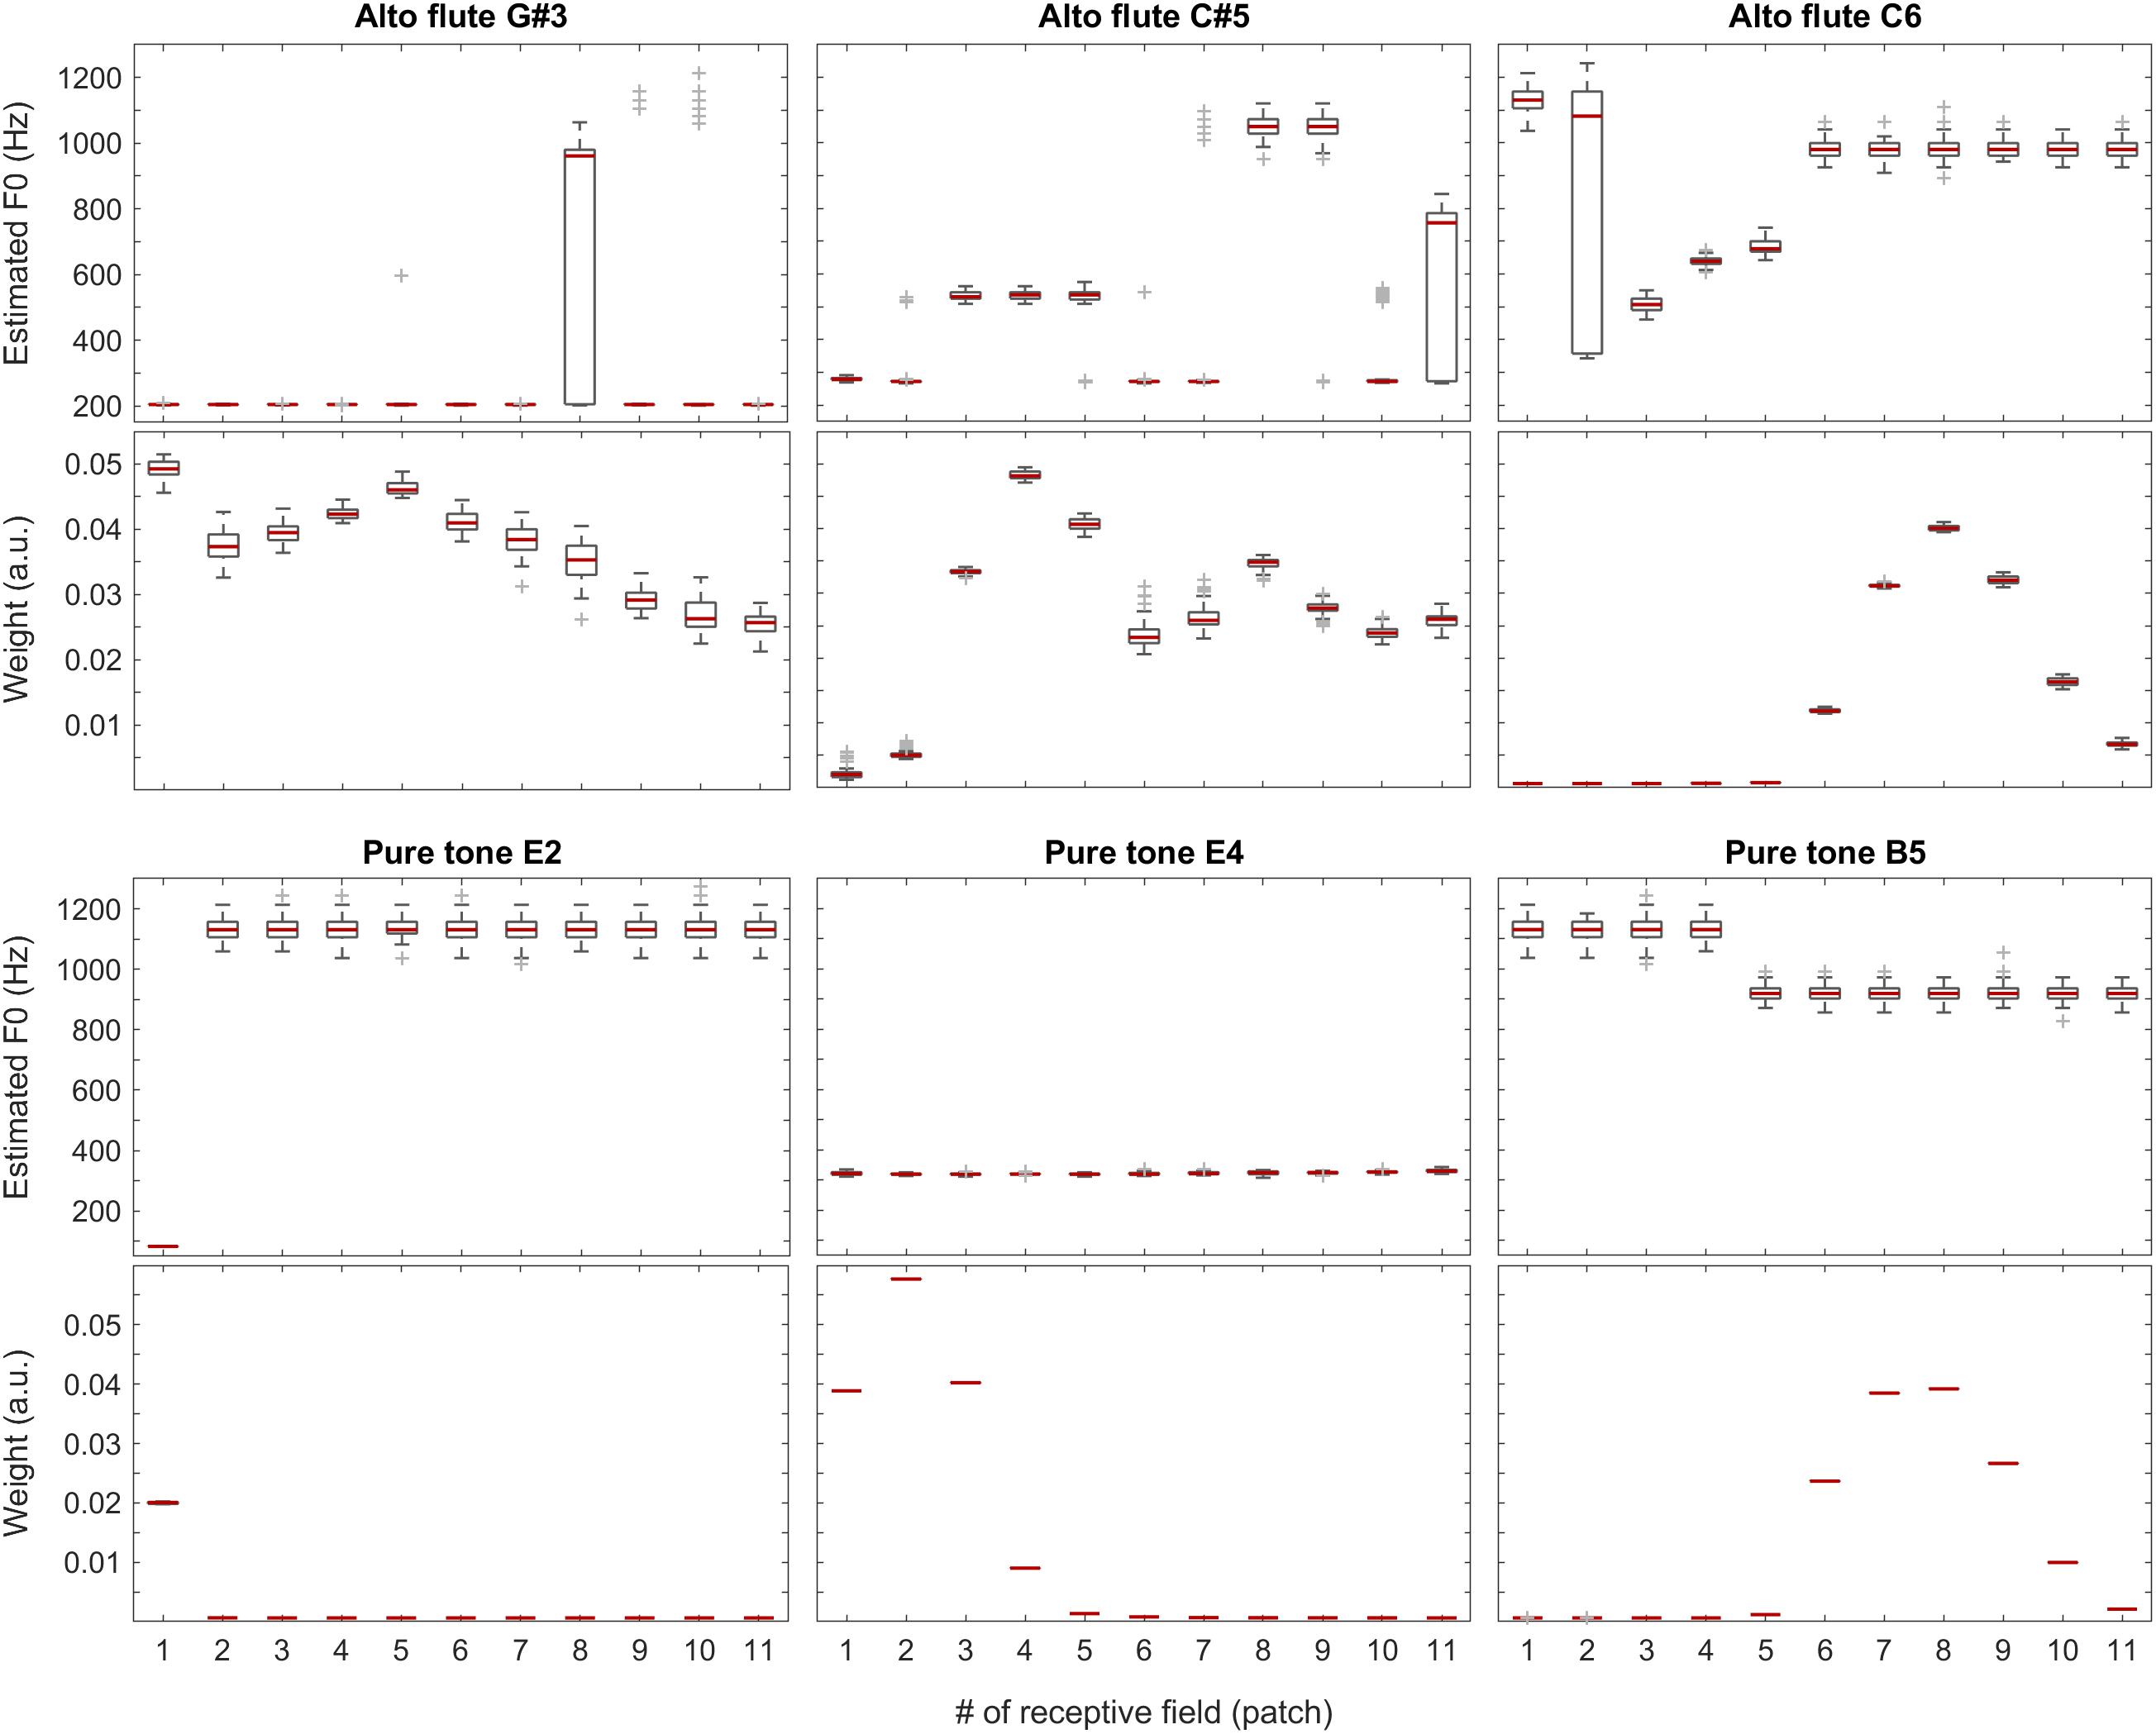
Figure 10. F0 estimates (first and third rows) and weights (second and fourth rows) for all patches over all 100 iterations for the alto flute recordings (top two rows) and pure tones (bottom two rows).
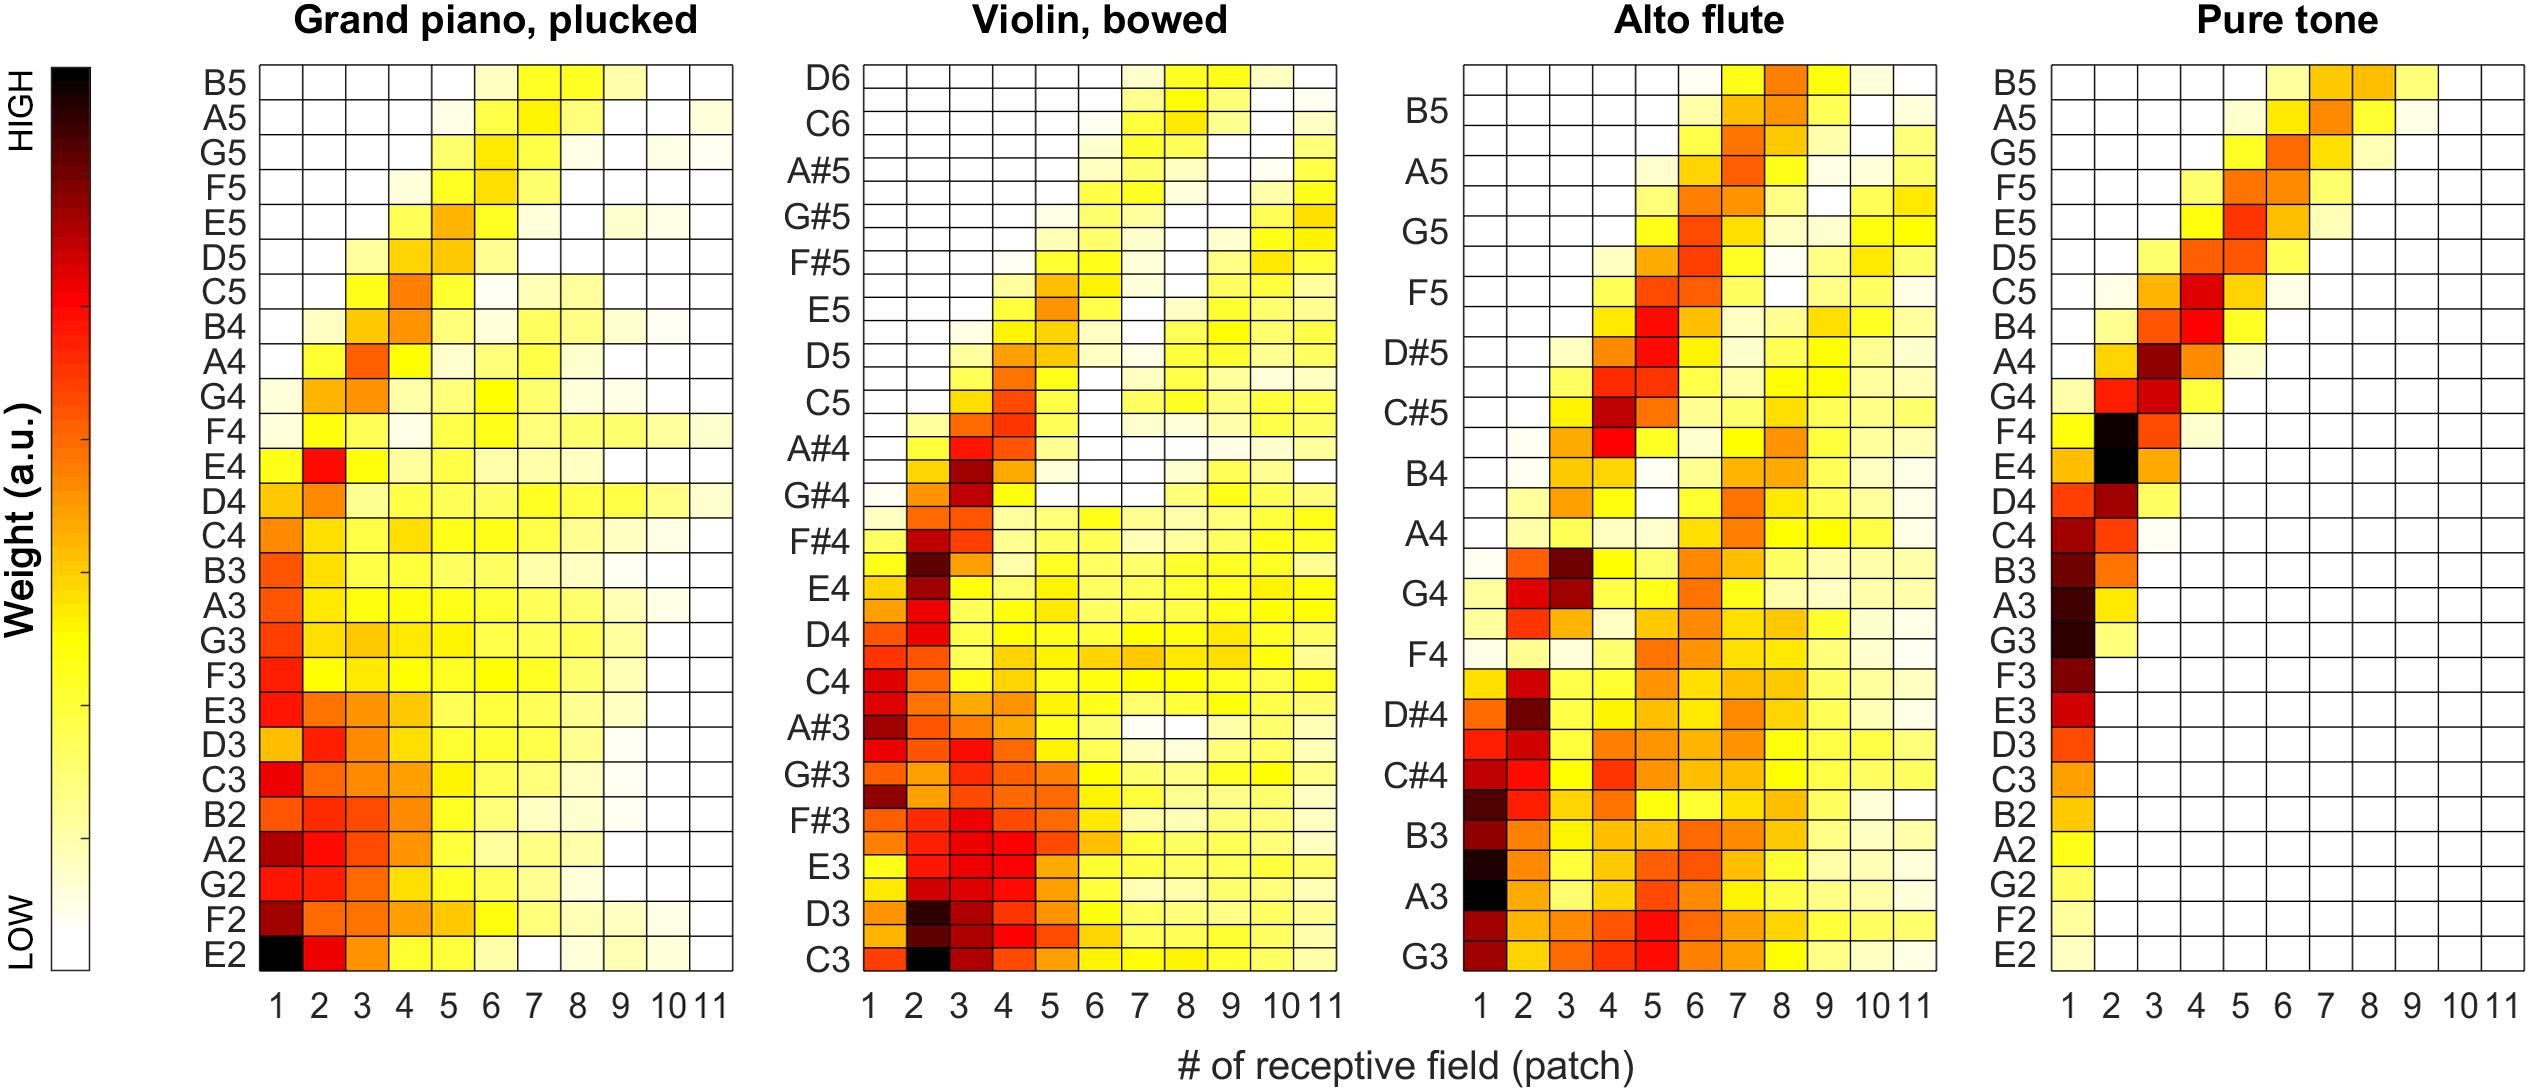
Figure 11. Median of the weights (over all 100 iterations) for the complete tested pitch range for the grand piano (leftmost plot), the violin (second plot), and the alto flute recordings (third plot), and for pure tones (rightmost plot).
The situation is similar but more striking with pure tones for which the data is shown in the bottom half of Figure 10 and in the last plot of Figure 11. With a pure tone (sine wave), there is no harmonic structure in the spectrum, just a well-defined peak, which leaves many weights (deduced from the activity specific to individual frequency bands within the tonotopically organized auditory system) near a value of zero. In the corresponding receptive fields, the single-patch F0 estimates are often not even in the right ballpark; however, they also do not have much impact on the combined F0 estimates due to their low associated weights.
As a summary, in Figure 12, we present a comparison of true fundamental frequencies versus combined F0 estimates (weighted median over 100 iterations) for each tested note within each sound category. It is apparent in the overview that F0 estimates follow true fundamental frequencies remarkably well for all but four test files (female sung vowel a: at C5, C#5, and D#5, and violin at D6). In all other cases, the errors are moderate enough for a subsequent quantizer to predict the played musical note correctly.
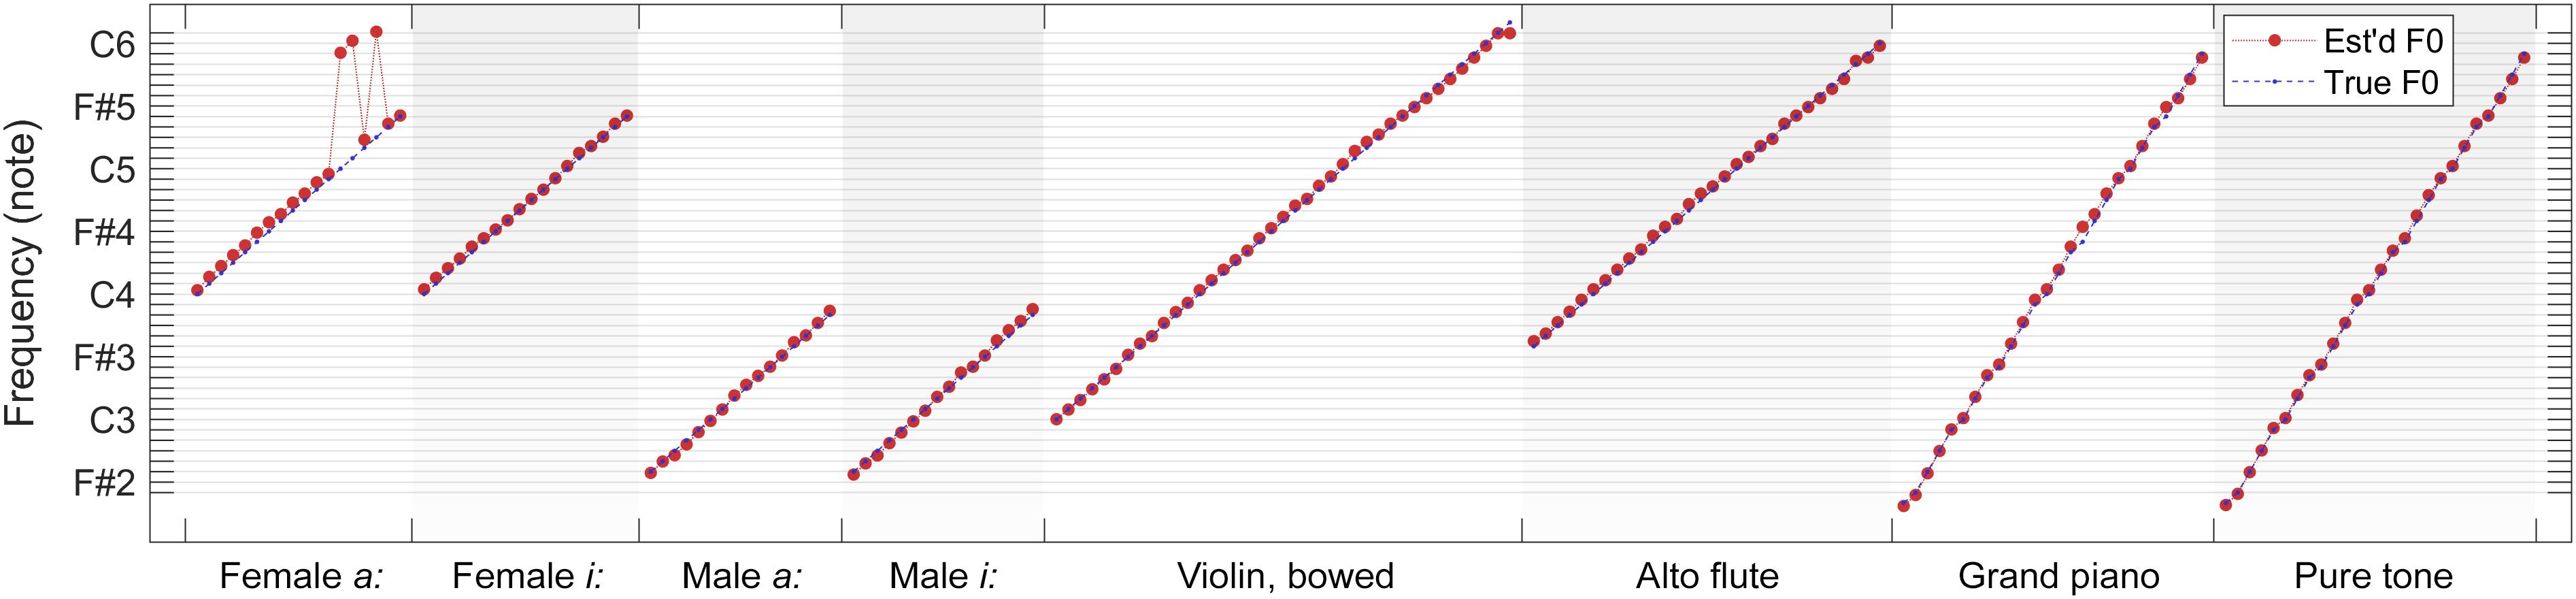
Figure 12. Comparison of true fundamental frequencies versus combined F0 estimates (weighted median over 100 iterations) for each tested note within each sound category.
Discussion
We see our main contribution in adapting Aubie’s model to tone interval-duration estimation. Spatiotemporal trajectories of ANF spike trains are latency-phase rectified by dendritic trees of octopus cells via modeling the execution of mathematical Hough-transforms as, for instance, discussed too for visual processing in the LGN and V1 (Barlow, 1986; Blasdel, 1992; Akima et al., 2017; Alam et al., 2017a). Batteries of interval-tuned neurons estimate tone interval durations of successively spiking octopus cells and a monolayer SNN recombines all ITN votes of different layers for short-term pitch estimation (McGinley et al., 2012; Spencer et al., 2012; Wang and Liu, 2013). The model leaves ample space for discussion. Is the stochastic term reasonable or has the model to be refined and reformulated as it works unambiguously only up to the limit tone F5? Are there neurophysiological correlates, which justify the number of excitatory and inhibitory neurons used to fulfill the optimality criteria constraints? Can unprecise mean FSL short-term votes lead to a resolution of tones beyond F5 by accumulating the votes of many ITNs and integrating the short-term votes over the whole tone duration period? We aim to seek answers to these questions in follow-up studies.
The system can be extended to estimate poly-pitches. In this case, the general softmax operation has to be substituted by a poly-pitch analysis method as in Elvander et al. (2016). A higher auditory authority needs to reconcile the votes from all interval neurons by sorting out false pitch votes and accepting the right ones (Tabas et al., 2019). In such a system, decisions about wrong and right votes are based on empirical knowledge the system would need to have gathered previously, which implies the need for some kind of learning components (Alam et al., 2017b).
Aubie’s model is formulated in NEURON; hence, a targeted neuromorphic hardware needs to support the portability of NEURON code by an application programming interface. Benchmarking of neuromorphic hardware systems helps to define standardized criteria of code mapping, execution, and measuring performance (Ostrau et al., 2020). A few neuromorphic hardware resources are available (Thakur et al., 2018). A hardware emulation is feasible if the hardware specifications support the model and reproduce the results in the optimal case one by one. High-fidelity reproduction of ionic channel rate kinetics with optimal solid state neurons is recently reported (Abu-Hassan et al., 2019). Many neuromorphic systems lack either the AMPA and/or the GABA channels; thus, the model can be implemented only partly (Benjamin et al., 2014; Furber et al., 2014; Merolla et al., 2014; Yang et al., 2015, 2018, 2020). A promising candidate is Spikey with its PyNN application programming interface, which allows execution of NEST and NEURON code (Pfeil et al., 2013). NeuroSoc seems to be the ideal candidate because NMDA, AMPA, and GABA channel kinetics are supported (Mayr et al., 2015; Keren et al., 2019). An accelerated analog neuromorphic hardware system emulating NMDA- and calcium-based non-linear dendrites is a promising candidate too (Schemmel et al., 2017). To realize the large number of MSO, DNLL, IC neurons in hardware is misleading as the realized timers can be easily substituted in hardware with precise clockwork mechanisms. An elegant way to implement the model seems to be a hardware-friendly unsupervised memristive neural network with a weight-sharing mechanism (Tang et al., 2019). Start and stop switches control the settings of time intervals that are collectively memorized in a common stack of memristor cells.
Conclusion
Stimulation based on auditory modeling’s auditory model extended by octopus ensembles and batteries of interval-tuned microcircuits reliably extracts periodicity pitch until the limit tone F5. Multi-vesicular releases triggered by many MSO_ON, MSO_OFF, and DNLL_ON neurons allow a time-accurate collective filling of the vesicle pool at the soma of an ITN. Despite the Poisson-distributed stochastic firing times of the pre-neurons, the vesicular spillover fine-dosed by the threshold setting leads to an ultra-precise stopwatch behavior. In the given working range, the system effectively levers out the pitch dichotomy of place and periodicity.
Data Availability Statement
The raw data supporting the conclusions of this article will be made available by the authors, without undue reservation.
Author Contributions
FK and TH designed and formulated the model, implemented and tested the model, wrote the manuscript, and edited the manuscript.
Conflict of Interest
The authors declare that the research was conducted in the absence of any commercial or financial relationships that could be construed as a potential conflict of interest.
References
Abu-Hassan, K., Taylor, J. D., Morris, P. G., Donati, E., Bortolotto, Z. A., Indiveri, G., et al. (2019). Optimal solid state neurons. Nat. Commun. 10:5309. doi: 10.1038/s41467-019-13177-3
Ahmad, N., Higgins, I., Walker, K. M., and Stringer, S. M. (2016). Harmonic training and the formation of pitch representation in a neural network model of the auditory brain. Front. Comput. Neurosci. 10:24. doi: 10.3389/fncom.2016.00024
Akima, H., Kawakami, S., Madrenas, J., Moriya, S., Yano, M., Nakajima, K., et al. (2017). “Complexity Reduction of Neural Network Model for Local Motion Detection in Motion Stereo Vision,” in Proceedings of the International Conference on Neural Information Processing (Cham: Springer), 830–839.
Akimov, A. G., Egorova, M. A., and Ehret, G. (2017). Spectral summation and facilitation in on and off responses for optimized representation of communication calls in mouse inferior colliculus. Eur. J. Neurosci. 45, 440–459. doi: 10.1111/ejn.13488
Alam, M. S., Jassim, W. A., and Zilany, M. S. (2017a). Radon transform of auditory neurograms: a robust feature set for phoneme classification. IET Signal Process. 12, 260–268.
Alam, M. S., Zilany, M. S., Jassim, W. A., and Ahmad, M. Y. (2017b). Phoneme classification using the auditory neurogram. IEEE Access 5, 633–642.
Aubie, B., Becker, S., and Faure, P. A. (2009). Computational models of millisecond level duration tuning in neural circuits. J. Neurosci. 29, 9255–9270. doi: 10.1523/JNEUROSCI.1085-09.2009
Aubie, B., Sayegh, R., and Faure, P. A. (2012). Duration tuning across vertebrates. J. Neurosci. 32, 6373–6390. doi: 10.1523/JNEUROSCI.5624-11.2012
Bagheri, A., Simeone, O., and Rajendran, B. (2017). “Training probabilistic spiking neural networks with first-to-spike decoding,” in Proceedings of the 2018 IEEE International Conference on Acoustics, Speech and Signal Processing (ICASSP)1 (Calgary: IEEE), 2986–2990.
Baker, C. A., Clemens, J., and Murthy, M. (2019). Acoustic pattern recognition and courtship songs: insights from insects. Annu. Rev. Neurosci. 42, 129–147. doi: 10.1146/annurev-neuro-080317-061839
Bal, R., and Baydas, G. (2009). Electrophysiological properties of octopus neurons of the cat cochlear nucleus: an in vitro study. J. Assoc. Res. Otolaryngol. 10, 281–293. doi: 10.1007/s10162-009-0159-x
Barzelay, O., Furst, M., and Barak, O. (2017). A new approach to model pitch perception using sparse coding. PLoS Comput. Biol. 13:e1005338. doi: 10.1371/journal.pcbi.1005338
Baumann, S., Joly, O., Rees, A., Petkov, C. I., Sun, L., Thiele, A., et al. (2015). The topography of frequency and time representation in primate auditory cortices. eLife 4:e03256. doi: 10.7554/eLife.03256
Baumgarte, F. (1997). A Physiological Ear Model for Auditory Masking Applicable to Perceptual Coding. New York, NY: Audio Engineering Society Convention.
Benjamin, B. V., Gao, P., McQuinn, E., Choudhary, S., Chandrasekaran, A. R., Bussat, J. M., et al. (2014). Neurogrid: A mixed-analog-digital multichip system for large-scale neural simulations. Proc. IEEE 102, 699–716.
Bidelman, G. M. (2013). The role of the auditory brainstem in processing musically relevant pitch. Front. Psychol. 4:264. doi: 10.3389/fpsyg.2013.00264
Blasdel, G. G. (1992). Orientation selectivity, preference, and continuity in monkey striate cortex. J. Neurosci. 12, 3139–3161. doi: 10.1523/JNEUROSCI.12-08-03139.1992
Buhusi, C. V., Oprisan, S. A., and Buhusi, M. (2016). Clocks within clocks: timing by coincidence detection. Curr. Opin. Behav. Sci. 8, 207–213. doi: 10.1016/j.cobeha.2016.02.024
Buonomano, D. (2017). Your Brain is a Time Machine: The Neuroscience and Physics of Time. New York, NY: WW Norton & Company.
Calixto, R., Lenarz, M., Neuheiser, A., Scheper, V., Lenarz, T., and Lim, H. H. (2012). Co-activation of different neurons within an isofrequency lamina of the inferior colliculus elicits enhanced auditory cortical activation. Am. J. Physiol. Heart Circ. Physiol. 108, 1199–210. doi: 10.1152/jn.00111.2012
Cerezuela-Escudero, E., Jimenez-Fernandez, A., Paz-Vicente, R., Dominguez-Morales, M., Linares-Barranco, A., and Jimenez-Moreno, G. (2015). “Musical notes classification with neuromorphic auditory system using FPGA and a convolutional spiking network,” in Proceedings of the 2015 International Joint Conference on Neural Networks (IJCNN) (Killarney: IEEE), 1–7.
derNederlanden, C. M. V. B., Rubio-Garcia, A., Clarkson, E., and Snyder, J. S. (2018). Change detection in complex auditory scenes is predicted by auditory memory, pitch perception, and years of musical training. Psychol. Res. 84, 585–601. doi: 10.1007/s00426-018-1072-x
Destexhe, A., Bal, T., McCormick, D. A., and Sejnowski, T. J. (1996). Ionic mechanisms underlying synchronized oscillations and propagating waves in a model of ferret thalamic slices. J. Neurophysiol. 76, 2049–2070. doi: 10.1152/jn.1996.76.3.2049
Destexhe, A., Mainen, Z. F., and Sejnowski, T. J. (1998). “Kinetic models of synaptic transmission,” in Methods in Neuronal Modeling, eds C. Koch and I. Segev (Cambridge, MA: MIT), 1–25.
Edwards, C. J., Leary, C. J., and Rose, G. (2008). Mechanisms of long-interval selectivity in midbrain auditory neurons: roles of excitation, inhibition and plasticity. J. Neurophysiol. 100, 3407–3416. doi: 10.1152/jn.90921.2008
Elvander, F., Kronvall, T., Adalbj rnsson, S. I., and Jakobsson, A. (2016). An adaptive penalty multi-pitch estimator with self-regularization. Signal Process. 127, 56–70. doi: 10.1016/j.sigpro.2016.02.015
Felmy, F. (2019). “The Nuclei of the Lateral Lemniscus,” in The Oxford Handbook of the Auditory Brainstem, ed. K. Kandler (Oxford: Oxford University Press).
Fisch, K., Schwalger, T., Lindner, B., Herz, A. V., and Benda, J. (2012). Channel noise from both slow adaptation currents and fast currents is required to explain spike-response variability in a sensory neuron. J. Neurosci. 32, 17332–17344. doi: 10.1523/JNEUROSCI.6231-11.2012
Friedrichs, K., Bauer, N., Martin, R., and Weihs, C. (2017). A computational study of auditory models in music recognition tasks for normal-hearing and hearing-impaired listeners. EURASIP J. Audio Speech Music Process. 2017:7.
Furber, S. B., Galluppi, F., Temple, S., and Plana, L. A. (2014). The spinnaker project. Proc. IEEE 102, 652–665. doi: 10.1038/s41551-017-0187-5
Gandolfi, D., Bigiani, A., Porro, C. A., and Mapelli, J. (2020). Inhibitory plasticity: from molecules to computation and beyond. Int. J. Mol. Sci. 21:1805. doi: 10.3390/ijms21051805
George, A. A., Lyons-Warren, A. M., Ma, X., and Carlson, B. A. (2011). A diversity of synaptic filters are created by temporal summation of excitation and inhibition. J. Neurosci. 31, 14721–14734. doi: 10.1523/JNEUROSCI.1424-11.2011
Golding, N. L., and Oertel, D. (2012). Synaptic integration in dendrites: exceptional need for speed. J. Physiol. 590, 5563–5569. doi: 10.1113/jphysiol.2012.229328
Harczos, T. (2015). Cochlear Implant Electrode Stimulation Strategy Based on a Human Auditory Model. Ph.D. dissertation, Ilmenau University of Technology, Ilmenau.
Harczos, T., Chilian, A., and Husar, P. (2013a). Making use of auditory models for better mimicking of normal hearing processes with cochlear implants: the SAM coding strategy. IEEE Trans. Biomed. Circuits Syst. 7, 414–425. doi: 10.1109/TBCAS.2012.2219530
Harczos, T., Chilian, A., Kátai, A., Klefenz, F., Baljić, I., Voigt, P., et al. (2013b). “Making use of auditory models for better mimicking of normal hearing processes with cochlear implants: first results with the SAM coding strategy,” in Proceedings of the International Symposium on Auditory and Audiological Research, Vol. 4, Helsingor, 317–324. doi: 10.1109/TBCAS.2012.2219530
Harczos, T., and Klefenz, F. M. (2018). Modeling pitch perception with an active auditory model extended by octopus cells. Front. Neurosci. 12:660. doi: 10.3389/fnins.2018.00660
Hedwig, B. G. (2016). Sequential filtering processes shape feature detection in crickets: a framework for song pattern recognition. Front. Physiol. 7:46. doi: 10.3389/fphys.2016.00046
Jahr, C. E., and Stevens, C. F. (1990). Voltage dependence of NMDA-activated macroscopic conductances predicted by single-channel kinetics. J. Neurosci. 10, 3178–3182. doi: 10.1523/JNEUROSCI.10-09-03178.1990
Joris, P. X. (2016). “Entracking as a brain stem code for pitch: the butte hypothesis,” in Physiology, Psychoacoustics and Cognition in Normal and Impaired Hearing, eds P. van Dijk, D. Başkent, E. Gaudrain, E. de Kleine, A. Wagner, and C. Lanting (Cham: Springer), 347–354. doi: 10.1007/978-3-319-25474-6_36
Keren, H., Partzsch, J., Marom, S., and Mayr, C. G. (2019). A biohybrid setup for coupling biological and neuromorphic neural networks. Front. Neurosci. 13:432. doi: 10.3389/fnins.2019.00432
Kirst, C., Ammer, J., Felmy, F., Herz, A., and Stemmler, M. (2017). GABA regulates resonance and spike rate encoding via a universal mechanism that underlies the modulation of action potential generation. bioRxiv [Preprint]. doi: 10.1101/206581
Kopp-Scheinpflug, C., Sinclair, J. L., and Linden, J. F. (2018). When sound stops: offset responses in the auditory system. Trends Neurosci. 41, 712–728. doi: 10.1016/j.tins.2018.08.009
Lee, H. Y., Raphael, P. D., Park, J., Ellerbee, A. K., Applegate, B. E., and Oghalai, J. S. (2015). Noninvasive in vivo imaging reveals differences between tectorial membrane and basilar membrane traveling waves in the mouse cochlea. Proc. Natl. Acad. Sci. U.S.A. 112, 3128–3133. doi: 10.1073/pnas.1500038112
Liu, S. C., Rueckauer, B., Ceolini, E., Huber, A., and Delbruck, T. (2019). Event-driven sensing for efficient perception: vision and audition algorithms. IEEE Signal Process. Mag. 36, 29–37.
Majoral, D., Zemmar, A., and Vicente, R. (2018). A model for time interval learning in the purkinje cell. bioRxiv [Preprint]. doi: 10.1371/journal.pcbi.1007601
Manis, P. B., and Campagnola, L. (2018). A biophysical modelling platform of the cochlear nucleus and other auditory circuits: from channels to networks. Hear. Res. 360, 76–91. doi: 10.1016/j.heares.2017.12.017
Mayr, C., Partzsch, J., Noack, M., Hänzsche, S., Scholze, S., Höppner, S., et al. (2015). A biological-realtime neuromorphic system in 28 nm CMOS using low-leakage switched capacitor circuits. IEEE Trans. Biomed. Circuits Syst. 10, 243–254. doi: 10.1109/TBCAS.2014.2379294
Meaud, J., and Grosh, K. (2012). Response to a pure tone in a nonlinear mechanical-electrical-acoustical model of the cochlea. Biophysical J. 102, 1237–1246. doi: 10.1016/j.bpj.2012.02.026
McDougal, R. A., Morse, T. M., Carnevale, T., Marenco, L., Wang, R., Migliore, M., et al. (2017). Twenty years of ModelDB and beyond: building essential modeling tools for the future of neuroscience. J. Comput. Neurosci. 42, 1–10. doi: 10.1007/s10827-016-0623-7
McGinley, M. J., Liberman, M. C., Bal, R., and Oertel, D. (2012). Generating synchrony from the asynchronous: compensation for cochlear traveling wave delays by the dendrites of individual brainstem neurons. J. Neurosci. 32, 9301–9311. doi: 10.1523/JNEUROSCI.0272-12.2012
McLachlan, N. M. (2016). Timbre, pitch, and music. Linguist. Lang. Cogn. Psycholinguist. 1–27. doi: 10.1093/oxfordhb/9780199935345.013.44
Merolla, P. A., Arthur, J. V., Alvarez-Icaza, R., Cassidy, A. S., Sawada, J., Akopyan, F., et al. (2014). A million spiking-neuron integrated circuit with a scalable communication network and interface. Science 345, 668–673. doi: 10.1126/science.1254642
Naud, R., Houtman, D. B., Rose, G. J., and Longtin, A. (2015). Counting on dis-inhibition: a circuit motif for interval counting and selectivity in the anuran auditory system. Am. J. Physiol. Heart Circul. Physiol. 114, 2804–2815. doi: 10.1152/jn.00138.2015
Oertel, D., Cao, X. J., Ison, J. R., and Allen, P. D. (2017). Cellular computations underlying detection of gaps in sounds and lateralizing sound sources. Trends Neurosci. 40, 613–624. doi: 10.1016/j.tins.2017.08.001
Oertel, D., Cao, X. J., and Recio-Spinoso, A. (2019). “The cochlear nuclei: synaptic plasticity in circuits and synapses in the ventral cochlear nuclei,” in The Oxford Handbook of the Auditory Brainstem, ed. K. Kandler (Oxford: Oxford University Press).
Ó’Maoiléidigh, D., and Hudspeth, A. J. (2015). “Vibrational modes and damping in the cochlear partition,” in Proceedings of the 12th International Workshop on the Mechanics of Hearing AIP, Vol. 1703, (Melville, NY: AIP Publishing), doi: 10.1063/1.4939348
Ostrau, C., Klarhorst, C., Thies, M., and Rückert, U. (2020). “Benchmarking of Neuromorphic Hardware Systems,” in Proceedings of the Neuro-Inspired Computational Elements Workshop (NICE’20), Heidelberg.
Opolko, F. J., and Wapnick, J. (1987). McGill University Master Samples [kit]: MUMS. Montreal: McGill University, Faculty of Music.
Oxenham, A. J. (2018). How we hear: the perception and neural coding of sound. Annu. Rev. Psychol. 69, 27–50. doi: 10.1146/annurev-psych-122216-011635
Paton, J. J., and Buonomano, D. V. (2018). The neural basis of timing: distributed mechanisms for diverse functions. Neuron 98, 687–705. doi: 10.1016/j.neuron.2018.03.045
Patterson, R. D., Uppenkamp, S., Johnsrude, I. S., and Griffiths, T. D. (2002). The processing of temporal pitch and melody information in auditory cortex. Neuron 36, 767–776. doi: 10.1016/s0896-6273(02)01060-7
Peng, F., McKay, C., Mao, D., Hou, W., and Innes-Brown, H. (2018). Auditory brainstem representation of the voice pitch contours in the resolved and unresolved components of Mandarin tones. Front. Neurosci. 12:820. doi: 10.3389/fnins.2018.00820
Pfeil, T., Grübl, A., Jeltsch, S., Müller, E., Müller, P., Petrovici, M. A., et al. (2013). Six networks on a universal neuromorphic computing substrate. Front. Neurosci. 7:11. doi: 10.3389/fnins.2013.00011
Rajaram, E., Kaltenbach, C., Fischl, M. J., Mrowka, L., Alexandrova, O., Grothe, B., et al. (2019). Slow NMDA-mediated excitation accelerates offset-response latencies generated via a post-inhibitory rebound mechanism. eNeuro 6:ENEURO.0106-19.2019. doi: 10.1523/ENEURO.0106-19.2019
Ranjan, R., Logette, E., Marani, M., Herzog, M., Tache, V., and Markram, H. (2019). A kinetic map of the homomeric voltage-gated potassium channel (Kv) family. Front. Cell. Neurosci. 13:358. doi: 10.3389/fncel.2019.00358
Rose, G. J. (2018). The numerical abilities of anurans and their neural correlates: insights from neuroethological studies of acoustic communication. Philos. Trans. R. Soc. B Biol. Sci. 373:20160512. doi: 10.1098/rstb.2016.0512
Rowat, P. F., and Greenwood, P. E. (2014). The ISI distribution of the stochastic Hodgkin-Huxley neuron. Front. Comput. Neurosci. 8:111. doi: 10.3389/fncom.2014.00111
Rudnicki, M., and Hemmert, W. (2017). High entrainment constrains synaptic depression levels of an in vivo globular bushy cell model. Front. Comput. Neurosci. 11:16. doi: 10.3389/fncom.2017.00016
Saeedi, N. E., Blamey, P. J., Burkitt, A. N., and Grayden, D. B. (2017). An integrated model of pitch perception incorporating place and temporal pitch codes with application to cochlear implant research. Hear. Res. 344, 135–147. doi: 10.1016/j.heares.2016.11.005
Saremi, A., Beutelmann, R., Dietz, M., Ashida, G., Kretzberg, J., and Verhulst, S. (2016). A comparative study of seven human cochlear filter models. J. Acoust. Soc. Am. 140, 1618–1634. doi: 10.1121/1.4960486
Saremi, A., and Lyon, R. F. (2018). Quadratic distortion in a nonlinear cascade model of the human cochlea. J. Acoust. Soc. Am. 143, EL418–EL424. doi: 10.1121/1.5038595
Schemmel, J., Kriener, L., Müller, P., and Meier, K. (2017). “An accelerated analog neuromorphic hardware system emulating NMDA-and calcium-based non-linear dendrites,” in Proceedings of the 2017 International Joint Conference on Neural Networks (IJCNN) (Anchorage, AK: IEEE), 2217–2226.
Simen, P., Balci, F., Desouza, L., Cohen, J. D., and Holmes, P. (2011). Interval timing by long-range temporal integration. Front. Integr. Neurosci. 5:28. doi: 10.3389/fnint.2011.00028
Simmons, J. A., and Simmons, A. M. (2011). Bats and frogs and animals in between: evidence for a common central timing mechanism to extract periodicity pitch. J. Comp. Physiol. A 197, 585–594. doi: 10.1007/s00359-010-0607-4
Siveke, I., Pecka, M., Seidl, A. H., Baudoux, S., and Grothe, B. (2006). Binaural response properties of low-frequency neurons in the gerbil dorsal nucleus of the lateral lemniscus. J. Neurophysiol. 96, 1425–1440. doi: 10.1152/jn.00713.2005
Spencer, M. J., Grayden, D. B., Bruce, I. C., Meffin, H., and Burkitt, A. N. (2012). An investigation of dendritic delay in octopus cells of the mammalian cochlear nucleus. Front. Comput. Neurosci. 6:83. doi: 10.3389/fncom.2012.00083
Spencer, M. J., Meffin, H., Burkitt, A. N., and Grayden, D. B. (2018). Compensation for traveling wave delay through selection of dendritic delays using spike-timing-dependent plasticity in a model of the auditory brainstem. Front. Comput. Neurosci. 12:36. doi: 10.3389/fncom.2018.00036
Sumner, C. J., Lopez-Poveda, E. A., O’Mard, L. P., and Meddis, R. (2002). A revised model of the inner-hair cell and auditory-nerve complex. J. Acoust. Soc. Am. 111, 2178–2188. doi: 10.1121/1.1453451
Tabas, A., Andermann, M., Schuberth, V., Riedel, H., Balaguer-Ballester, E., and Rupp, A. (2019). Modeling and MEG evidence of early consonance processing in auditory cortex. PLoS Comput. Biol. 15:e1006820. doi: 10.1371/journal.pcbi.1006820
Takizawa, H., Hiroi, N., and Funahashi, A. (2012). Mathematical modeling of sustainable synaptogenesis by repetitive stimuli suggests signaling mechanisms in vivo. PLoS One 7:e51000. doi: 10.1371/journal.pone.0051000
Tang, C., Hamilton, L. S., and Chang, E. F. (2017). Intonational speech prosody encoding in the human auditory cortex. Science 357, 797–801. doi: 10.1126/science.aam8577
Tang, Z., Zhu, R., Lin, P., He, J., Wang, H., Huang, Q., et al. (2019). A hardware friendly unsupervised memristive neural network with weight sharing mechanism. Neurocomputing 332, 193–202.
Thakur, C. S., Molin, J. L., Cauwenberghs, G., Indiveri, G., Kumar, K., Qiao, N., et al. (2018). Large-scale neuromorphic spiking array processors: a quest to mimic the brain. Front. Neurosci. 12:891. doi: 10.3389/fnins.2018.00891
Todd, A. E., Mertens, G., Van de Heyning, P., and Landsberger, D. M. (2017). Encoding a melody using only temporal information for cochlear-implant and normal-hearing listeners. Trends Hear. 21:2331216517739745. doi: 10.1177/2331216517739745
Traub, R. D., and Miles, R. (1991). Neuronal Networks of the Hippocampus, Vol. 777. Cambridge: Cambridge University Press.
Wallace, M. N., Shackleton, T. M., and Palmer, A. R. (2012). Morphological and physiological characteristics of laminar cells in the central nucleus of the inferior colliculus. Front. Neural Circuits 6:55. doi: 10.3389/fncir.2012.00055
Wang, Y., and Liu, S. C. (2013). Active processing of spatio-temporal input patterns in silicon dendrites. IEEE Trans. Biomed. Circuits Syst. 7, 307–318. doi: 10.1109/TBCAS.2012.2199487
Wehr, M., and Zador, A. M. (2003). Balanced inhibition underlies tuning and sharpens spike timing in auditory cortex. Nature 426, 442–446. doi: 10.1038/nature02116
Xu, Y., Thakur, C. S., Singh, R. K., Hamilton, T. J., Wang, R. M., and van Schaik, A. (2018). A FPGA implementation of the CAR-FAC cochlear model. Front. Neurosci. 12:198. doi: 10.3389/fnins.2018.00198
Yamada, D., Ishimoto, H., Li, X., Kohashi, T., Ishikawa, Y., and Kamikouchi, A. (2018). GABAergic local interneurons shape female fruit fly response to mating songs. J. Neurosci. 38, 4329–4347. doi: 10.1523/JNEUROSCI.3644-17.2018
Yang, S., Deng, B., Wang, J., Li, H., Lu, M., Che, Y., et al. (2020). Scalable digital neuromorphic architecture for large-scale biophysically meaningful neural network with multi-compartment neurons. IEEE Trans. Neural Netw. Learn. Syst. 31, 148–162. doi: 10.1109/TNNLS.2019.2899936
Yang, S., Wang, J., Deng, B., Liu, C., Li, H., Fietkiewicz, C., et al. (2018). Real-time neuromorphic system for large-scale conductance-based spiking neural networks. IEEE Trans. Cybern. 49, 2490–2503. doi: 10.1109/TCYB.2018.2823730
Yang, S., Wang, J., Li, S., Deng, B., Wei, X., Yu, H., et al. (2015). Cost-efficient FPGA implementation of basal ganglia and their Parkinsonian analysis. Neural Netw. 71, 62–75. doi: 10.1016/j.neunet.2015.07.017
Yu, T., Schwartz, A., Harris, J., Slaney, M., and Liu, S. C. (2009). “Periodicity detection and localization using spike timing from the AER EAR,” in Proceedings of the IEEE International Symposium on Circuits and Systems, 2009 (Taipei: IEEE), 109–112.
Keywords: periodicity pitch, temporal receptive fields, inter-spike interval tuned microcircuits, first spike latency, periodicity, auditory model
Citation: Klefenz F and Harczos T (2020) Periodicity Pitch Perception. Front. Neurosci. 14:486. doi: 10.3389/fnins.2020.00486
Received: 08 January 2020; Accepted: 20 April 2020;
Published: 04 June 2020.
Edited by:
Anton Civit, University of Seville, SpainReviewed by:
Leslie Samuel Smith, University of Stirling, United KingdomShuangming Yang, Tianjin University, China
Copyright © 2020 Klefenz and Harczos. This is an open-access article distributed under the terms of the Creative Commons Attribution License (CC BY). The use, distribution or reproduction in other forums is permitted, provided the original author(s) and the copyright owner(s) are credited and that the original publication in this journal is cited, in accordance with accepted academic practice. No use, distribution or reproduction is permitted which does not comply with these terms.
*Correspondence: Frank Klefenz, ZnJhbmsua2xlZmVuekBpZG10LmZyYXVuaG9mZXIuZGU=