 Wen Xu1
 Zhongxiang Ding
 Peipei Pang
 Qijun Shen
- 1Department of Radiology, Affiliated Hangzhou First People’s Hospital, Zhejiang University School of Medicine, Hangzhou, China
- 2Department of Radiology, The First Hospital of Zhejiang Province, Zhejiang University School of Medicine, Hangzhou, China
- 3Department of Pharmaceuticals Diagnosis, GE Healthcare, Hangzhou, China
Background: We aimed to construct and validate a nomogram model based on the combination of radiomic features and satellite sign number for predicting intracerebral hematoma expansion.
Methods: A total of 129 patients from two institutions were enrolled in this study. The preprocessed initial CT images were used for radiomic feature extraction. The ANOVA-Kruskal–Wallis test and least absolute shrinkage and selection operator regression were applied to identify candidate radiomic features and construct the Radscore. A nomogram model was developed by integrating the Radscore with a satellite sign number. The discrimination performance of the proposed model was evaluated by receiver operating characteristic (ROC) analysis, and the predictive accuracy was assessed via a calibration curve. Decision curve analysis (DCA) and Kaplan–Meier (KM) survival analysis were performed to evaluate the clinical value of the model.
Results: Four optimal features were ultimately selected and contributed to the Radscore construction. A positive correlation was observed between the satellite sign number and Radscore (Pearson’s r: 0.451). The nomogram model showed the best performance with high area under the curves in both training cohort (0.881, sensitivity: 0.973; specificity: 0.787) and external validation cohort (0.857, sensitivity: 0.950; specificity: 0.766). The calibration curve, DCA, and KM analysis indicated the high accuracy and clinical usefulness of the nomogram model for hematoma expansion prediction.
Conclusion: A nomogram model of integrated radiomic signature and satellite sign number based on noncontrast CT images could serve as a reliable and convenient measurement of hematoma expansion prediction.
Introduction
Intracerebral hemorrhage (ICH) confers a worse prognosis than ischemic stroke, with an overall fatality rate approaching 40% and neurological disability among the survivors (van Asch et al., 2010; Heit et al., 2017). Based on previous findings, the baseline volume and the location of ICH, intraventricular hemorrhage (IVH), Glasgow coma scale score, and age are strongly associated with the outcomes as clinical predictors (Hemphill et al., 2001). Early hematoma expansion is a greater risk factor for increased mortality and poor functional outcomes, which is independent of other defined clinical correlation factors (Delcourt et al., 2012). A remarkable hemorrhage enlargement by more than 33% volume increase within 24 h after the onset of symptoms occurred in 38% of patients with ICH, as has been reported prospectively (Brott et al., 1997). Therefore, as the only modifiable risk factor, early identification of patients with a potential risk of hematoma growth is crucial for targeted therapeutic strategies.
Recently, different imaging characteristics have been successively reported and paved the way for available prediction of hematoma expansion in clinical routine. The computed tomography angiography (CTA) spot sign, as an independent predictor, has been well established and prospectively validated, which turned out to be of limited sensitivity (Demchuk et al., 2012; Dowlatshahi et al., 2016). Besides that, CTA has not yet been a routine measurement for emergency radiology in some institutions, following nephrotoxicity and allergy problems (Caplan, 2016). Rather, several novel markers based on noncontrast CT (NCCT), including blend sign, black hole sign, swirl sign, island sign, and satellite sign, recently gained attention, mainly focused on the heterogeneity and the irregularity of hematoma (Boulouis et al., 2017; Shimoda et al., 2017; Morotti et al., 2019). The satellite sign, which was easy to recognize and clearly defined, was especially proven to be an independent imaging marker for hematoma expansion prediction (Shimoda et al., 2017; Yu et al., 2017). However, these imaging predictors make qualitative or semi-quantitative analysis studies only and caused inevitable deviation due to subjectivity. More objective quantitative indicators should be defined to approach more veracious results. As a promising quantitative method for heterogeneous studies, radiomic analysis has become a new “’hot spot” in cancer researches (Davnall et al., 2012). Radiomic analysis links quantitative imaging features to clinical findings by using machine learning and statistics analysis methods. Machine learning methods, such as logistic regression, support vector machines, random forest, and Bayesian algorithm, have come into a wider use in the field of radiomics (Lambin et al., 2012; Bi et al., 2018; Shen et al., 2018; Khalaf et al., 2019; Zavecz et al., 2020). In oncology, features have already been carried out to assess intratumor heterogeneity in various tumor types through the analysis of pixel or voxel gray level distribution and degree of coarseness for early diagnosis, preoperative grading, and monitoring responses to therapies for prognosis prediction (Lubner et al., 2017b; Bi et al., 2019). However, limited numbers of studies were found focusing on the nononcologic applications of radiomics (Kotze et al., 2014; Ginsburg et al., 2016; Lubner et al., 2017a).
In this study, we hypothesized that radiomic analysis and quantitative satellite sign can identify the associations between the quantitative imaging features and the hematoma pathophysiology and thus effectively and precisely predict intracerebral hematoma expansion in NCCT images. The aim of this study was to establish a quantitative imaging model to predict hematoma expansion and improve the functional outcomes for patients with ICH. We investigated a nomogram model combined with radiomics and quantitative satellite sign to improve the diagnostic performance in early hematoma expansion prediction.
Materials and Methods
Patients
This retrospective study was approved by the Medical Ethics Committee of institution I and II and conducted in accordance with relevant guidelines. Informed consent was waived.
Patients with spontaneous ICH within 6 h since symptom onset and CT recheck within 24 h in between January 2017 and December 2018 were included. The exclusion criteria were the following conditions: (1) patients with ICH secondary to arteriovenous malformation, trauma, aneurysm, tumor, and venous sinus embolism, (2) patients who were receiving anticoagulation treatment, (3) surgery or interventional therapy before the repeat CT scan, (4) image contained severe artifacts, and (5) IVH or subarachnoid hemorrhage is involved. Clinical data were provided by a neurologist, including age, gender, systolic blood pressure, international normalized ratio, time to initial CT scan, activated partial thromboplastin time, and baseline Glasgow Coma Scale score.
CT Examination, ROI Segmentation, and Imaging Evaluation
The CT scans in the two institutions were carried out on different CT scanners, including a GE LightSpeed VCT 64-slice and a GE Optima 540 16-slice. The same CT scanning parameters were performed with a tube voltage of 120 kV, a tube current of 150–300 mA, field of view of 25 cm, and 512 × 512 acquired matrix. The scan ranged from the skull base to the cranium, with a thickness of 5 mm per layer.
The radiomic workflow is summarized in Figure 1. Patients with a volume increase of more than 33% in the follow-up image within 24 h compared to the initial one were automatically defined as hemorrhage expansion (Connor et al., 2015; Hemphill et al., 2015). ITK-SNAP (Version 3.6.0, UPenn) was performed to segment regions of interest (ROI) on CT images. ROI was delineated manually within the confine of each main hematoma by two neuroradiologists with 10 and 12 years of experience, respectively, and who were blind to the data. Before delineation, intensity normalization by histogram matching was applied to eliminate any difference in technologies using ITK software. All pixel gray levels inside the whole ROI objects were extracted for radiomic analysis. No multiple simultaneous spontaneous ICHs were included in the study (Chen et al., 2016). The two neuroradiologists recorded the location of hematoma, the satellite sign number, and the presence or the absence of swirl sign, blend sign, and black hole sign independently during delineation. The definitions of satellite sign, blend sign, black hole sign, and swirl sign were determined according to Al-Nakshabandi (2001), Li et al. (2015, 2016), and Shimoda et al. (2017).
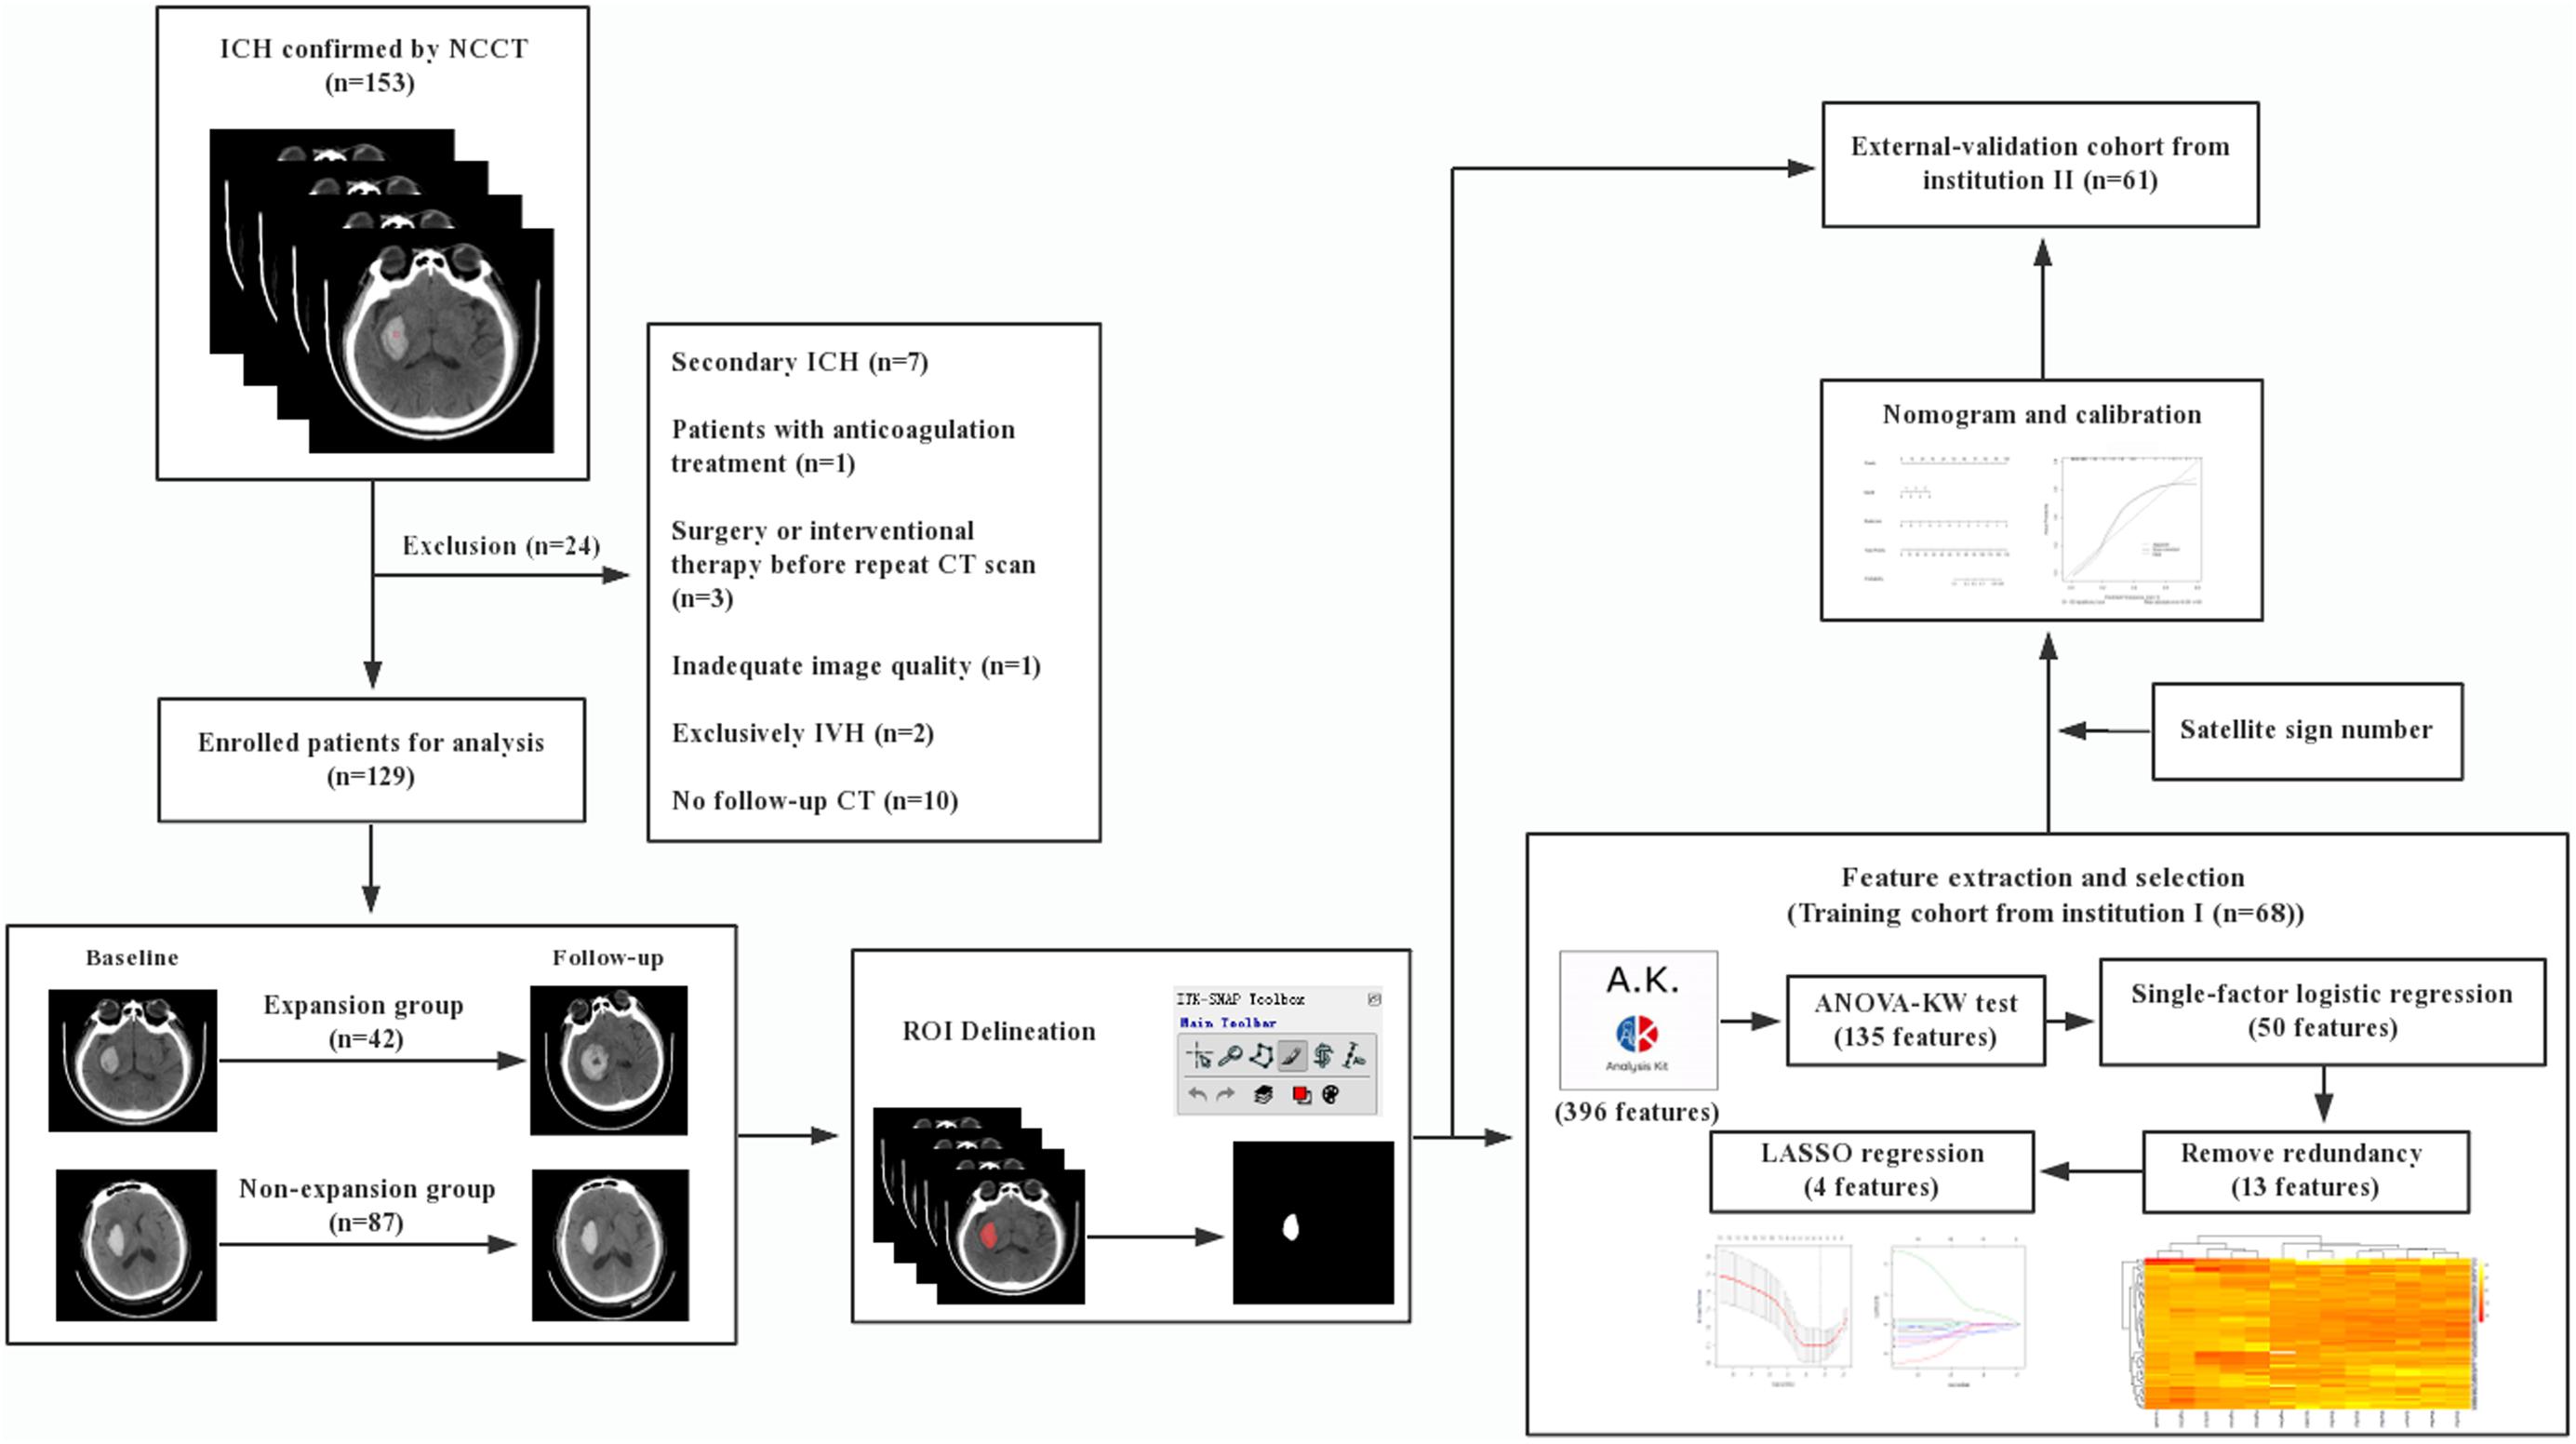
Figure 1. Workflow.
Feature Extraction and Selection
All the radiomic features from ROIs were extracted from preprocessed images using the Artificial Intelligence Kit Version 3.0.1.A (Life Sciences, GE Healthcare, United States), with window width 110 and window level 45. Six main categories were involved, including histogram, morphology, gray level co-occurrence matrix, run length matrix, and gray level zone size matrix. Analysis of variance, Kruskal–Wallis test, and single-factor logistic regression analysis were successively carried out for selecting significant features that were highly correlated. By removing the redundancy with a correlation coefficient of more than 0.90, the radiomic features were further optimally elected. In the final step, least absolute shrinkage and selection operator (LASSO) regression was applied to identify the most nonredundant and robust features among the 396 radiomic features from the training cohort in order to improve the class separability and optimize the representation of lesion heterogeneity. With an increase of the value of λ, relevant features with non-zero coefficients were selected and these contributed to the final LASSO regression. Meanwhile, the best value of λ found by 10-fold cross-validation with a maximum area under the curve (AUC) was used for constructing the regression model. Radscore, which is defined by corresponding non-zero coefficients of the features selected by LASSO, was created by a linear combination of selected features weighted by their coefficients. Respective Radscore was calculated for each patient. Pearson correlation analysis was performed to identify the correlation between satellite sign number and Radscore. The pairwise Pearson correlation coefficients were calculated.
Radiomics Nomogram Building, Calibration, and External Validation
Both Radscore and the satellite sign number were integrated by a multivariate logistic regression-based radiomic model in the training cohort. Furthermore, a nomogram model was constructed based on a multivariate logistic regression analysis to visually demonstrate the probability of a hematoma enlargement. In addition, predictive models based on Radscore or the satellite sign number alone were also developed. The receiver operating characteristic (ROC) analysis and the AUC were applied to evaluate the discrimination performance on the three models. Along with the Hosmer–Lemeshow test measuring for goodness of fit of the nomogram model, predictive accuracy was assessed via a calibration curve in terms of the agreement between the predicted probability of hematoma expansion and the actual one. Then, the constructed model from the training cohort was applied to the external validation cohort. Respective Radscore was also calculated for each patient and further combined with the satellite sign number to validate the nomogram model based on the training cohort. Ultimately, the same process of predictive capability assessment with the ROC analysis and the calibration curve was also carried out in the validation cohort.
Decision curve analysis (DCA) was carried out to evaluate the clinical value of the three models independently on the basis of calculating the net benefit for patients at each threshold probability. By comparing to all strategies or none at all, the best model was elected according to the higher calculated net benefit.
The Kaplan–Meier method was carried out to calculate the survival probabilities. The survival rates were estimated in 30 days. The patients from the two institutions were divided into the expander and the non-expander groups according to the predictive results using the threshold calculated from the training dataset through the Youden Index. Survival was defined as the period from diagnosis to the date of death or the time at which information was last obtained.
Statistical Analysis
Version 3.3.2 of R software and version 13.0 of SPSS software were used in the statistical analysis. Quantitative variables are shown as mean ± SD. Statistical group comparisons of clinical data were performed by independent-samples t-test or χ2 test where appropriate. Intraclass correlation coefficient (ICC) was analyzed for estimating the reliability of inter-observer agreements, which was defined as good consistency if between 0.75 and 1, fair consistency if between 0.4 and 0.75, and poor consistency if under 0.4. The pairwise comparison of ROC curves was performed using z statistic in MedCalc for Windows, version 19.0.7 (MedCalc Software, Ostend, Belgium). Log-rank test was used to compare survival curves, and the results were considered as significant when p < 0.05. The test power (1-β error probability) was calculated by version 3.1.9.7 of G∗Power software. The level of statistical significance was set at a two-sided p-value < 0.05 for all analyses.
Results
Patients Characteristics
As demonstrated in the workflow (Figure 1), between January 2017 and December 2018, a final cohort of 129 patients were selected, and among them, 68 patients from institution I were taken as the training set for the initial prediction model and the other 61 patients from institution II were taken as a prospective independent set for validation.
Tables 1, 2 show the demographic, clinical, and imaging characteristics. No significant difference (p > 0.05) was found in all baseline clinical features and in most of the imaging characteristics between expanders and non-expanders in both the training and the validation cohorts. Moreover, only observer one found a statistical significance in the presence of a swirl sign in the training cohort. No other statistically significant difference of the presence of swirl sign blend sign or black hole sign was observed between groups in both cohorts. However, the patients with and without hematoma expansion had an uneven distribution in the satellite sign number with statistical significance (p < 0.001).
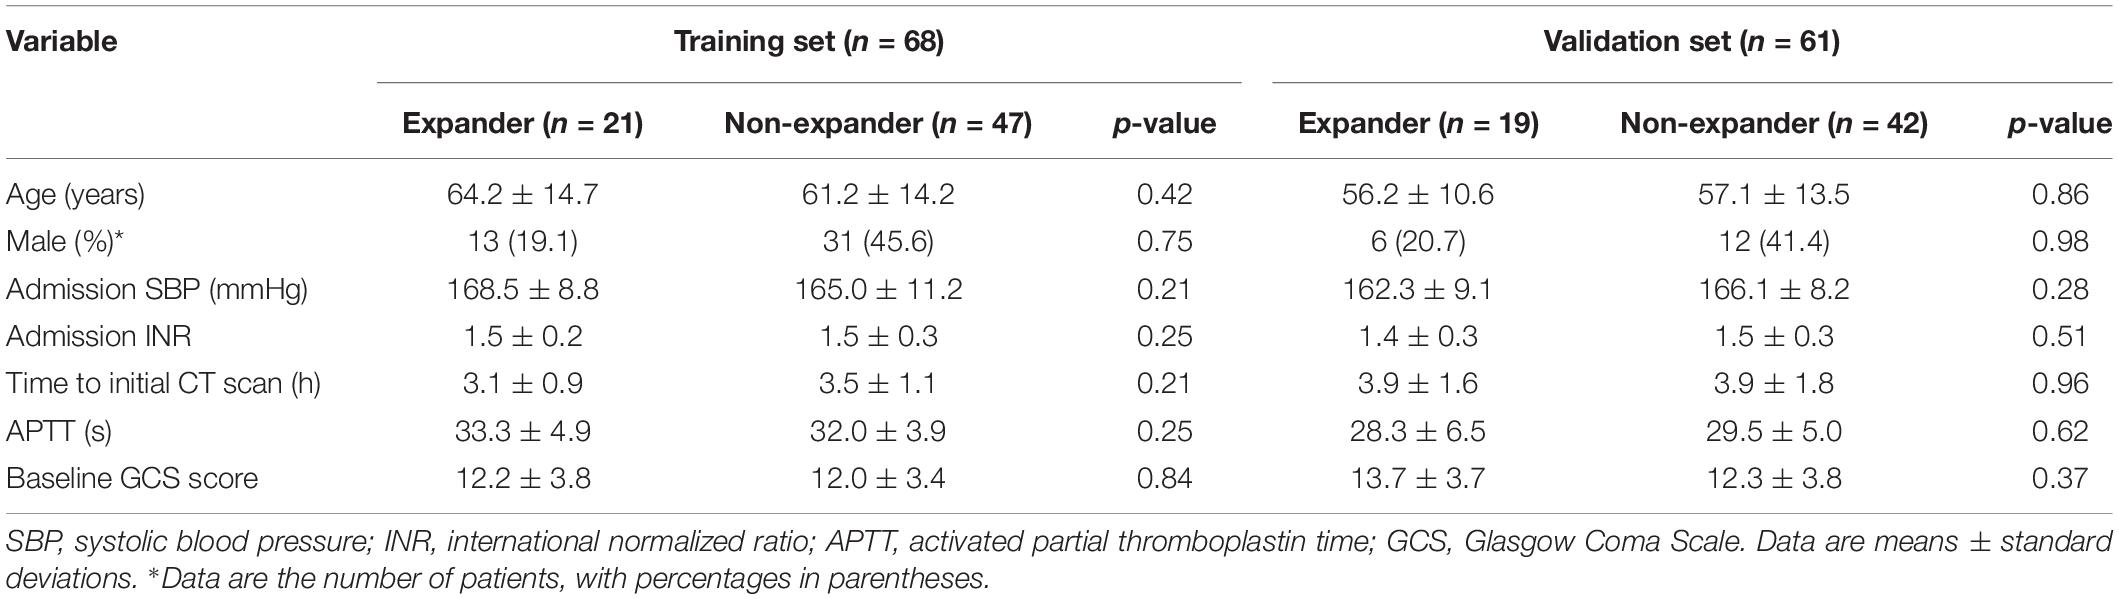
Table 1. Baseline demographic information.
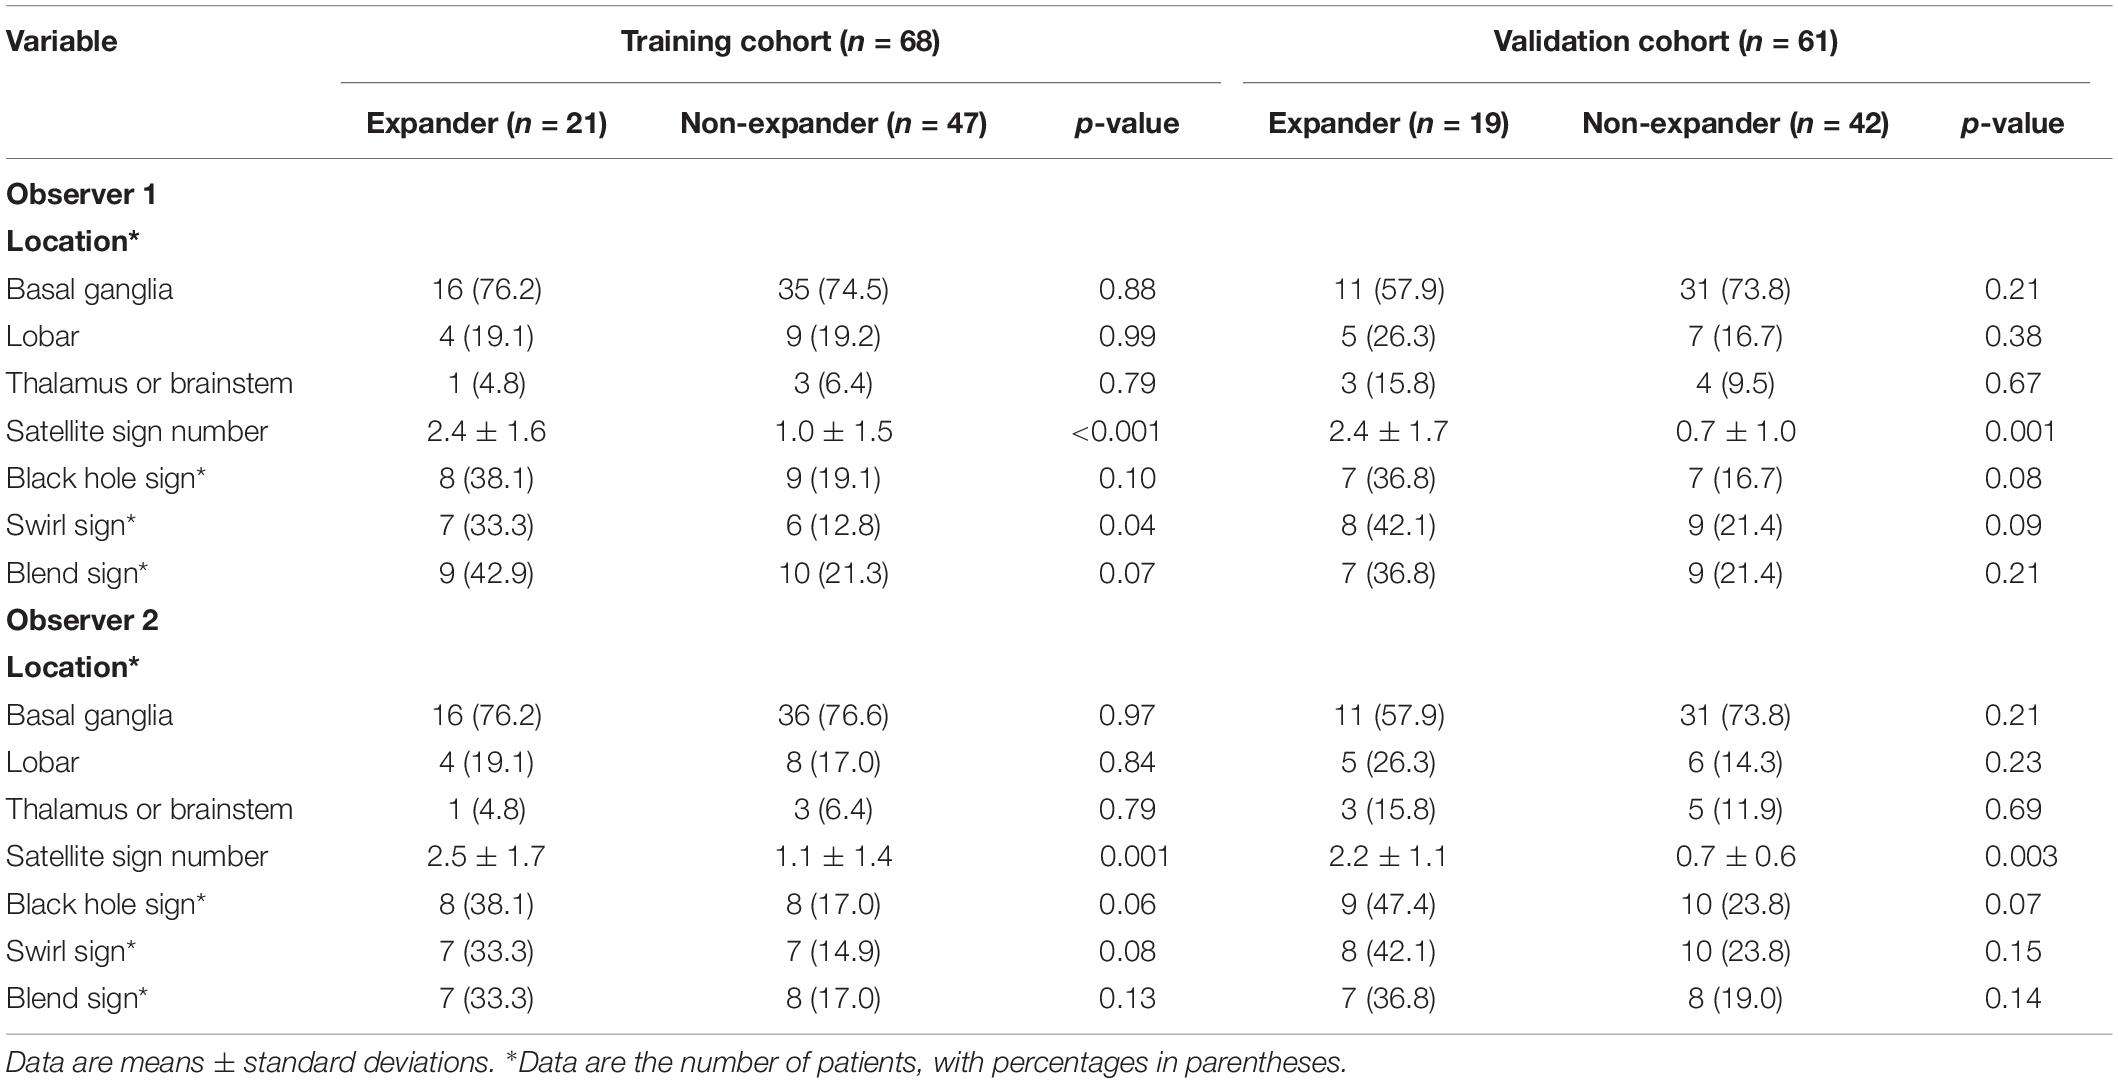
Table 2. Radiological characteristics.
Reproducibility Analysis
Based on the result of the reproducibility analysis by the two radiologists, 349 out of 396 (88.2%) radiomic features had good consistency (ICC ≥ 0.75) on contour-focused segmentation. The number of features with fair consistency (0.75 > ICC ≥ 0.4) and with poor consistency (ICC < 0.4) was 28 (7.1%) and 19 (4.7%), respectively. Supplementary Table S1 demonstrates in detail the consistency of the four selected radiomic features. For identification of the satellite sign, swirl sign, and blend sign, intraobserver reproducibility analysis was also conducted. The ICC for the satellite sign number was 0.910 (95% CI: 0.855 to 0.945), indicating satisfactory consistency. By contrast, the interrater agreement between the two neuroradiologists for swirl sign, blend sign, and black hole sign was 0.738 (95% CI: 0.575 to 0.838), 0.735 (95% CI: 0.570 to 0.836), and 0.791 (95% CI: 0.700 to 0.854), respectively. Since there is excellent consistency between the two segmentation data as well as the satellite sign number evaluation, data from the neuroradiologist with 12 years of experience were finally submitted for further analysis.
Radscore and Nomogram Building
Supplementary Figure S1A shows the heat map based on feature distribution after redundancy removal. The transparent clustering characteristics between rows implied a high differential capacity of distinguishing between hematoma expanders and non-expanders. Indicated between columns is the clustering identification of the former four features and the latter eight features, respectively. Four features were finally selected by 10-fold cross-validation for ensuring robustness and preventing overfitting (Supplementary Figures S1B,C). The differences of the four candidate features between expanders and non-expanders were all remarkably statistically significant (Figure 2). These features were then constructed by a fitting calculation formula for Radscore.
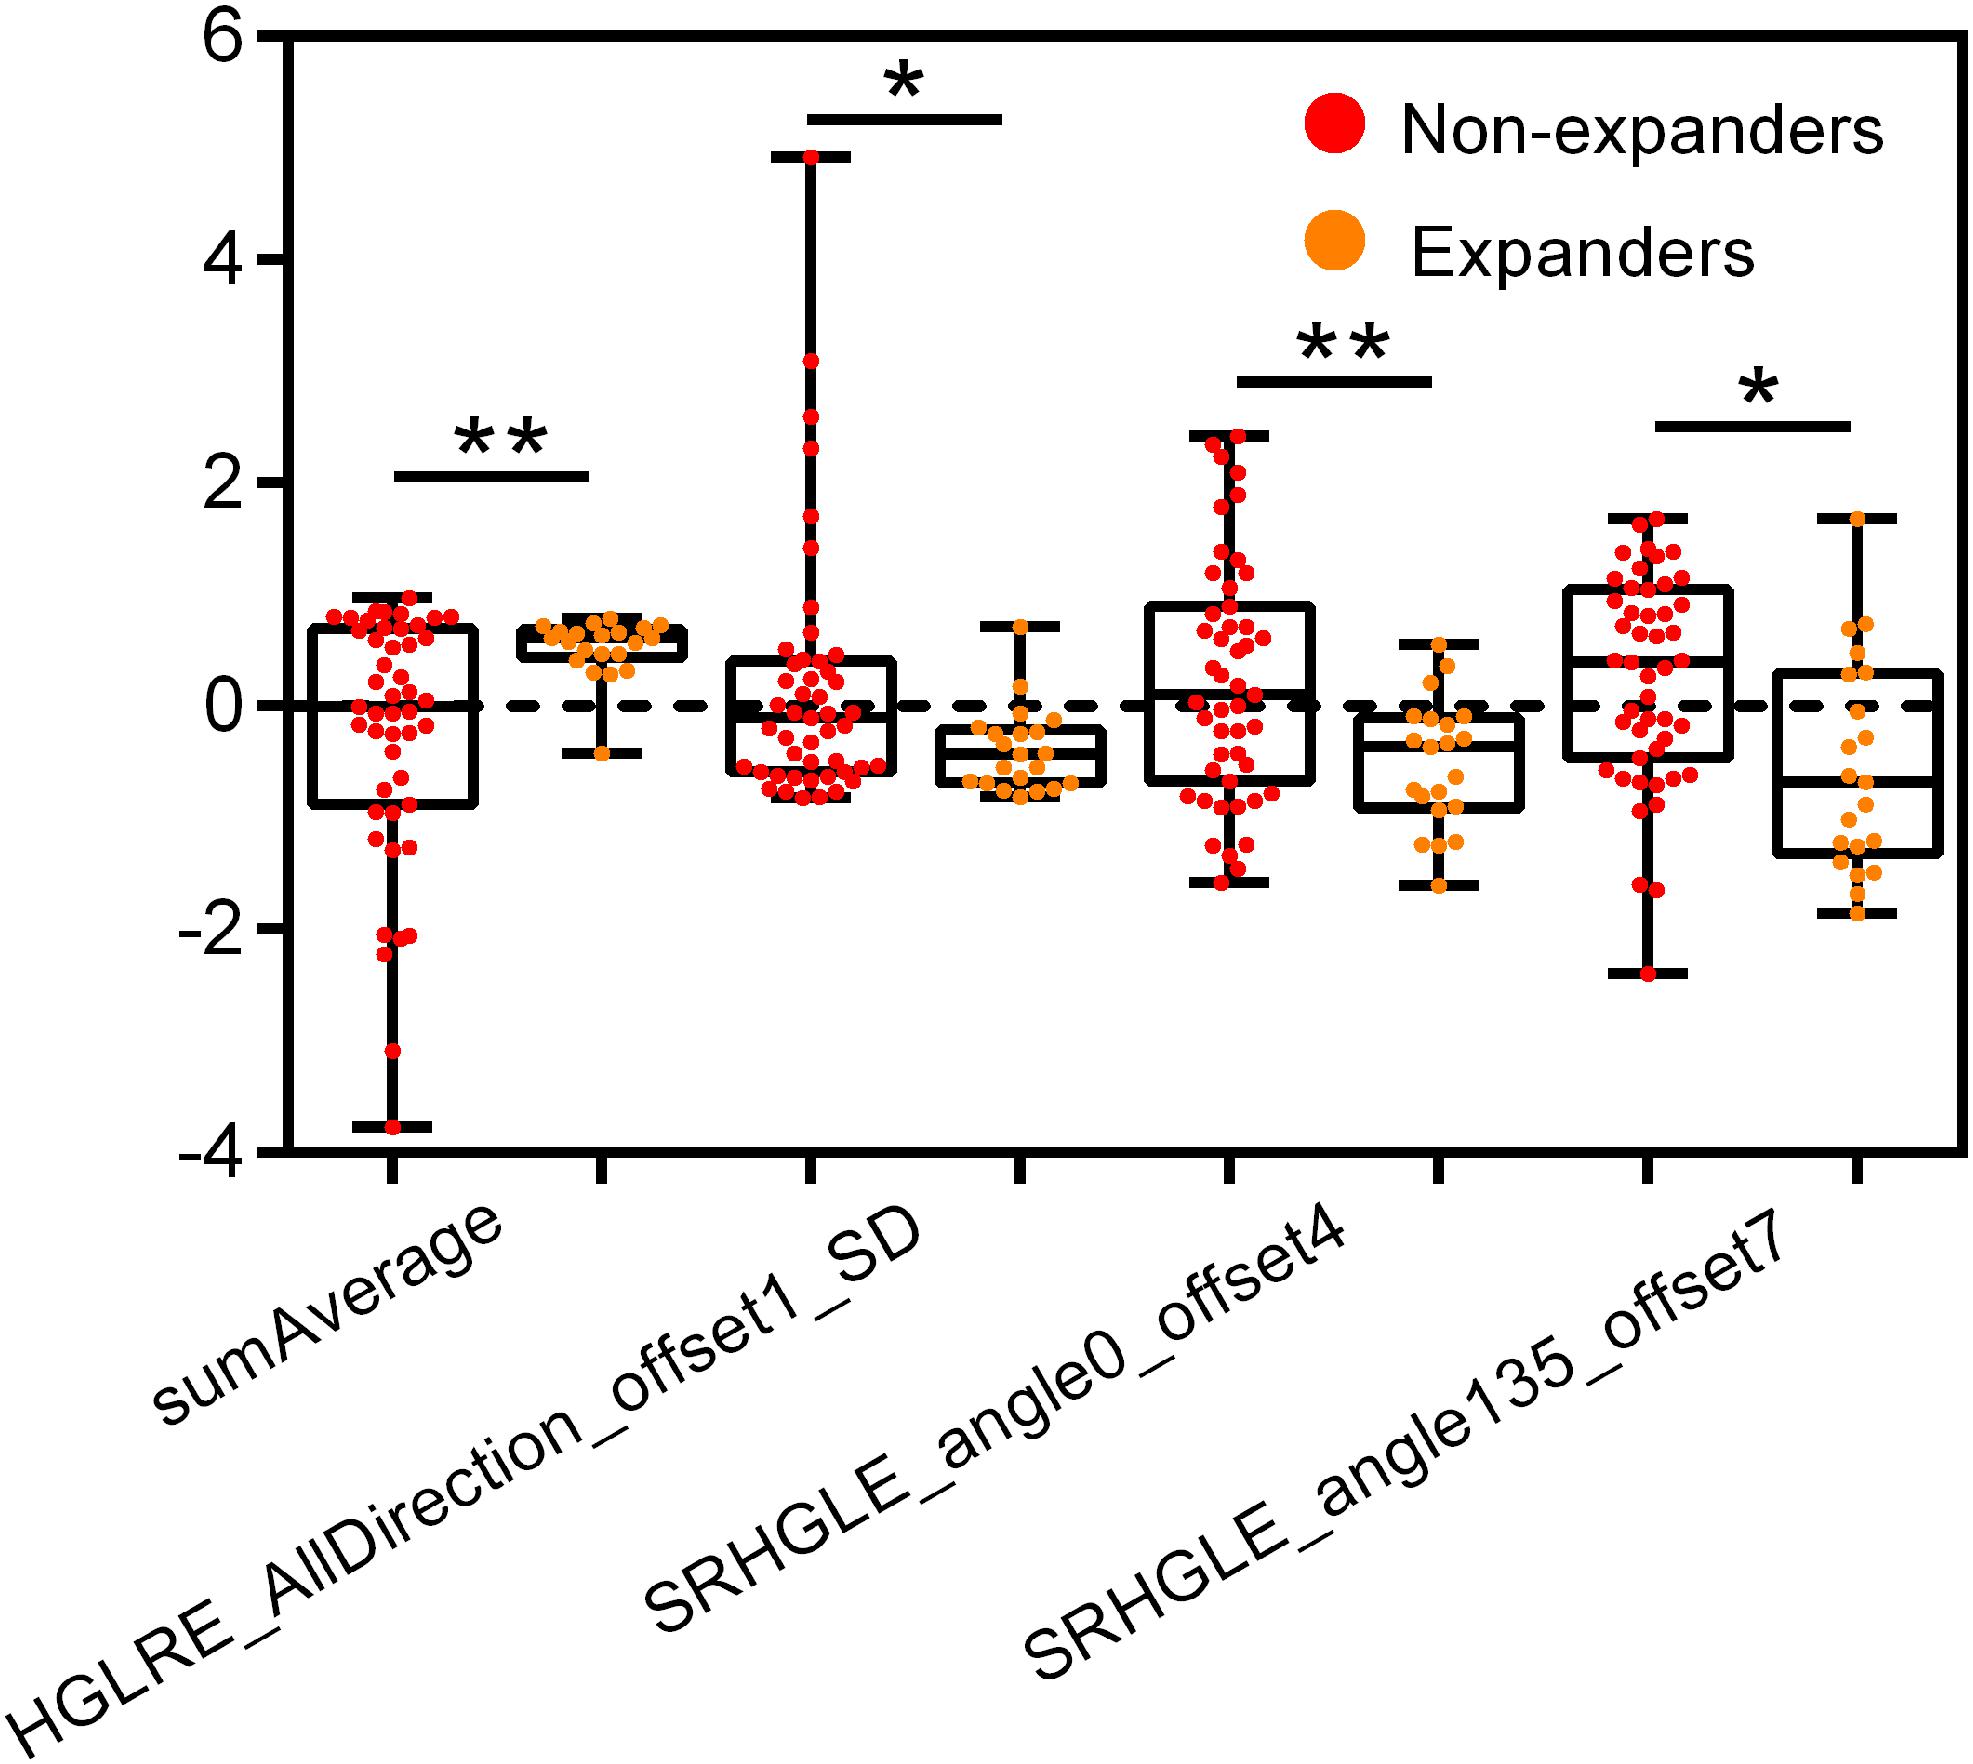
Figure 2. Univariate analysis of four candidate features for hematoma expansion prediction in the training cohort. HGLRE, high gray level run emphasis, SRHGLE, short run high gray level emphasis. *p < 0.01, **p < 0.001.
From the pairwise Pearson correlative analysis, the satellite sign number was observed to be positively correlated to the corresponding Radscore with a correlation coefficient of 0.482 (p < 0.001, 95% CI: 0.272 to 0.649) (Figure 3). The multivariable logistic regression analysis was generated on the basis of the Radscore and the satellite sign number. The nomogram model was conducted to visualize the results of the multivariable logistic regression analysis (Figure 4A).
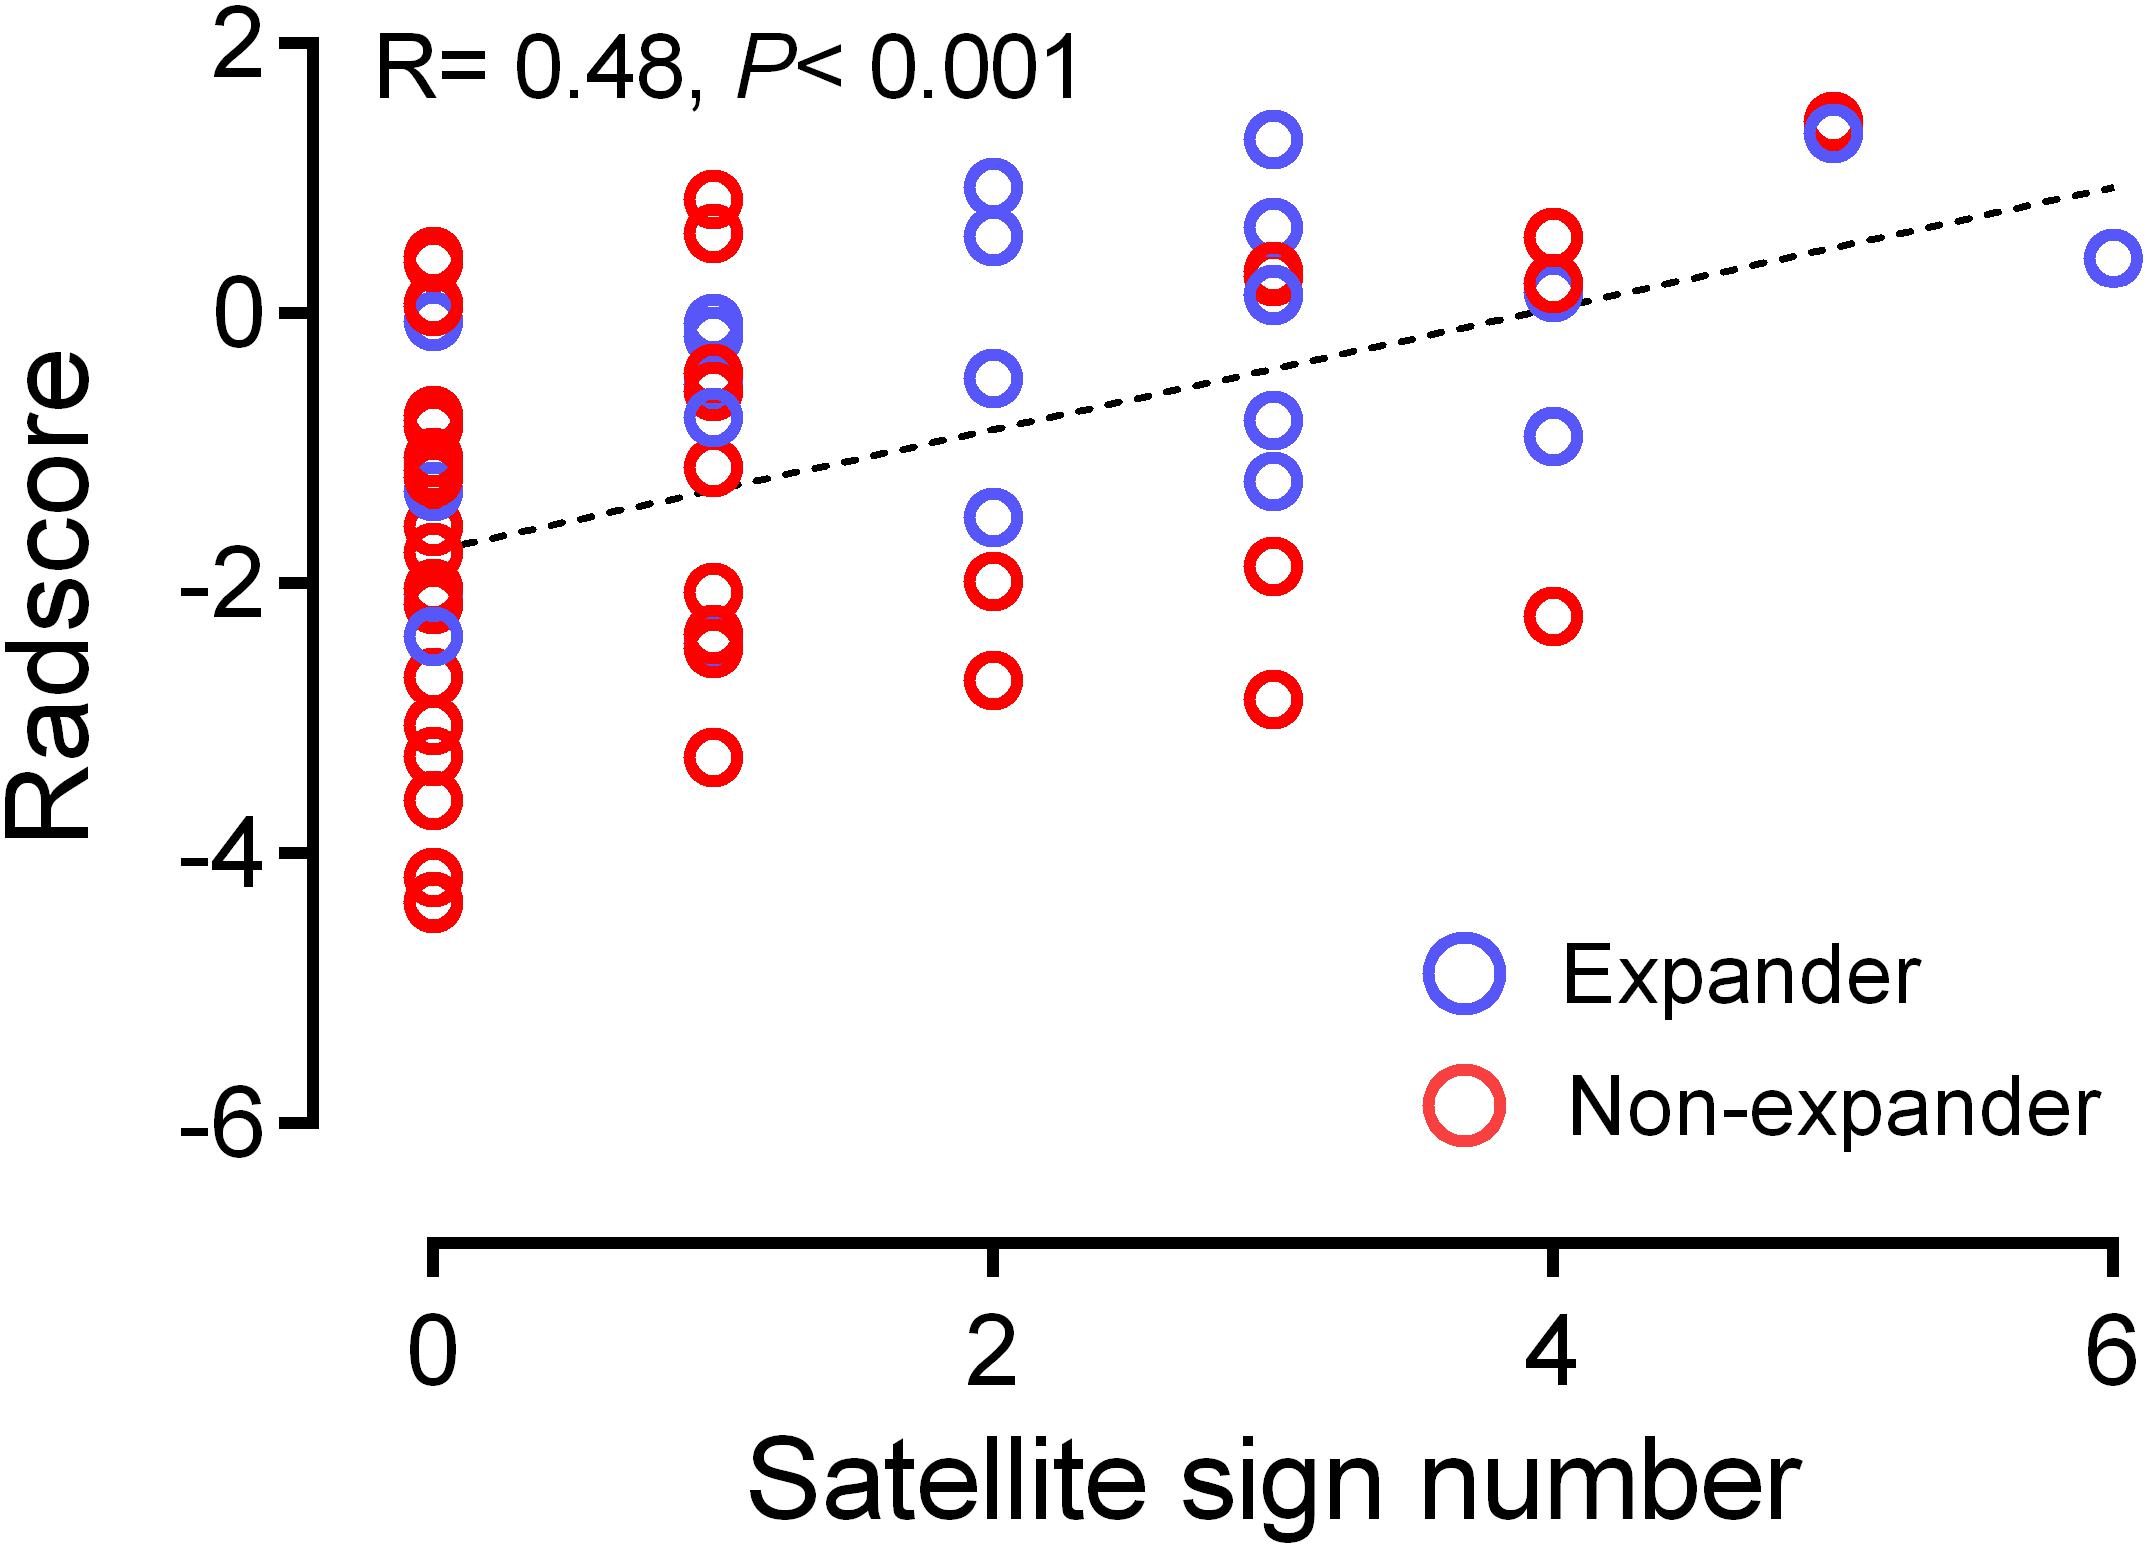
Figure 3. Correlation between satellite sign number and Radscore based on Pearson correlation analysis. The mean absolute correlation was 0.482 (p < 0.001, 95% CI 0.272 to 0.649).
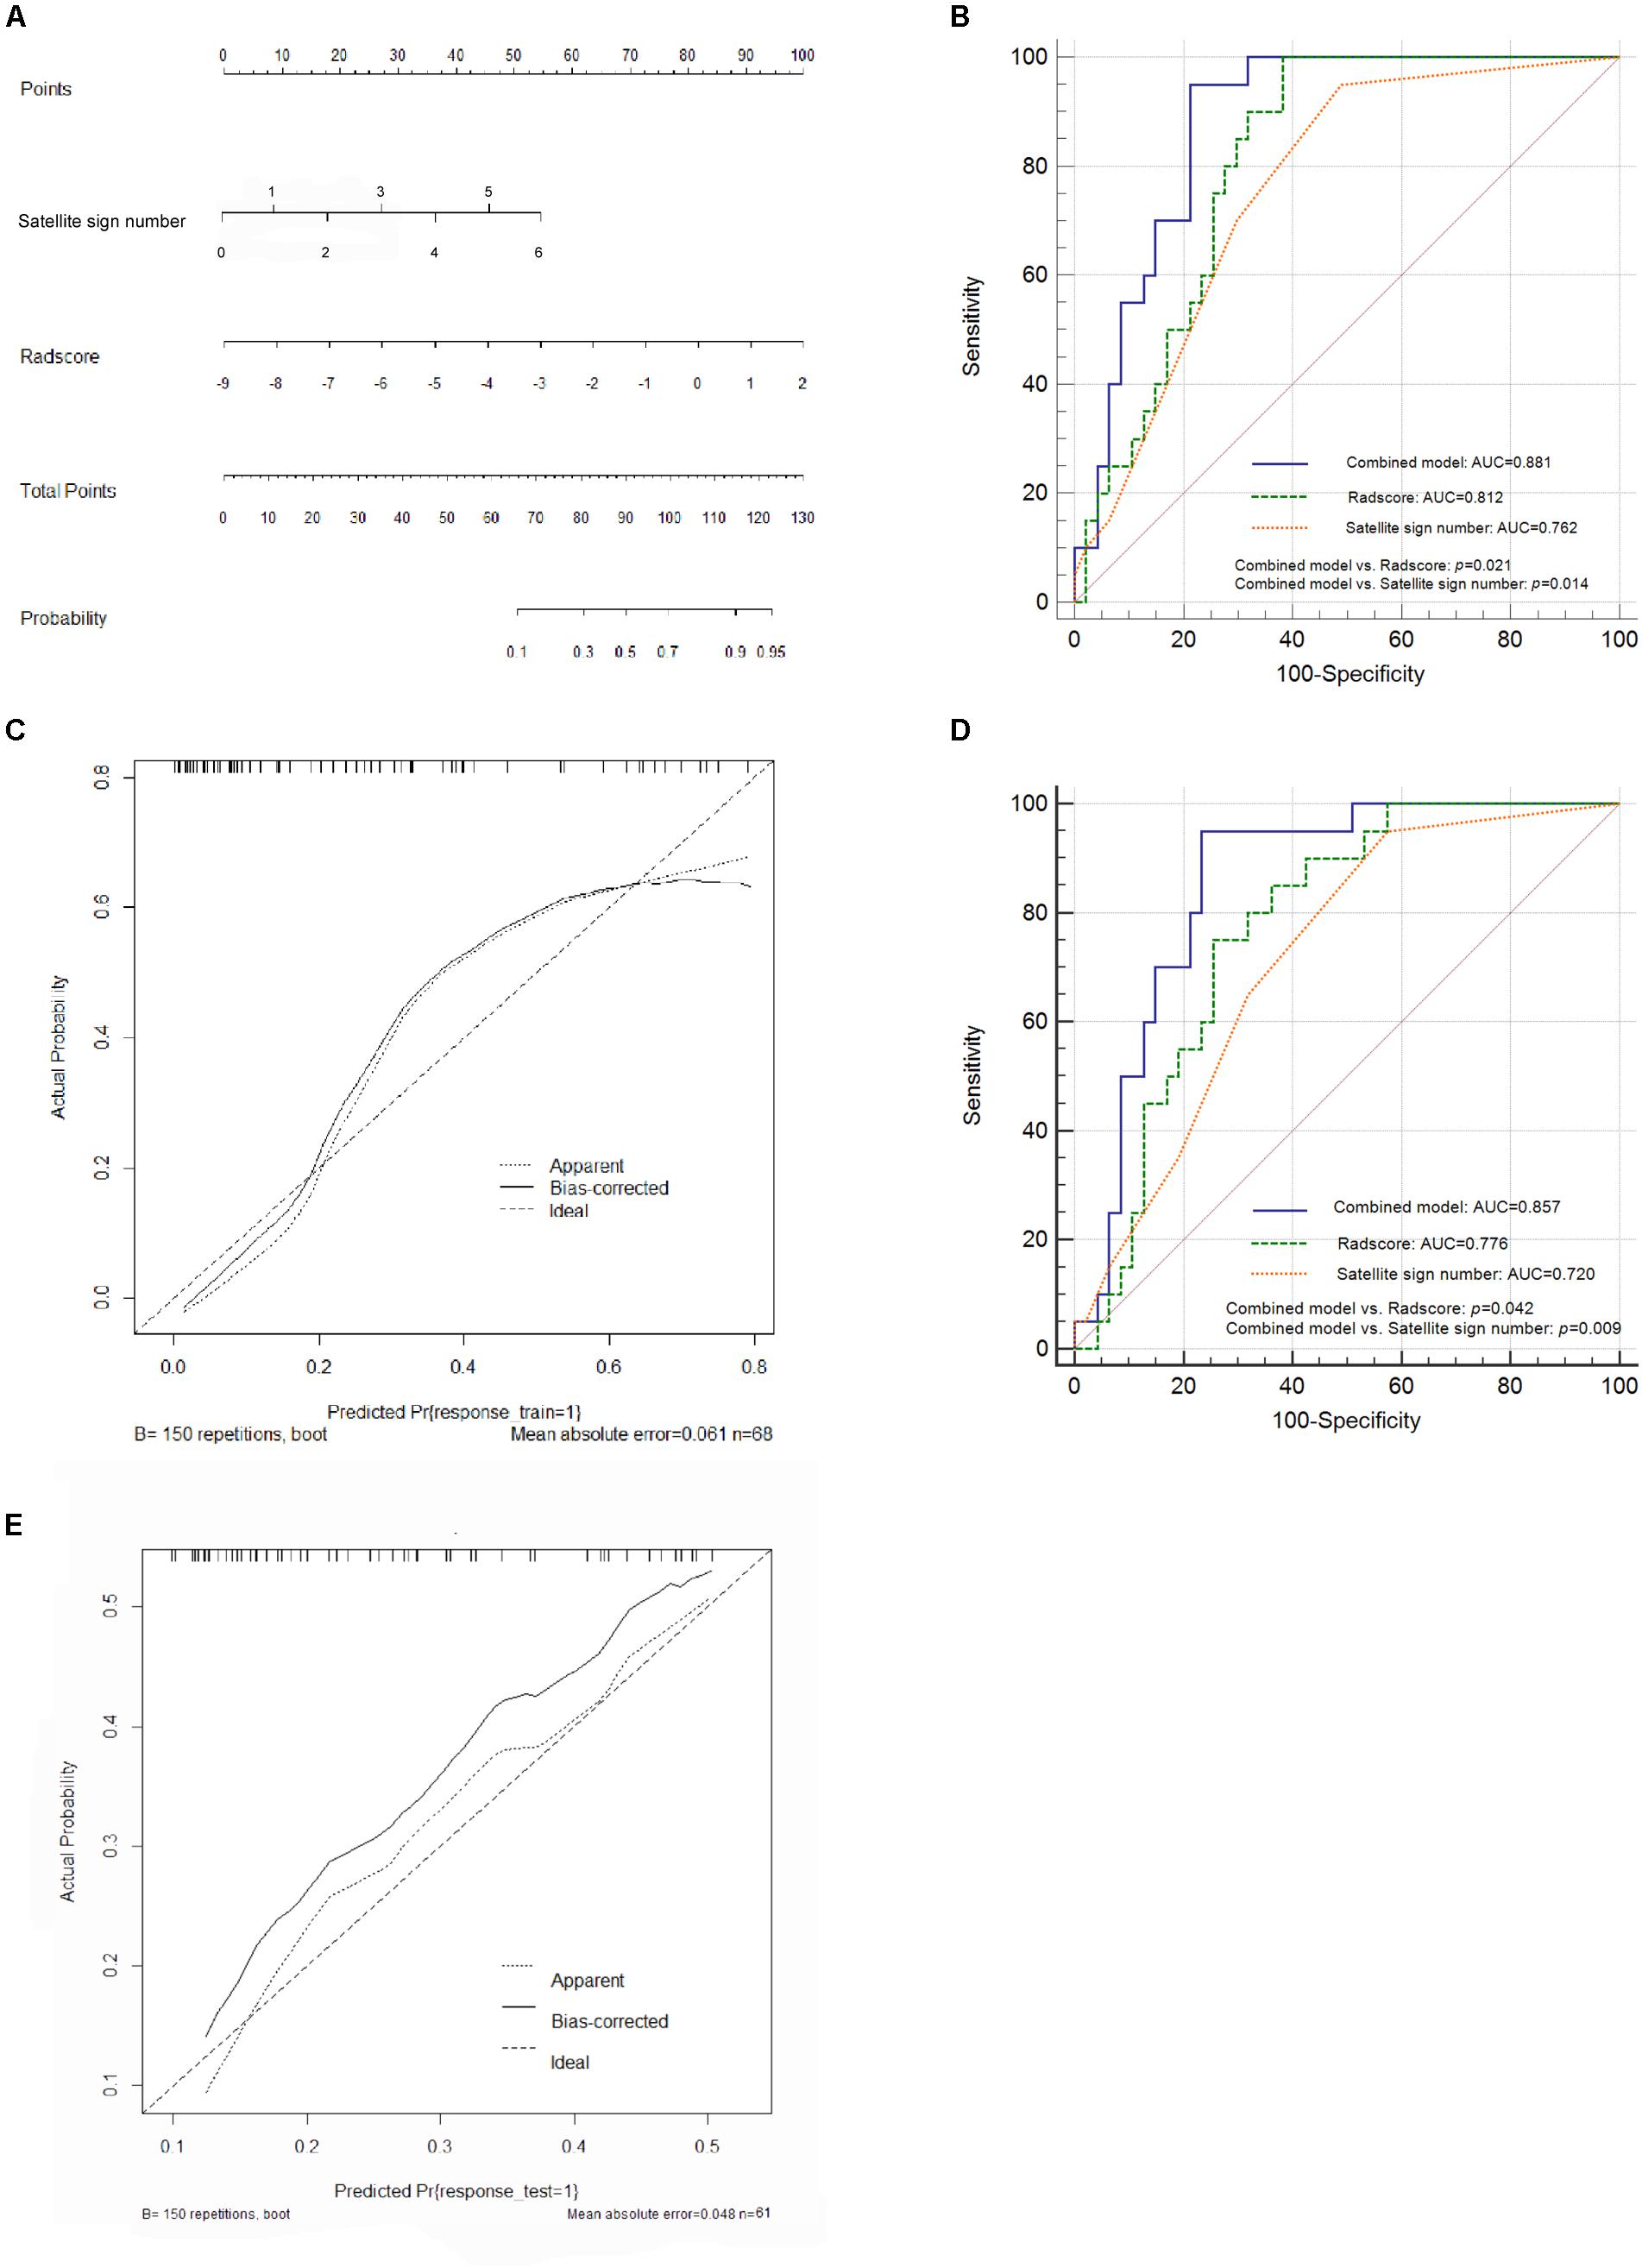
Figure 4. Nomogram construction and performance of the combined model in both cohorts. (A) Combined nomogram based on the training cohort. (B) Pairwise comparison of receiver operating characteristic (ROC) curves for Radscore, satellite sign number and the nomogram model in the training cohort. (C) Corresponding calibration curve in the training cohort. (D) Pairwise comparison of ROC curves in the external validation cohort. (E) Calibration curve of the nomogram model in the validation cohort.
A further validation was carried out through ROC analysis. Compared to the Radscore (0.812, 95% CI: 0.698 to 0.897, sensitivity: 0.992, specificity: 0.617) and the satellite sign number (0.762, 95% CI: 0.643 to 0.858, sensitivity: 0.950, specificity: 0.511) alone, the combination of the two yielded an even better performance in the prediction of hematoma expansion as well as an increased AUC of 0.881 (95% CI: 0.779–0.947, sensitivity: 0.973, specificity: 0.787) in the training cohort (Figure 4B). The nomogram model showed a statistically significant improvement in the pairwise comparison of ROC curves; however, the difference between the Radscore and the satellite sign number has no statistical significance (Figure 4B). Figure 4C illustrates the corresponding calibration curve and the Hosmer–Lemeshow test of the nomogram model in the training cohort (p > 0.05). The nomogram model obviously showed a good agreement between the predicted risk and the observed one, indicating a high accuracy of the model in hematoma expansion prediction. The test power (1-β) was 0.99, which verified the reliability and the accuracy of the results (Supplementary Figure S2).
Performance on the External Validation Cohort
According to the ROC analysis, the nomogram model yielded a higher AUC value (0.857, 95% CI: 0.750–0.931, sensitivity: 0.950, specificity: 0.766) than the Radscore-based model (0.776, 95% CI: 0.657 to 0.868, sensitivity: 0.750, specificity: 0.745) and the satellite sign number (0.720, 95% CI: 0.597 to 0.823, sensitivity: 0.950, specificity: 0.426) in the external validation cohort. Consistent results were shown in the pairwise comparison of ROC curves (Figure 4D). Figure 4E illustrates the calibration curve of the proposed nomogram model based on the validation cohort, which suggested a favorable predictive performance satisfactorily consistent with the ideal curve.
DCA was conducted to assess the clinical utility of the nomogram model (Figure 5). According to the decision curve, the nomogram model (red) demonstrated improved hematoma expansion prediction with more areas shown in the validation cohort compared to that derived from the Radscore or the satellite sign number alone (blue and green).
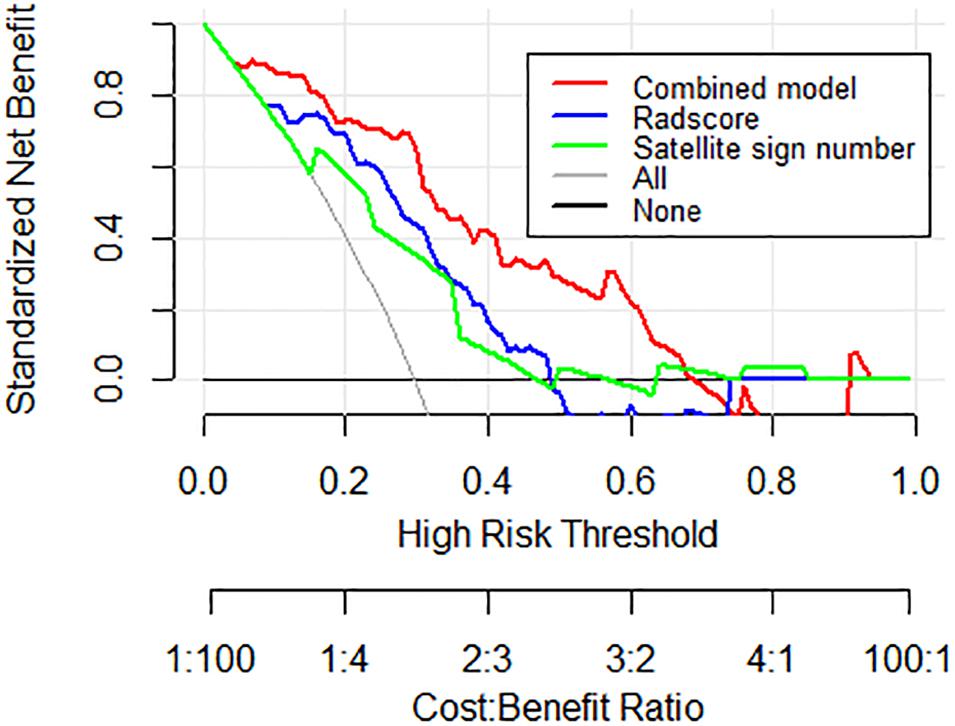
Figure 5. Decision curve analysis for the nomogram model in the external validation cohort. The gray line stands for the assumption that all patients developed hematoma expansion, and the black line represents the assumption that no patient had hematoma expansion. Compared to other models, the highest curve of the nomogram model with more area is the optimal decision making for maximal net benefit in hematoma expansion prediction.
The Kaplan–Meier survival analysis showed approximate survival rates between actual subjects and predicted ones. Furthermore, a significant difference was found not only between the actual expander and non-expander groups but also between predicted groups, which suggested the prognostic value of the combined nomogram model (Figure 6, p < 0.001).
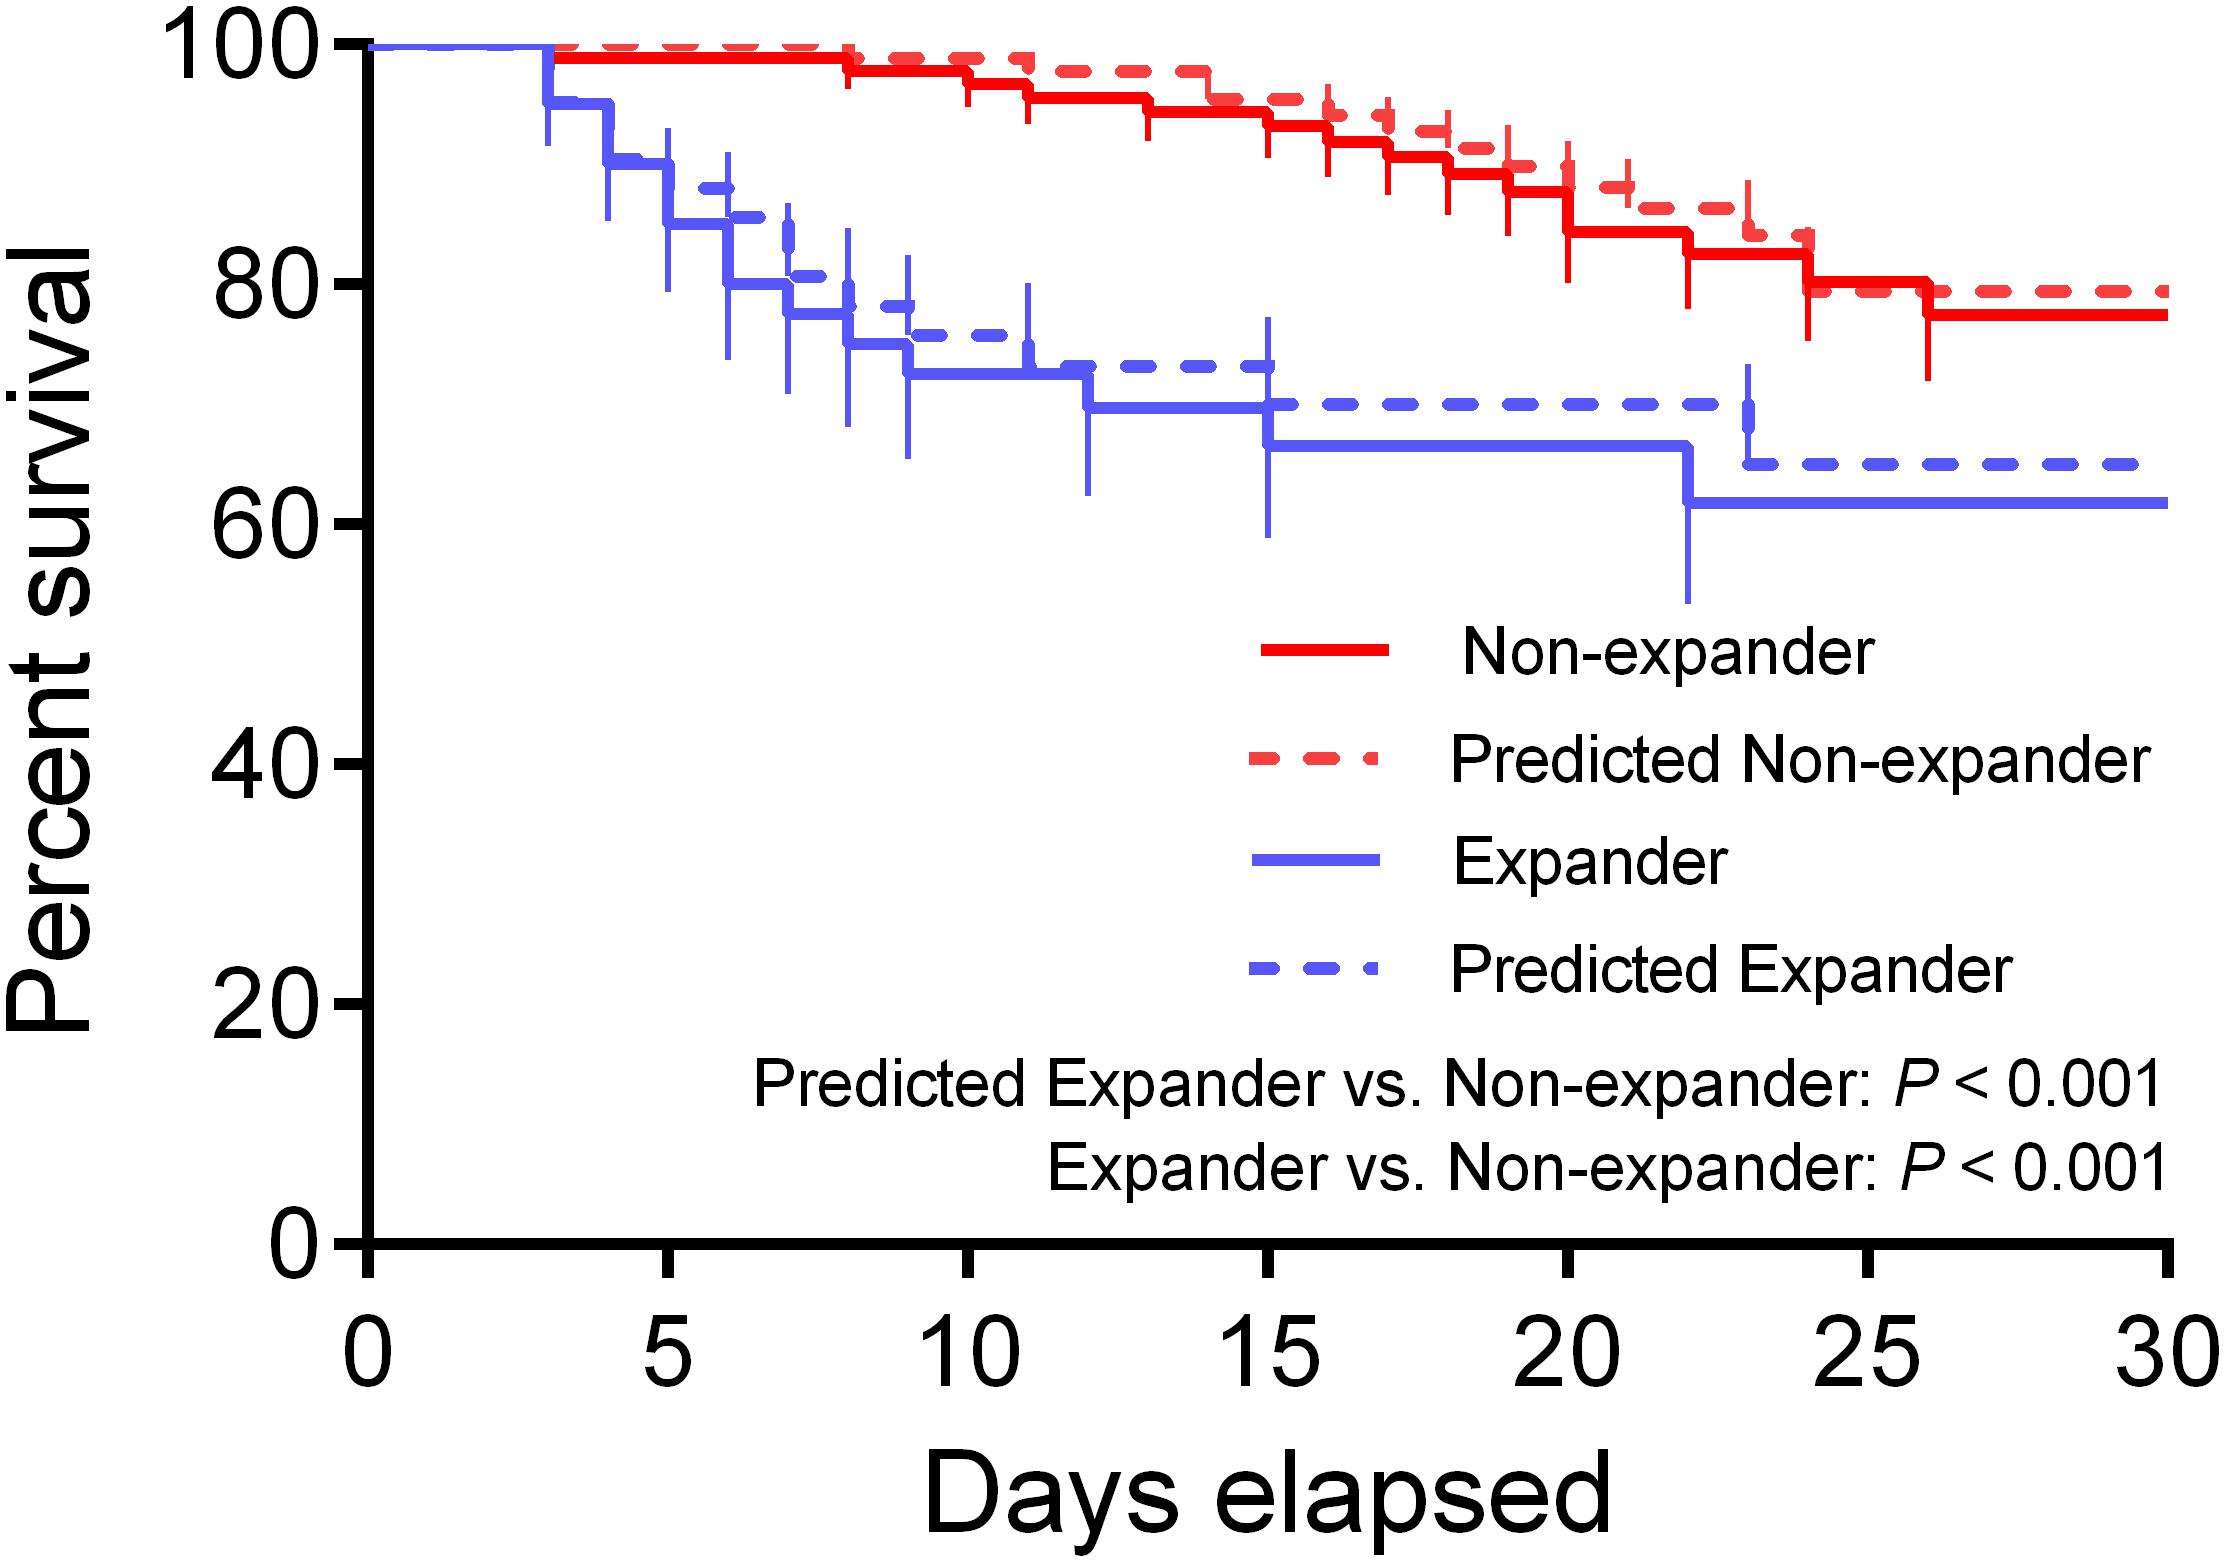
Figure 6. Kaplan–Meier (KM) survival curve for actual and predicted expander and non-expander groups. The KM analysis shows a significant difference between both actual and predicted groups (p < 0.001).
Discussion
In this study, we established and validated a nomogram model for early ICH expansion prediction, incorporating four robust radiomic features which were extracted from NCCT and proven to be effective for the classification of expanders and non-expanders and the satellite sign number which was found to be a statistically significant imaging marker for the identification of expanders. The nomogram model achieved a significantly better performance in both training cohort and external validation cohort with a larger AUC value than the model of radiomic signature alone, suggesting the reproducibility and the reliability of the improved model in hematoma expansion prediction.
In the recent years, several imaging markers for assessing the greater risk of ICH expansion in NCCT images have been springing up (Al-Nakshabandi, 2001; Li et al., 2015, 2016; Boulouis et al., 2017; Shimoda et al., 2017). NCCT turned out to be an optimized alternative for patients with ICH. Including blend sign, black hole sign, swirl sign, island sign, and satallite sign, different imaging characteristics based on NCCT have been proposed one after another (Al-Nakshabandi, 2001; Li et al., 2015, 2016; Boulouis et al., 2016b). The imaging biomarkers based on the heterogeneity of hematoma were prone to be impacted by photon noise and to be strongly subjective due to the unclear description and definition, which were dominant factors in reducing interobserver agreement during visual assessment (Park et al., 2019). As a strong evidence for that, the presence of qualitative signs was observed with relatively inferior consistency between two observers, along with indistinctive results between expanders and non-expanders, in our study. Besides that, the evaluation of inter-group statistical significance for swirl sign in the training cohort appeared to be inconsistent between observers. In the study of Xie et al. (2020), no statistical significance was found in the difference of identification capability between the nomogram model and the Radscore-based model for predicting ICH growth, indicating no statistical contribution of qualitative NCCT signs to the nomogram model construction. Meanwhile, inconsistent results of association between NCCT imaging markers and functional outcomes have been found in ICH patients (Boulouis et al., 2016a; Morotti et al., 2017). In this context, instead of defining new imaging predictors, more robust and quantitative characteristics derived from NCCT images were urgently needed to combine with existing markers to contribute to the predictive model for hematoma expansion.
The satellite sign and the island sign shared a similar morphology-based definition, which was less influenced by photon noise during observation (Li et al., 2017; Shimoda et al., 2017). However, the island sign contained a subjective morphological assessment of “islands” that were connected with the “mainland”, which could contribute to the discrepancy between observers (Sporns et al., 2018). Besides that, the lower limit of the island number in the definition made it difficult to transform into a quantitative index. The satellite sign instead had a precise size limitation with complete separation in at least one slice for those “connected satellites,” making the assessment more straightforward, which could be confirmed by the excellent intraobserver agreement and the consistent results between observers found in our study, thus indicating a high reproducibility. The satellites were explained as multifocal active bleeding from peripheral arterioles or reperfusion injury resulting from perihematomal edema, which means the greater the number of satellite was, the higher the probability of hematoma enlargement could be (Fisher, 1971; Shimoda et al., 2017). On top of that, we assumed that satellite sign number detection, a quantitative transformation of the satellite sign, could make imperative complementation for isolated small hematoma that could not be simultaneously included in the radiomic analysis and provide improved risk stratification.
The LASSO regression method has already been widely applied in radiomics-based studies (Huang et al., 2016; Allotey et al., 2019; Wei et al., 2019). The main thrust of LASSO regression is to avoid overfitting by regression coefficient restriction, which shows great strengths when multicollinearity exists. It is suitable for dimension reduction and feature selection in high-dimensional data, especially when the number of features is much higher than the sample size, just in line with the characteristics of radiomic data. Our previous work concentrated on the predictive performance of filtered histogram-based parameters for ICH enlargement (Shen et al., 2018). In this work, we specially focused on amelioration by employing a matrix-based texture extracting approach to improve the category and the quantity of radiomic features. Through an optimized selection from 396 features by the LASSO method, four features including sum average, high gray level run emphasis (all directions), short run high gray level emphasis (angel 0), and short run high gray level emphasis (angel 35) outstandingly surpassed themselves, suggesting their vital role in the prediction model. The sum average measures the relationship between the occurrences of pairs with lower intensity values and higher intensity values. The high gray level run emphasis and the short run high gray level emphasis measure the distribution of high gray level values and the joint distribution of short run and high gray level, respectively. These results indicated the diversity between hematoma expanders and non-expanders on the specific spatial heterogeneity of gray levels within the region of hematoma. What we found was consistent with those of previous studies which selected one or more of these textures as optimum feature for radiomic model construction (Chen et al., 2018; Romeo et al., 2018; Rui et al., 2018). As expected, the Radscore-based model yielded gratifying results in stratifying patients into expanders and non-expanders, with an AUC of 0.812 in the training cohort. In order to establish a more robust nomogram for prediction, the satellite sign number, as described above, was introduced as a promising imaging biomarker for complement. As the results showed, the nomogram model proved to be more effective and reliable than the model of radiomic signature alone in both cohorts, with a satisfactory AUC of 0.881 and 0.857, respectively, suggesting a positive effect of the inclusion of satellite sign number on prediction.
Early hematoma expansion is a critical determinant for both mortality and dependency after ICH onset. As the only modifiable factor in the vast majority of patients, it takes the center stage in therapeutic strategies (Ohwaki et al., 2004; Broderick et al., 2007). Through our study, two experienced neuroradiologists turned out to have rather different results in the observation of swirl sign and blend sign; in spite of that, they reached a high agreement for both radiomic features and the satellite sign number detection. From that, we would say that the nomogram model for ICH expansion prediction was a fast, easy-to-use, and reliable tool, which could be highly efficient and convenient for clinical routine. The model could assess ICH dynamic changes effectively at baseline and facilitate personalized treatment decisions. Owing to that, early medication, intervention, or even decompressive surgery, targeting hematoma growth, could be conducted for those highly suspected expanders as early as possible in clinical practice to improve the long-term prognosis.
There were some limitations in the current research that still need to be further investigated. First of all, it was a retrospective study with a relatively small and imbalanced sample size between expanders and non-expanders in both training and external validation cohorts. Further prospective researches are warranted to expand and balance the sample size and to verify the conclusions. On the other hand, in the process of hematoma segmentation, when it comes to hematoma located in cortical or subcortical regions, it was prone to inaccurate delineation due to partial volume effects. Besides that, the feature extraction software made the displacement vectors 1, 4, and 7 describe the relationship between the gray scale of pixels of the texture as default setting. In light of this, different set points could possibly influence the quantity and the category of radiomic feature extraction; thus, a future radiomic analysis based on various displacement vectors is required. Due to the relatively short follow-up time, the median overall survival for ICH was not available. We will continue to follow up with these patients to secure a more complete prognosis status.
Conclusion
We have identified and validated a nomogram model of integrated radiomic signature with the satellite sign number based on NCCT images to be a reliable and precise evaluation measurement for ICH enlargement prediction at early baseline. The predictive model could serve as an objective and convenient tool to use for patients with ICH in individualized prediction and treatment decision-making, thus suggesting a great potential for clinical application.
Data Availability Statement
All datasets generated for this study are included in the article/Supplementary Material.
Ethics Statement
The studies involving human participants were reviewed and approved by Affiliated Hangzhou First People’s Hospital, Zhejiang University School of Medicine. Written informed consent for participation was not required for this study in accordance with the national legislation and the institutional requirements.
Author Contributions
WX and QS wrote the manuscript and YS and ZD contributed to the writing process. WX, PP, ZF, and QS analyzed and interpreted the data and prepared the tables and figures. WC, YS, and ZD acquired the data. QS additionally contributed to the conception and the design of the study. All the co-authors read and revised the article.
Funding
This study was supported by grants from the Zhejiang Provincial Natural Science Foundation of China (LSY19H180009), the Medical Health Science and Technology Project of Zhejiang Provincial Health Commission (2019KY123 and 2018KY582), and the Advance Funding for Clinical Scientific Research by the Affiliated Hangzhou First People’s Hospital, Zhejiang University School of Medicine (YYJJ2019Z06).
Conflict of Interest
PP was employed by company GE Healthcare (China).
The remaining authors declare that the research was conducted in the absence of any commercial or financial relationships that could be construed as a potential conflict of interest.
Supplementary Material
The Supplementary Material for this article can be found online at: https://www.frontiersin.org/articles/10.3389/fnins.2020.00491/full#supplementary-material
References
Allotey, J., Fernandez-Felix, B. M., Zamora, J., Moss, N., Bagary, M., Kelso, A., et al. (2019). Predicting seizures in pregnant women with epilepsy: development and external validation of a prognostic model. PLoS Med. 16:e1002802. doi: 10.1371/journal.pmed.1002802
Al-Nakshabandi, N. A. (2001). The swirl sign. Radiology 218:433. doi: 10.1148/radiology.218.2.r01fe09433
Bi, W. L., Hosny, A., Schabath, M. B., Giger, M. L., Birkbak, N. J., Mehrtash, A., et al. (2019). Artificial intelligence in cancer imaging: clinical challenges and applications. Cancer J. Clin. 69, 127–157. doi: 10.3322/caac.21552
Bi, X. A., Wang, Y., Shu, Q., Sun, Q., and Xu, Q. (2018). Classification of autism spectrum disorder using random support vector machine cluster. Front. Genet. 9:18. doi: 10.3389/fgene.2018.00018
Boulouis, G., Morotti, A., Brouwers, H. B., Charidimou, A., Jessel, M. J., Auriel, E., et al. (2016a). Association between hypodensities detected by computed tomography and hematoma expansion in patients with intracerebral hemorrhage. JAMA Neurol. 73, 961–968. doi: 10.1001/jamaneurol.2016.1218
Boulouis, G., Morotti, A., Brouwers, H. B., Charidimou, A., Jessel, M. J., Auriel, E., et al. (2016b). Noncontrast computed tomography hypodensities predict poor outcome in intracerebral hemorrhage patients. Stroke 47, 2511–2516. doi: 10.1161/STROKEAHA.116.014425
Boulouis, G., Morotti, A., Charidimou, A., Dowlatshahi, D., and Goldstein, J. N. (2017). Noncontrast computed tomography markers of intracerebral hemorrhage expansion. Stroke 48, 1120–1125. doi: 10.1161/STROKEAHA.116.015062
Broderick, J. P., Diringer, M. N., Hill, M. D., Brun, N. C., Mayer, S. A., Steiner, T., et al. (2007). Determinants of intracerebral hemorrhage growth: an exploratory analysis. Stroke 38, 1072–1075. doi: 10.1161/01.STR.0000258078.35316.30
Brott, T., Broderick, J., Kothari, R., Barsan, W., Tomsick, T., Sauerbeck, L., et al. (1997). Early hemorrhage growth in patients with intracerebral hemorrhage. Stroke 28, 1–5. doi: 10.1161/01.str.28.1.1
Caplan, L. R. (2016). Recognizing and preventing intracerebral hematoma expansion. JAMA Neurol. 73, 914–915. doi: 10.1001/jamaneurol.2016.1899
Chen, S. W., Shen, W. C., Hsieh, T. C., Liang, J. A., Hung, Y. C., Yeh, L. S., et al. (2018). Textural features of cervical cancers on FDG-PET/CT associate with survival and local relapse in patients treated with definitive chemoradiotherapy. Sci. Rep. 8:11859. doi: 10.1038/s41598-018-30336-6
Chen, Y., Hénon, H., Bombois, S., Pasquier, F., and Cordonnier, C. (2016). Multiple simultaneous spontaneous intracerebral hemorrhages: a rare entity. Cerebrovasc. Dis. 41, 74–79. doi: 10.1159/000442475
Connor, D., Huynh, T. J., Demchuk, A. M., Dowlatshahi, D., Gladstone, D. J., Subramaniapillai, S., et al. (2015). Swirls and spots: relationship between qualitative and quantitative hematoma heterogeneity, hematoma expansion, and the spot sign. Neurovasc. Imaging 1:8. doi: 10.1186/s40809-015-0010-1
Davnall, F., Yip, C. S., Ljungqvist, G., Selmi, M., Ng, F., Sanghera, B., et al. (2012). Assessment of tumor heterogeneity: an emerging imaging tool for clinical practice? Insights Imaging 3, 573–589. doi: 10.1007/s13244-012-0196-6
Delcourt, C., Huang, Y., Arima, H., Chalmers, J., Davis, S. M., Heeley, E. L., et al. (2012). Hematoma growth and outcomes in intracerebral hemorrhage: the INTERACT1 study. Neurology 79, 314–319. doi: 10.1212/WNL.0b013e318260cbba
Demchuk, A. M., Dowlatshahi, D., Rodriguez-Luna, D., Molina, C. A., Blas, Y. S., Dzialowski, I., et al. (2012). Prediction of haematoma growth and outcome in patients with intracerebral haemorrhage using the CT-angiography spot sign (PREDICT): a prospective observational study. Lancet Neurol. 11, 307–314. doi: 10.1016/S1474-4422(12)70038-8
Dowlatshahi, D., Brouwers, H. B., Demchuk, A. M., Hill, M. D., Aviv, R. I., Ufholz, L. A., et al. (2016). Predicting intracerebral hemorrhage growth with the spot sign: the effect of onset-to-scan time. Stroke 47, 695–700. doi: 10.1161/STROKEAHA.115.012012
Fisher, C. M. (1971). Pathological observations in hypertensive cerebral hemorrhage. J. Neuropathol. Exp. Neurol. 30, 536–550. doi: 10.1097/00005072-197107000-00015
Ginsburg, S. B., Zhao, J., Humphries, S., Jou, S., Yagihashi, K., Lynch, D. A., et al. (2016). Texture-based quantification of centrilobular emphysema and centrilobular nodularity in longitudinal ct scans of current and former smokers. Acad. Radiol. 23, 1349–1358. doi: 10.1016/j.acra.2016.06.002
Heit, J. J., Iv, M., and Wintermark, M. (2017). Imaging of Intracranial Hemorrhage. J. Stroke 19, 11–27. doi: 10.5853/jos.2016.00563
Hemphill, J. C., Bonovich, D. C., Besmertis, L., Manley, G. T., and Johnston, S. C. (2001). The ICH score: a simple, reliable grading scale for intracerebral hemorrhage. Stroke 32, 891–897. doi: 10.1161/01.str.32.4.891
Hemphill, J. C., Greenberg, S. M., Anderson, C. S., Becker, K., Bendok, B. R., Cushman, M., et al. (2015). Guidelines for the management of spontaneous intracerebral hemorrhage: a guideline for healthcare professionals from the American Heart Association/American stroke association. Stroke 46, 2032–2060. doi: 10.1161/STR.0000000000000069
Huang, Y. Q., Liang, C. H., He, L., Tian, J., Liang, C. S., Chen, X., et al. (2016). Development and validation of a radiomics nomogram for preoperative prediction of lymph node metastasis in colorectal cancer. J. Clin. Oncol. Off. J. Am. Soc. Clin. Oncol. 34, 2157–2164. doi: 10.1200/jco.2015.65.9128
Khalaf, M. H., Sundaram, V., AbdelRazek Mohammed, M. A., Shah, R., Khosla, A., Jackson, K., et al. (2019). A predictive model for postembolization syndrome after transarterial hepatic chemoembolization of hepatocellular carcinoma. Radiology 290, 254–261. doi: 10.1148/radiol.2018180257
Kotze, C. W., Rudd, J. H., Ganeshan, B., Menezes, L. J., Brookes, J., Agu, O., et al. (2014). CT signal heterogeneity of abdominal aortic aneurysm as a possible predictive biomarker for expansion. Atherosclerosis 233, 510–517. doi: 10.1016/j.atherosclerosis.2014.01.001
Lambin, P., Rios-Velazquez, E., Leijenaar, R., Carvalho, S., van Stiphout, R. G., Granton, P., et al. (2012). Radiomics: extracting more information from medical images using advanced feature analysis. Eur. J. Cancer 48, 441–446. doi: 10.1016/j.ejca.2011.11.036
Li, Q., Liu, Q. J., Yang, W. S., Wang, X. C., Zhao, L. B., Xiong, X., et al. (2017). Island Sign: an imaging predictor for early hematoma expansion and poor outcome in patients with intracerebral hemorrhage. Stroke 48, 3019–3025. doi: 10.1161/STROKEAHA.117.017985
Li, Q., Zhang, G., Huang, Y. J., Dong, M. X., Lv, F. J., Wei, X., et al. (2015). Blend sign on computed tomography: novel and reliable predictor for early hematoma growth in patients with intracerebral hemorrhage. Stroke 46, 2119–2123. doi: 10.1161/STROKEAHA.115.009185
Li, Q., Zhang, G., Xiong, X., Wang, X. C., Yang, W. S., Li, K. W., et al. (2016). Black hole sign: novel imaging marker that predicts hematoma growth in patients with intracerebral hemorrhage. Stroke 47, 1777–1781. doi: 10.1161/STROKEAHA.116.013186
Lubner, M. G., Malecki, K., Kloke, J., Ganeshan, B., and Pickhardt, P. J. (2017a). Texture analysis of the liver at MDCT for assessing hepatic fibrosis. Abdom. Radiol. 42, 2069–2078. doi: 10.1007/s00261-017-1096-5
Lubner, M. G., Smith, A. D., Sandrasegaran, K., Sahani, D. V., and Pickhardt, P. J. C. T. (2017b). Texture analysis: definitions, applications, biologic correlates, and challenges. Radiogr. Revi. Publ. Radiol. Soc. North Am. 37, 1483–1503. doi: 10.1148/rg.2017170056
Morotti, A., Boulouis, G., Dowlatshahi, D., Li, Q., Barras, C. D., Delcourt, C., et al. (2019). Standards for detecting, interpreting, and reporting noncontrast computed tomographic markers of intracerebral hemorrhage expansion. Ann. Neurol. 86, 480–492. doi: 10.1002/ana.25563
Morotti, A., Boulouis, G., Romero, J. M., Brouwers, H. B., Jessel, M. J., Vashkevich, A., et al. (2017). ATACH-II and NETT investigators. Blood pressure reduction and noncontrast CT markers of intracerebral hemorrhage expansion. Neurology 89, 548–554. doi: 10.1212/WNL.0000000000004210
Ohwaki, K., Yano, E., Nagashima, H., Hirata, M., Nakagomi, T., and Tamura, A. (2004). Blood pressure management in acute intracerebral hemorrhage: relationship between elevated blood pressure and hematoma enlargement. Stroke 35, 1364–1367. doi: 10.1161/01.STR.0000128795.38283.4b
Park, B. K., Kwak, H. S., Chung, G. H., and Hwang, S. B. (2019). Diagnostic value of swirl sign on noncontrast computed tomography and spot sign on computed tomographic angiography to predict intracranial hemorrhage expansion. Clin. Neurol. Neurosurg. 182, 130–135. doi: 10.1016/j.clineuro.2019.05.013
Romeo, V., Maurea, S., Cuocolo, R., Petretta, M., Mainenti, P. P., Verde, F., et al. (2018). Characterization of adrenal lesions on unenhanced mri using texture analysis: a machine-learning approach. J. Mag. Resonance Imaging 48, 198–204. doi: 10.1002/jmri.25954
Rui, W., Ren, Y., Wang, Y., Gao, X., Xu, X., and Yao, Z. (2018). MR textural analysis on T2 FLAIR images for the prediction of true oligodendroglioma by the 2016 WHO genetic classification. J. Mag. Resonance Imaging 48, 74–83. doi: 10.1002/jmri.25896
Shen, Q., Shan, Y., Hu, Z., Chen, W., Yang, B., Han, J., et al. (2018). Quantitative parameters of CT texture analysis as potential markersfor early prediction of spontaneous intracranial hemorrhage enlargement. Eur. Radiol. 28, 4389–4396. doi: 10.1007/s00330-018-5364-8
Shimoda, Y., Ohtomo, S., Arai, H., Okada, K., and Tominaga, T. (2017). satellite sign: a poor outcome predictor in intracerebral hemorrhage. Cerebrovasc. Dis. 44, 105–112. doi: 10.1159/000477179
Sporns, P. B., Kemmling, A., Schwake, M., Minnerup, J., Nawabi, J., Broocks, G., et al. (2018). Triage of 5 noncontrast computed tomography markers and spot sign for outcome prediction after intracerebral hemorrhage. Stroke 49, 2317–2322. doi: 10.1161/STROKEAHA.118.021625
van Asch, C. J., Luitse, M. J., Rinkel, G. J., van der Tweel, I., Algra, A., and Klijn, C. J. (2010). Incidence, case fatality, and functional outcome of intracerebral haemorrhage over time, according to age, sex, and ethnic origin: a systematic review and meta-analysis. Lancet Neurol. 9, 167–176. doi: 10.1016/S1474-4422(09)70340-0
Wei, J. H., Feng, Z. H., Cao, Y., Zhang, H. W., Chen, Z. H., Liao, B., et al. (2019). Predictive value of single-nucleotide polymorphism signature for recurrence in localised renal cell carcinoma: a retrospective analysis and multicentre validation study. Lancet Oncol. 20, 591–600. doi: 10.1016/s1470-2045(18)30932-x
Xie, H., Ma, S., Wang, X., and Zhang, X. (2020). Noncontrast computer tomography-based radiomics model for predicting intracerebral hemorrhage expansion: preliminary findings and comparison with conventional radiological model. Eur. Radiol. 30, 87–98. doi: 10.1007/s00330-019-06378-3
Yu, Z., Zheng, J., Ali, H., Guo, R., Li, M., Wang, X., et al. (2017). Significance of satellite sign and spot sign in predicting hematoma expansion in spontaneous intracerebral hemorrhage. Clin. Neurol. Neurosurg. 162, 67–71. doi: 10.1016/j.clineuro.2017.09.008
Keywords: cerebral hemorrhage/diagnostic imaging, disease progression, computed tomography, stroke, algorithms
Citation: Xu W, Ding Z, Shan Y, Chen W, Feng Z, Pang P and Shen Q (2020) A Nomogram Model of Radiomics and Satellite Sign Number as Imaging Predictor for Intracranial Hematoma Expansion. Front. Neurosci. 14:491. doi: 10.3389/fnins.2020.00491
Received: 29 December 2019; Accepted: 20 April 2020;
Published: 04 June 2020.
Edited by:
Baojuan Li, Fourth Military Medical University, ChinaReviewed by:
Xia-an Bi, Hunan Normal University, ChinaXiaopan Xu, Fourth Military Medical University, China
Copyright © 2020 Xu, Ding, Shan, Chen, Feng, Pang and Shen. This is an open-access article distributed under the terms of the Creative Commons Attribution License (CC BY). The use, distribution or reproduction in other forums is permitted, provided the original author(s) and the copyright owner(s) are credited and that the original publication in this journal is cited, in accordance with accepted academic practice. No use, distribution or reproduction is permitted which does not comply with these terms.
*Correspondence: Qijun Shen, c2hlbnFpanVuODBAMTYzLmNvbQ==