 Stephen A. Fleming1,2
 Austin T. Mudd1,2
 Jonas Hauser3
 Jian Yan4
 Sylviane Metairon3
 Pascal Steiner3
 Sharon M. Donovan5,6
 Ryan N. Dilger1,2,5,6*
- 1Piglet Nutrition and Cognition Laboratory, Department of Animal Sciences, University of Illinois at Urbana-Champaign, Urbana, IL, United States
- 2Neuroscience Program, University of Illinois at Urbana-Champaign, Urbana, IL, United States
- 3Nestlé Research, Lausanne, Switzerland
- 4Nestlé Product Technology Center Nutrition, Vevey, Switzerland
- 5Department of Food Science and Human Nutrition, University of Illinois at Urbana-Champaign, Urbana, IL, United States
- 6Division of Nutritional Sciences, University of Illinois at Urbana-Champaign, Urbana, IL, United States
Human milk contains a unique profile of oligosaccharides (OS) and preliminary evidence suggests they impact brain development. The objective of this study was to assess the impact of bovine and/or human milk oligosaccharides (HMO) (2′-fucosyllactose and Lacto-N-neotetraose) on cognition, brain development, and hippocampal gene expression. Beginning on postnatal day (PND) 2, male pigs received one of four milk replacers containing bovine milk oligosaccharides (BMOS), HMO, both (BMOS + HMO), or neither. Pigs were tested on the novel object recognition task using delays of 1- or 48-h at PND 22. At PND 32–33, magnetic resonance imaging procedures were used to assess structural brain development and hippocampal tissue was collected for analysis of mRNA expression. Pigs consuming only HMO exhibited recognition memory after a 1-h delay and those consuming BMOS + HMO exhibited recognition memory after a 48-h delay. Both absolute and relative volumes of cortical and subcortical brain regions were altered by diet. Hippocampal mRNA expression of GABRB2, SLC1A7, CHRM3, and GLRA4 were most strongly affected by diet. HMO and BMOS had distinct effects on brain structure and cognitive performance. These data suggest different mechanisms underlie their influence on brain development.
Introduction
Human milk oligosaccharides (HMO) are increasingly recognized as important promoters of intestinal and immune development (Kirmiz et al., 2018). Human milk oligosaccharides are the third most concentrated solid in human milk behind lactose and lipids (Bode, 2012), and their diversity and concentration are unlike any other species (Urashima et al., 2001). Although bovine milk contains OS that are structurally similar or identical to those found in human milk, they are found in lower concentrations than in human milk (Gopal and Gill, 2000; Martín-Sosa et al., 2003). Emerging research has suggested that bovine milk derived oligosaccharides (BMOS) and HMO [e.g., 2′-fucosyllactose (2′-FL), Lacto-N-neotetraose (LNnT)] may confer physiological benefits when consumed by formula-fed infants.
Infants fed formula supplemented with BMOS have shown tolerance and adequate growth as measured by anthropomorphic measures (e.g., weight-for-age, length-for-age, or head-circumference scores) and stool characteristic (e.g., frequency, consistency, or pH) closer to that of breastfed infants (Meli et al., 2014; Cooper et al., 2016; Simeoni et al., 2016; Radke et al., 2017). Provision of a combination of BMOS and Bifidobacterium animalis subsp. Lactis brought fecal bifidobacteria counts of infants delivered via C-section closer to that of infants delivered vaginally (Cooper et al., 2016), and the same combination brought 16S ribosomal RNA sequencing indices of richness, evenness, and the Shannon index similar to that of a breastfed control group.
Infants fed formula supplemented with HMO demonstrated age appropriate growth (Marriage et al., 2015; Puccio et al., 2017), fewer reports of respiratory illness or use of antibiotics/antipyretics (Puccio et al., 2017), and stool consistency and frequency closer to that of breastfed infants (Marriage et al., 2015). Absorption and excretion of 2′-FL is consistent with the amount of 2′-FL consumed, with breastfed and 2′-FL supplemented infants displaying higher concentrations of plasma and urinary 2′-FL (Marriage et al., 2015). Furthermore, infants fed formula containing 2′-FL in addition to galactooligosaccharide (GOS) demonstrated plasma cytokine (e.g., IL-1ra, TNF-α, IL-1α, IL-1β, IL-6) concentrations closer to that of breastfed infants than those consuming GOS only supplemented formulas. When peripheral blood mononuclear cells were stimulated with respiratory syncytial virus ex vivo the cytokine response from breastfed and 2′-FL supplemented infants were similar (Goehring et al., 2016).
Recent reports demonstrate that various oligosaccharides are also capable of promoting brain development (Kao et al., 2016). Rats supplemented with 2′-FL demonstrated vagally mediated improved learning and memory (Vázquez et al., 2015, 2016; Oliveros et al., 2016), rats supplemented with sialyllactose demonstrated improved behavioral response to stress (Tarr et al., 2015), and we have demonstrated that pigs fed a combination of polydextrose and GOS (Fleming et al., 2017) have improved performance in the novel object recognition (NOR) task. Various oligosaccharides have separately proven capable of altering brain or cognitive development in some manner, however few studies have directly compared the efficacy of BMOS and HMO.
Therefore, the objective of the present study was to assess the efficacy of BMOS and HMO alone or in combination at altering performance in the NOR task, structural neurodevelopment, or hippocampal mRNA expression in the young pig.
Materials and Methods
Animals and Housing
All animal care and experimental procedures were in accordance with the National Research Council Guide for Care and Use of Laboratory Animals and approved by the University of Illinois at Urbana-Champaign Institutional Animal Care and Use Committee. Housing and rearing protocols were adapted from previous studies in our lab (Fleming et al., 2017; Mudd et al., 2018), and are described as follows. Forty-eight intact male pigs (1050 Cambro genetics) were naturally farrowed and allowed colostrum consumption for up to 48 h before transport to the Piglet Nutrition & Cognition Laboratory at the University of Illinois at Urbana-Champaign. Pigs were artificially reared from postnatal day (PND) 2 until PND 33. This study was conducted using six independent cohorts (n = 2 pigs per dietary treatment in each cohort), with litter and initial bodyweight counterbalanced between dietary groups and within each cohort. All pigs were housed in master caging units that contained six individual stainless-steel cages (L × W × H of 87.6 cm × 88.9 cm × 50.8 cm) with clear, polycarbonate facades on three sides of the cage and vinyl-coated, expanded-metal flooring (Tenderfoot®, Minneapolis, MN, United States). The master unit was designed such that there were three separate levels each with two individual pig cages on each level. Pigs on each level shared a common wall containing holes to permit pigs to see, smell, hear, and minimally touch one-another. A towel and toy were included in each cage to provide enrichment, all pigs were removed from cages and allowed to socialize with each other for approximately 30 min each day, and all pigs were allowed ad libitum access to water at all times.
All pigs were reared in the same room with ambient temperature maintained between 27 and 29°C and a 12-h light/dark cycle maintained from 0600 to 1800 h. Prior to placement in the artificial rearing system, pigs were administered 5 mL of Clostridium perfingens antitoxin C + D per the manufacturer’s recommendations (Colorado Serum Company, Denver, CO, United States) to prevent enterotoxemia (Niilo, 1988). At study conclusion (PND 33), pigs were anesthetized using a telazol:ketamine:xylazine solution (50 mg tiletamine plus 50 mg of zolazepam reconstituted with 2.50 mL ketamine [100 g/L] and 2.50 mL xylazine [100 g/L]; Fort Dodge Animal Health) by intramuscular injection at 0.03 mL/kg bodyweight. After anesthetic induction, pigs were euthanized via intracardiac administration of sodium pentobarbital (86.0 mg/kg of body weight; Euthasol, Virbac Animal Health, Fort Worth, TX). Two pigs were removed from study due to failure-to-thrive (diet: BMOS + HMO). See Figure 1 for an overview of the study design.
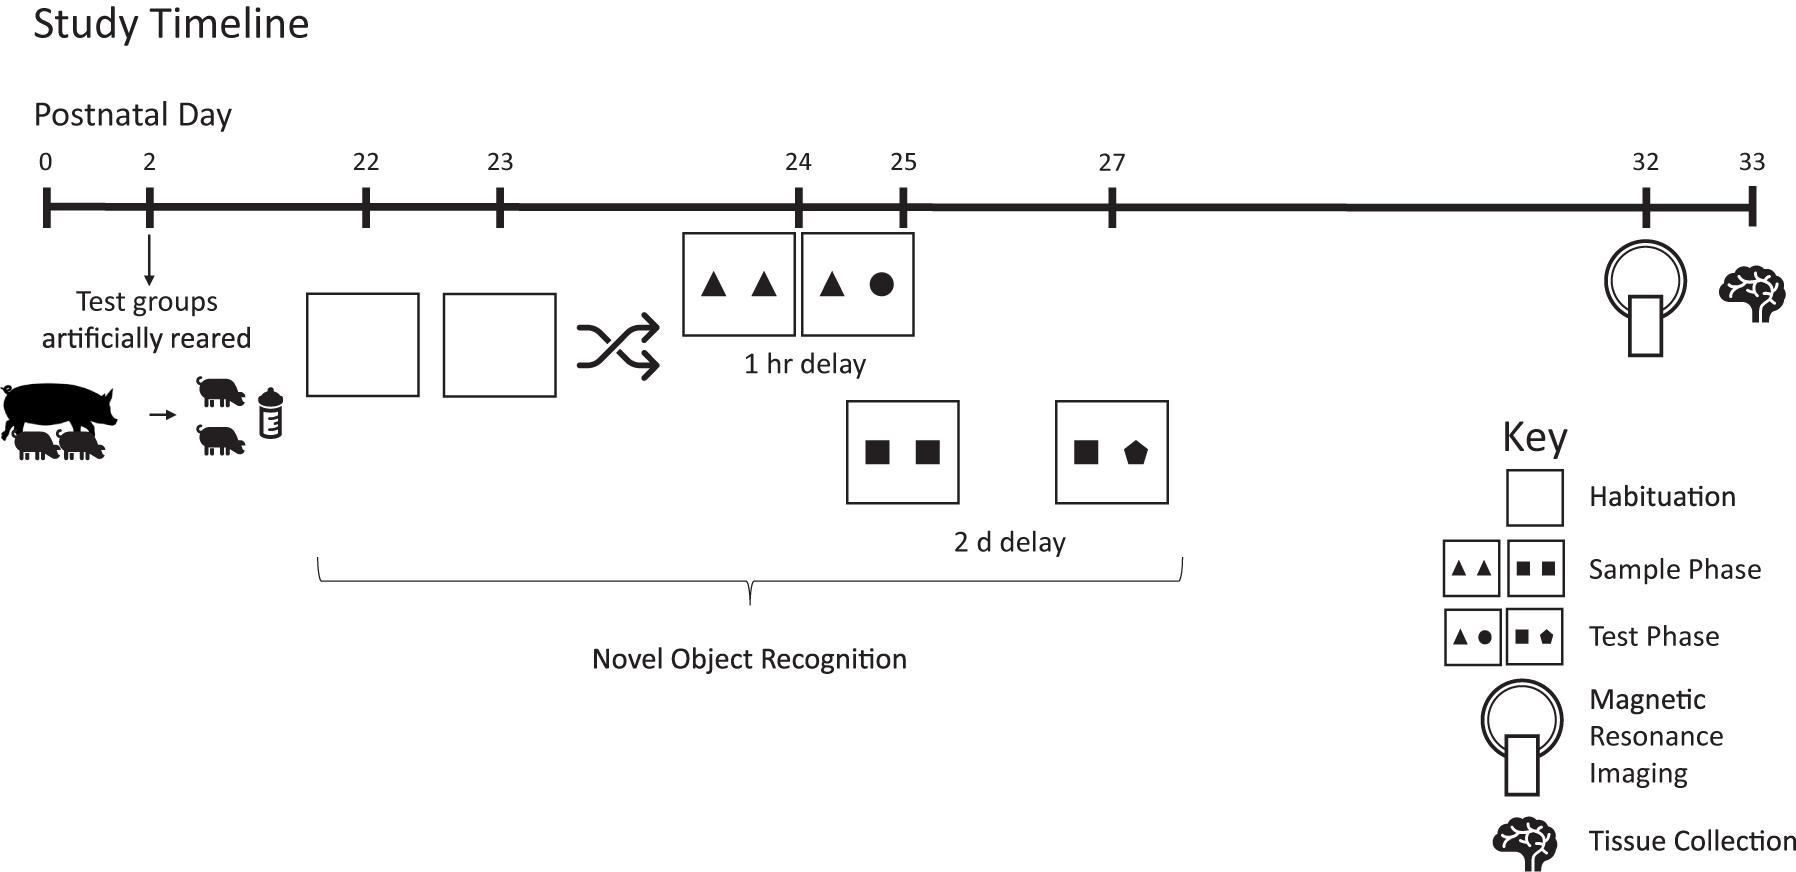
Figure 1. Study timeline. Pigs were reared artificially from postnatal days 2–33. Starting on postnatal day 22, pigs were tested on the novel object recognition test twice using delays of 1 h or 2 days, with task order randomized and counterbalanced between groups. On PND 32–33, pigs were subjected to magnetic resonance imaging and on PND 33 brain tissue was collected for quantification of hippocampal gene expression. Pigs were weighed daily to track growth.
Dietary Treatments
All researchers involved with conducting the study and acquiring and analyzing study results remained blind to dietary treatment identity until final data analyses were complete. Pigs (n = 12 per diet) were provided milk replacers reconstituted at 200 g of dry powder per 800 g of water. Reconstituted diets were formulated to contain approximately 0 g/L milk OS (control [CON], ProNurse® Specialty Milk Replacer, Purina Animal Nutrition, Gray Summit, MO), 12.4 g/L BMOS (BMOS, Nestlé Product & Technology Center, Konolfingen, Switzerland), 1.5 g/L HMO (HMO, 1.0 g/L of 2′-FL + 0.5 g/L of LNnT, Glycom, Hørsholm, Denmark), or both bovine and human milk oligosaccharides (BMOS + HMO; 12.4 g/L of BMOS + 1.0 g/L of 2′-FL + 0.5 g/L of LNnT). Briefly, the BMOS product was derived from bovine whey and composed primarily of GOS and trace amounts of 3′ and 6′ sialyllactose, and is the same as that used in previous clinical trials (Meli et al., 2014; Cooper et al., 2016; Radke et al., 2017). Doses of each type of OS were not equal across treatment groups and were chosen to replicate those used in previous clinical studies where infants were provided formula containing 0.2 or 1 g/L 2′-FL (Marriage et al., 2015; Goehring et al., 2016; Puccio et al., 2017), 0.5 g/L LNnT (Puccio et al., 2017), 8 g/L BMOS (Cooper et al., 2016; Radke et al., 2017), or 10 g/L BMOS (Meli et al., 2014). Analyzed concentrations of each OS demonstrated success in replicating the concentration of HMO from previous clinical trials, with BMOS at approximately half the concentration used as compared to clinical research (5.8 g/L vs 8–10 g/L). All diets were formulated to contain lactose such that each diet provided the same amount of total carbohydrate. The nutritional composition of the base formula can be found in Table 1, and post hoc analysis of the oligosaccharide content of the formulated diets is shown in Table 2.
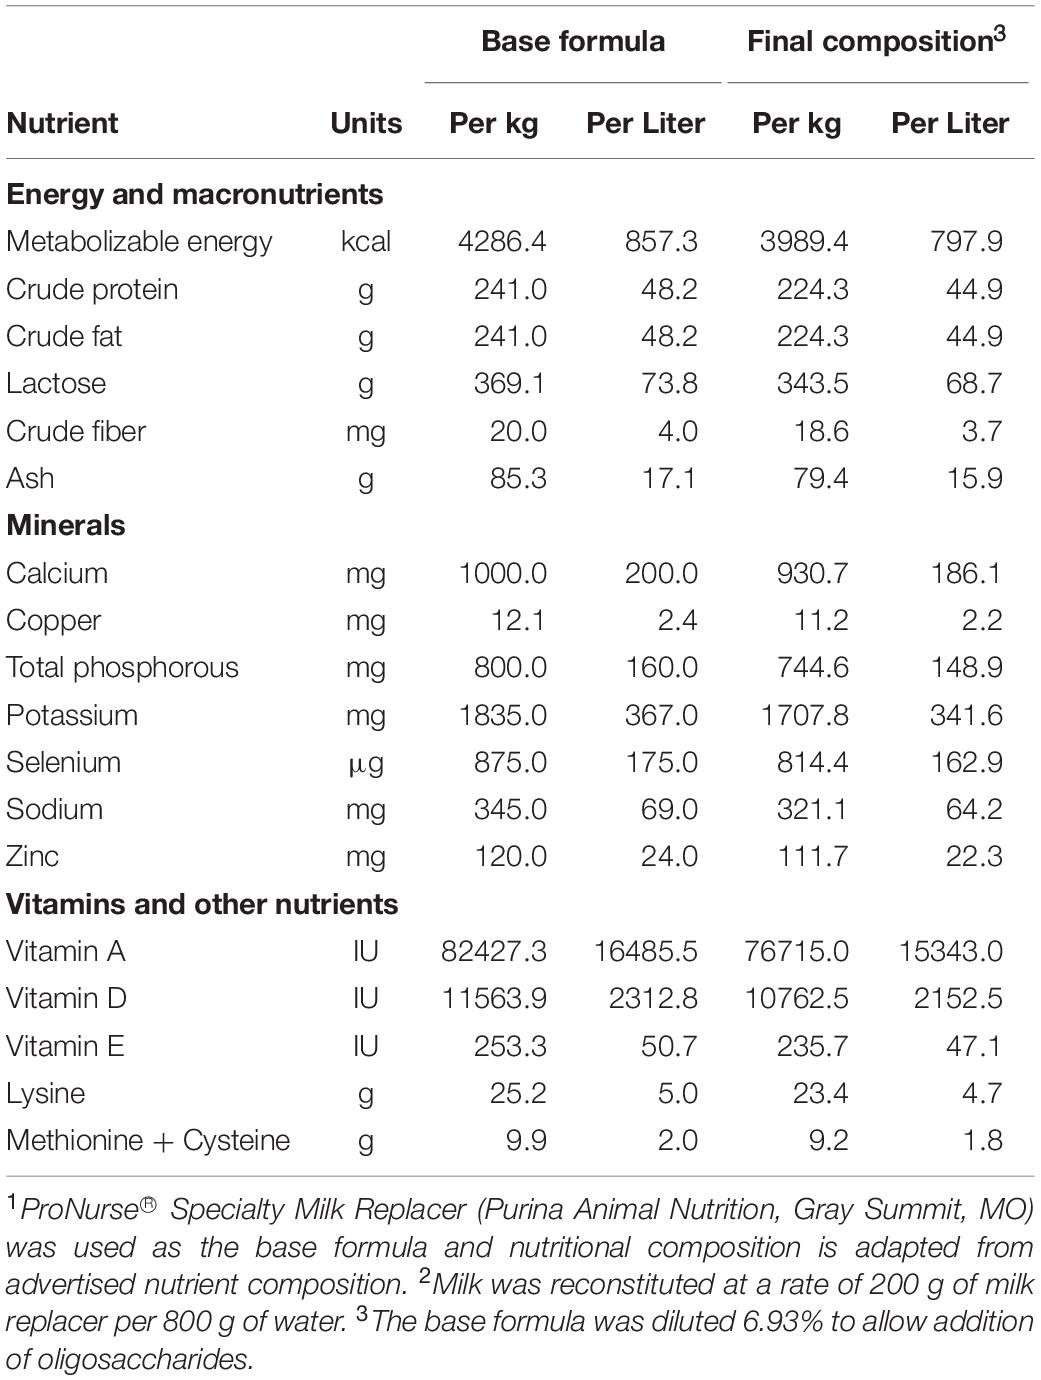
Table 1. Formulated nutrient composition of the base formula1,2.
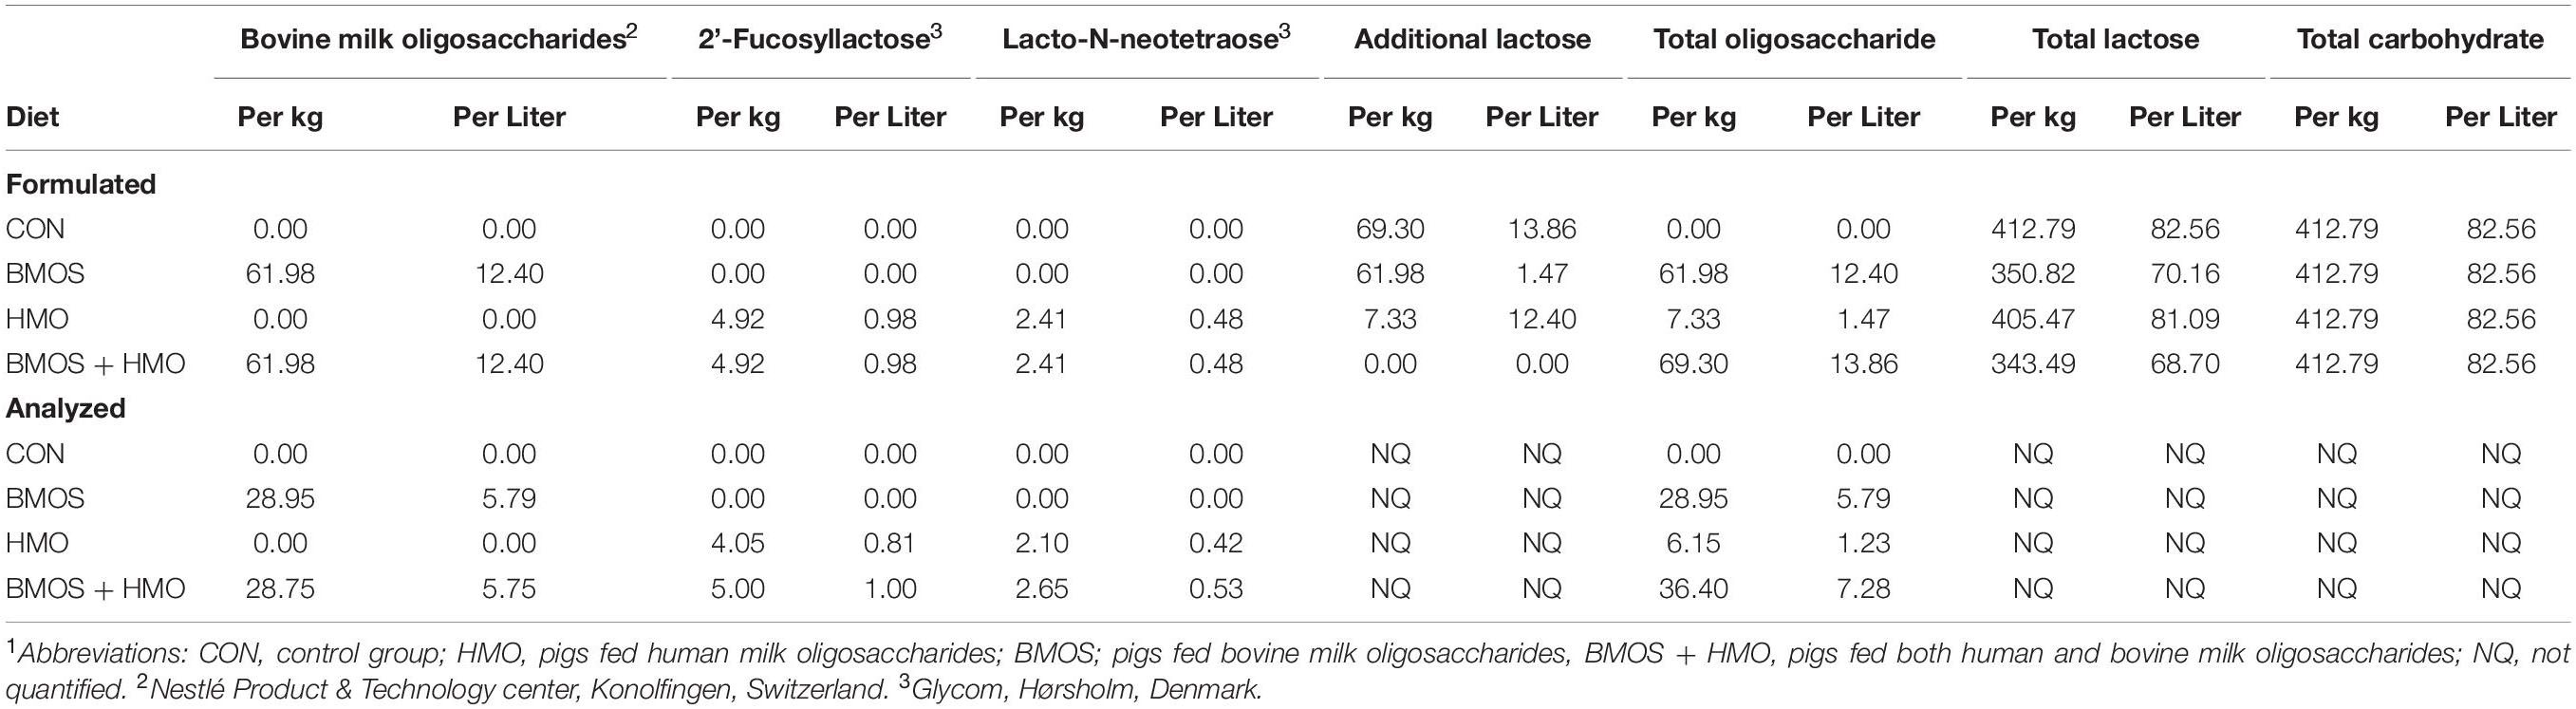
Table 2. Carbohydrate content of the diets1.
Pigs received small volumes (approximately 500 mL) of experimental diets on the day of arrival to the rearing facility to allow for adjustment to the milk replacer prior to the standard feeding regimen. Pigs were fed at a rate of 285 and 325 mL of reconstituted diet per kg bodyweight from PND 3–6 and PND 7–33, respectively. Individual pig bodyweight was recorded daily to determine the volume of milk to be dispensed to individual animals throughout the day. Meals were administered 10 times a day, approximately every 100 min, between 1000 and 0400 h using an automated feeding system. Feed refusals were not quantified.
Behavior
Pigs were tested on the NOR task using two different delays to assess intermediate and long-term recognition memory. Methods used were adapted from previous studies using this task in pigs from other labs (Moustgaard et al., 2002; Gifford et al., 2007; Kornum et al., 2007; Kouwenberg et al., 2009) and our own (Fleming and Dilger, 2017; Fleming et al., 2017, 2018). Testing consisted of a habituation phase, a sample phase, and a test phase. During the habituation phase, each pig was placed in an empty testing arena for 10 min each day for two days leading up to the sample phase. In the sample phase, the pig was placed in the arena containing two identical objects and given 5 min for exploration. After a delay of 1- or 48-h the pig was returned to the arena for the test phase of the NOR task. During the test phase, the pig was placed in the arena containing one object from the sample phase and a novel object and allowed to explore for 5 min. Between trials, objects were removed, immersed in hot water with detergent, and rubbed with a towel to mitigate odor and the arena was sprayed with water to remove urine and feces. Objects chosen had a range of characteristics (i.e., color, texture, shape, and size), however the novel and sample objects only differed in shape and size. Only objects previously shown to elicit a null preference were used for testing (Fleming and Dilger, 2017). Task order was counterbalanced between replicates. Habituation trials began at PND 22 and testing on the sample phase began on PND 24. Recognition index, or the proportion of time spent with the novel object compared to total exploration of both objects, was used to measure recognition memory. A recognition index significantly above 0.50 demonstrates a novelty preference and thus recognition memory. Videos from all experiments were analyzed using a commercially available software package (Ethovision XT 11®, Noldus Information Technology, Wageningen, Netherlands). Time spent investigating objects was recorded manually by mapping start and stop conditions to specific keys on a computer keyboard and total movement was assessed by tracking center-of-mass of the pig, including during habituation trials. Experimenters were blind to all treatment conditions during analysis. Investigations were classified as nose directed behavior such as rooting, mouthing, or sniffing of the objects. Rubbing up against, standing over, standing near, looking at, or sniffing the floor/air near the objects were not counted as investigations.
Magnetic Resonance Imaging
All pigs underwent magnetic resonance imaging (MRI) procedures at PND 32 or 33 at the Beckman Institute for Advanced Science and Technology Biomedical Imaging Center using Siemens MAGNETOM Trio 3T equipment with a Siemens 32-channel head coil. Methods described here are adapted from previous studies using MRI in pig (Radlowski et al., 2014; Jacob et al., 2016; Mudd et al., 2016b). Each pig underwent imaging protocols only once. The pig neuroimaging protocol included three magnetization prepared rapid gradient-echo (MPRAGE) sequences and diffusion tensor imaging (DTI) to assess brain macrostructure and microstructure, respectively, as well as magnetic resonance spectroscopy (MRS) to obtain brain metabolite concentrations. In preparation for MRI procedures, anesthesia was induced using an intramuscular injection of telazol (50.0 mg of tiletamine plus 50.0 mg of zolazepam reconstituted with 5.0 DI water; Zoetis, Florham Park, NJ) administered at 0.07 mL/kg bodyweight, and maintained with inhalation of isoflurane (98% O2, 2% isoflurane). Pigs were immobilized during all MRI procedures. Visual observation of each pig’s well-being, as well as observations of heart rate, PO2 and percent of isoflurane were recorded every 5 min during the procedure and every 10 min post-procedure until animals recovered. Total scan time for each pig was approximately 60 min. Imaging techniques are briefly described below.
Structural MRI
A T1-weighted MPRAGE sequence was used to obtain anatomic images of the pig brain with a 0.7 mm isotropic voxel size. Three repetitions were acquired and averaged using SPM8 in Matlab 8.3, and brains were manually extracted using FMRIB Software Library (FSL; FMRIB Centre, Oxford, United Kingdom). The following sequence specific parameters were used to acquire T1-weighted MPRAGE data: repetition time (TR) = 1900 ms; echo time (TE) = 2.49 ms; 224 slices; field of view (FOV) = 180 mm; flip angle = 9°. Methods for MPRAGE averaging and manual brain extraction were previously described (Mudd et al., 2016b). All data generated used a publicly available population-averaged pig brain atlas1 (Conrad et al., 2014). For volumetric assessments, individual brains were segmented into 23 regions of interest (ROI) using the pig brain atlas. Total brain and individual region volume analysis was performed in which an inverse warp file for each ROI was generated from the DARTEL-generated warp files for each region. As described previously (Mudd et al., 2016b), the SPM “Segment” tool, along with pig specific tissue prior probabilities, was used to obtain gray matter, white matter, and cerebrospinal fluid (CSF) tissue segmentations for each pig, and DARTEL was used to align the native space segmentations. The fslstats toolbox was used to determine the voxel volume of the subject-space segmentation for each of the three tissue types. Using fslmaths, the mean overall partial volume map was obtained for each subject-space segmentation. Overall absolute volume for gray matter, white matter, and CSF was determined by multiplying the voxel volume measure by the mean intensity of the partial volume segmentation. In order to account for absolute whole-brain volume, all ROI were also expressed as a percent of total brain volume (%TBV).
Diffusion Tensor Imaging
Diffusion tensor imaging was used to assess white matter maturation and axonal tract integrity using a b-value = 1000 s/mm2 across 30 directions and a 2 mm isotropic voxel. Diffusion-weighted echoplanar images (EPI) were assessed in FSL 5.0 for fractional anisotropy (FA), mean diffusivity (MD), axial diffusivity (AD), and radial diffusivity (RD) using methods previously described (Mudd et al., 2016b). The pig brain atlas was used for assessment of the following ROI: caudate, corpus callosum, cerebellum, both hippocampi, internal capsule, left and right cortex, thalamus, DTI-generated white matter, and atlas-generated white matter was performed using a customized pig analysis pipeline and the FSL software package. The diffusion toolbox in FSL was used to generate values of AD, RD, MD, and FA. In the corresponding results, atlas-generated white matter indicates the use of white matter prior to using probability maps from the pig brain Fatlas that were used as a region of interest mask. Likewise, DTI-generated white matter indicates a threshold of 0.2 was applied to FA values, restricting analysis to white matter tracts. Masks for each ROI from the atlas were non-linearly transformed into the MPRAGE space of each individual pig and a linear transform was then applied to transfer each ROI into DTI space. A threshold of 0.5 was applied to each ROI, and the data were dilated twice. For each individual ROI, an FA threshold of 0.15 was applied to ensure that we included only white matter in that region of interest despite the mask expansion.
Magnetic Resonance Spectroscopy
Magnetic resonance spectroscopy was used to non-invasively quantify metabolites in the whole brain. The MRS spin-echo chemical shift sequence was used with a voxel size of 20 mm × 23 mm × 13 mm and centered over the left and right dorsal hippocampi. The following sequence parameters were used in acquisition of spectroscopy data for the water-suppressed scan: TR = 1800 ms; TE = 68 ms; signal averages = 256, vector size = 1024. The following sequence parameters were used in acquisition of spectroscopy data for the non-water-suppressed scan: TR = 20,000 ms; TE = 68 ms; signal averages = 1; vector size = 1024 point. Both water-suppressed and non-water-suppressed data were collected in institutional units, and all MRS data were analyzed with LC Model (version 6.3) using methods previously described (Radlowski et al., 2014). Limits were placed on MRS data for inclusion in the statistical analysis. Cramer-Rao lower bounds (i.e.,% standard deviation) were calculated using LC Model and only metabolites with a standard deviation less than 20% were considered to have reliable quantitative results of absolute levels.
Hippocampal Gene Expression
Approximately 20 mg of hippocampal tissue were introduced in a Lysing Matrix D tube (MP Biomedicals, Santa Ana, CA, United States), placed on ice, and 650 μL of lysis buffer (Agencourt RNAdvance Tissue Kit, Beckman Coulter, Indianapolis, IN, United States) was added. Tubes were agitated for 2 × 1 min at speed 6 on FastPrep®-24 (MP Biomedicals, Santa Ana, CA, United States), and 400 μL of lysate were then extracted using the Agencourt RNAdvance Tissue Kit (Beckman Coulter, Indianapolis, IN, United States) following the manufacturer’s recommendations. RNA were quantified using the Quant-iTTM RiboGreenTM RNA Assay Kit (Invitrogen, Carlsbad, CA, United States) on a Spectramax M2 (Molecular Devices, Sunnyvale, CA, United States). RNA quality assessment was completed using a Fragment Analyzer 96 with Standard Sensitivity RNA Analysis Kit (15 nt) (Advanced Analytical Technologies, Inc., Ankeny, IW, United States). Relative mRNA copy number on 93 genes was quantified using the NanoString nCounterTM system (NanoString Technologies Inc., Seattle, WA, United States) according to the manufacturer’s instructions using 100ng of RNA as the starting amount. Using nSolver software (Version 4.0, NanoString Technologies Inc., Seattle, WA, United States), background subtraction using the median of all eight negative controls was followed by positive control normalization using the geometric mean of six positive controls and housekeeping normalization using the geometric mean of six housekeeping genes.
Statistical Analysis
Data analysis was conducted using the GLIMMIX procedure of SAS Enterprise Guide 7.1 (SAS Institute, Cary, NC, United States). All data were subjected to a two-way analysis of variance to assess the main effects of BMOS, HMO, and the interaction effect of BMOS and HMO. Two animals were removed from study (both provided BMOS + HMO). One pig was removed from study at PND 2 due to poor growth and inability to gain weight. The second pig was removed due to unexpected mortality after behavioral assessment and prior to MRI acquisition, however behavioral data was included in the analysis (all behavioral and growth measures were within normal ranges). Cohort of pig was included in the model as a random variable. For all variables, observations with a studentized residual greater than | 3| were considered outliers and removed from that variable only. For behavioral data, pigs that exhibited little exploration of either object (i.e., less than 2 s of exploration of either the sample or novel object) were considered non-compliant and their recognition index was not measured in the test phase (total sample sizes of 1-h delay: CON, n = 9; BMOS, n = 10; HMO, n = 10; BMOS + HMO, n = 11. 2-day delay: CON, n = 10; BMOS, n = 9; HMO, n = 11; BMOS + HMO, n = 10), but all other exploration measures were included for those subjects. This criteria was chosen to prevent the analysis of pigs that tend to “perseverate” on singular objects while ignoring the exploration of the rest of the arena or other objects, while requiring all animals analyzed to have engaged in a minimal amount of investigation of both objects. Variables from the sample phases from the 1- and 48-h delay paradigms were averaged to create sample phase exploration measures (e.g., total time visiting objects during the sample phase in the 1- and 48-h delay were average to create a single measure). To test for recognition memory, a one-sample t-test was conducted comparing the recognition index to a null mean of 0.5. Groups with a mean recognition index significantly above 0.5 as measured by a right-tailed one-sample t-test were considered to demonstrate recognition memory.
For individual brain region volume assessment, volume was expressed in both absolute (i.e., mm3) and relative units (i.e., regional volume as a proportion of total brain volume, within subject). Gene expression data were standardized (mean of zero and standard deviation of one) and centered by the control group, thus all z-scores for the control group are zero. Statistical significance was defined at P < 0.05 (insignificant results provided in Supplementary Tables). Post hoc comparisons for mean separation were conducted with a Tukey adjustment, and data are represented as least square means. Correlations between significant outcomes (MRI or gene expression) gene expression and the recognition index were conducted using the Pearson correlation coefficient for each diet and linear regression was used to assess the diet independent relationship between outcomes. Sample sizes for all variables assessed can be found in the Supplementary Tables.
Results
Growth and Behavior
Daily body weights were nearly equivalent between groups. Despite the BMOS + HMO group appearing to separate from the other groups, there was no difference in average daily body weight gain between groups over the course of the study (P = 0.15, Figure 2). Though milk intake was not quantified, equivalent growth suggests pigs consumed similar amounts of milk replacer per day as milk was dosed according to body weight. During the first habituation trial, pigs fed only HMO displayed less total movement in the arena as compared to controls (P = 0.008, Figure 3A). Pigs fed any diet containing BMOS (as BMOS or BMOS + HMO) displayed a lower increase in distance moved per minute across the duration of the first habituation trial than those not fed BMOS (P = 0.027, Figure 3B). There were no significant differences in any of the scored behaviors during the second habituation trial between groups (all P ≥ 0.223). During the sample phase pigs fed diets containing HMO (as HMO or BMOS + HMO) spent more time investigating objects than those not fed diets containing HMO (P = 0.032, Figure 3C). The HMO group was able to show recognition memory after a 1-h delay (one-sample t-test, P = 0.038, Figure 3D), whereas only the BMOS + HMO group displayed recognition memory after a 48-h delay (one-sample t-test, P = 0.045, Figure 3D). Despite these differences, exploratory behavior (e.g., time spent investigating or number of visits to the sample or novel object) during the test phase was not significantly different between groups (all P ≥ 0.053, Supplementary Table 1).
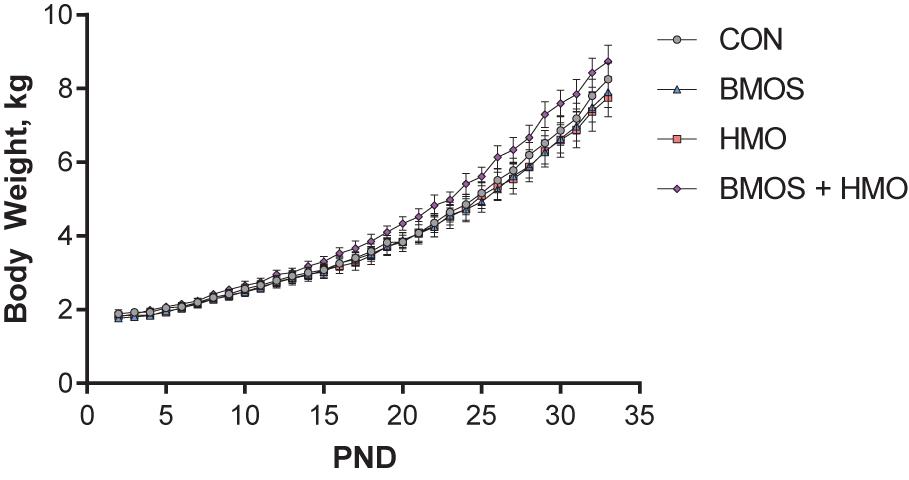
Figure 2. Body weight (BW) during the trial. No differences in average daily body weight gain were observed between groups (P = 0.15).
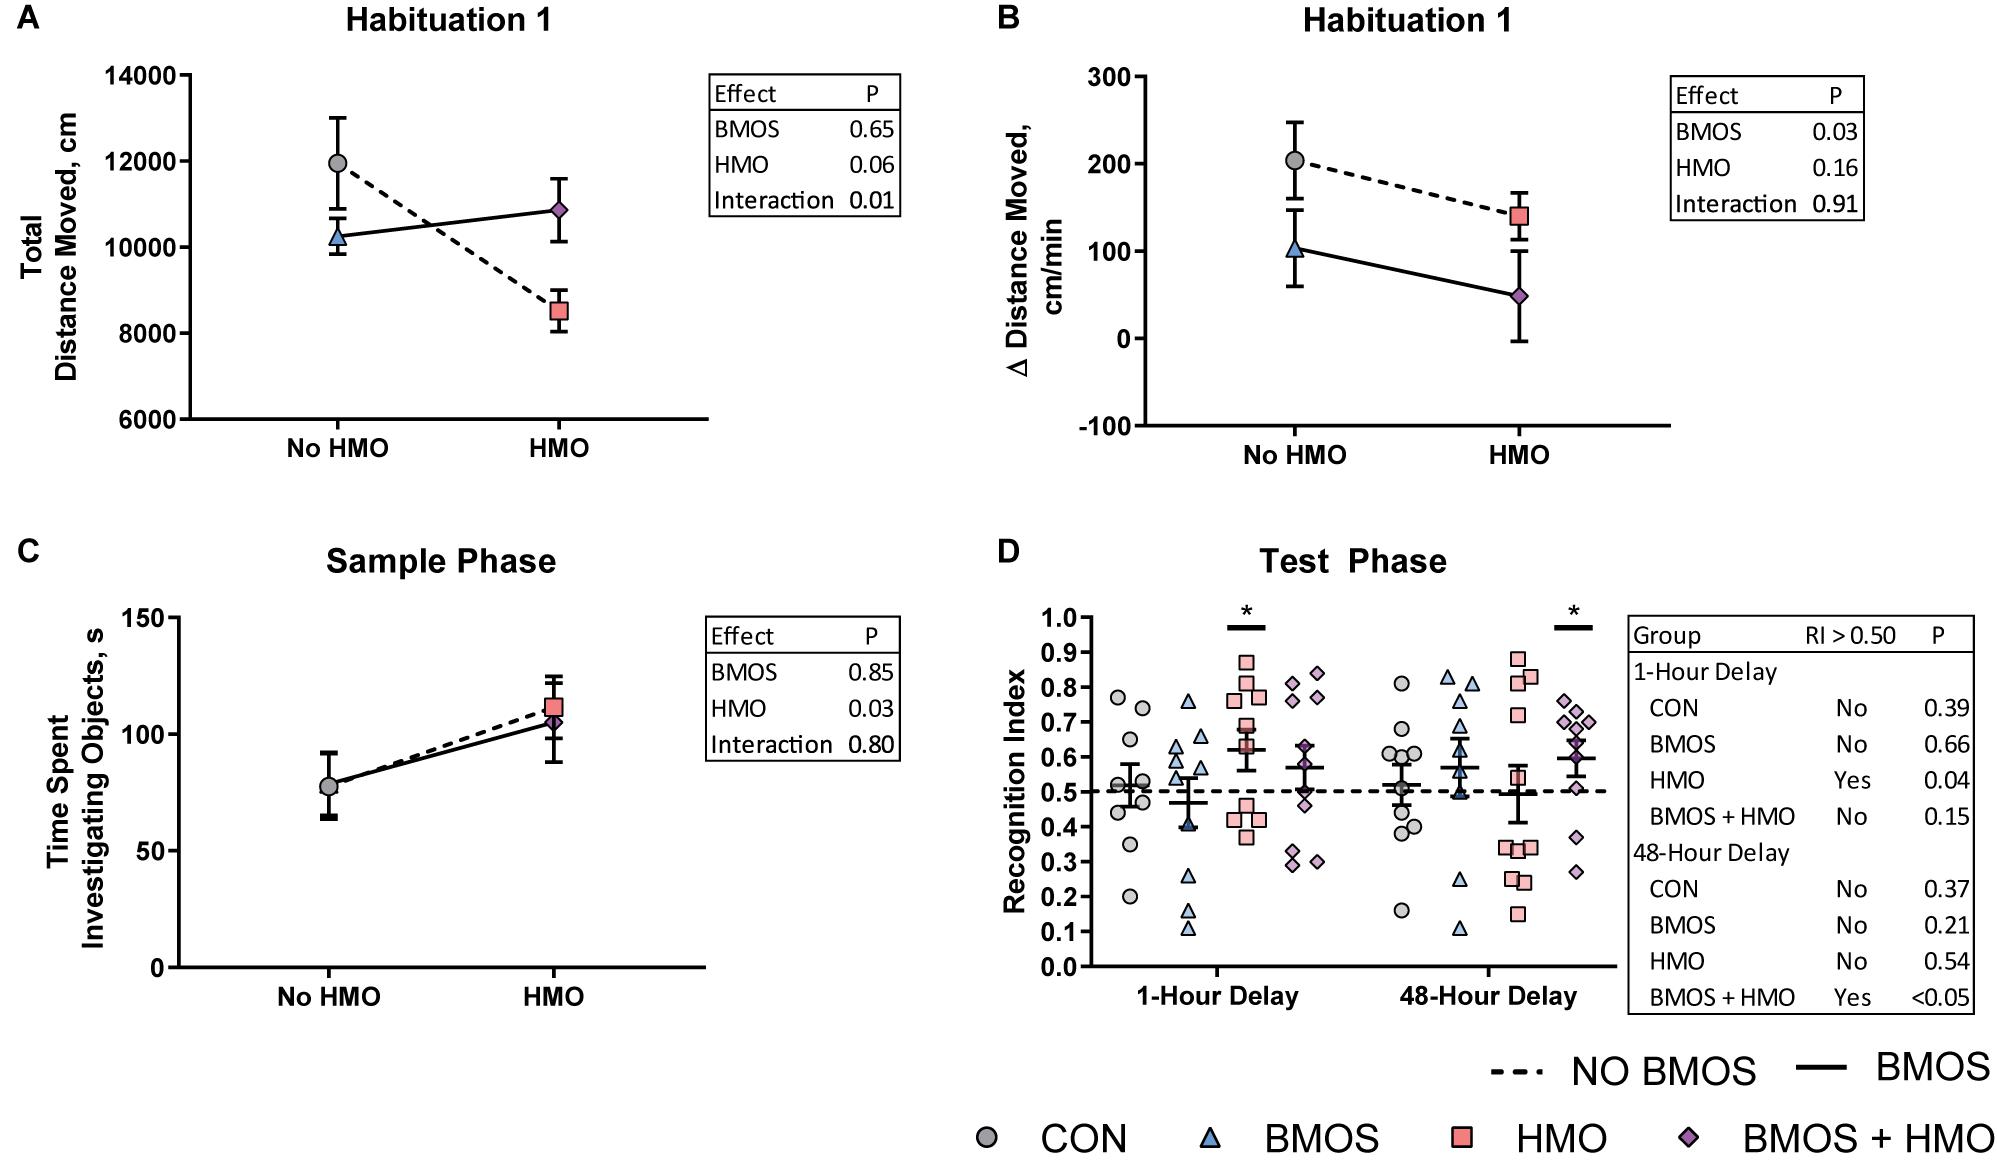
Figure 3. Performance during the novel object recognition task assessed using a two-way analysis of variance including BMOS, HMO, and their interaction. (A) An interaction effect was observed for total distance moved during the first habituation trial. (B) During the first habituation trial, pigs fed diets containing BMOS showed a lesser increase in distance moved per minute than those not fed BMOS. (C) During the sample phase pigs fed HMO in any diet spent more time investigating objects than those fed diets without HMO. (D) Pigs fed the HMO-only diet were able to display a recognition index greater than 0.5 after a 1-h delay, however only those fed both BMOS and HMO were able to display a recognition index greater than 0.5 after a 48-h delay, as indicated by the asterisks (measured by a one-sample t-test for a recognition index greater than 0.5).
Magnetic Resonance Imaging
A 3D surface rendering of the brain regions affected by the diet is shown in Figure 4. Interaction effects of BMOS and HMO were observed for absolute volumes of the caudate, hypothalamus, thalamus, and total gray matter, and a main effect of BMOS was observed for the lateral ventricle (All P ≤ 0.047, Supplementary Table 2, Figures 5A–E). For all interaction effects observed for absolute volumes, pigs provided HMO demonstrated larger volumes of these regions if the diet also contained BMOS, whereas those consuming diets without HMO demonstrated smaller volumes if the diet also contained BMOS (Figures 5A,B,D,E). As a proportion of total brain volume, interaction effects were observed for the caudate, lateral ventricle, and pons, with main effects of BMOS or HMO for the corpus callosum, lateral ventricle, left cortex, and right cortex (all P ≤ 0.042, Supplementary Table 3, Figures 5F–K). There was no impact of diet for any DTI measure (AD, MD, RD, or FA, all P ≥ 0.063, Supplementary Table 4). Of the MRS outcomes, only glutathione, myo-inositol, N-acetylaspartate, and γ-amino butyric acid met criteria for inclusion, however none were altered by diet (all P ≥ 0.057, Supplementary Table 5).
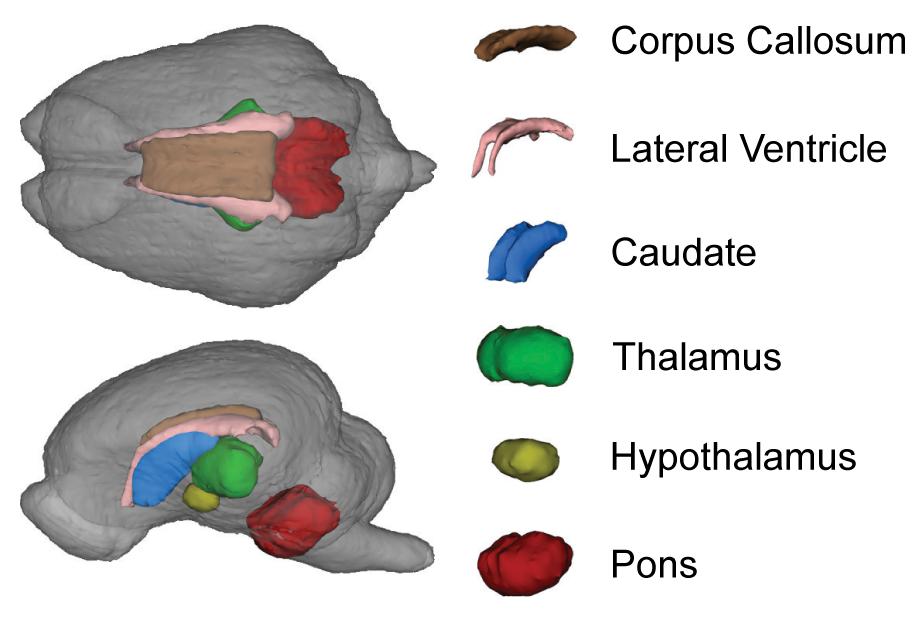
Figure 4. Representative 3D surface rendering of the brain from the pig brain atlas. Only brain regions altered by the diet are shown. Although affected by diet, the cortices and gray matter are not highlighted to allow visualization of subcortical structures.
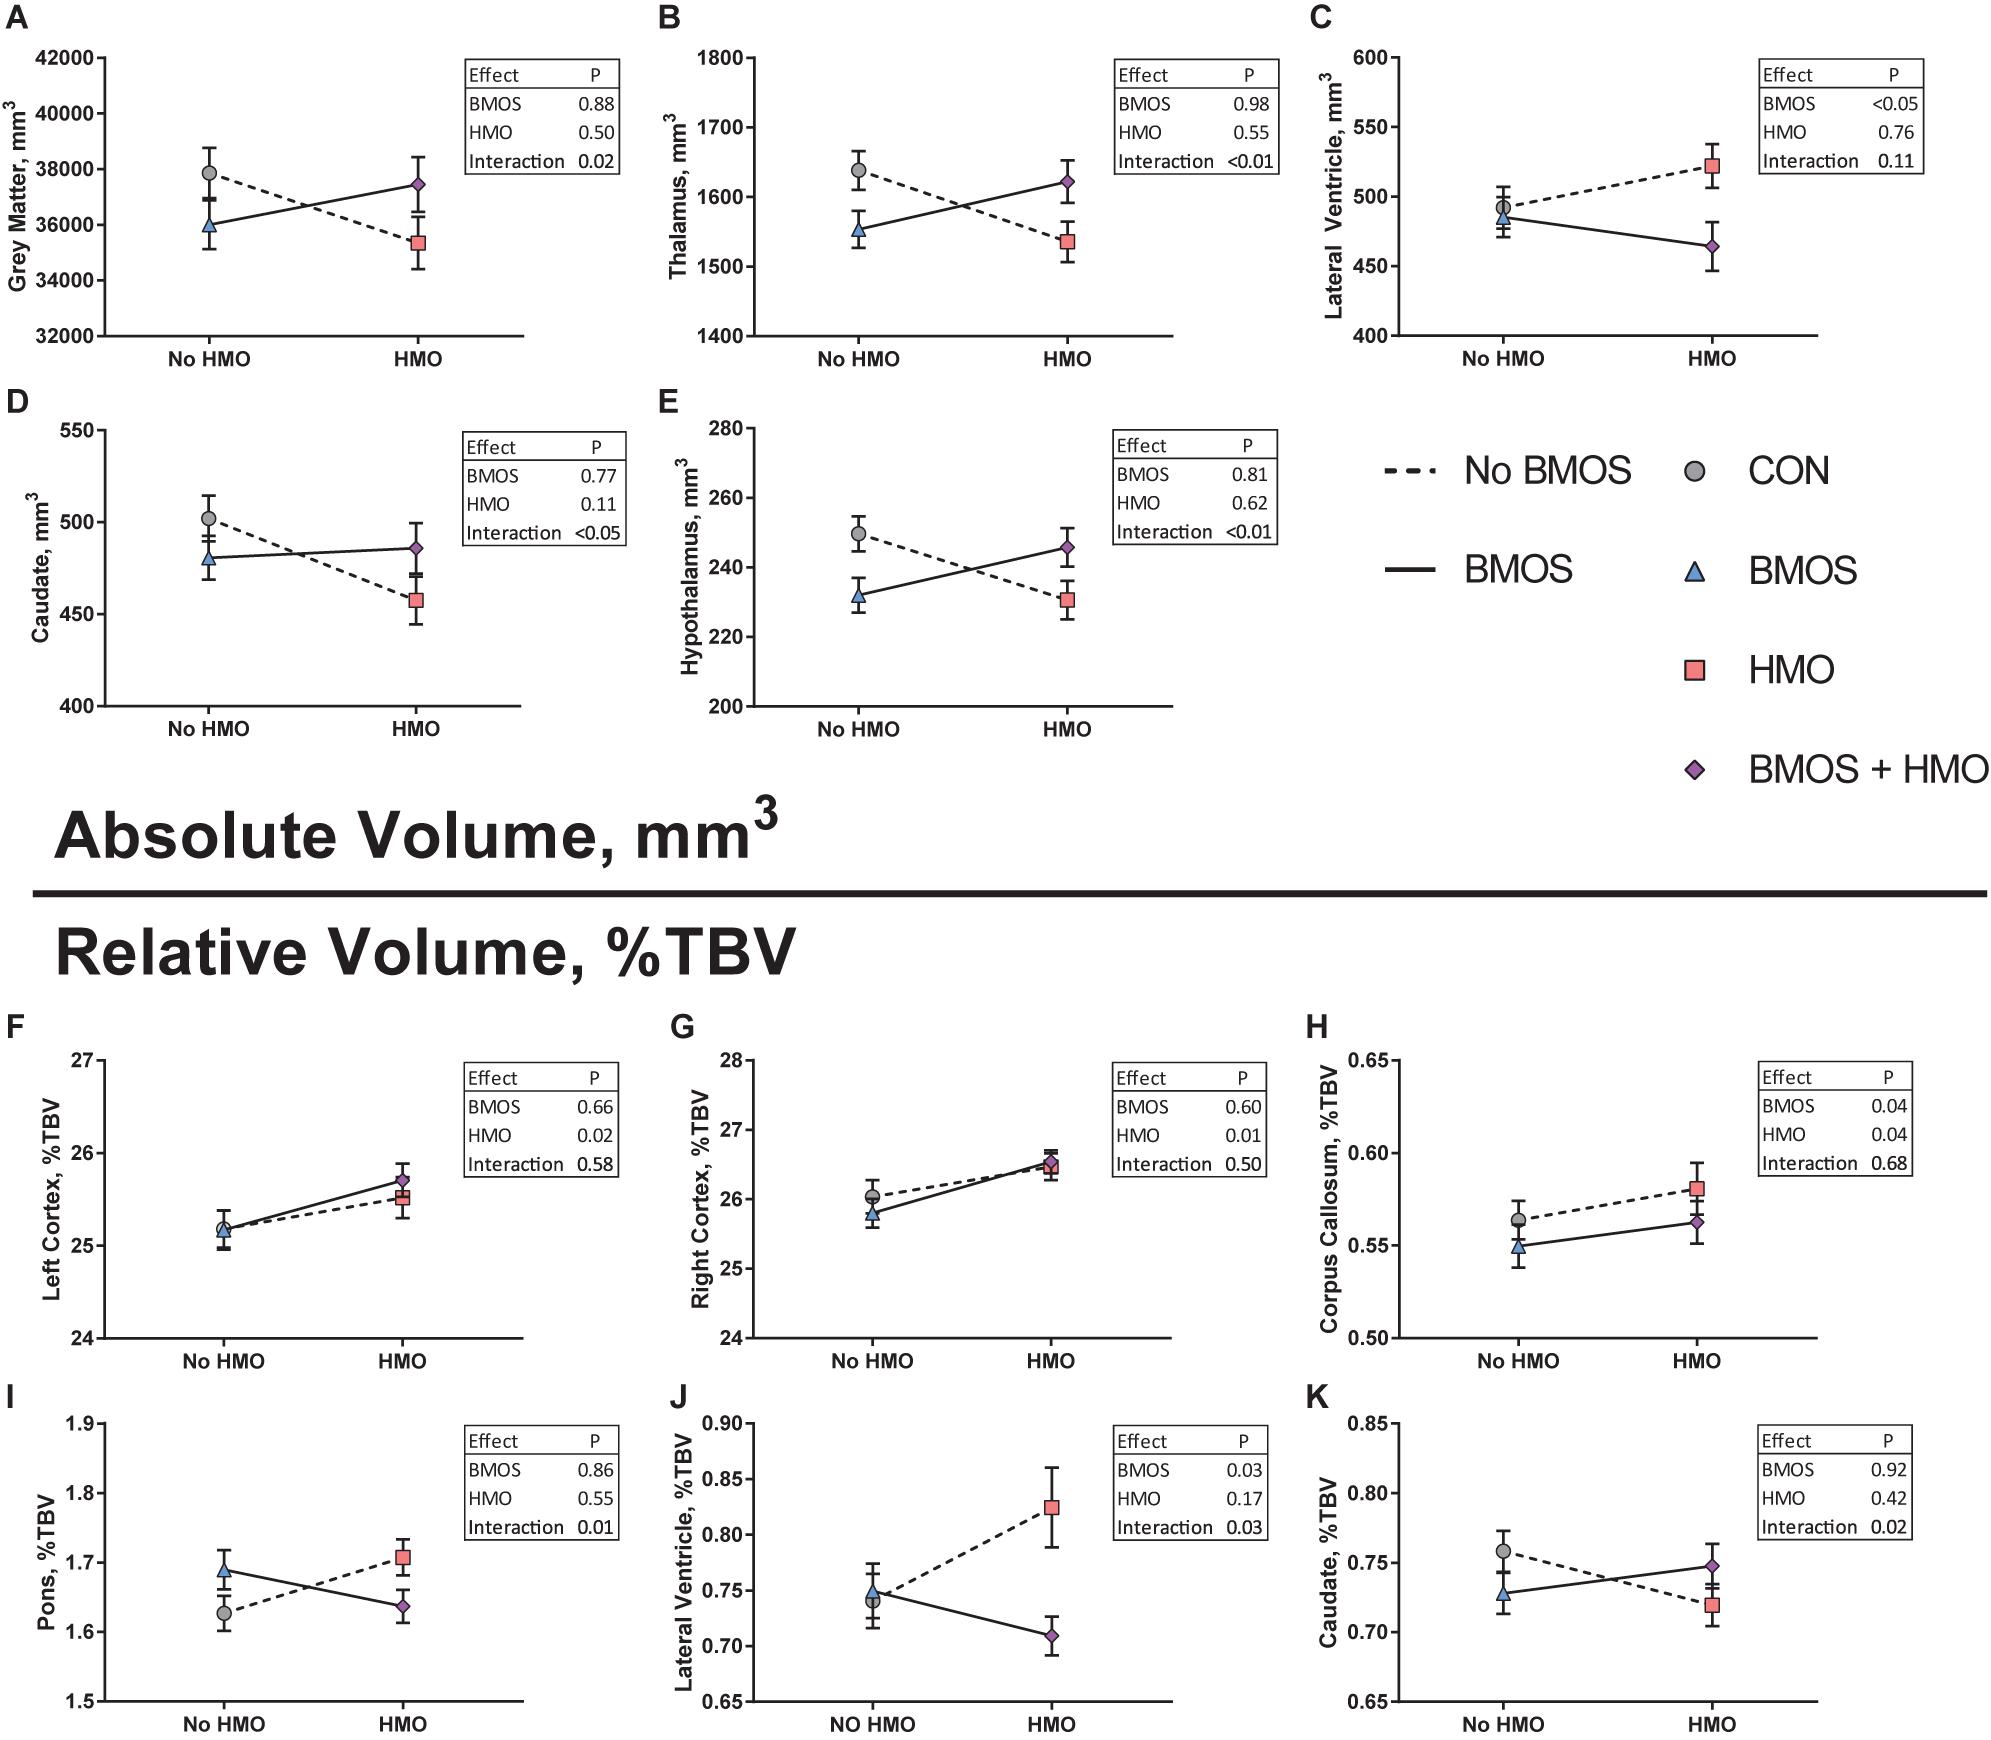
Figure 5. (A–E) Absolute volume of regions affected by diet assessed using a two-way analysis of variance including BMOS, HMO, and their interaction. In each case, (except C) an interaction effect was observed wherein pigs fed the CON or BMOS + HMO diet displayed similar absolute volumes compared to pigs fed either BMOS or HMO. (F–K) Relative volumes of regions affected by diet. (F,G) A main effect of HMO was seen for both the left and right cortices, pigs fed any diet containing HMO demonstrating larger relative cortices. (H) Pigs fed diets containing HMO had a larger relative corpus callosum, whereas pigs fed diets containing BMO had a smaller relative corpus callosum. (I–K) Similar to the effects seen for absolute volumes, interactions effects of diet for relative volumes of the caudate, lateral ventricle, and pons were observed, wherein pigs fed the CON or BMOS + HMO diet displayed similar relative volumes compared to pigs fed either BMOS or HMO.
Hippocampal Gene Expression
No samples were found outside the normalization factor ranges for positive controls (0.3–3.0) or housekeeping genes (0.1–10). Some samples demonstrated mRNA counts of some genes below the threshold for background subtraction, and these are detailed in Table 3 and Supplementary Table 6. Numerous effects of diet were observed for measures of hippocampal mRNA expression. Outcomes affected included: serotonin receptor 1 (5HTR1), the cholinergic receptor muscarinic 3 (CHRM3), the GABA type A receptor subunit β2 (GABRB2), the GABA type A receptor subunit ρ1 (GABRR1), the glycine receptor α4 (GLRA4), the glutamate ionotropic receptor NMDA type subunit 1 and subunit 2D (GRIN1 and GRIN2D), the histone deacetylase 5 (HDAC5), the neural cell adhesion molecule 1 (NCAM1), the Nuclear Receptor Subfamily 4 Group A Member 2 (NR4A2), the Solute Carrier Family 17 Member 6 (SLC17A6), the Solute Carrier Family 18 Member A2 (SLC18A2), the Solute Carrier Family 1 Member 7 (SLC1A7), the Solute Carrier Family 6 Member 3 (SLC6A3), and the synaptosome associated protein 25 (SNAP25) (all P ≤ 0.048). Both BMOS and HMO groups showed downregulation of many genes compared to controls, whereas pigs fed BMOS + HMO displayed upregulation of those same genes. See Table 3 and Figure 6A for a description of the effects observed. After a Tukey adjustment for multiple comparisons, only CHRM3, GABRB2, GLRA4, and SLC1A7 were significantly altered by diet (Table 3). To visualize the general trend for mRNA to be up- or downregulated as compared to controls, within diet, genes were ordered by descending average Z-score and plotted on a heatmap (Figure 6B). Results for all genes measured can be found in Supplementary Table 6.
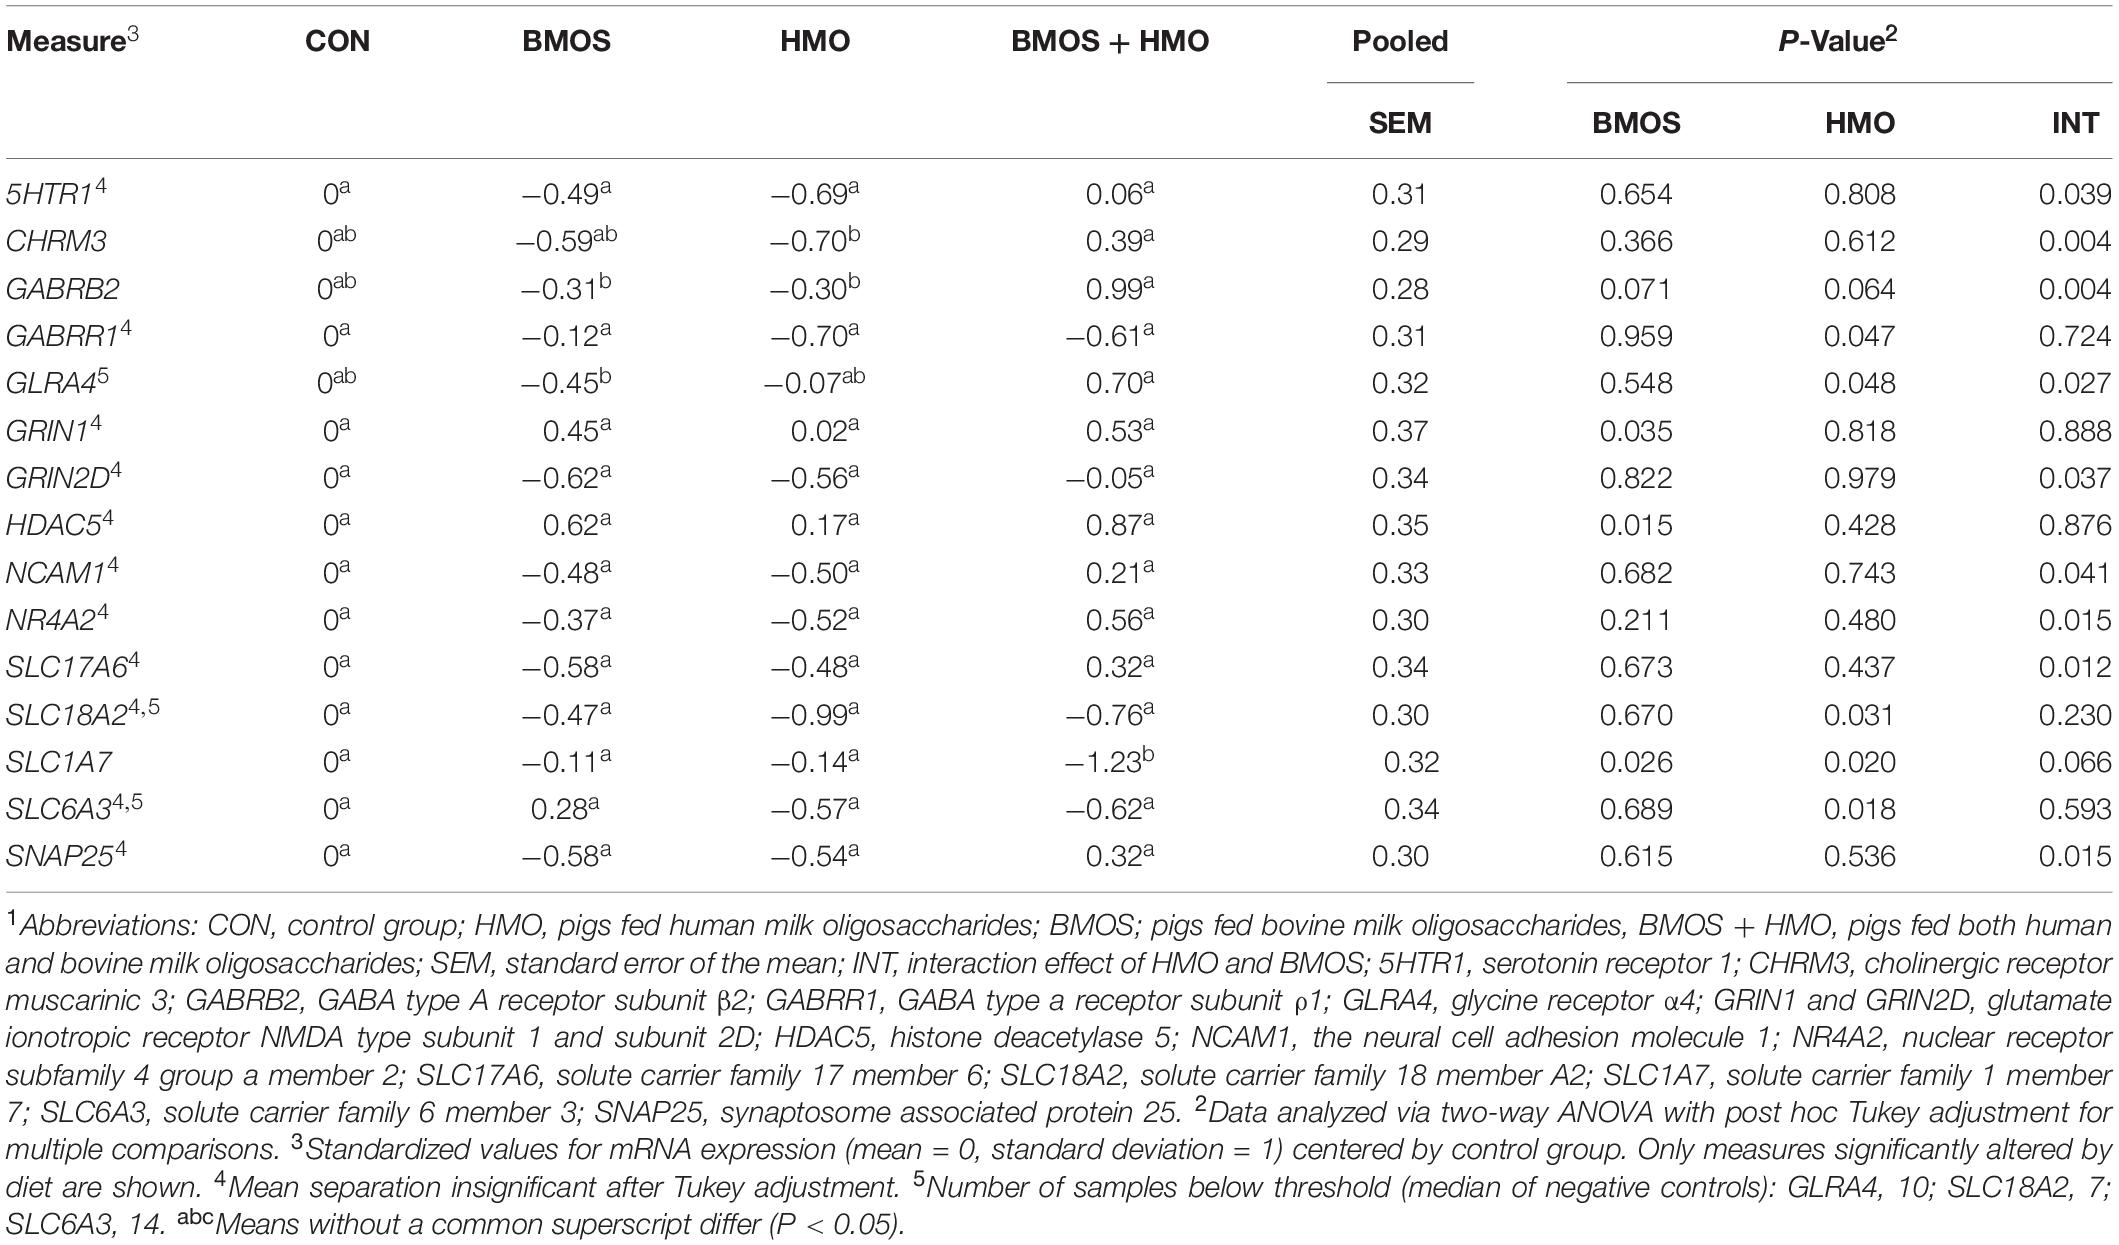
Table 3. Standardized mRNA expression of genes affected by dietary treatment1.
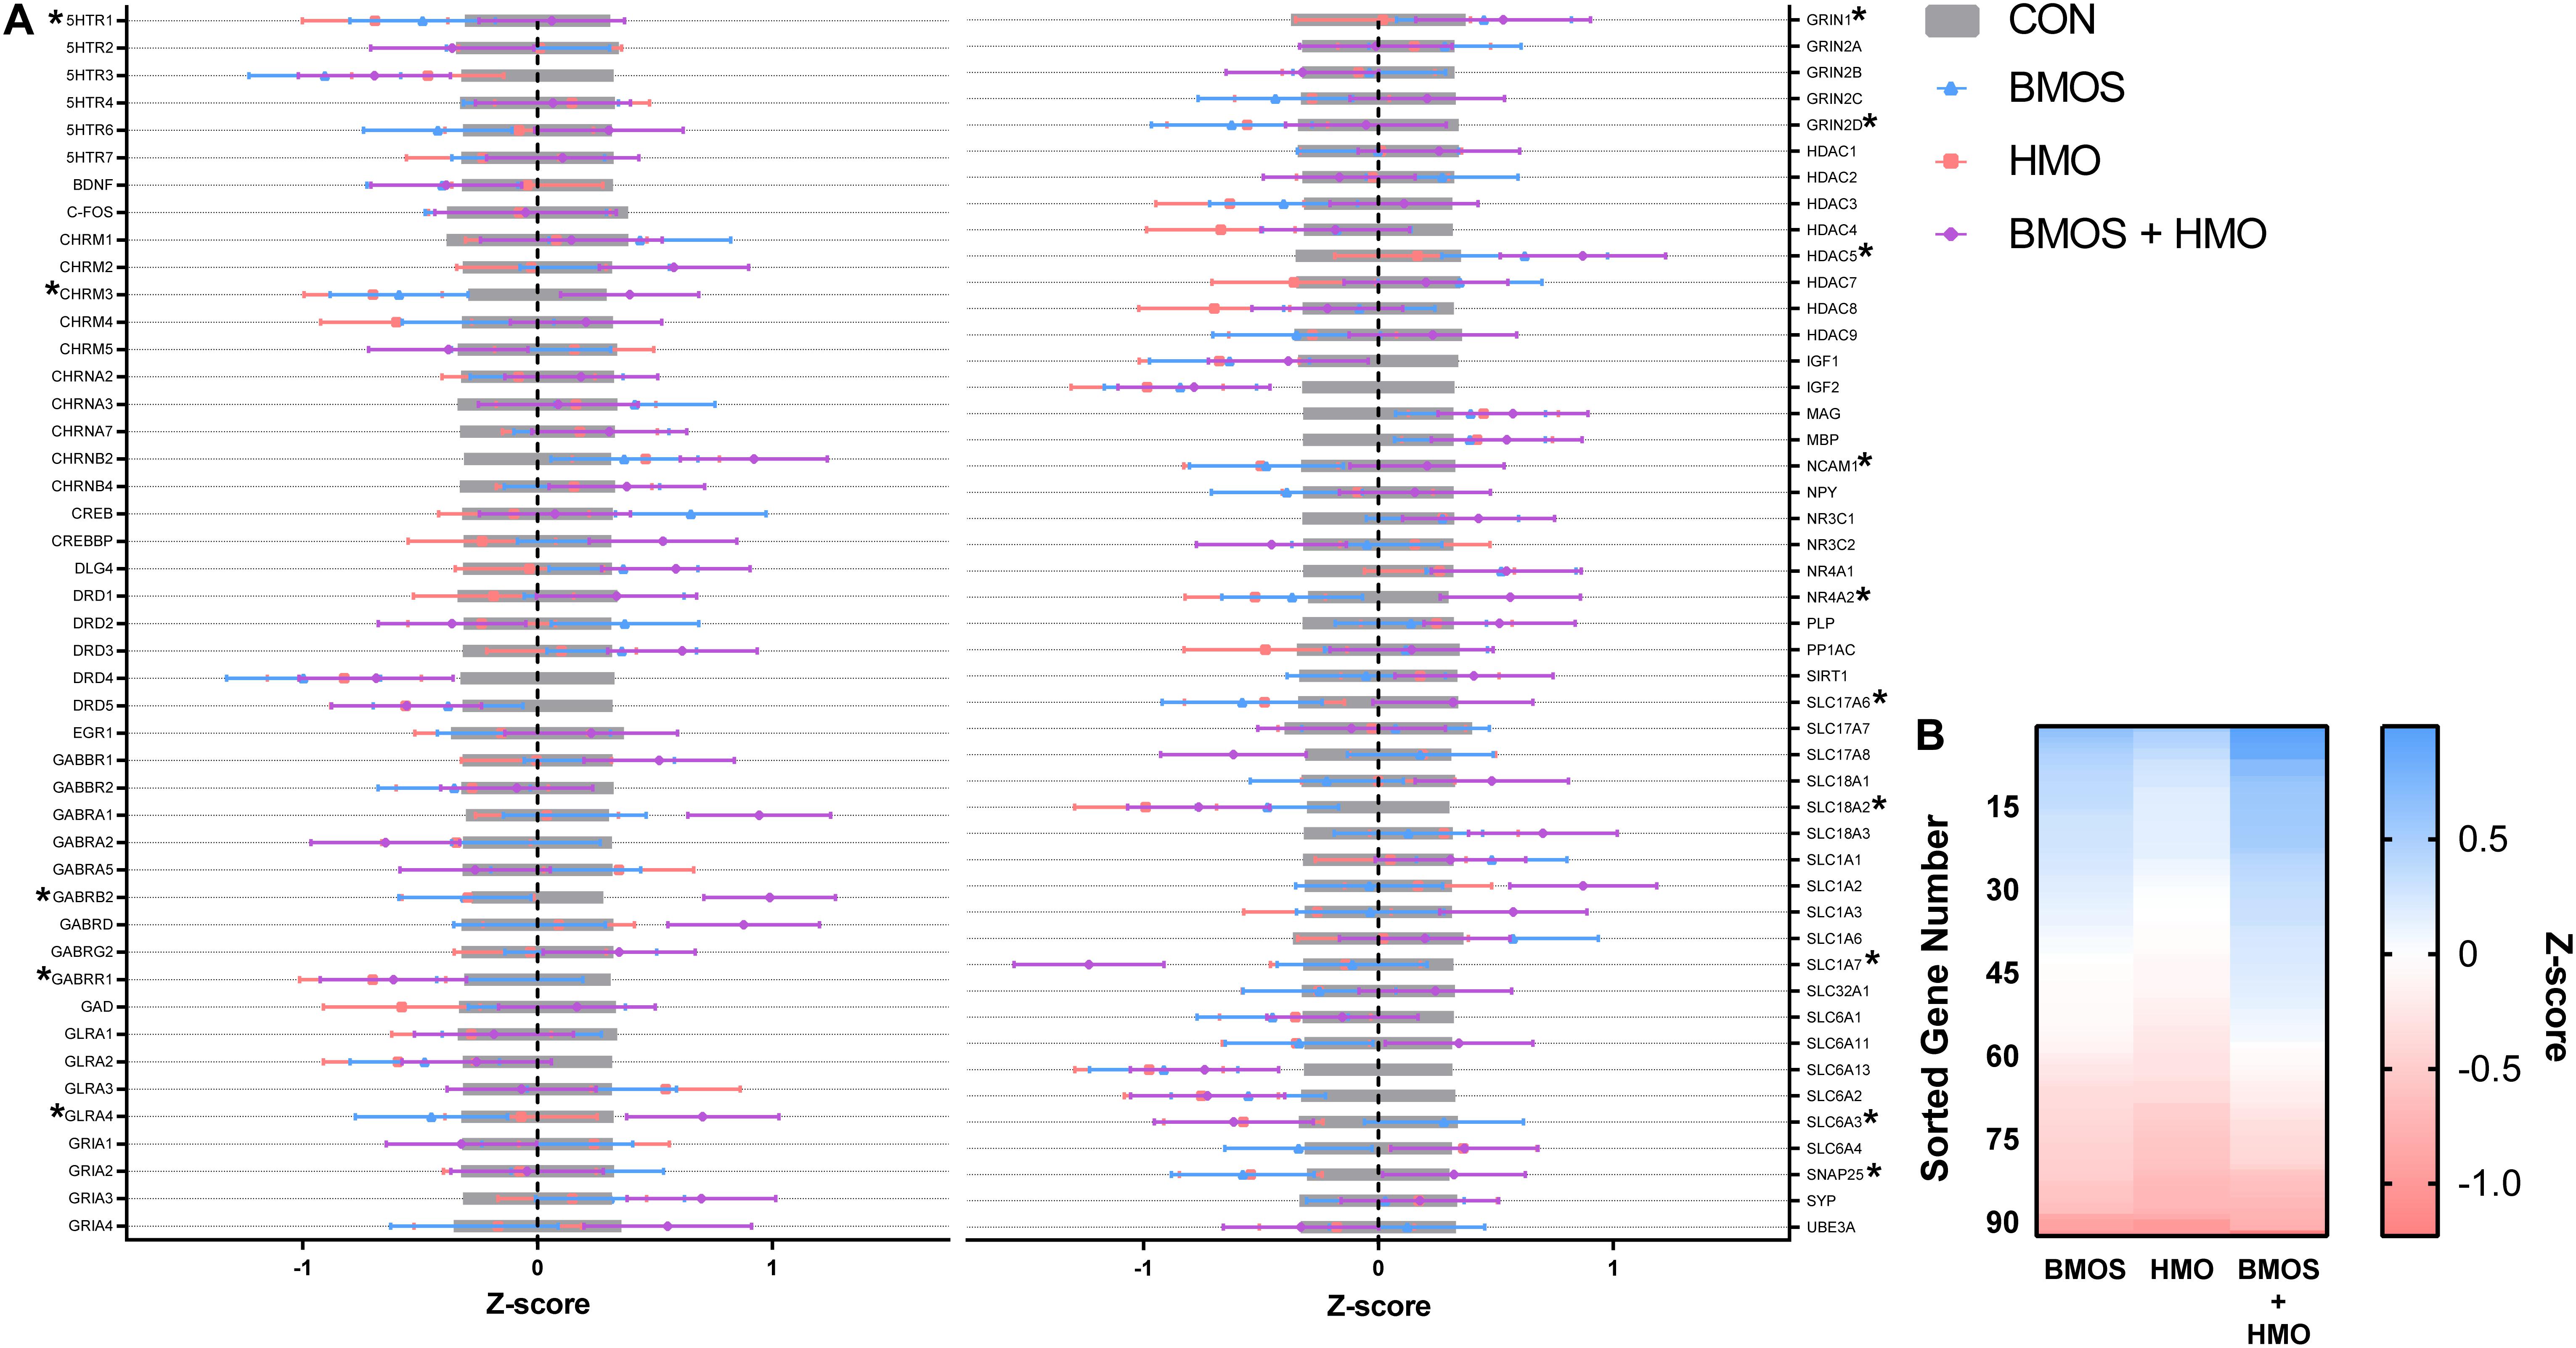
Figure 6. (A) Hippocampal tissue was assessed for the mRNA expression of 93 genes. Figure depicts standardized data (mean = 0, standard deviation = 1) centered by control group. Values below zero indicate decreased expression compared to control, whereas values above zero indicate increased expression. Bars show mean ± standard error, genes significantly impacted by diet are denoted by an asterisk. Accession numbers for each gene can be found in Supplementary Table 6. (B) Genes were sorted in descending order by Z-score for each diet, visualizing the trend where the HMO group exhibited greater downregulation of mRNA compared to the BMOS or BMOS + HMO group. CON, control group; BMOS, pigs fed a mixture of bovine milk oligosaccharides; HMO, Pigs fed 2’-fucosyllactose + Lacto-N-neotetraose; BMOS + HMO, pigs fed both human and bovine milk oligosaccharides.
Correlation Analysis
To assess whether the outcomes were related or simply co-occurring, post hoc correlations and regression were conducted against the recognition indices from the 1 and 48-h delay trials against only those MRI and mRNA expression outcomes significantly affected by diet. A linear regression was conducted independent of diet (diet was not included in the model) to understand the overall trend between outcomes, and correlations were performed by diet group. Using the recognition index after a 1-h delay, four significant linear relationships were found between the recognition index and GABRR1, GRIN1, HDAC5, and SLC1A7 (all P ≤ 0.028, Figure 7). There were no relationships between significant MRI outcomes and the recognition index on either delay (all P ≥ 0.12), and no relationships between significant gene expression outcomes and the recognition index after a 48-h delay (all P ≥ 0.11). Results for all correlations and regressions can be found in Supplementary Tables 7, 8.
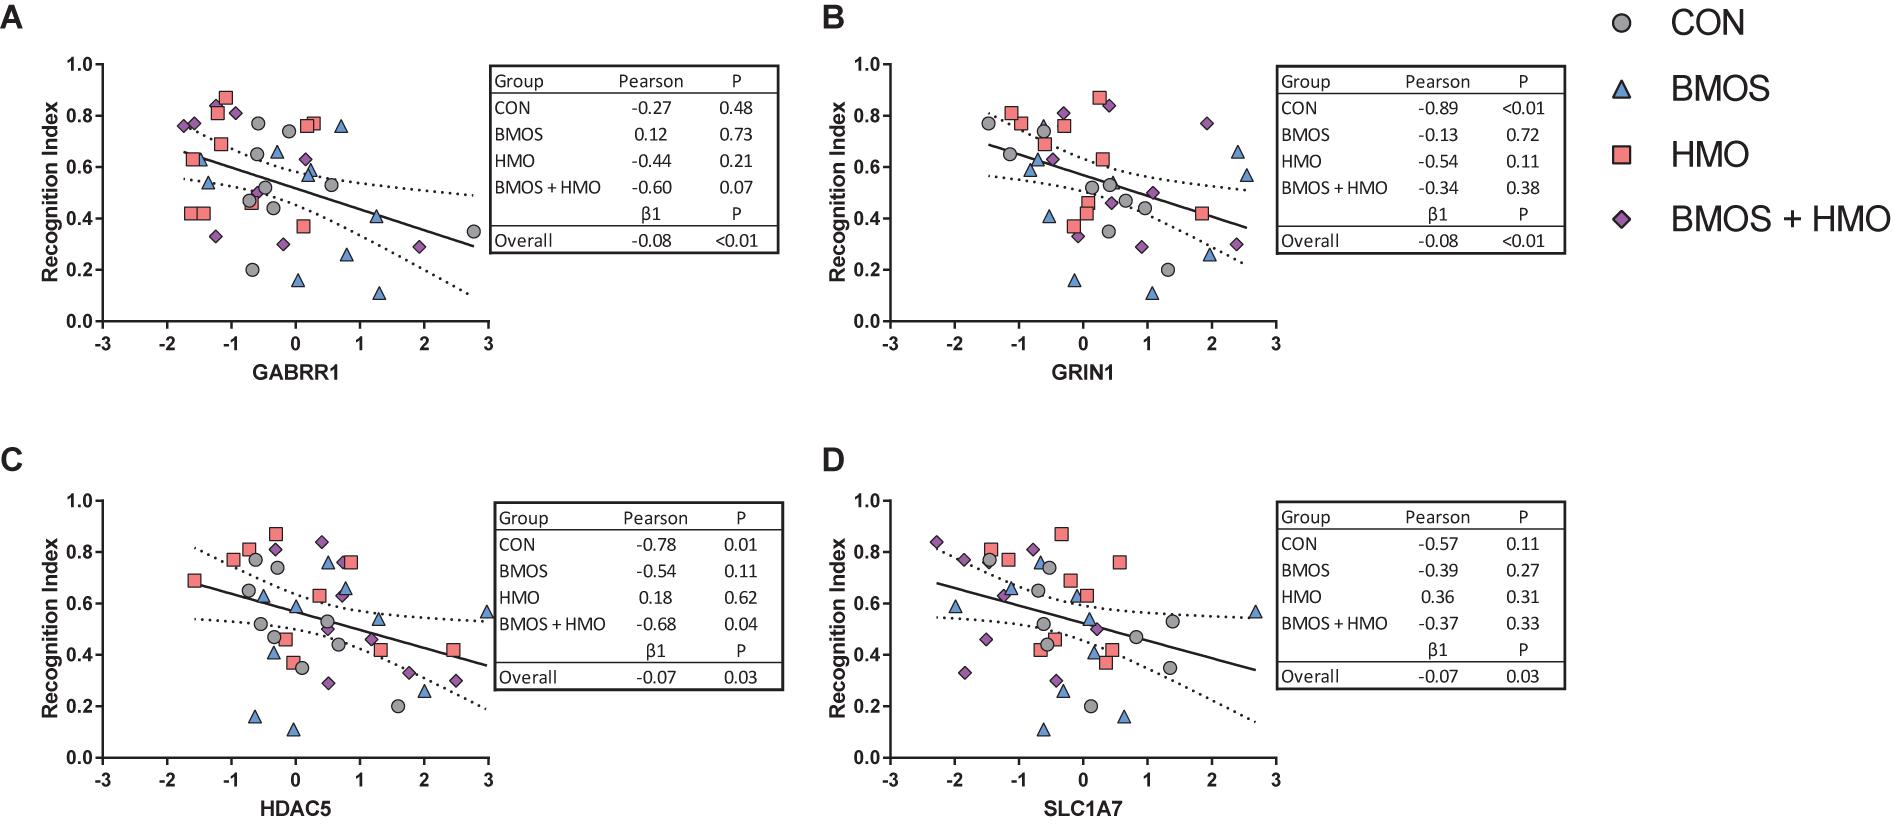
Figure 7. Of the variables affected by diet, the genes (A–D) GABRR1, GRIN1, HDAC5, and SLC1A7 were shown to correlate with the recognition index after a 1-h delay. No relationships were found between MRI or gene expression outcomes affected by diet and the recognition index after a 48-h delay. The relationships observed were not present equally across all diets, however, study-wide all were negatively related to the recognition index.
Discussion
The objective of this study was to assess the effect of early life dietary supplementation with HMO, BMOS, and their combination on promoting recognition memory, and altering brain structure and hippocampal mRNA expression. We found that while both BMOS and HMO are capable of affecting behavior, they appeared to do so in different ways. Furthermore, they had differential effects on both gene expression and MRI measures. Importantly, the study design was limited by the use of different doses for each source of oligosaccharide. However, this design was chosen to replicate the doses used in previous clinical trials (Meli et al., 2014; Marriage et al., 2015; Cooper et al., 2016; Goehring et al., 2016; Puccio et al., 2017; Radke et al., 2017). Provided this limitation and the inability to make a direct comparison between OS controlled for dose, the data suggest that OS are capable of affecting and improving behavior yet had less clear of an impact on MRI and gene expression measures. While several studies have examined the effect of single oligosaccharide supplementation on cognition and brain development (Schmidt et al., 2015; Vázquez et al., 2015, 2016; Jia et al., 2016; Savignac et al., 2016; Fleming et al., 2017; Yen et al., 2017), here we explored the individual and combined effects of BMOS and HMO.
The concentrations and diversity of OS in human milk vary to a great extent (McGuire et al., 2017). One of the most well studied OS, 2′-FL, is not even secreted in all women (Bode, 2012). Some broad species comparisons can still be made, however. The OS in human milk are primarily composed of neutral fucosylated OS, followed by neutral non-fucosylated, acidic (i.e., sialyllated), and acidic fucosylated OS (Kirmiz et al., 2018). Bovine milk is primarily composed of acidic and neutral non-fucosylated OS (Kirmiz et al., 2018). Although an oversimplification of their differences, bovine milk is largely absent in fucose containing OS and concentrated in sialic acid containing OS, whereas a significant portion of HMO contain fucose rather than sialic acid. Despite their differences in concentration, bovine milk does contain OS found in human milk [notably 3 or 6′-SL, 2 or 3′-FL, and LNnT (Aldredge et al., 2013)]. In the present study, the HMO provided were a combination of 2′-FL and LNnT, whereas the BMOS were predominantly a mixture of GOS, with small amounts of sialyllactose. Therefore, pigs fed the HMO diet consumed a diet with OS content similar to that of human milk (OS were either neutral fucosylated or neutral non-fucosylated), and those fed BMOS consumed a diet closer to that of bovine milk (mostly neutral non-fucosylated with small amounts of acidic OS).
Pigs consuming only HMO were able to display recognition memory after a 1-h delay, whereas only those pigs consuming both HMO and BMOS were able to display recognition memory after a 48-h delay. Pigs consuming the control diet were unable to display recognition memory on either the 1- or 48-h delay, however this has been typical of pigs not provided a prebiotic (Fleming et al., 2017). Although the effects on recognition memory are variable, pigs consuming any diet containing HMO displayed increased time investigating objects during the sample phase, clearly demonstrating that the presence of HMO in the diet increased object exploration.
Similar to behavior, consumption of HMO or BMOS did not produce consistent effects on the volume of various brain regions, rather the effects observed were specific to each brain region and varied between diets. On an absolute basis, a main effect of BMOS for the lateral ventricle and interaction effect of BMOS and HMO were observed for the gray matter, thalamus, caudate, and hypothalamus (Figures 5A–E). Relative to total brain volume, pigs fed any diet containing HMO demonstrated large volumes of the cortices and corpus callosum (Figures 5F–H). Additionally, a main effect of BMOS was found in the corpus callosum where BMOS-fed pigs demonstrated lower volume than pigs not fed BMOS (Figure 5H). There was an interaction of BMOS and HMO for the pons, lateral ventricle, and caudate. For the pons, supplementation with diets containing only BMOS or HMO increased the relative volume compared to controls and pigs fed BMOS + HMO, which demonstrated similar relative volumes (Figure 5I). In the lateral ventricle, both a main effect of BMOS and an interaction effect of BMOS + HMO were observed. Pigs fed diets containing HMO demonstrated the largest relative volume, with pigs fed BMOS + HMO the smallest (Figure 5J). Lastly, pigs fed BMOS + HMO demonstrated larger relative volumes of the caudate as compared to those fed only BMOS or HMO (Figure 5K).
Whether these changes are beneficial or detrimental is unclear, none of these changes appeared to be related to recognition memory when assessed via linear regression (Supplementary Tables 8, 9). Based on the absolute and relative volumes, the interaction effects show that the control and BMOS + HMO groups have similar values for almost all regions (with the exception of the lateral ventricle, cortices, and corpus callosum). Essentially, regional size was similar between pigs given no OS or both BMOS + HMO. An important confounder however is that the dosage of oligosaccharide was not controlled for. Therefore, pigs given HMO, BMOS, and BMOS + HMO consumed increasing levels of oligosaccharide, respectively. The pattern wherein pigs given HMO or BMO differ from those provided the control diet or HMO + BMOS may be indicative of a dose effect, however, this pattern is not evident in either behavioral or mRNA expression data. Past research from our lab has demonstrated that supplementation with sialyllactose had no effect on regional brain volumes but was able to alter the diffusivity of the corpus callosum and left hippocampus (Mudd et al., 2017). When supplemented with a mixture of prebiotics, lactoferrin, and milk fat globule membrane, the gray and white matter concentrations were most notably altered in the left and right cortex (Mudd et al., 2016a). Despite these changes, no differences were observed for spectroscopy or DTI in this study, suggesting that the diet did not affect white matter integrity or gross metabolic state.
When we examined hippocampal mRNA expression, intake of BMOS or HMO produced significant downregulation of several genes, whereas the intake of both BMOS and HMO produced upregulation in those same genes (of those shown in Table 3, GABRR1, GRIN2D, SLC18A2, SLC1A7, and SLC6A3 did not follow this trend). Genes affected were related to many processes, however after a post hoc Tukey adjustment for multiple comparisons four genes were found most impacted by diet: GABRB2, SLC1A7, GLRA4, and CHRM3. As the genes affected represent several distinct processes (GABAergic, glutamatergic, and histone deacetylation) and were not affected by the diet in any clear pattern, we conducted a diet-independent linear regression to assess whether they were related to recognition memory. Interestingly, no gene examined correlated with recognition memory after a 48-h delay. Of all the genes affected shown in Table 3, four were significantly related to the recognition index after a 1-h delay: GRIN1, GABBR1, HDAC5, and SLC1A7 (Figure 7). The downregulation of these genes was related to increased recognition memory. When taking diet into account, the presence of a relationship was highly variable. The relationship between the recognition index and GRIN1 was driven by the control group, the relationship between the recognition index and HDAC5 was driven by the control and BMOS + HMO group, and only an overall relationship was observed between the recognition index and GABRR1 or SLC1A7 (Figure 7).
How consumption of oligosaccharides affects these genes is unclear. 2′-Fucosyllactose has been shown to alter post-synaptic density protein 95, phosphorylated Ca2+/calmodulin-dependent protein kinase, and brain derived neurotrophic factor (Vázquez et al., 2015), but more evidence on the effect of prebiotics on gene expression in the brain has been generated from research on GOS. Brain derived neurotrophic factor, N-methyl-D-asparate receptor (NMDAR), and NMDAR subunits GluN1, GluN2A, and GluN2B in the hippocampus or cortex have been shown to be affected by prebiotic intake (Savignac et al., 2013, 2016; Williams et al., 2016; Gronier et al., 2018; Kao et al., 2018). In some cases, prebiotic intake was found not to impact structural/growth related proteins such as microtubule-associated-protein-2 and growth-associated-protein-43, perhaps suggesting a role of prebiotics in the modulation of molecular rather than structural components in the brain. We had previously hypothesized that HDACs may be involved in cognition via the inhibitory action of short-chain fatty acids, fermentative end products of microbial digestion in the colon. Short-chain fatty acids are known to act indirectly via transcriptional regulation as HDAC inhibitors or directly to modulate satiety (Frost et al., 2014), neurogenesis (Kim et al., 2009), and blood-brain-barrier integrity (Braniste et al., 2014). However, evidence that local signaling via the vagus nerve or the circulation and absorption of butyrate and/or acetate in the blood and brain is lacking. It is tempting to put forth the hypothesis that HDAC5 is a key regulator of cognitive development in context of OS consumption, however it is important to keep in mind that these two effects were simply co-occurring, and there may be an unmeasured variable that better explains the effect of oligosaccharide intake on cognition.
Initial evidence demonstrated that impairment of fucosylation in the rat hippocampus attenuates memory retention during a discrimination task (Jork et al., 1986). Conversely, incorporation of fucose into glycoproteins in chicks increased after a passive avoidance task (Sukumar et al., 1980). These studies demonstrated that fucosylation plays a large role in memory processes. Since then, studies have shown that administration of fucose or 2′-FL impacts long-term potentiation (LTP) in the hippocampus, a molecular process that facilitates synaptic transmission and is believed to be the mechanism of long-term memory storage in the hippocampus (Baudry, 2001). Rats intrahippocampally injected with L-fucose or 2′-FL demonstrated prolonged LTP duration compared to those injected with lactose (Krug et al., 1994). This effect was later replicated ex vivo, as bath application of L-fucose and 2′-FL, but not D-Fucose or 3′-FL, to rat hippocampal slices enhanced LTP by increasing the field excitatory postsynaptic potential and potentiation of the population spike amplitude (Matthies et al., 1996).
Although these studies demonstrated a strong link between fucose and memory function, the administration of fucose was independent of the diet, thus fucose and 2′-fucosyllactose bypassed the gastrointestinal system. More recent work demonstrated that rats and mice fed 2′-FL demonstrated increased and longer lasting potentiation of Schaffer collateral neurons in the CA1 region of the hippocampus (Vázquez et al., 2015). These animals also displayed increased performance on place learning, working memory, and fixed-ratio lever pressing tasks in an operant box, suggesting multiple cognitive domains were enhanced by 2′-FL intake. A follow up study from the same lab demonstrated that rats fed L-fucose did not demonstrate the same enhancement of LTP as those fed 2′-FL, and subdiaphragmatic bilateral vagotomy abolished the 2′-FL dependent increase in LTP (Vázquez et al., 2016). This study provided two critical components to understanding the mechanism of action behind 2′-FL mediated increases in cognition. First, ingestion of intact 2′-FL and not L-fucose is required for cognitive enhancement. Second, the cognitive enhancing effect of 2′-FL is mediated by the vagus nerve. Therefore, although 2′-FL is absorbed by the gut as evidenced by increased concentrations in plasma and urine in infants (Marriage et al., 2015), it is likely that absorbed 2′-FL does not act directly on the brain to promote cognition, but indirectly through vagal communication between the gut and brain. These data strongly suggest that although fucose is present as a glycoconjugate in the brain, the intake of fucose is not the primary driver of enhanced cognition.
If 2′-FL acts via some prebiotic action to improve cognition, this would be consistent with the observation that monosaccharide-based OS with prebiotic activity (e.g., FOS or GOS) are also capable of improving cognition (Kao et al., 2016). The hypothesis that all OS act via some specific prebiotic action to improve cognition provides a unifying explanation for the underlying mechanism but does not explain the differences observed between BMOS and HMO in the present study. If HMO are unique compared to other OS in the properties they impart to the immune system (Comstock et al., 2017), perhaps they might also be unique in their cognitive promoting abilities.
Conclusion
To date, early life supplementation with oligosaccharides has generally been shown to either impart neutral or beneficial effects on cognition and brain development. Here, we investigated the impact of early life dietary supplementation with human and/or BMOS on cognition, structural brain development, and hippocampal mRNA expression. The brain regions affected included both cortical and subcortical regions yet measures of myelination or spectroscopy were largely unaffected by the diet. Although mRNA expression of several genes was affected, those related to behavior were most closely involved in GABAergic, glutamatergic, and histone deacetylation pathways. These relationships were highly dependent on the diet consumed, further highlighting the need to delineate the mechanisms behind gut-brain-axis communication and oligosaccharide consumption.
Data Availability Statement
The datasets presented in this article are not readily available because they are the property of Nestlé. Requests to access the datasets should be directed to Ryan Dilger, cmRpbGdlcjJAaWxsaW5vaXMuZWR1.
Ethics Statement
The animal study was reviewed and approved by University of Illinois at Urbana-Champaign Institutional Animal Care and Use Committee.
Author Contributions
SF, AM, JY, JH, PS, SD, and RD contributed to the study design and interpretation. SF and AM contributed to the study execution. SM performed the gene expression analysis. SF, AM, and RD, performed the statistical analysis. All authors read and approved the final version of the manuscript.
Funding
This study was funded by Nestlé.
Conflict of Interest
JH, JY, SM, and PS are employees of Nestlé. SD and RD have consulted for and received grant funding from Nestlé. SF and RD both share ownership in Traverse Science.
The remaining author declares that the research was conducted in the absence of any commercial or financial relationships that could be construed as a potential conflict of interest.
Acknowledgments
We would like to thank Kristen Karkiewicz for her assistance with rearing the animals and Alex Elliot for her assistance with the behavioral analysis. Lastly, we would also like to thank Brad Sutton and the rest of the Beckman Imaging Center staff for their help in imaging acquisition and data analysis.
Supplementary Material
The Supplementary Material for this article can be found online at: https://www.frontiersin.org/articles/10.3389/fnins.2020.00770/full#supplementary-material
Footnotes
References
Aldredge, D. L., Geronimo, M. R., Hua, S., Nwosu, C. C., Lebrilla, C. B., and Barile, D. (2013). Annotation and structural elucidation of bovine milk oligosaccharides and determination of novel fucosylated structures. Glycobiology 23, 664–676. doi: 10.1093/glycob/cwt007
Baudry, M. (2001). “Long-term Potentiation (Hippocampus),” in International Encyclopedia of the Social & Behavioral Sciences, Ed. P. Baltes (Amsterdam: Elsevier), 9081–9083. doi: 10.1016/B0-08-043076-7/03435-5
Bode, L. (2012). Human milk oligosaccharides: every baby needs a sugar mama. Glycobiology 22, 1147–1162. doi: 10.1093/glycob/cws074
Braniste, V., Al-Asmakh, M., Kowal, C., Anuar, F., Abbaspour, A., Toth, M., et al. (2014). The gut microbiota influences blood-brain barrier permeability in mice. Sci. Transl. Med. 6, 263ra158. doi: 10.1126/scitranslmed.3009759
Comstock, S. S., Li, M., Wang, M., Monaco, M. H., Kuhlenschmidt, T. B., Kuhlenschmidt, M. S., et al. (2017). Dietary human milk oligosaccharides but not prebiotic oligosaccharides increase circulating natural killer cell and mesenteric lymph node memory t cell populations in noninfected and rotavirus-infected neonatal piglets. J. Nutr. 147, 1041–1047. doi: 10.3945/jn.116.243774
Conrad, M. S., Sutton, B. P., Dilger, R. N., and Johnson, R. W. (2014). An in vivo three-dimensional magnetic resonance imaging-based averaged brain collection of the neonatal piglet (Sus scrofa). PLoS One 9:e107650. doi: 10.1371/journal.pone.0107650
Cooper, P., Bolton, K. D., Velaphi, S., De Groot, N., Emady-Azar, S., Pecquet, S., et al. (2016). Early benefits of a starter formula enriched in prebiotics and probiotics on the gut microbiota of healthy infants born to HIV+ mothers: a randomized double-blind controlled trial. Clin. Med. Insights Pediatr. 10:CMed.S40134. doi: 10.4137/CMPed.S40134
Fleming, S. A., Chichlowski, M., Berg, B. M., Donovan, S. M., and Dilger, R. N. (2018). Dietary sialyllactose does not influence measures of recognition memory or diurnal activity in the young pig. Nutrients 10:395. doi: 10.3390/nu10040395
Fleming, S. A., and Dilger, R. N. (2017). Young pigs exhibit differential exploratory behavior during novelty preference tasks in response to age, sex, and delay. Behav. Brain Res. 321, 50–60. doi: 10.1016/j.bbr.2016.12.027
Fleming, S. A., Monaikul, S., Patsavas, A. J., Waworuntu, R. V., Berg, B. M., and Dilger, R. N. (2017). Dietary polydextrose and galactooligosaccharide increase exploratory behavior, improve recognition memory, and alter neurochemistry in the young pig. Nutr. Neurosci. 22, 499–512. doi: 10.1080/1028415X.2017.1415280
Frost, G., Sleeth, M. L., Sahuri-Arisoylu, M., Lizarbe, B., Cerdan, S., Brody, L., et al. (2014). The short-chain fatty acid acetate reduces appetite via a central homeostatic mechanism. Nat. Commun. 5:3611. doi: 10.1038/ncomms4611
Gifford, A. K., Cloutier, S., and Newberry, R. C. (2007). Objects as enrichment: effects of object exposure time and delay interval on object recognition memory of the domestic pig. Appl. Anim. Behav. Sci. 107, 206–217. doi: 10.1016/j.applanim.2006.10.019
Goehring, K. C., Marriage, B. J., Oliver, J. S., Wilder, J. A., Barrett, E. G., and Buck, R. H. (2016). Similar to those who are breastfed, infants fed a formula containing 2’-fucosyllactose have lower inflammatory cytokines in a randomized controlled trial. J. Nutr. 146, 2559–2566. doi: 10.3945/jn.116.236919
Gopal, P. K., and Gill, H. S. (2000). Oligosaccharides and glycoconjugates in bovine milk and colostrum. Br. J. Nutr. 84, S69–S74. doi: 10.1017/S0007114500002270
Gronier, B., Savignac, H. M., Di Miceli, M., Idriss, S. M., Tzortzis, G., Anthony, D., et al. (2018). Increased cortical neuronal responses to NMDA and improved attentional set-shifting performance in rats following prebiotic (B-GOS®) ingestion. Eur. Neuropsychopharmacol. 28, 211–224. doi: 10.1016/j.euroneuro.2017.11.001
Jacob, R. M., Mudd, A. T., Alexander, L. S., Lai, C.-S., and Dilger, R. N. (2016). Comparison of brain development in sow-reared and artificially reared piglets. Front. Pediatr. 4:95. doi: 10.3389/fped.2016.00095
Jia, S., Lu, Z., Gao, Z., An, J., Wu, X., Li, X., et al. (2016). Chitosan oligosaccharides alleviate cognitive deficits in an amyloid-β1–42-induced rat model of Alzheimer’s disease. Int. J. Biol. Macromol. 83, 416–425. doi: 10.1016/j.ijbiomac.2015.11.011
Jork, R., Grecksch, G., and Matthies, H. (1986). Impairment of glycoprotein fucosylation in rat hippocampus and the consequences on memory formation. Pharmacol. Biochem. Behav. 25, 1137–1144. doi: 10.1016/0091-3057(86)90100-0
Kao, A., Spitzer, S., Anthony, D. C., Lennox, B., and Burnet, P. W. J. (2018). Prebiotic attenuation of olanzapine-induced weight gain in rats: analysis of central and peripheral biomarkers and gut microbiota. Transl. Psychiatry 8:66. doi: 10.1038/s41398-018-0116-8
Kao, A. C. C., Harty, S., and Burnet, P. W. J. (2016). The influence of prebiotics on neurobiology and behavior. Int. Rev. Neurobiol. 131, 21–48. doi: 10.1016/bs.irn.2016.08.007
Kim, H. J., Leeds, P., and Chuang, D.-M. (2009). The HDAC inhibitor, sodium butyrate, stimulates neurogenesis in the ischemic brain. J. Neurochem. 110, 1226–1240. doi: 10.1111/j.1471-4159.2009.06212.x
Kirmiz, N., Robinson, R. C., Shah, I. M., Barile, D., and Mills, D. A. (2018). Milk glycans and their interaction with the infant-gut microbiota. Annu. Rev. Food Sci. Technol. 9, 429–450. doi: 10.1146/annurev-food-030216-30207
Kornum, B. R., Thygesen, K. S., Nielsen, T. R., Knudsen, G. M., and Lind, N. M. (2007). The effect of the inter-phase delay interval in the spontaneous object recognition test for pigs. Behav. Brain Res. 181, 210–217. doi: 10.1016/j.bbr.2007.04.007
Kouwenberg, A.-L., Walsh, C. J., Morgan, B. E., and Martin, G. M. (2009). Episodic-like memory in crossbred Yucatan minipigs (Sus scrofa). Appl. Anim. Behav. Sci. 117, 165–172. doi: 10.1016/j.applanim.2009.01.005
Krug, M., Wagner, M., Staak, S., and Smalla, K.-H. (1994). Fucose and fucose-containing sugar epitopes enhance hippocampal long-term potentiation in the freely moving rat. Brain Res. 643, 130–135. doi: 10.1016/0006-8993(94)90018-3
Marriage, B. J., Buck, R. H., Goehring, K. C., Oliver, J. S., and Williams, J. A. (2015). Infants fed a lower calorie formula with 2’FL show growth and 2’FL uptake like breast-fed infants. J. Pediatr. Gastroenterol. Nutr. 61, 649–658. doi: 10.1097/MPG.0000000000000889
Martín-Sosa, S., Martín, M.-J., García-Pardo, L.-A., and Hueso, P. (2003). Sialyloligosaccharides in human and bovine milk and in infant formulas: variations with the progression of lactation. J. Dairy Sci. 86, 52–59. doi: 10.3168/jds.S0022-0302(03)73583-8
Matthies, H., Staak, S., and Krug, M. (1996). Fucose and fucosyllactose enhance in-vitro hippocampal long-term potentiation. Brain Res. 725, 276–280. doi: 10.1016/0006-8993(96)00406-4
McGuire, M. K., Meehan, C. L., McGuire, M. A., Williams, J. E., Foster, J., Sellen, D. W., et al. (2017). What’s normal? Oligosaccharide concentrations and profiles in milk produced by healthy women vary geographically. Am. J. Clin. Nutr. 105, 1086–1100. doi: 10.3945/ajcn.116.139980
Meli, F., Puccio, G., Cajozzo, C., Ricottone, G. L., Pecquet, S., Sprenger, N., et al. (2014). Growth and safety evaluation of infant formulae containing oligosaccharides derived from bovine milk: a randomized, double-blind, noninferiority trial. BMC Pediatr. 14:306. doi: 10.1186/s12887-014-0306-3
Moustgaard, A., Lind, N. M., Hemmingsen, R., and Hansen, A. K. (2002). Spontaneous object recognition in the göttingen minipig. Neural Plast. 9, 255–259. doi: 10.1155/NP.2002.255
Mudd, A. T., Alexander, L. S., Berding, K., Waworuntu, R. V., Berg, B. M., Donovan, S. M., et al. (2016a). Dietary prebiotics, milk fat globule membrane, and lactoferrin affects structural neurodevelopment in the young piglet. Front. Pediatr. 4:4. doi: 10.3389/fped.2016.00004
Mudd, A. T., Getty, C. M., Sutton, B. P., and Dilger, R. N. (2016b). Perinatal choline deficiency delays brain development and alters metabolite concentrations in the young pig. Nutr. Neurosci. 19, 425–433. doi: 10.1179/1476830515Y.0000000031.0020
Mudd, A. T., Fil, J. E., Knight, L. C., and Dilger, R. N. (2018). Dietary iron repletion following early-life dietary iron deficiency does not correct regional volumetric or diffusion tensor changes in the developing pig brain. Front. Neurol. 8:735. doi: 10.3389/fneur.2017.00735
Mudd, A. T., Fleming, S. A., Labhart, B., Chichlowski, M., Berg, B. M., Donovan, S. M., et al. (2017). Dietary sialyllactose influences sialic acid concentrations in the prefrontal cortex and magnetic resonance imaging measures in corpus callosum of young pigs. Nutrients 9:1297. doi: 10.3390/nu9121297
Oliveros, E., Ramirez, M., Vazquez, E., Barranco, A., Gruart, A., Delgado-Garcia, J. M., et al. (2016). Oral supplementation of 2′-fucosyllactose during lactation improves memory and learning in rats. J. Nutr. Biochem. 31, 20–27. doi: 10.1016/j.jnutbio.2015.12.014
Puccio, G., Alliet, P., Cajozzo, C., Janssens, E., Corsello, G., Sprenger, N., et al. (2017). Effects of infant formula with human milk oligosaccharides on growth and morbidity: a randomized multicenter trial. J. Pediatr. Gastroenterol. Nutr. 64, 624–631. doi: 10.1097/MPG.0000000000001520
Radke, M., Picaud, J. C., Loui, A., Cambonie, G., Faas, D., Lafeber, H. N., et al. (2017). Starter formula enriched in prebiotics and probiotics ensures normal growth of infants and promotes gut health: a randomized clinical trial. Pediatr. Res. 81, 622–631. doi: 10.1038/pr.2016.270
Radlowski, E. C., Conrad, M. S., Lezmi, S., Dilger, R. N., Sutton, B., Larsen, R., et al. (2014). A neonatal piglet model for investigating brain and cognitive development in small for gestational age human infants. PLoS One 9:e91951. doi: 10.1371/journal.pone.0091951
Savignac, H. M., Corona, G., Mills, H., Chen, L., Spencer, J. P. E., Tzortzis, G., et al. (2013). Prebiotic feeding elevates central brain derived neurotrophic factor. N-methyl-d-aspartate receptor subunits and d-serine. Neurochem. Int. 63, 756–764. doi: 10.1016/j.neuint.2013.10.006
Savignac, H. M., Couch, Y., Stratford, M., Bannerman, D. M., Tzortzis, G., Anthony, D. C., et al. (2016). Prebiotic administration normalizes lipopolysaccharide (LPS)-induced anxiety and cortical 5-HT2A receptor and IL1-β levels in male mice. Brain. Behav. Immun. 52, 120–131. doi: 10.1016/j.bbi.2015.10.007
Schmidt, K., Cowen, P. J., Harmer, C. J., Tzortzis, G., Errington, S., and Burnet, P. W. J. (2015). Prebiotic intake reduces the waking cortisol response and alters emotional bias in healthy volunteers. Psychopharmacology 232, 1793–1801. doi: 10.1007/s00213-014-3810-0
Simeoni, U., Berger, B., Junick, J., Blaut, M., Pecquet, S., Rezzonico, E., et al. (2016). Gut microbiota analysis reveals a marked shift to bifidobacteria by a starter infant formula containing a synbiotic of bovine milk-derived oligosaccharides and Bifidobacterium animalis subsp. lactis CNCM I-3446. Environ. Microbiol. 18, 2185–2195. doi: 10.1111/1462-2920.13144
Sukumar, R., Rose, S. P. R., and Burgoyne, R. D. (1980). Increased incorporation of [3H]fucose into chick brain glycoproteins following training on a passive avoidance task. J. Neurochem. 34, 1000–1006. doi: 10.1111/j.1471-4159.1980.tb09677.x
Tarr, A. J., Galley, J. D., Fisher, S. E., Chichlowski, M., Berg, B. M., and Bailey, M. T. (2015). The prebiotics 3’Sialyllactose and 6’Sialyllactose diminish stressor-induced anxiety-like behavior and colonic microbiota alterations: evidence for effects on the gut–brain axis. Brain Behav. Immun. 50, 166–177. doi: 10.1016/j.bbi.2015.06.025
Urashima, T., Saito, T., Nakamura, T., and Messer, M. (2001). Oligosaccharides of milk and colostrum in non-human mammals. Glycoconj. J. 18, 357–371. doi: 10.1023/a:1014881913541
Vázquez, E., Barranco, A., Ramírez, M., Gruart, A., Delgado-García, J. M., Jimenez, M. L., et al. (2016). Dietary 2’-fucosyllactose enhances operant conditioning and long-term potentiation via gut-brain communication through the vagus nerve in rodents. PLoS One 11:e166070. doi: 10.1371/journal.pone.0166070
Vázquez, E., Barranco, A., Ramírez, M., Gruart, A., Delgado-García, J. M., Martínez-Lara, E., et al. (2015). Effects of a human milk oligosaccharide, 2’-fucosyllactose, on hippocampal long-term potentiation and learning capabilities in rodents. J. Nutr. Biochem. 26, 455–465. doi: 10.1016/j.jnutbio.2014.11.016
Williams, S., Chen, L., Savignac, H. M., Tzortzis, G., Anthony, D. C., and Burnet, P. W. (2016). Neonatal prebiotic (BGOS) supplementation increases the levels of synaptophysin, GluN2A-subunits and BDNF proteins in the adult rat hippocampus. Synapse 70, 121–124. doi: 10.1002/syn.21880
Keywords: prebiotics, milk, pig, brain, nutrition, cognition, neuroimaging, human milk oligosaccharides (HMOs)
Citation: Fleming SA, Mudd AT, Hauser J, Yan J, Metairon S, Steiner P, Donovan SM and Dilger RN (2020) Human and Bovine Milk Oligosaccharides Elicit Improved Recognition Memory Concurrent With Alterations in Regional Brain Volumes and Hippocampal mRNA Expression. Front. Neurosci. 14:770. doi: 10.3389/fnins.2020.00770
Received: 21 November 2019; Accepted: 30 June 2020;
Published: 13 August 2020.
Edited by:
Sebastian Cerdan, Consejo Superior de Investigaciones Científicas (CSIC), SpainReviewed by:
Stine Brandt Bering, University of Copenhagen, DenmarkJosé M. Delgado-García, Universidad Pablo de Olavide, Spain
Copyright © 2020 Fleming, Mudd, Hauser, Yan, Metairon, Steiner, Donovan and Dilger. This is an open-access article distributed under the terms of the Creative Commons Attribution License (CC BY). The use, distribution or reproduction in other forums is permitted, provided the original author(s) and the copyright owner(s) are credited and that the original publication in this journal is cited, in accordance with accepted academic practice. No use, distribution or reproduction is permitted which does not comply with these terms.
*Correspondence: Ryan N. Dilger, cmRpbGdlcjJAaWxsaW5vaXMuZWR1