 Qiong-Ge Li1,2†
 Cheng Zhao1,2†
 Yi Shan1,2Ya-Yan Yin1,2Dong-Dong Rong1,2
 Miao Zhang1,2Qing-Feng Ma3
 Jie Lu1,2,4*
- 1Department of Radiology, Xuanwu Hospital, Capital Medical University, Beijing, China
- 2Beijing Key Laboratory of Magnetic Resonance Imaging and Brain Informatics, Beijing, China
- 3Department of Neurology, Xuanwu Hospital, Capital Medical University, Beijing, China
- 4Department of Nuclear Medicine, Xuanwu Hospital, Capital Medical University, Beijing, China
Objective: This study intends to track whole-brain functional connectivity strength (FCS) changes and the lateralization index (LI) in left basal ganglia (BG) ischemic stroke patients.
Methods: Twenty-five patients (N = 25; aged 52.73 ± 10.51 years) with five visits at <7, 14, 30, 90, and 180 days and 26 healthy controls (HCs; N = 26; 51.84 ± 8.06 years) were examined with resting-state functional magnetic resonance imaging (rs-fMRI) and motor function testing. FCS and LI were calculated through constructing the voxel-based brain functional network. One-way analysis of covariance (ANOVA) was first performed to obtain longitudinal FCS and LI changes in patients among the five visits (Bonferroni corrected, P < 0.05). Then, pairwise comparisons of FCS and LI were obtained during the five visits, and the two-sample t test was used to examine between-group differences in FCS [family-wise error (FWE) corrected, P < 0.05] and LI. Correlations between connectivity metrics (FCS and LI) and motor function were further assessed.
Results: Compared to HCs, decreased FCS in the patients localized in the calcarine and inferior occipital gyrus (IOG), while increased FCS gathered in the middle prefrontal cortex (MPFC), middle frontal gyrus, and insula (P < 0.05). The LI and FCS of patients first decreased and then increased, which showed significant differences compared with HCs (P < 0.05) and demonstrated a transition at the 30-day visit. Additionally, LI at the third visit was significantly different from those at the other visits (P < 0.05). No significant longitudinal correlations were observed between motor function and FCS or LI (P > 0.05).
Conclusion: Focal ischemic stroke in the left BG leads to extensive alterations in the FCS. Strong plasticity in the functional networks could be reorganized in different temporal dynamics to facilitate motor recovery after BG stroke, contribute to diagnosing the disease course, and estimate the intervention treatment.
Introduction
Cerebral stroke is a major cause of mortality and long-term disability. More than 80% of strokes stem from ischemic damage to the brain due to the acute reduction of the blood supply (Kessner et al., 2019). The region of basal ganglia (BG), which is a predilection site of stroke, is a neuroimaging term, including anatomical structures of the amygdala, caudate nucleus, lentiform nucleus, claustrum, capsula interna, and the surrounding white matter (Kreitzer and Malenka, 2008; Florio et al., 2018). The BG control voluntary motor activity primarily by regulating the motor and premotor cortex, and BG ischemic stroke could potentially have a long-term effect on movement (Qureshi et al., 2003; Guo et al., 2017). Therefore, the exploration of the mechanism of BG stroke can contribute to providing potentially useful metrics for monitoring the efficacy of rehabilitation therapy in these patients.
Resting-state functional magnetic resonance imaging (rs-fMRI) has exhibited unique advancements in non-invasively exploring spontaneous functional connectivity (FC) alterations in brain disorders (Biswal et al., 2010). Previous FC methods are useful in evaluating connectivity patterns for specific brain regions or distinct components of the brain network but do not reflect the whole connectivity pattern in all brain elements. In contrast, functional connectivity strength (FCS), a graph theory-based analysis method can explore nodal weighted centrality and reflect its FC within the whole brain network (Gao et al., 2017; Zhang et al., 2020). This measurement indirectly reflects the position and importance of the node or brain regions in the whole-brain networks, without a priori defined seed (Wang L. et al., 2014). Thus, it is highly suitable for studying diseases with unclear pathological mechanisms and works as an effective index. Moreover, lateralization is a critical factor for estimating the changes in motor function and could be assessed based on rs-fMRI. In previous stroke investigations, the measurement of lateralization was used to reflect the degree to which motor change processes are lateralized (Marangon et al., 2014). Combination of rs-fMRI and lateralization may provide reliable metrics and has been successfully used in brain disorders (Rosazza et al., 2013).
Although abundant rs-fMRI studies of stroke have been reported on large-scale brain lesions and provided valuable content, lesion location is still an important factor in exploring brain function. More stroke studies with lesions in isolated brain regions are needed to address these issues (Park et al., 2016; Rondina et al., 2016; Desowska and Turner, 2019). As mentioned above, BG stroke could cause long-term motor impairment, but the mechanism of its brain function has rarely been studied and not been elucidated. A previous longitudinal study employing task-based fMRI has demonstrated that the contralateral sensorimotor cortex (SMC) appears to be involved in functional rehabilitation following BG ischemic stroke (Fu et al., 2016). However, comprehensive and integrated analysis of BG stroke has not been conducted.
Here, our study aims to carry out a long-term follow-up of rs-fMRI in the left BG stroke patients to characterize the neural mechanism of motor recovery after stroke. First, we performed whole-brain FCS analysis to assess brain regions exhibiting intrinsic functional network changes compared to healthy controls (HCs) at the voxel level. Second, we investigated temporally evolving functional lateralization based on brain regions of FCS changes. Finally, we explored the associations of altered functional lateralization with clinical outcomes in stroke patients. The design flowchart of this study is shown in Figure 1. In this study, we expected FCS changes in patients compared to HCs to improve with motor recovery, and lateralization changes may show trajectory in sync with FCS.
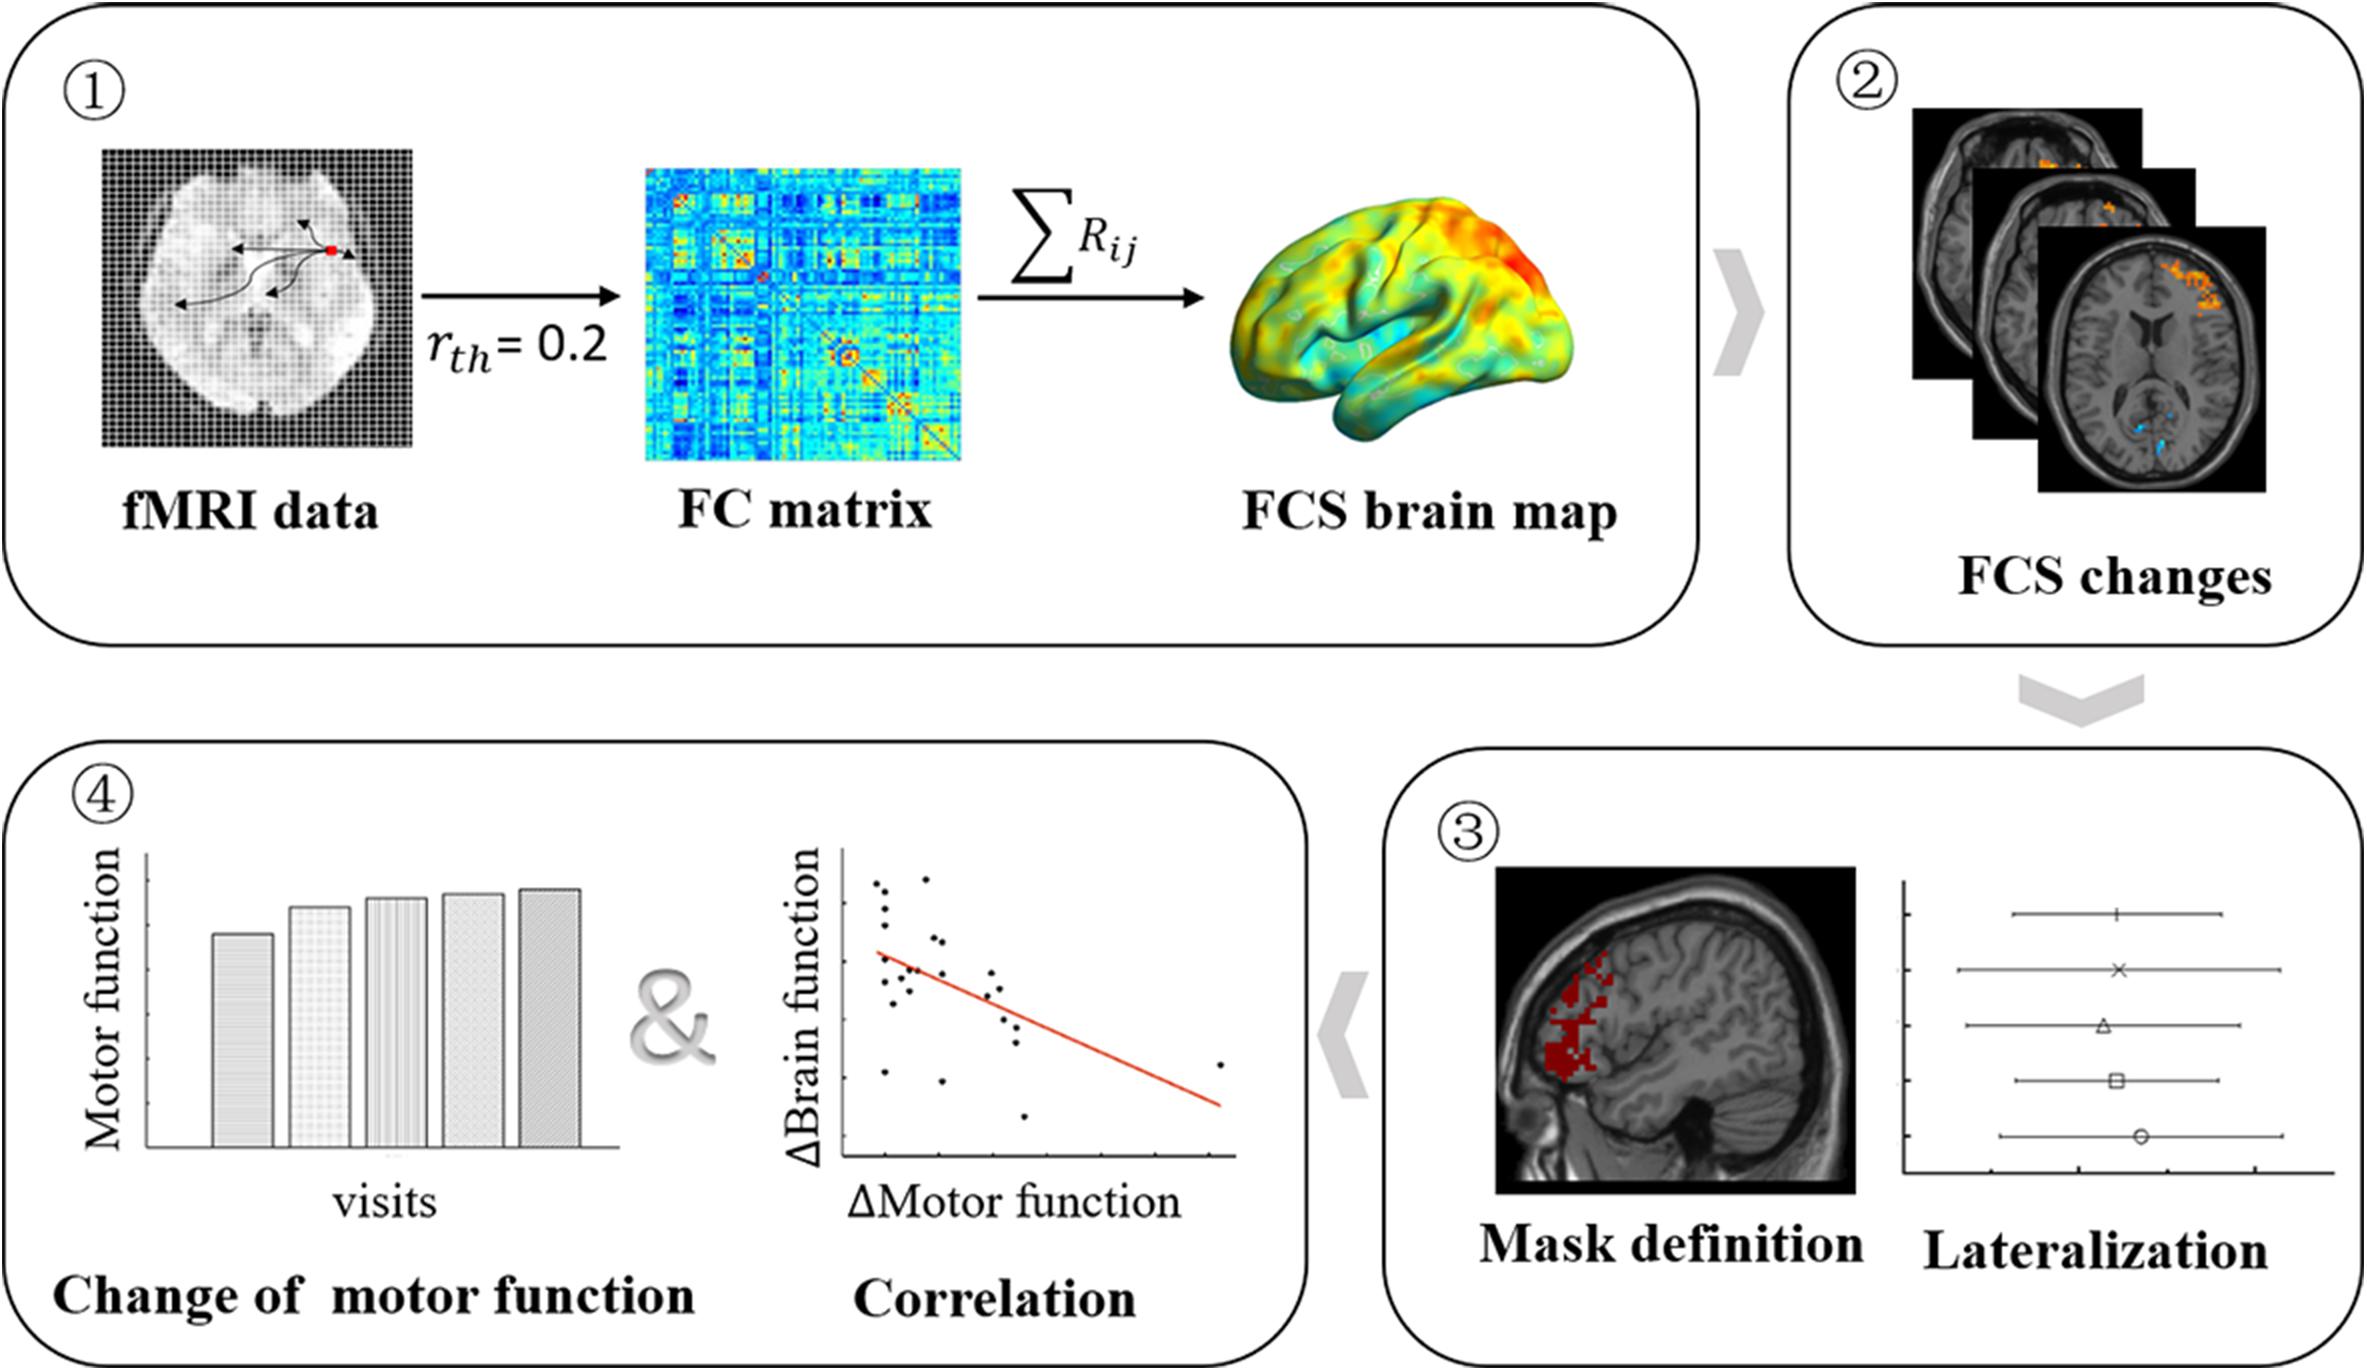
Figure 1. Longitudinal study design flowchart. Patients underwent five (<7, 14, 30, 90, and 180 days after stroke onset) MRI scans and clinical motor function assessments, while HCs underwent a functional MRI (fMRI) scan. Step 1: the FCS brain map was derived for each participant and at each visit. Step 2: the FCS changes between patients at each visit, and HCs were obtained by the two-sample t test model. Step 3: the significant brain regions of FCS changes were submitted, and mirror superposition was used as a mask to calculate LI. Step 4: the changes in FCS and LI and changes in motor function were used to perform brain–behavior association evaluations. HCs, healthy controls; FCS, functional connectivity strength; LI, lateralization index.
Materials and Methods
Participants
Twenty-five patients (39–73 years old; mean age, 52.73 ± 10.51 years; male, 18) with isolated left BG ischemic stroke were recruited. The criteria for inclusion included (a) first-onset stroke and diagnosis by neurological testing, (b) five MRI scans and motor function (<7, 14, 30, 90, and 180 days after stroke onset), (c) single lesion location confined to the left BG (region of the BG was confined to the BG nucleus and its surrounding white matter), (d) complete admission history, and (e) no previous stroke and no other intracranial lesion or mental disease. The exclusion criteria included (a) contraindication for MRI, (b) unclear onset of symptoms, (c) recurrent and secondary stroke during visit, and (d) blindness or/and deafness, aphasia, or visual field deficit. Twenty-six age- and sex-matched HCs (30–70 years old; mean age, 51.84 ± 8.06 years; male, 15) were recruited and underwent MRI scanning, and MRI data from HCs were acquired along with the baseline of patient group. Each participant was right-handed. It should be mentioned that we included only participants with Fazekas scores under 2, whose white matter abnormalities could be considered as normal aging changes (Fazekas et al., 1987). This study was approved by the local Institutional Review Board, and written informed consent was obtained from all participants. The data that support the findings of this study are available from the corresponding author upon reasonable request.
MRI Data Acquisition
Magnetic resonance imaging scans were conducted on a Siemens 3.0 Tesla Tim Trio scanner using a 12-channel head coil. Resting-state images were acquired using echo planar imaging (EPI) sequence with repetition time (TR)/time to echo (TE) = 3,000/30 ms, flip angle = 90°, and isotropic voxel size = 3 mm × 3 mm × 3 mm. Resting-sate fMRI of each participant involved two or four runs, and each run lasted 360 s and required 124 volumes. To maintain the steadiness and uniformity of resting-state fMRI data, this study selected the second fMRI run for subsequent research. In addition, we assessed high-resolution three-dimensional (1 mm3) T1-weighted magnetization-prepared rapid gradient-echo (MP-RAGE) images and T2-weighted images (slice thickness = 5 mm).
Motor Function
All eligible patients received comprehensive motor examination, which included Fugl-Meyer Assessments (FMA) and right-hand grip strength. The FMA scale, as a remarkable motor domain, was tested. FMA scores were evaluated using 33 tasks that can quantitatively reflect motor function, balance, sensation, and joint function of the upper limbs. Thirty-three scores were summed and then normalized to a score between 0 and 100 to represent the FMA score (Fugl-Meyer et al., 1975; Guo et al., 2016). Grip strength was investigated with a mechanical dynamometer. Patients performed two trials with the right hand, and the mean value was calculated for right hand individually.
Lesion Probability Map
As shown in Figure 2, lesions of all patients at baseline were outlined on T2-weighted images using tools from MRIcron software1, and the lesion probability map was then created using Statistical Parametric Mapping (SPM12). The corresponding procedures were as follows: (a) lesions were resliced to individual T1-weighted images; (b) the resliced lesions were smoothed with 3-mm full-width half-maximum (FWHM) Gaussian kernel; (c) linearly registered and normalized to Montreal Neurological Institute (MNI) space were performed; (d) the resulting transformation lesions were coregistered and averaged, resulting in maps with a value for each voxel ranging from 0 to 1, indicating the proportion of patients with a lesion in that particular voxel.
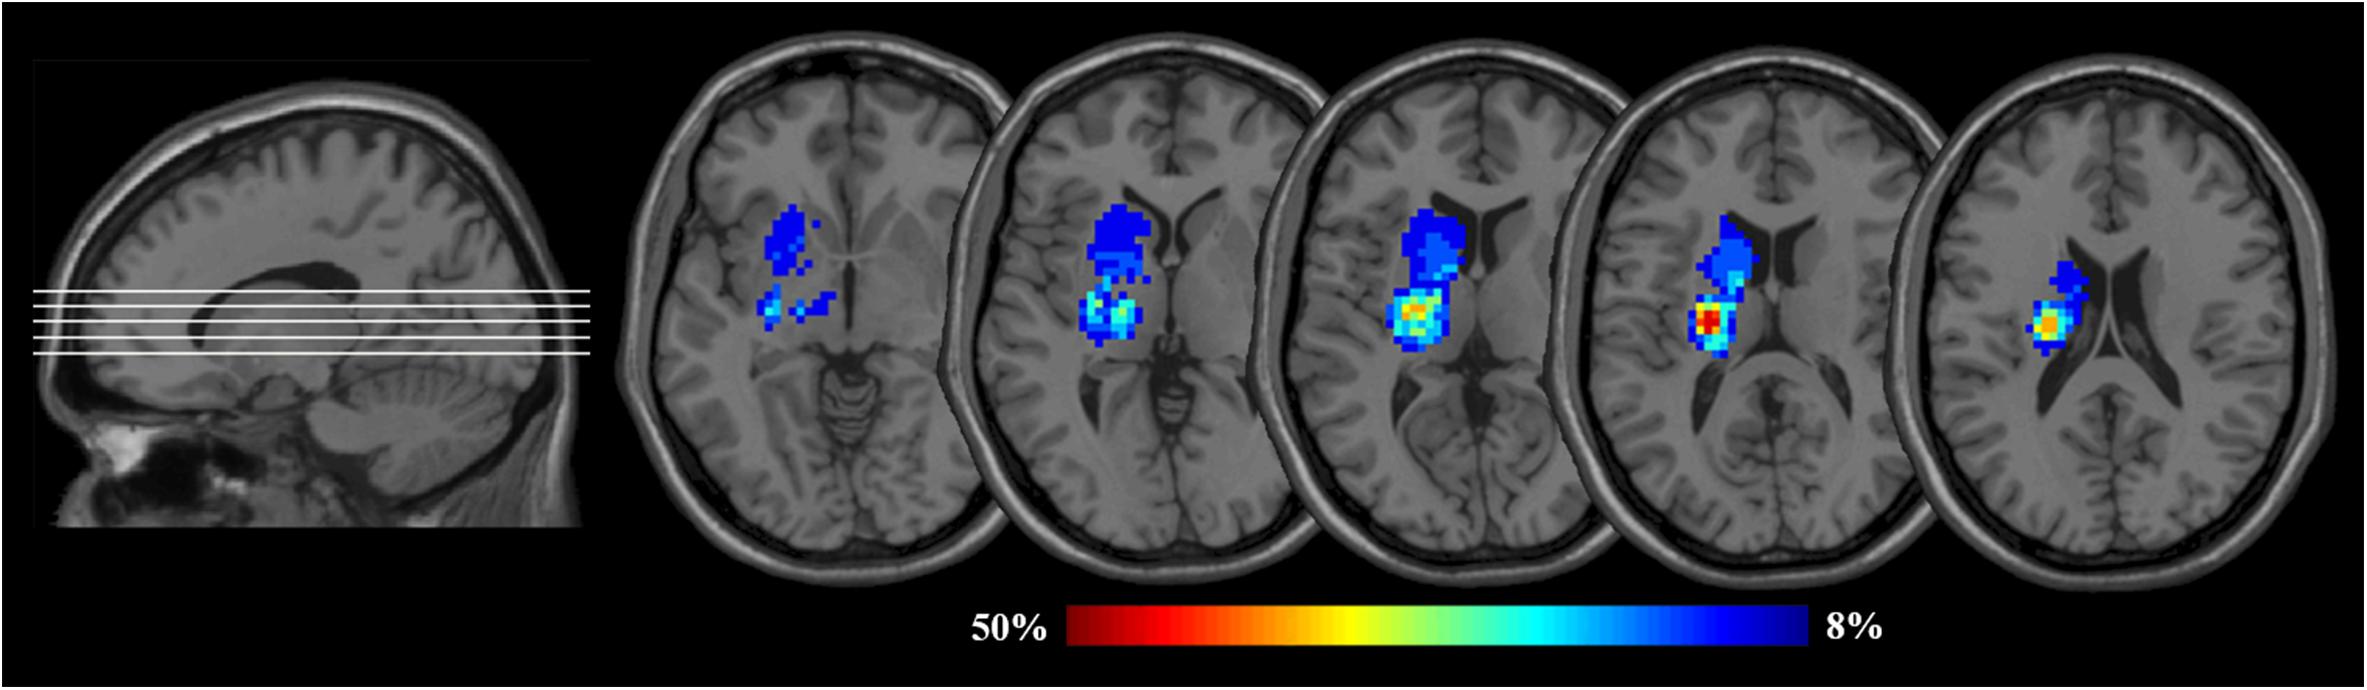
Figure 2. Lesion probability maps for the left BG patients. The heat maps corresponding to the probability of patients having a lesion in that area overlaid on axial slices from a standard template in MNI space (MNI152). BG, basal ganglia; MNI, Montreal Neurological Institute. Images are presented in neurological convention (i.e., the left hemisphere is on the left side).
Image Preprocessing
All rs-fMRI data were preprocessed using SPM12 and Data Processing Assistant for rs-fMRI (DPARSF) (Yan et al., 2016). Preprocessing of rs-fMRI data included removing the first four volumes to make the magnetization approach a dynamic equilibrium, slicing timing to the median reference slice, and realigning for head motion correction. Then, the data were spatially normalized to the MNI space using an echo-planar imaging (EPI) template with a voxel size of 3 mm × 3 mm × 3 mm. Several nuisance variables, including Friston’s 24 head-motion parameters (Friston et al., 1994) and averaged signals from white matter and cerebrospinal fluid tissue, were removed using multivariate linear regression analysis. Finally, 0.01–0.1 Hz bandpass temporal filtering was used to remove low-frequency magnetic field drifts and high-frequency respiratory and cardiac noise.
Voxel-Based Functional Connectivity Strength
For the calculation of voxel-based FCS, we first constructed a voxel-based FC matrix by calculating Pearson’s correlation coefficients (r) between all pairs of voxels within a gray matter mask (number of voxels = 45,381). Here, we took each voxel as a node and estimated Pearson’s correlation (r value) between any pair of voxels as the internodal edge weight (Buckner et al., 2009; de Pasquale et al., 2018). The individual correlation matrices were further translated to a z-score matrix using the Fisher r-to-z approach. To eliminate low temporal correlations resulting from signal noise (Wang C. et al., 2014; Liu W. et al., 2015), we conservatively restricted our explorations to positive correlations and defined an internodal correlation threshold of r = 0.2. Finally, the measurement of FCS for each given voxel was computed in the z-score matrix, by the following equation
where Di is FCS for a given voxel i, rij is a connection or edge weight between voxel i and voxel j, and N is the number of voxels in the GM mask. FCS maps of all participants were obtained.
To improve normality, the raw FCS value was then standardized to z scores using the following equation
where and δD represents the mean FCS and standard deviation across whole-brain voxels, respectively.
Lateralization Index Calculation
Brain regions with significant FCS changes between the patients with five visits (<7, 14, 30, 90, 180 days) and HCs were first extracted and summed and then binarized as a mask. Mirror superposition was finally used in the mask, which was symmetrically categorized into the left and right hemispheres. Then, the LI of each participant was calculated using the following equation
where FCSleft and FCSright represent the sum of FCS values of all left and right hemisphere voxels contained in the mask. LI ranged from −1.0 (means right FCS only) to 1.0 (means left FCS only), and LI values close to 0 indicated symmetrical FCS.
Statistical Analysis
The age of patients and HCs was compared by a two-sample t test. The sex composition of the two groups was compared using a chi-square test (two-tailed). Additionally, a one-way analysis of covariance (ANOVA) was used to assess differences in FMA and grip strength among five visits of the patient group (Bonferroni corrected, P < 0.05). Then, a paired t-test was applied to measure detailed FMA and grip strength changes between patients at the last four visits and baseline.
To explore differences in FCS, a one-way repeated measure ANOVA analysis and post hoc test were first performed to obtain longitudinal changes in patients among five visits (Bonferroni corrected, P < 0.05). Then, the two-sample t test was used to examine FCS differences between the patients and HCs. After 5,000 non-parametric random permutations, threshold-free cluster enhancement (TFCE) (Smith and Nichols, 2009) was used to make family-wise error correction (FWE, P < 0.05) for each FCS contrast. The statistical analysis of FCS was performed using SPM12.
Like the statistical methods of FCS, one-way repeated measure ANOVA analysis and post hoc test were also used to obtain longitudinal LI changes in patients among five visits (Bonferroni corrected, P < 0.05). LI differences between the patients and HCs were also tested with two-sample t test. SPSS 21.0 was used to perform the above statistical tests.
Finally, relationships between changes of connectivity metrics (ΔFCS and ΔLI) and corresponding changes in motor variables (ΔFMA and Δgrip strength) in patients were further assessed by using the partial correlation method. Δ refers to differences of those measures (FCS, LI, FMA, and grip strength) between the baseline and the remaining each visit. We controlled age and sex in the analyses.
Validation Analysis
To estimate whether these results are robust, we performed this validation test. Given the influence of different thresholds on brain network topology construction (Buckner et al., 2009), we selected another threshold (r = 0.4) to calculate the corresponding FCS and LI to verify the results. Intragroup and between-group FCS and LI changes were re-examined using ANOVA and two-sample t test (see Supplementary Material).
Results
Demographics and Clinical Characteristics
Table 1 lists the demographic and clinical information for both stroke patients and HCs. Twenty-five patients with left BG stroke and 26 HCs were well matched in age and sex. Moreover, significant FMA (F = 6.21, P < 0.001) and grip strength (F = 4.67, P = 0.02) differences in patients between the first visit and the other four were observed. As shown in Figure 3, it should be noted that FMA and grip strength showed significant improvement.
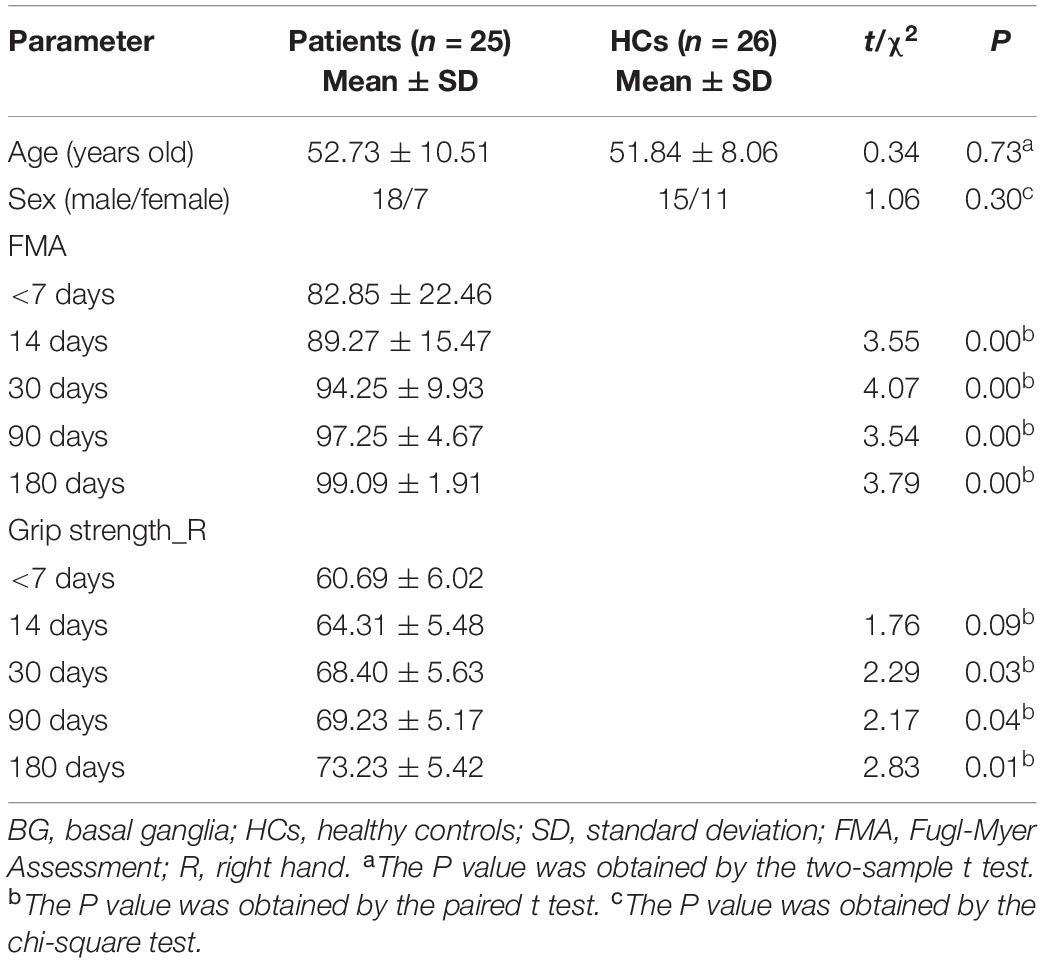
Table 1. Demographic characteristic for patients with left BG infarction and HCs.
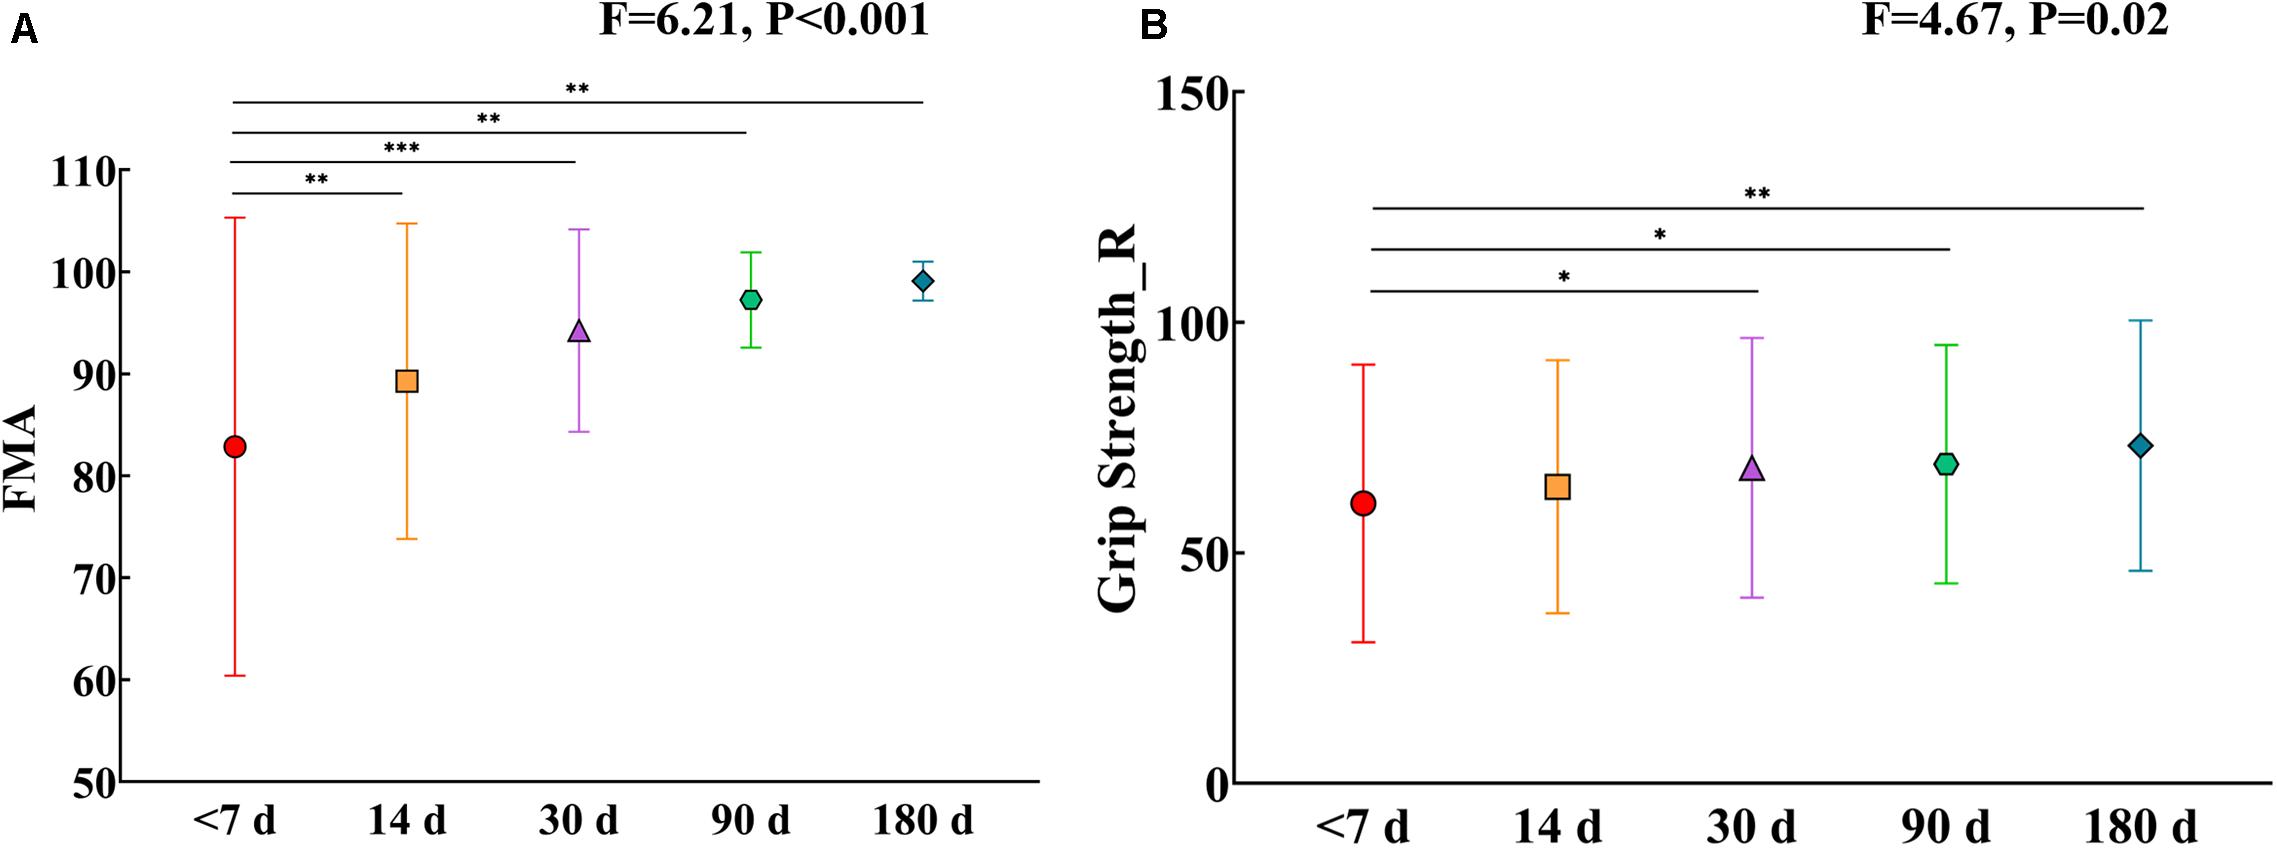
Figure 3. (A) FMA changes in patients after five visits. (B) Grip strength changes in patients after five visits. Error bars show standard deviations. *, P < 0.05; **, P < 0.01; ***, P < 0.001. FMA, Fugl-Myer Assessment; R, Right hand.
FCS Changes Between the Patients and HCs
First, the results showed that there was no significant FCS difference among the different visits in the patient group using repeated measure one-way ANOVA (P > 0.05). We next examined the between-group FCS changes, and Figure 4 shows clusters with significantly altered FCS between the patients at each visit and the HCs at baseline. Compared to HCs, the patients at baseline exhibited significantly increased FCS in the right middle prefrontal cortex (MPFC) and right middle frontal cortex (MFG). Similarly, patients at the <14 days visit also showed significantly increased FCS in the right MPFC and right MFG, while changes in voxel numbers in the second visit (N = 123) were less than those of the baseline (N = 137). Furthermore, the patients at the <30 days visit showed significantly increased FCS in the right MPFC, right insula (INS), and left MFG, while significant decreases were observed in the left lingual gyrus (LING) and right inferior occipital gyrus (IOG). Remarkably, the amount of changed voxels at the third visit increased significantly (N = 616). The fourth and last visits showed significant increases in the right MPFC and right INS, and the changed voxel numbers gradually decreased during the last two visits (N = 135, N = 133). FWE correction was used for correcting the above results (P < 0.05). In Figure 5, clusters exhibiting significant FCS changes in each comparison are shown as bar charts. It should be noted that the sum of changed voxel numbers in each comparison first increased and then decreased over time, and the clusters showed FCS changes in the comparison between the patients at the <30 days visit, and the HCs contained more voxels than others. Detailed information is provided in Table 2. Moreover, in the validation test, our main findings were preserved (Supplementary Figure S1).
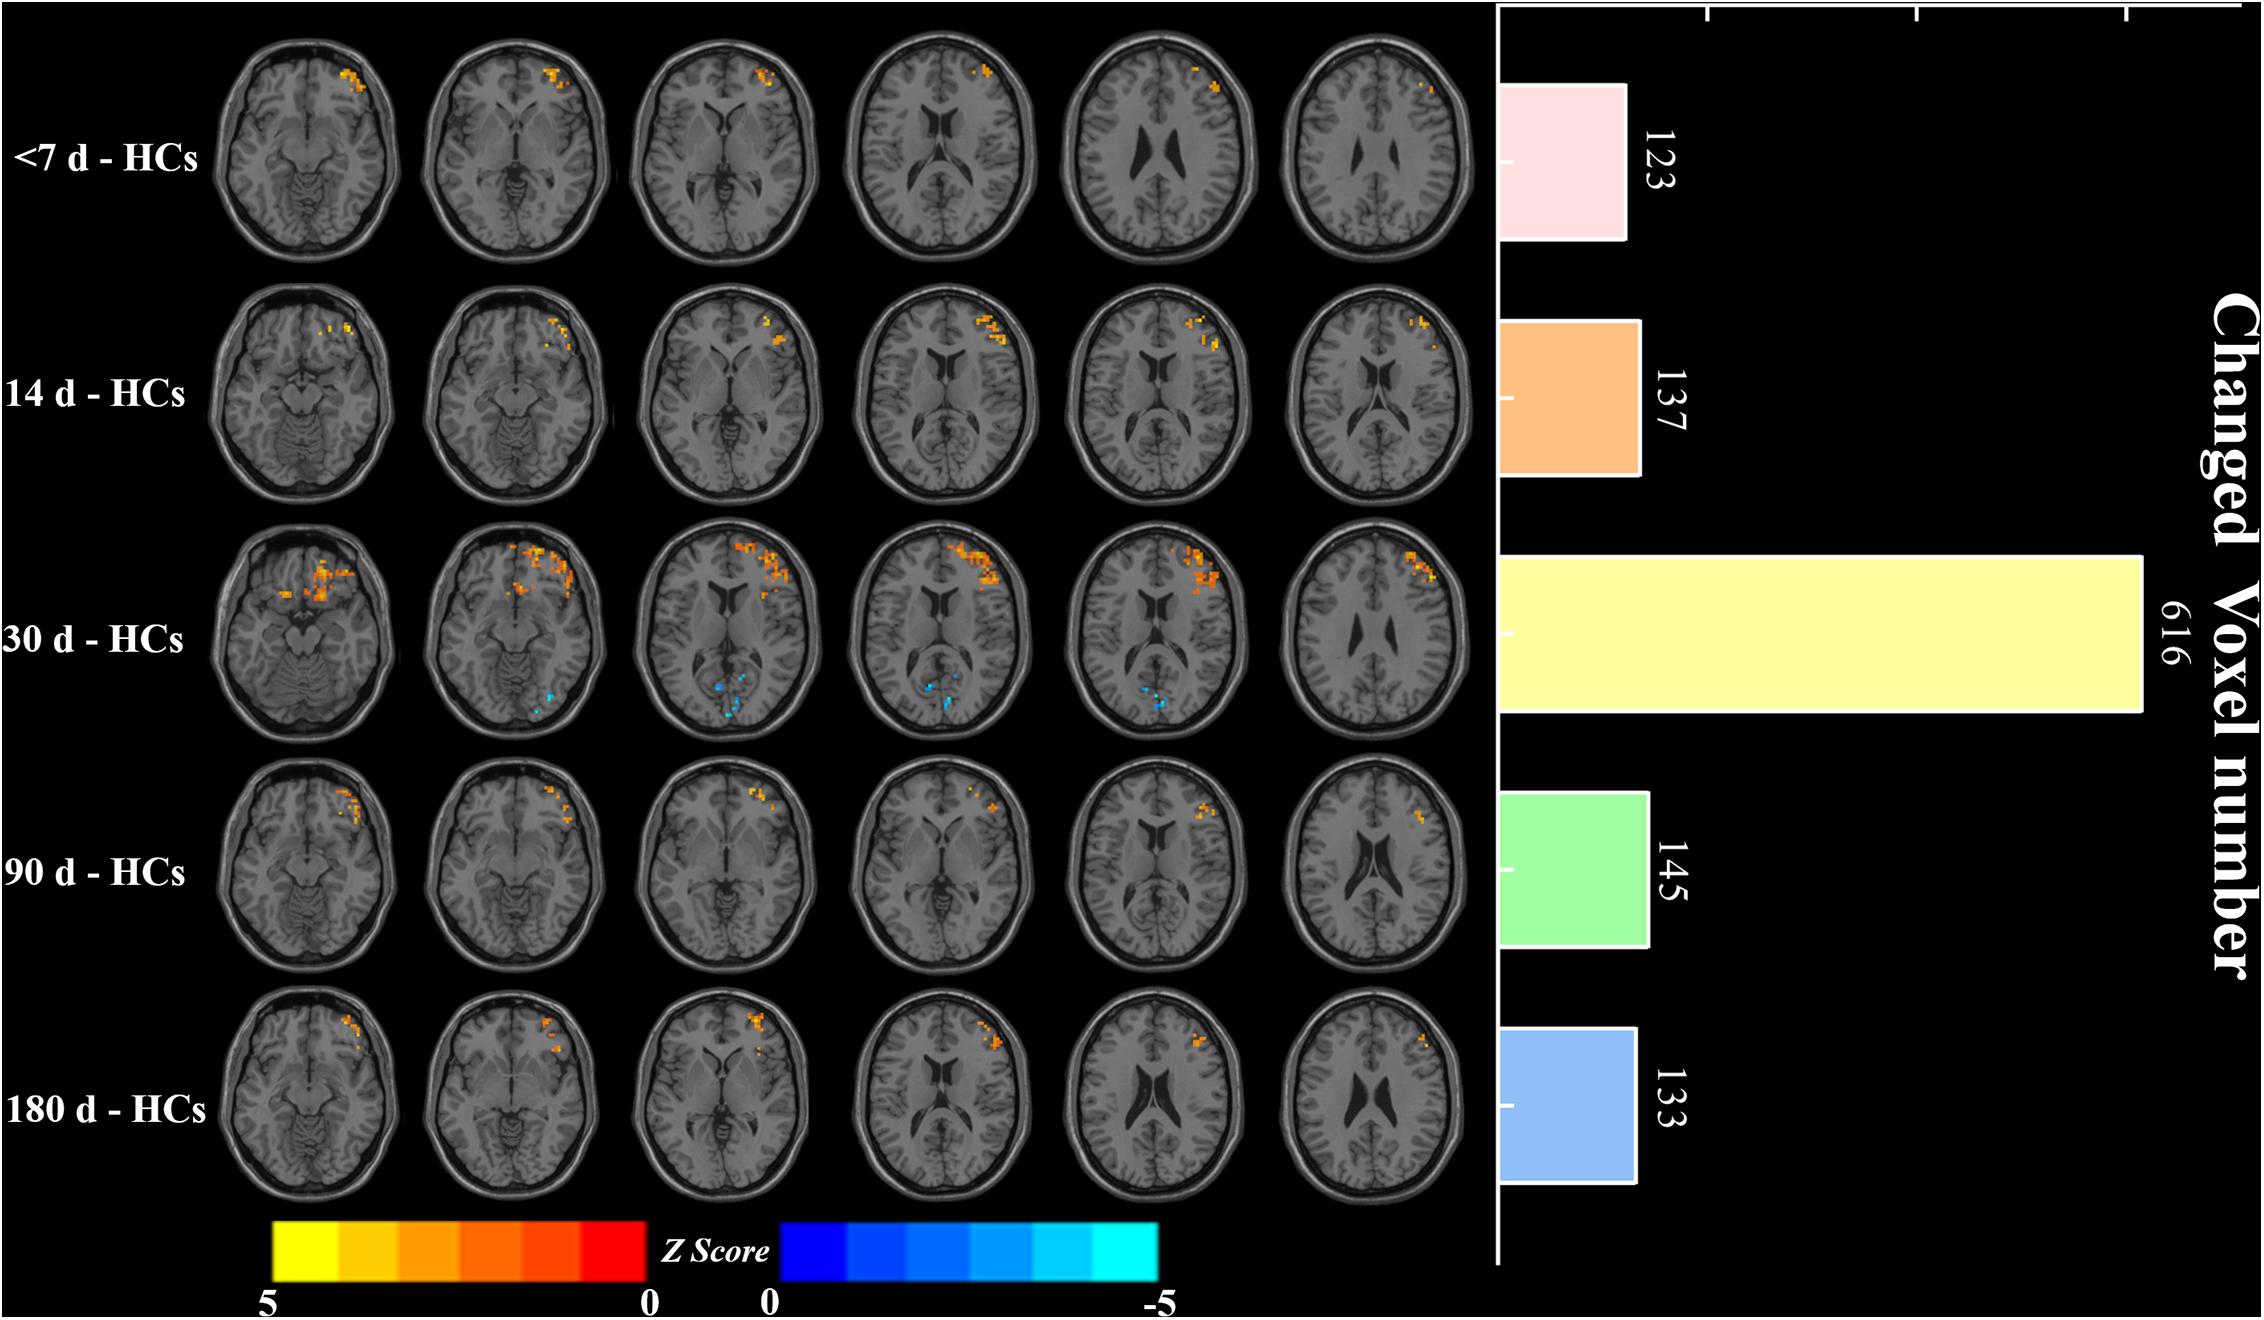
Figure 4. Significant FCS differences and changed voxel numbers between patients at five visits of <7, 14, 30, 90, and 180 days and HCs. Axial maps of each row represent the results of each contrast. Values are expressed as z scores, where hot colors represent increased FCS and cold colors represent decreased FCS in the left BG stroke patients. Each item in the right bar graph corresponds to each row in the left axis map. FCS, functional connectivity strength; HCs, healthy controls.
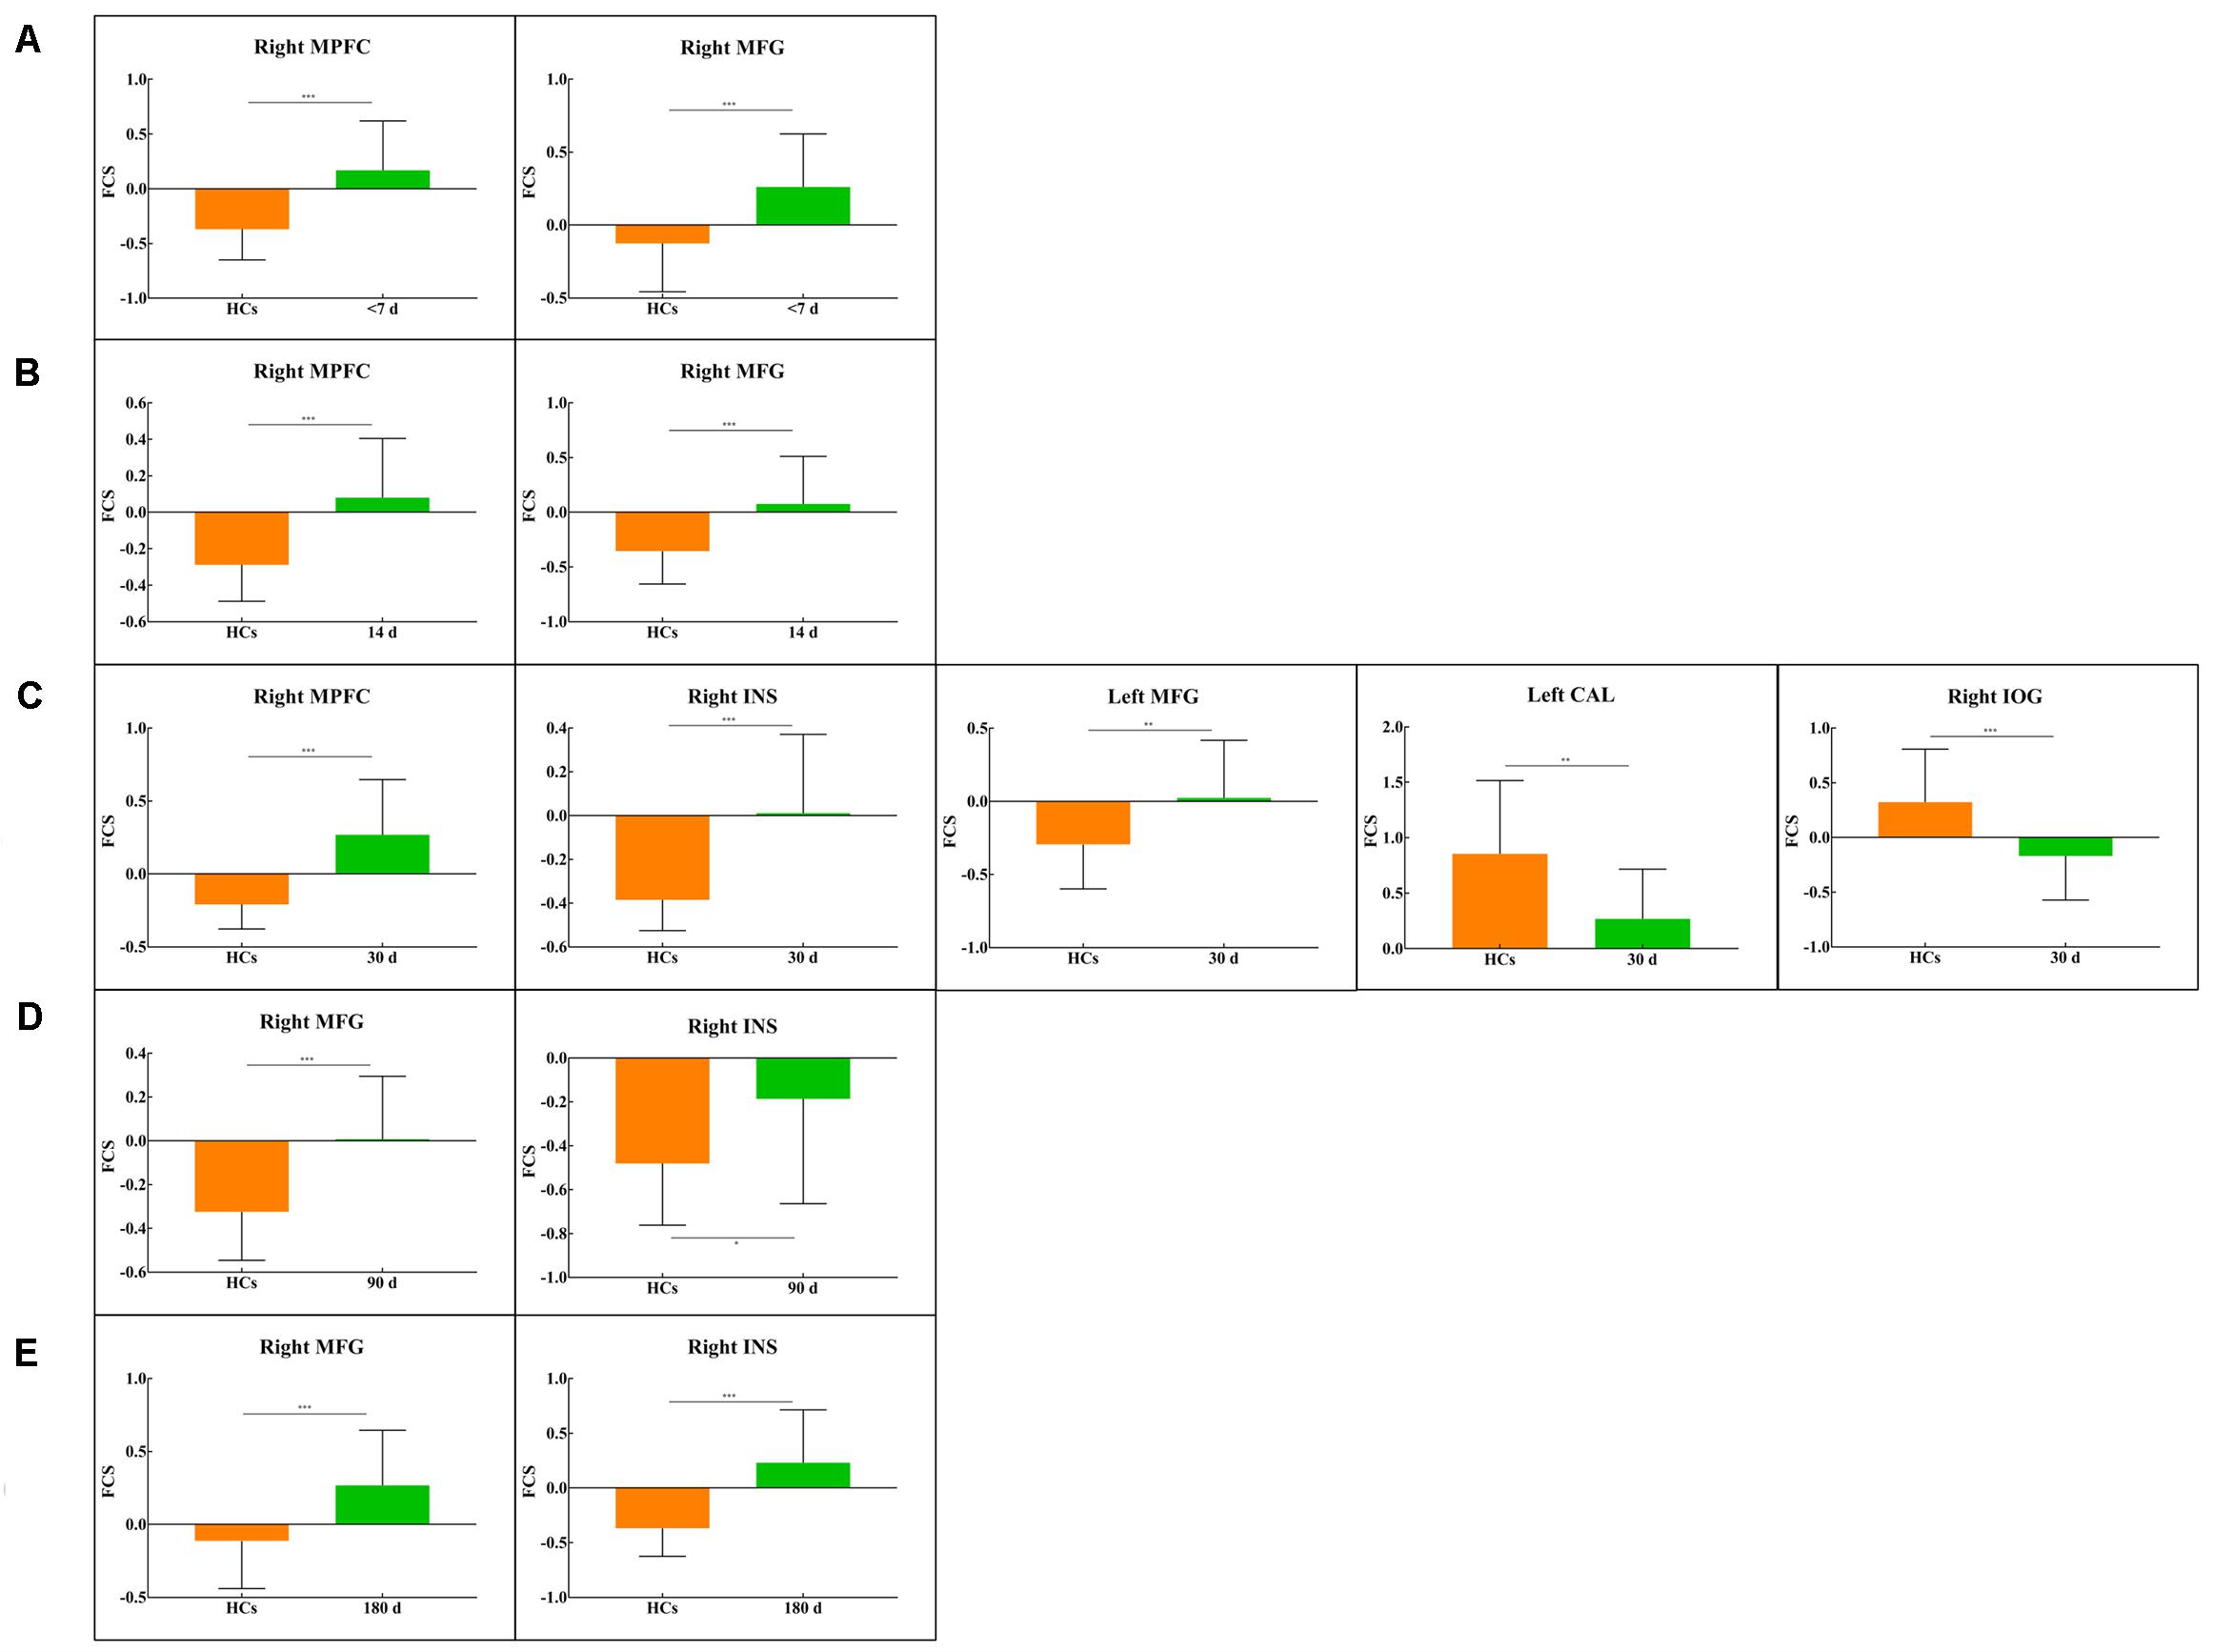
Figure 5. Bar plots show FCS values for all clusters in each between-group comparison: (A) <7 d – HCs. (B) 14 d – HCs. (C) 30 d – HCs. (D) 90 d – HCs. (E) 180 d – HCs. The bar height indicates the mean value, and the error bar indicates the standard deviation for a given group. MFG, middle frontal gyrus; MPFC, medial prefrontal cortex; CAL, calcarine; INS, insula; IOG, inferior occipital gyrus. *P < 0.05; **P < 0.01; ***P < 0.001.
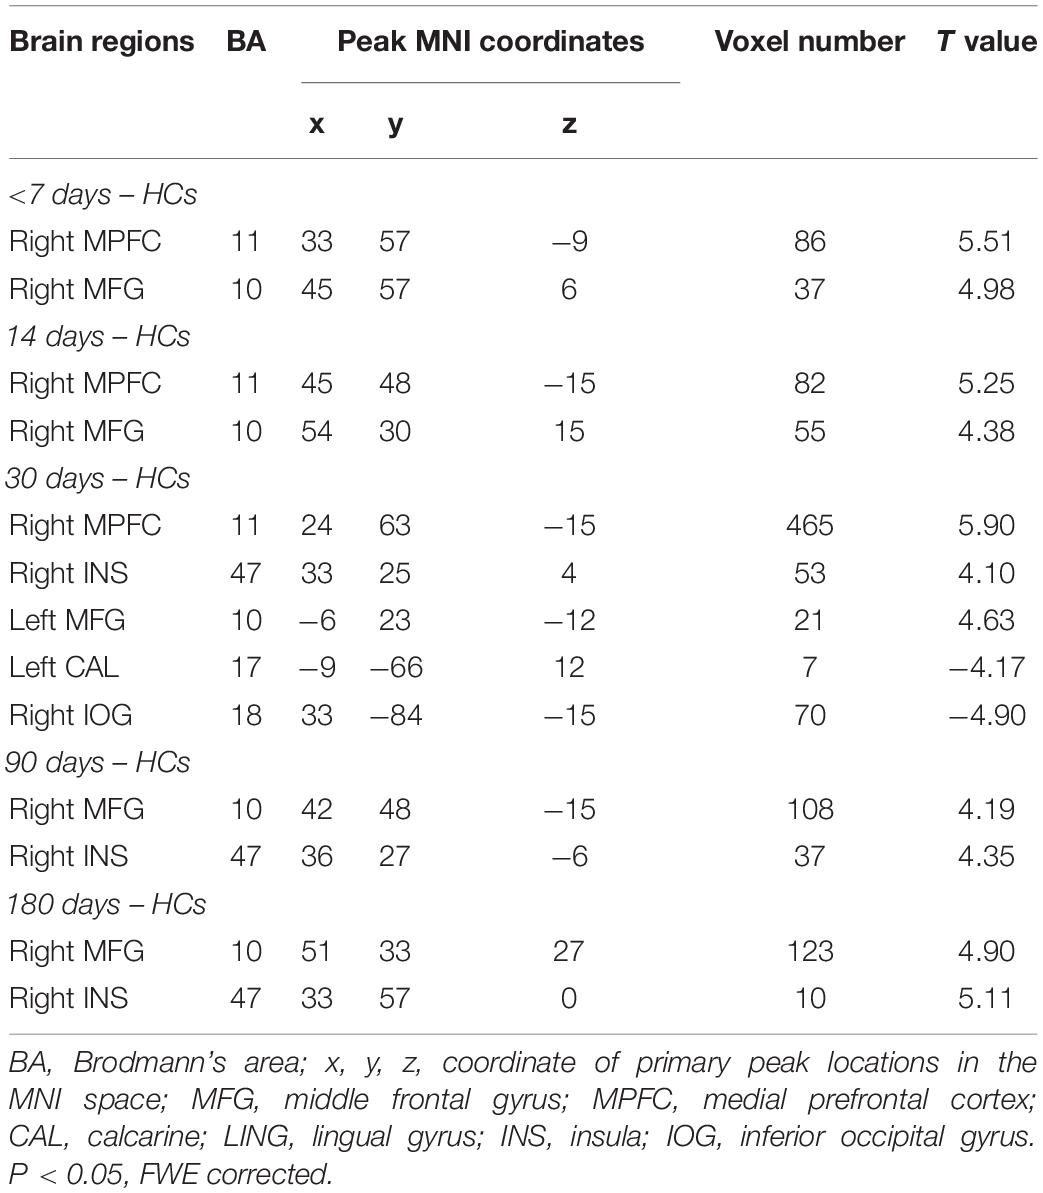
Table 2. Regions showing FCS differences between patients with five visits and HCs.
Lateralization Index Changes
Intra- and between-group LI changes are shown in Figure 6. As seen from the figure, there was significant LI difference among the different visits in the patient group (F = 5.27, P = 0.01). The post hoc test revealed that the LI at the 30-day visit was significantly different from those at the other four visits in the patient group (P < 0.05), which showed a trend of first a decline and then an increase. Additionally, the LI of HCs (0.10 ± 0.05) showed left hemisphere dominance, while the LI values for the patients with five visits (<7 days, −0.01 ± 0.04; 14 days, −0.02 ± 0.04; 30 days, −0.05 ± 0.03; 90 days, −0.02 ± 0.04; 180 days, −0.01 ± 0.05) were negative and lost the left hemisphere dominance, which significantly differed from LI of the HCs (P < 0.001). Combined with the above results, it should be noted that the tendency of losing left hemisphere dominance in patients at the 30-day visit was significant (P < 0.05). The main findings about LI were preserved in the validation test (Supplementary Figure S2).
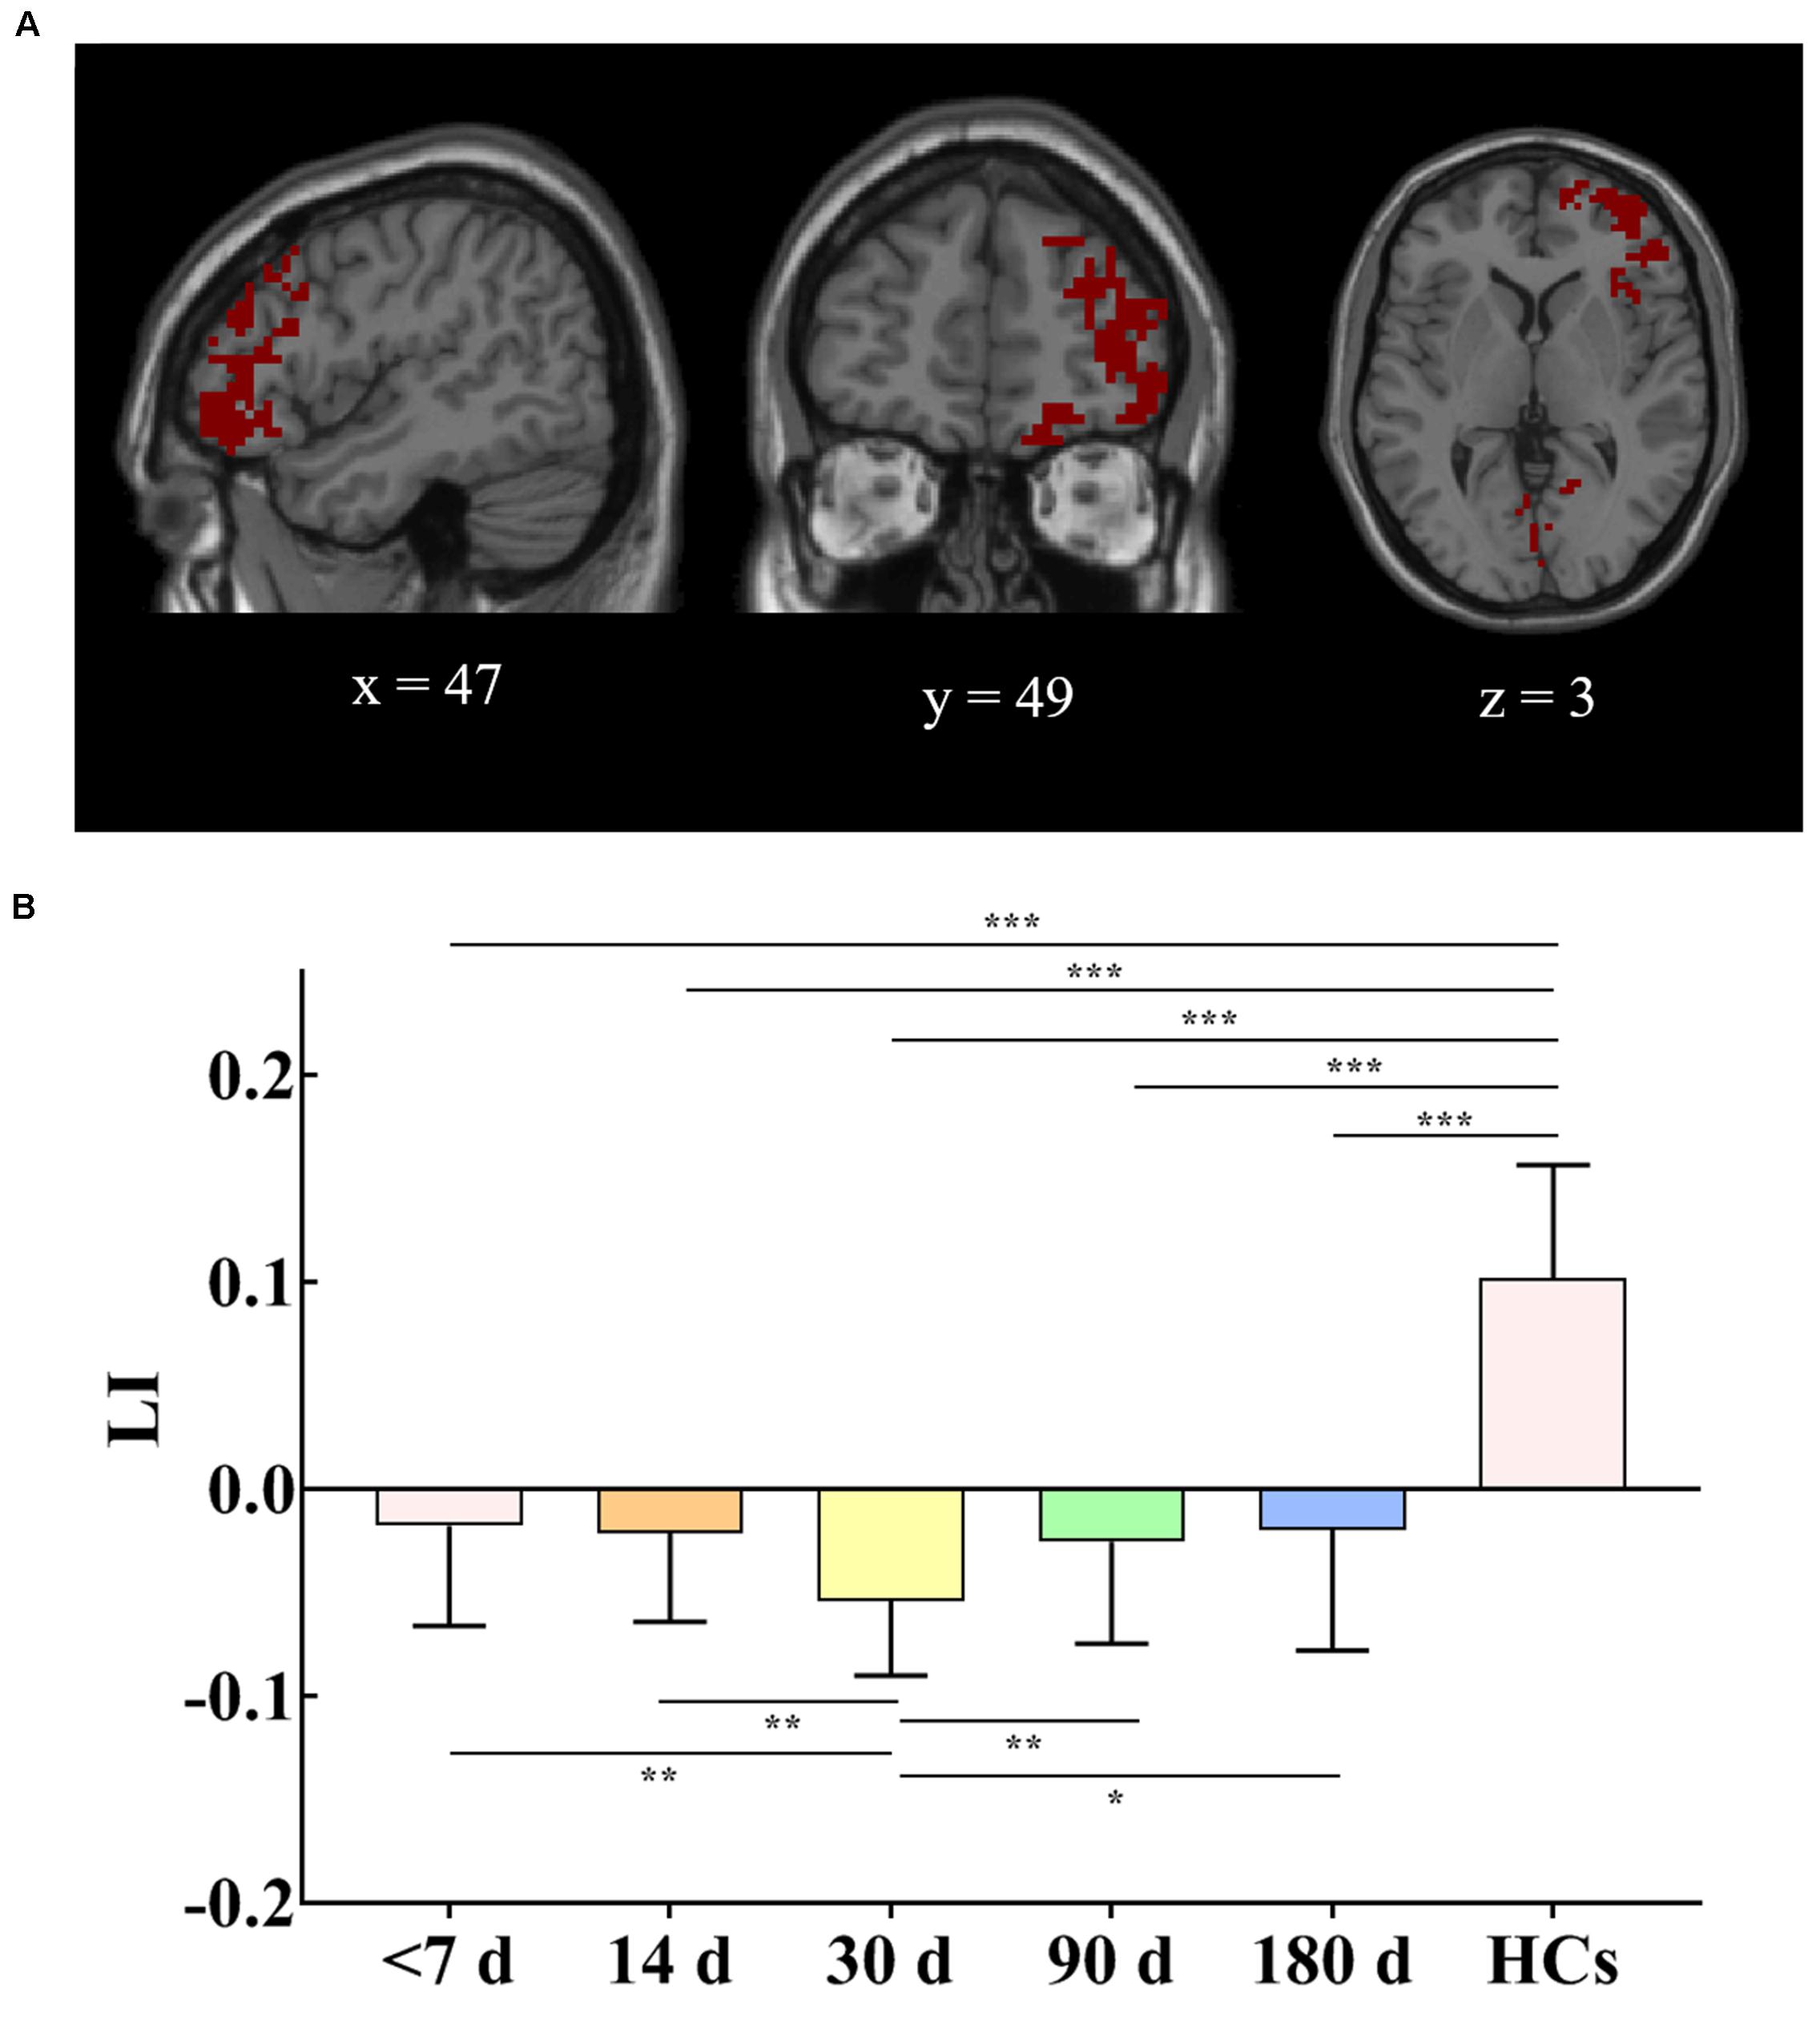
Figure 6. (A) Union of brain regions from five FCS comparisons between patients at five visits and HCs. (B) LI changes in patients at the last four visits compared with baseline and patients at five visits compared with HCs. The mask for LI calculation used the mirror image superimposed brain area, which is shown in (A). Error bars show standard deviations. HCs, healthy controls; FCS, functional connectivity strength; LI, lateralization index. *P < 0.05, **P < 0.01, ***P < 0.001.
Correlations Between Changes in Motor Function and Changes in Functional Measurements
No significant correlation was found between changes in functional measurements (ΔFCS and ΔLI) and changes in motor function (ΔFMA and Δgrip strength).
Discussion
In this study, we constructed a voxel-based whole-brain functional network to estimate the FCS and LI and to analyze the longitudinal effects between functional measurements (FCS and LI) and motor function (FMA and grip strength) in the left BG stroke patients. We obtained the following results: (a) comparing the HCs, the BG stroke patients at five visits showed varying degrees of FCS. Major FCS decreases gathered in the left CAL and right IOG, and FCS increases more likely located in the right MPFC, bilateral MFG, and right INS. (b) Comparing the HCs, LI lost the left hemisphere dominance in patients, and LI changes at the 30-day visit were significant. (c) Transition of FCS and LI changes occurred in the patients with five visits, and the turning point occurred approximately 30 days after onset, which served as a predictive biomarker for the development of BG stroke. The findings suggested that the functional network in BG stroke patients showed strong plasticity and could be reorganized with different temporal dynamics.
Dynamic Network Reorganization Showed a Transition at the 30-Day Visit
Most previous studies have confirmed the involvement of changes in the cortical functional domain during motor function recovery in stroke patients. However, there is no consensus on the correlation between cortical activation and motor functional rehabilitation, the activated site of the brain, activation intensity, the recovery process, and the efficiency of rehabilitation therapy. In this study, we documented the FCS and LI changes in the left BG patients using longitudinal functional MRI examination, which was able to delineate the development of the functional changes.
This longitudinal study indicated the trajectory of FCS and LI alterations, which showed the functional transition in BG stroke patients at the 30-day visit. The results were consistent with previous findings in both animal and human studies (Meer et al., 2010; Park et al., 2011; Zhang et al., 2016). Park et al. (2011) found that the lowest connectivity of the interhemispheric motor network appeared 1 month after the stroke, followed by a subsequent reincrease. Additionally, Zhang et al. (2016) reported increased FC between the bilateral primary motor cortex after 1 month of conventional rehabilitation and suggested that 1 month after onset in stroke patients was a critical period of rehabilitation. Moreover, Meer et al. (2010) demonstrated highly similar findings in rats. They used poststroke fMRI data from rats to explore the time course of connectivity changes and reported that the connectivity between the bilateral hemispheric sensorimotor areas decreased over the first 2 weeks (rats showed a relatively short reverse time than humans) and then reincreased alongside the recovery of sensorimotor function. Combined with the above findings, these data provide supports for the view that the prime time for treatment in BG stroke patients was within 30 days after onset and that the clinical doctor could proceed with interventional therapy using reliable rehabilitation methods during this critical time.
Abnormal FCS Changes in Patients
Many functional imaging studies of stroke have reported the occurrence of dysfunction across brain areas, including the cortical regions of sensorimotor, temporal, parietal, and occipital areas (Ferrandez et al., 2003; Ward et al., 2003). By tracking detailed FCS alterations in BG stroke, this study showed both decreased and increased FCS in different cerebral regions across the five visits in the left BG stroke patients compared with the HCs. In the left BG stroke patients, we found that decreased FCS localized in the CAL and IOG. The results coincide with the previous task-based fMRI studies, which reported non-motor brain areas such as the occipital cortex are in association with motor tasks in patients with stroke (Ward et al., 2003). Moreover, Park et al. (2011) acquired rs-fMRI data of stroke patients with four visits and HCs, performed analysis of FC, and showed the stroke patients had decreased FC in the occipital cortex. In addition to motor dysfunction, BG stroke can also lead to impairments in executive function, visual memory, and other aspects. These disorders can cause complex changes in brain function involving multiple brain regions (Wang et al., 2017; Tambasco et al., 2018). Thus, our observation of decreased FCS in several occipital regions may contribute to these deficits.
Additionally, we also observed increased FCS localized in the right MPFC and right INS in the BG stroke patients, which agreed well with the findings of Fan et al. (2015) and Zheng et al. (2016). The MPFC has not been regarded as a primary or secondary sensorimotor region but as a region that is associated with high-level executive functions and decision-related processes (Zheng et al., 2016). Moreover, it has been indicated that the INS was a participant in motor control and cognitive functioning (Wang X. et al., 2014). Thus, increased FCS in the MPFC and INS may imply that motor and cognitive manipulation had become stronger because of the shortage of motor output affected by the infarction lesion (Fan et al., 2015). It should be noted that those increased regions were primarily localized in the contralesional hemisphere, which was taken as the compensatory mechanism to compensate for the motor impairment caused by the damaged brain region (Zheng et al., 2016; Desowska and Turner, 2019).
LI Changes in Patients
The breakdown of harmonious interaction could be quantitatively characterized in terms of the LI, which was calculated based on the union of regions with altered FCS in this study. Coinciding with the perspective of Thiel et al. (2006) and Bartolomeo and Thiebaut de Schotten (2016), the healthy hemisphere could be integrated into brain function and compensate for the lost brain function of the damaged hemisphere. Our results of the LI showed that corresponding regions of FCS changes in the stroke patients were highly lateralized to the contralesional hemisphere, suggesting compensation from the contralesional hemisphere. Therefore, the combined results of the current study suggest that the breakdown of harmonious interactions between the bilateral cerebral hemispheres may have led related brain regions to undergo neurophysiological inhibition and compensation. These findings also implied that FCS in the non-affected area was indicative of the disease dynamic of cerebral stroke.
Limitations
Limitations did exist in the current study and should be acknowledged. First, although the current study enrolled only patients with a single left BG stroke lesion, further research might take the relative heterogeneity in lesion region or volumes into consideration. Second, the participants in this study did not adequately assess the association between functional patterns and clinical neurophysiological scales. Although the current study has described longitudinal changes in motor function and calculated the longitudinal effects between brain function and behavioral assessments, there was no significant correlation. Thus, the correlations between functional pattern and neurophysiological information still require further exploration. We suggested that in the subsequent studies on BG stroke patients, besides the motor function scale, researchers also need to measure the cognitive function scale to help us further understand the brain function mechanism of stroke. Third, one-way ANOVA analysis of FCS in patients had no significant results, which may due to the insufficient sample size. On this condition, we performed between-group comparisons between patients during five visits and HCs and found that the variation size trend of significant FCS cluster obtained in five between-group comparisons is consistent with the longitudinal comparison trend of LI. So, we suggested that although FCS lacks the results of ANOVA analysis, the above results of between-group analysis and LI may indirectly reflect the longitudinal FCS changes in patients. Additionally, future studies should collect more samples to further verify our results. Fourth, the study examined functional changes using only rs-fMRI, while recent studies have indicated that reorganization of brain function was also related to damage to brain structure (Liu J. et al., 2015; Thiel and Vahdat, 2015; Desowska and Turner, 2019). Thus, to better understand the neural mechanisms of reorganization, further studies are required to combine FC with structural studies.
Conclusion
The current study examined voxel-based FCS as well as LI in left BG stroke patients across five visits. We found that decreased FCS localized in the CAL and IOG and increased FCS localized in the MPFC, MFG, and INS in the BG stroke patients. Furthermore, our results revealed that left BG patients exhibited a transitional variance in LI and FCS changes at the 30-day visit. The results of the current study provide not only new evidence of the neural effects on the voxel-based whole-brain network but also an indication that the critical convalescence stage in BG stroke patients was approximately 30 days after onset.
Data Availability Statement
All datasets generated for this study are included in the article/Supplementary Material.
Ethics Statement
The studies involving human participants were reviewed and approved by the Ethics Committee of Xuanwu Hospital of Capital Medical University. The patients/participants provided their written informed consent to participate in this study.
Author Contributions
JL conceived and designed the study and reviewed and edited the manuscript. MZ, D-DR, and Q-FM recruited the subjects. CZ and YS performed the experiments. Q-GL and Y-YY analyzed the data. Q-GL and CZ wrote the manuscript. All authors contributed to the article and approved the submitted version.
Funding
This study has received funding by the National Natural Science Foundation of China under Grant Nos. 81522021, 81671662, and 81901722; Beijing Municipal Administration of Hospitals’ Ascent Plan under Grant No. DFL20180802.
Conflict of Interest
The authors declare that the research was conducted in the absence of any commercial or financial relationships that could be construed as a potential conflict of interest.
Acknowledgments
We gratefully acknowledge the two reviewers for constructive and insightful comments on a previous version of this article.
Supplementary Material
The Supplementary Material for this article can be found online at: https://www.frontiersin.org/articles/10.3389/fnins.2020.526645/full#supplementary-material
Footnotes
References
Bartolomeo, P., and Thiebaut de Schotten, M. (2016). Let the left brain know what thy right brain doeth: Inter-hemispheric compensation of functional deficits after brain damage. Neuropsychologia 93, 407–412. doi: 10.1016/j.neuropsychologia.2016.06.016
Biswal, B., Yetkin, F. Z., Haughton, V. M., and Hyde, J. S. (2010). Functional connectivity in the motor cortex of resting human brain using echo-planar MRI. Magn. Reason. Med. 34, 537–541. doi: 10.1002/mrm.1910340409
Buckner, R. L., Sepulcre, J., Talukdar, T., Krienen, F. M., Liu, H., Hedden, T., et al. (2009). Cortical hubs revealed by intrinsic functional connectivity: mapping, assessment of stability, and relation to Alzheimer’s disease. J. Neurosci. 29, 1860–1873. doi: 10.1523/JNEUROSCI.5062-08.2009
de Pasquale, F., Corbetta, M., Betti, V., and Della Penna, S. (2018). Cortical cores in network dynamics. Neuroimage 180, 370–382. doi: 10.1016/j.neuroimage.2017.09.063
Desowska, A., and Turner, D. L. (2019). Dynamics of brain connectivity after stroke. Rev. Neurosci. 30, 605–623. doi: 10.1515/revneuro-2018-0082
Fan, Y. T., Wu, C. Y., Liu, H. L., Lin, K. C., Wai, Y. Y., and Chen, Y. L. (2015). Neuroplastic changes in resting-state functional connectivity after stroke rehabilitation. Front. Hum. Neurosci. 9:546. doi: 10.3389/fnhum.2015.00546
Fazekas, F., Chawluk, J. B., Alavi, A., Hurtig, H. I., and Zimmerman, R. A. (1987). MR signal abnormalities at 1.5 T in Alzheimer’s dementia and normal aging. AJR. Am. J. Roentgenol. 149, 351–356. doi: 10.2214/ajr.149.2.351
Ferrandez, A. M., Hugueville, L., Lehéricy, S., Poline, J. B., Marsault, C., and Pouthas, V. (2003). Basal ganglia and supplementary motor area subtend duration perception: an fMRI study. NeuroImage 19, 1532–1544. doi: 10.1016/s1053-8119(03)00159-9
Florio, T. M., Scarnati, E., Rosa, I., Di Censo, D., Ranieri, B., Cimini, A., et al. (2018). The Basal Ganglia: More than just a switching device. CNS Neurosci. Ther. 24, 677–684. doi: 10.1111/cns.12987
Friston, K. J., Worsley, K. J., Frackowiak, R. S., Mazziotta, J. C., and Evans, A. C. (1994). Assessing the significance of focal activations using their spatial extent. Hum. Brain. Mapp. 1, 210–220. doi: 10.1002/hbm.460010306
Fu, Y., Zhang, Q., Yu, C., Zhang, J., Wang, N., Zuo, S., et al. (2016). Longitudinal Assessment of Motor Recovery of Contralateral Hand after Basal Ganglia Infarction Using Functional Magnetic Resonance Imaging. Biomed. Res. Int. 2016:7403795. doi: 10.1155/2016/7403795
Fugl-Meyer, A. R., Jääskö, L., Leyman, I., Olsson, S., and Steglind, S. (1975). The post-stroke hemiplegic patient. 1. a method for evaluation of physical performance. Scand. J. Rehabil. Med. 7:13.
Gao, Z., Zhang, D., Liang, A., Liang, B., Wang, Z., Cai, Y., et al. (2017). Exploring the Associations Between Intrinsic Brain Connectivity and Creative Ability Using Functional Connectivity Strength and Connectome Analysis. Brain. Connect. 7, 590–601. doi: 10.1089/brain.2017.0510
Guo, A., Hao, F., Li, F., Wang, B., Liu, L., Zhao, Z., et al. (2017). Basal ganglia cerebral infarction patient fMRI imaging analysis before and after acupuncture-medicine therapy. Biomed. Res. 28, 9779–9783.
Guo, Z., Liu, X., Hou, H., Wei, F., Liu, J., and Chen, X. (2016). Abnormal degree centrality in Alzheimer’s disease patients with depression: a resting-state functional magnetic resonance imaging study. Exp. Gerontol. 79, 61–66. doi: 10.1016/j.exger.2016.03.017
Kessner, S. S., Schlemm, E., Cheng, B., Bingel, U., Fiehler, J., Gerloff, C., et al. (2019). Somatosensory Deficits After Ischemic Stroke. Stroke 50, 1116–1123. doi: 10.1161/STROKEAHA.118.023750
Kreitzer, A. C., and Malenka, R. C. (2008). Striatal plasticity and basal ganglia circuit function. Neuron 60, 543–554. doi: 10.1016/j.neuron.2008.11.005
Liu, J., Qin, W., Zhang, J., Zhang, X., and Yu, C. (2015). Enhanced interhemispheric functional connectivity compensates for anatomical connection damages in subcortical stroke. Stroke 46, 1045–1051. doi: 10.1161/strokeaha.114.007044
Liu, W., Liu, H., Wei, D., Sun, J., Yang, J., Meng, J., et al. (2015). Abnormal degree centrality of functional hubs associated with negative coping in older Chinese adults who lost their only child. Biological. Psychology. 112, 46–55. doi: 10.1016/j.biopsycho.2015.09.005
Marangon, M., Priftis, K., Fedeli, M., Masiero, S., Tonin, P., and Piccione, F. (2014). Lateralization of motor cortex excitability in stroke patients during action observation: a TMS study. Biomed. Res. Int. 2014:251041. doi: 10.1155/2014/251041
Meer, M. P. A., Van Kajo, V. D. M., Kun, W., Otte, W. M., Soufian, E. B., Roeling, T. A. P., et al. (2010). Recovery of sensorimotor function after experimental stroke correlates with restoration of resting-state interhemispheric functional connectivity. J. Neurosci. 30, 3964–3972. doi: 10.1523/JNEUROSCI.5709-09.2010
Park, C. H., Chang, W. H., Ohn, S. H., Kim, S. T., Bang, O. Y., Pascual-Leone, A., et al. (2011). Longitudinal changes of resting-state functional connectivity during motor recovery after stroke. Stroke 42, 1357–1362. doi: 10.1161/STROKEAHA.110.596155
Park, C.-H., Kou, N., and Ward, N. S. (2016). The contribution of lesion location to upper limb deficit after stroke. J. Neurol. Neurosurg. Psychiatry. 87, 1283–1286. doi: 10.1136/jnnp-2015-312738
Qureshi, A., Suarez, J., Yahia, A. M., Yousef, M., Guven, U., Suri, M. F. K., et al. (2003). Timing of neurologic deterioration in massive middle cerebral artery infarction: a multicenter review. Crit. Care. Med. 31, 272–277. doi: 10.1097/00003246-200301000-00043
Rondina, J. M., Filippone, M., Girolami, M., and Ward, N. S. (2016). Decoding post-stroke motor function from structural brain imaging. Neuroimage. Clin. 12, 372–380. doi: 10.1016/j.nicl.2016.07.014
Rosazza, C., Ghielmetti, F., Minati, L., Vitali, P., Giovagnoli, A. R., Deleo, F., et al. (2013). Preoperative language lateralization in temporal lobe epilepsy (TLE) predicts peri-ictal, pre- and post-operative language performance: An fMRI study. NeuroImage. Clinical. 3, 73–83. doi: 10.1016/j.nicl.2013.07.001
Smith, S. M., and Nichols, T. E. (2009). Threshold-free cluster enhancement: Addressing problems of smoothing, threshold dependence and localisation in cluster inference. Neuroimage 44, 83–98. doi: 10.1016/j.neuroimage.2008.03.061
Tambasco, N., Romoli, M., and Calabresi, P. (2018). Selective basal ganglia vulnerability to energy deprivation: Experimental and clinical evidences. Prog. Neurobiol. 169, 55–75. doi: 10.1016/j.pneurobio.2018.07.003
Thiel, A., Habedank, B., Herholz, K., Kessler, J., Winhuisen, L., Haupt, W. F., et al. (2006). From the left to the right: How the brain compensates progressive loss of language function. Brain. Lang. 98, 57–65. doi: 10.1016/j.bandl.2006.01.007
Thiel, A., and Vahdat, S. (2015). Structural and resting-state brain connectivity of motor networks after stroke. Stroke 46, 296–301. doi: 10.1161/strokeaha.114.006307
Wang, C., Chen, Y., Zhang, Y., Chen, J., Ding, X., Ming, D., et al. (2017). Quantitative EEG abnormalities in major depressive disorder with basal ganglia stroke with lesions in different hemispheres. J. Affect. Disord. 215, 172–178. doi: 10.1016/j.jad.2017.02.030
Wang, C., Wen, Q., Jing, Z., Tian, T., Ying, L., Liangliang, M., et al. (2014). Altered functional organization within and between resting-state networks in chronic subcortical infarction. J. Cereb. Blood. Flow. Metab. 34, 597–605. doi: 10.1038/jcbfm.2013.238
Wang, L., Dai, Z., Peng, H., Tan, L., Ding, Y., He, Z., et al. (2014). Overlapping and segregated resting-state functional connectivity in patients with major depressive disorder with and without childhood neglect. Hum. Brain. Mapp. 35, 1154–1166. doi: 10.1002/hbm.22241
Wang, X., Xia, M., Lai, Y., Dai, Z., Cao, Q., Cheng, Z., et al. (2014). Disrupted resting-state functional connectivity in minimally treated chronic schizophrenia. Schizophr. Res. 156, 150–156. doi: 10.1016/j.schres.2014.03.033
Ward, N. S., Brown, M. M., Thompson, A. J., and Frackowiak, R. S. J. (2003). Neural correlates of motor recovery after stroke: a longitudinal fMRI study. Brain 126, 2476–2496. doi: 10.1093/brain/awg245
Yan, C. G., Wang, X. D., Zuo, X. N., and Zang, Y. F. (2016). DPABI: Data Processing & Analysis for (Resting-State) Brain Imaging. Neuroinformatics 14, 339–351. doi: 10.1007/s12021-016-9299-4
Zhang, X. D., Liu, G. X., Wang, X. Y., Huang, X. J., Li, J. L., Li, R. L., et al. (2020). Altered Brain Function in Young HIV Patients with Syphilis Infection: A Voxel-Wise Degree Centrality Analysis. Infect. Drug. Resist. 13, 823–833. doi: 10.2147/IDR.S234913
Zhang, Y., Liu, H., Wang, L., Yang, J., Yan, R., Zhang, J., et al. (2016). Relationship between functional connectivity and motor function assessment in stroke patients with hemiplegia: a resting-state functional MRI study. Neuroradiology 58, 503–511. doi: 10.1007/s00234-016-1646-5
Keywords: ischemic stroke, connectivity strength, basal ganglia, resting state, fMRI
Citation: Li Q-G, Zhao C, Shan Y, Yin Y-Y, Rong D-D, Zhang M, Ma Q-F and Lu J (2020) Dynamic Neural Network Changes Revealed by Voxel-Based Functional Connectivity Strength in Left Basal Ganglia Ischemic Stroke. Front. Neurosci. 14:526645. doi: 10.3389/fnins.2020.526645
Received: 14 January 2020; Accepted: 24 August 2020;
Published: 18 September 2020.
Edited by:
Dong Song, University of Southern California, United StatesReviewed by:
Xin Di, New Jersey Institute of Technology, United StatesPaola Valsasina, San Raffaele Scientific Institute (IRCCS), Italy
Copyright © 2020 Li, Zhao, Shan, Yin, Rong, Zhang, Ma and Lu. This is an open-access article distributed under the terms of the Creative Commons Attribution License (CC BY). The use, distribution or reproduction in other forums is permitted, provided the original author(s) and the copyright owner(s) are credited and that the original publication in this journal is cited, in accordance with accepted academic practice. No use, distribution or reproduction is permitted which does not comply with these terms.
*Correspondence: Jie Lu, aW1hZ2luZ2x1QGhvdG1haWwuY29t
†These authors have contributed equally to this work