 Tim M. Emmenegger1,2
 Gergely David1,2
 Mohammad Ashtarayeh2
 Francisco J. Fritz2
 Isabel Ellerbrock2,3
 Gunther Helms4
 Evelyne Balteau5Patrick Freund1,6,7
 Siawoosh Mohammadi2,6*
- 1Spinal Cord Injury Center Balgrist, University Hospital Zurich, University of Zurich, Zurich, Switzerland
- 2Department of Systems Neuroscience, University Medical Center Hamburg-Eppendorf, Hamburg, Germany
- 3Department of Clinical Neuroscience, Karolinska Institutet, Stockholm, Sweden
- 4Medical Radiation Physics, Clinical Sciences Lund (IKVL), Lund University, Lund, Sweden
- 5GIGA Institute, University of Liège, Liège, Belgium
- 6Department of Neurophysics, Max Planck Institute for Human Cognitive and Brain Sciences, Leipzig, Germany
- 7Wellcome Trust Centre for Neuroimaging, University College London, London, United Kingdom
G-ratio weighted imaging is a non-invasive, in-vivo MRI-based technique that aims at estimating an aggregated measure of relative myelination of axons across the entire brain white matter. The MR g-ratio and its constituents (axonal and myelin volume fraction) are more specific to the tissue microstructure than conventional MRI metrics targeting either the myelin or axonal compartment. To calculate the MR g-ratio, an MRI-based myelin-mapping technique is combined with an axon-sensitive MR technique (such as diffusion MRI). Correction for radio-frequency transmit (B1+) field inhomogeneities is crucial for myelin mapping techniques such as magnetization transfer saturation. Here we assessed the effect of B1+ correction on g-ratio weighted imaging. To this end, the B1+ field was measured and the B1+ corrected MR g-ratio was used as the reference in a Bland-Altman analysis. We found a substantial bias (≈-89%) and error (≈37%) relative to the dynamic range of g-ratio values in the white matter if the B1+ correction was not applied. Moreover, we tested the efficiency of a data-driven B1+ correction approach that was applied retrospectively without additional reference measurements. We found that it reduced the bias and error in the MR g-ratio by a factor of three. The data-driven correction is readily available in the open-source hMRI toolbox (www.hmri.info) which is embedded in the statistical parameter mapping (SPM) framework.
Introduction
The g-ratio [i.e., the ratio between the inner (r) and outer (R) radius of an axon with myelin sheath (g-ratio = r/R)] of a given axon quantifies the degree of relative myelination, ranging between 0 (no axon) and 1 (no myelin). The g-ratio captures both axonal and myelin damage by incorporating axonal and myelin volumes in one metric, making it potentially more specific to tissue integrity than focusing on one of these aspects only. For example, in multiple sclerosis, the g-ratio increases if the underlying disease mechanism is solely driven by demyelination (Yu et al., 2019), but is expected to remain unaffected if demyelination is accompanied by axonal degeneration. To differentiate such processes and understand their functional implications, neuroscience and clinical research would greatly benefit from in-vivo whole-brain measurements of MR g-ratio. Until recently, the g-ratio was measurable only by means of histology (Hildebrand and Hahn, 1978), which restricted the analyses to a small number of axons and a limited number of small brain regions or pathways. Stikov et al. (2011, 2015) introduced a methodology for an MRI-based whole-brain “aggregate” g-ratio mapping, to which we refer as “MR g-ratio” or “g-ratio weighted imaging.” In g-ratio weighted imaging, the MR g-ratio is computed on a voxel-by-voxel basis from the axonal (AVF) and myelin volume fraction (MVF) maps and reflects a weighted mean of g-ratio values within the voxel (West et al., 2016). Therefore, g-ratio weighted imaging requires the acquisition of separate sets of images that are sensitive to AVF and MVF, respectively (Campbell et al., 2018; Mohammadi and Callaghan, 2020). To generate MVF and AVF from the measured MR parameters, a calibration step is required that converts the measured MR-visible water signals into the respective volume fractions (Mohammadi and Callaghan, 2020).
Magnetization transfer saturation (MTsat) has often been used as proxy for MVF (Mohammadi et al., 2015) as it is minimally affected by the longitudinal relaxation time (Helms et al., 2008) and is expected to show high correlation with macromolecular content (Sereno et al., 2013; Callaghan et al., 2015a; Campbell et al., 2018), making it a sensitive metric of MVF. One common approach to estimate AVF complements the parameters from neurite orientation and dispersion density imaging (NODDI Zhang et al., 2012) with a MVF-proxy, e.g., MTsat (Ellerbrock and Mohammadi, 2018; Kamagata et al., 2019), to correct for the missing myelin water signal in diffusion MRI measurements (Stikov et al., 2015). Maps of MTsat can be obtained, among others, from the multi-parameter mapping (MPM) protocol (Weiskopf et al., 2013) in combination with the hMRI toolbox1 (Callaghan et al., 2019; Tabelow et al., 2019).
Although the MTsat measure is largely insensitive to transmit field (B1+) inhomogeneities (Helms et al., 2008), it still shows a residual dependence which introduces a bias and/or error in the MTsat maps that can propagate into the MR g-ratio and lead to systematic bias. Such B1+ inhomogeneities can be corrected based on an independently acquired B1+ field map measurement (Helms, 2015; Helms et al., 2021). Residual B1+ inhomogeneity effects on MTsat have been shown to be not negligible when the B1+ correction was omitted (Helms, 2015; Helms et al., 2021). However, the impact of B1+ correction on MR g-ratio estimates is unknown. Additionally, it is unclear whether these residual B1+ inhomogeneity in MTsat and the MR g-ratio can retrospectively be corrected using a data-driven B1+ field inhomogeneities estimation approach such as the “unified segmentation based correction of R1 maps for B1+ inhomogeneities” (UNICORT, (Weiskopf et al., 2011)).
In this study, we investigate the effect of B1+ inhomogeneities on MR g-ratio maps when omitting the B1+ correction. As a reference, we use the B1+ corrected MR g-ratio from a dataset of healthy controls. We compare the reference MR g-ratio values against (i) values obtained without B1+ correction and (ii) values obtained with B1+ correction using the data-driven UNICORT approach.
Materials and Methods
Subjects
This study included 25 healthy control subjects (12 females, age (mean ± standard deviation) of 25.4 ± 2.4 years). They were recruited at the University Medical Centre Hamburg-Eppendorf and screened for neurological or psychiatric illness. The study was in agreement with the Declaration of Helsinki and was approved by the local ethics committee (Ärztekammer Hamburg #PV5141).
Data Acquisition
Each subject was scanned twice within 1 week in a whole-body 3T Tim TRIO MR scanner (Siemens Healthcare, Erlangen, Germany) using the body RF-coil for transmission and a 32-channel radiofrequency (RF) head coil for signal reception, respectively. The MR acquisition on both scan days included a multi-parameter mapping (MPM) (Weiskopf et al., 2013; Callaghan et al., 2015b) and a diffusion-weighted imaging (DWI) protocol. The MPM protocol consists of three differently weighted 3D-multi-echo spoiled gradient echo sequences (Siemens FLASH). The echo train length and flip angle for the proton density (PD) weighted, T1-weighted, and magnetization transfer (MT) weighted sequences were 8/6, 8/21, and 6/6°, respectively. The MT-weighted sequence had a Gaussian RF pulse (2 kHz off resonance with 4 ms duration and a nominal flip angle of 220°). All other sequence parameters were the same for the three sequences: repetition time (TR) 25 ms, echo spacing, resolution 0.8 mm isotropic; field of view (FoV) 166 × 224 × 256 mm3, readout bandwidth 488 Hz/pixel, partially parallel imaging using the GRAPPA algorithm was employed in each phase-encoded direction (anterior-posterior and right-left) with 40 reference lines and a speed up factor of two, total acquisition time: ∼25 min. The B1+ field reference map was acquired using the three-dimensional echo-planar imaging (3D EPI) method, including field maps for distortion correction (Lutti et al., 2010).
The DWI sequence was a twice-refocused single-shot spin-echo EPI scheme (Reese et al., 2003), consisting of 12 non-diffusion-weighted images (b0 images), equidistantly distributed across the diffusion weighted images. The diffusion-weighted images were acquired at two b-values (1000 and 2000), sampled along 60 unique diffusion-gradient directions within each shell. The entire protocol was repeated with identical parameters but with reversed phase encoding direction (anterior-posterior) to correct for susceptibility-related image distortions (blip-up, blip-down correction). In total, 264 images were acquired per subject (120 diffusion-weighted images, 12 b0 images, each acquired twice). Other acquisition parameters were: 86 slices with no gap, TR = 7.1 s, TE = 122 ms, an isotropic voxel size of (1.6 mm)3, FoV = 224 × 224 × 138 mm3, 7/8 partial Fourier imaging in phase encoding direction, readout bandwidth. To accelerate the data acquisition, GRAPPA (in-plane acceleration with factor two) and simultaneous multi-slice acquisitions (“multiband,” slice acceleration factor two) (Feinberg et al., 2010; Moeller et al., 2010; Xu et al., 2013) were used as described in Setsompop et al. (2012). The image reconstruction algorithm was provided by the University of Minnesota Centre for Magnetic Resonance Research. The total acquisition time was ∼37 min.
Data Processing
MTsat maps were generated in the SPM-based hMRI toolbox (Tabelow et al., 2019). Note that the hMRI toolbox also generates additional maps of longitudinal (R1) and effective transverse relaxation rates () and PD. Three MTsat maps were generated: (i) maps, without B1+ correction; (ii) map, using the reference B1+ field map for correction (Lutti et al., 2010); and (iii) maps, using the data-driven UNICORT approach for B1+ estimation (Weiskopf et al., 2011; see Supplementary Figure 2). UNICORT is a probabilistic framework for unified-segmentation based correction of R1 maps for B1+ inhomogeneities. The framework incorporates a physically informed generative model of smooth B1+ inhomogeneities and their multiplicative effect on R1 estimates (Weiskopf et al., 2011). Parameters used in UNICORT such as the smoothness and regularization were optimized for R1 B1+ correction in a 3T scanner (i.e., Tim Trio scanner—Weiskopf et al., 2011).
For B1+ correction, we used the following heuristic correction factor as detailed in Helms (2015), and Helms et al. (2021):
where C has been calibrated to be 0.4 for the MT pulse used in this paper. B1+ can be either measured () or estimated with the UNICORT approach ().
The DWI data were processed based on the pipeline described in Ellerbrock and Mohammadi (2018) using the SPM-based ACID toolbox2. It included several artifact corrections such as Rician signal bias correction (i.e., denoising) (André et al., 2014), correction for eddy current and motion artifacts (Mohammadi et al., 2010, 2014), and correction for image distortions due to susceptibility artifact using reversed phase encoding (Ruthotto et al., 2012, 2013; Macdonald and Ruthotto, 2018). The corrected images were fitted with the NODDI signal model (Zhang et al., 2012) to estimate the intra-cellular volume fraction (νicvf), the isotropic volume fraction (νiso), and the orientation dispersion index (ODI) in each voxel.
Spatial Alignment
Co-registration
The voxel-wise arithmetic between the MTsat and νicvf maps, necessary for MR g-ratio computation, requires an accurate spatial alignment between the two maps (Mohammadi et al., 2015). To this end, we created two white matter (WM) tissue probability maps (TPMs) based on the ODI and maps, respectively (Figure 1). To reduce the influence of contrast-specific artifacts (e.g., due to subject motion) on the registration quality, the WM TPM of the ODI map was co-registered to the WM TPM of the map using rigid-body registration (spm_coreg algorithm, SPM toolbox). The estimated transformation parameters were applied to all other NODDI maps as well. Note that the segmentation quality of the second session was unsatisfactory for two subjects, and the map (R1 with B1+ inhomogeneities bias correction using the B1+ reference measurements) was used to generate the WM TPM instead. In another subject, the νiso was segmented instead of the ODI to achieve satisfactory WM segments.
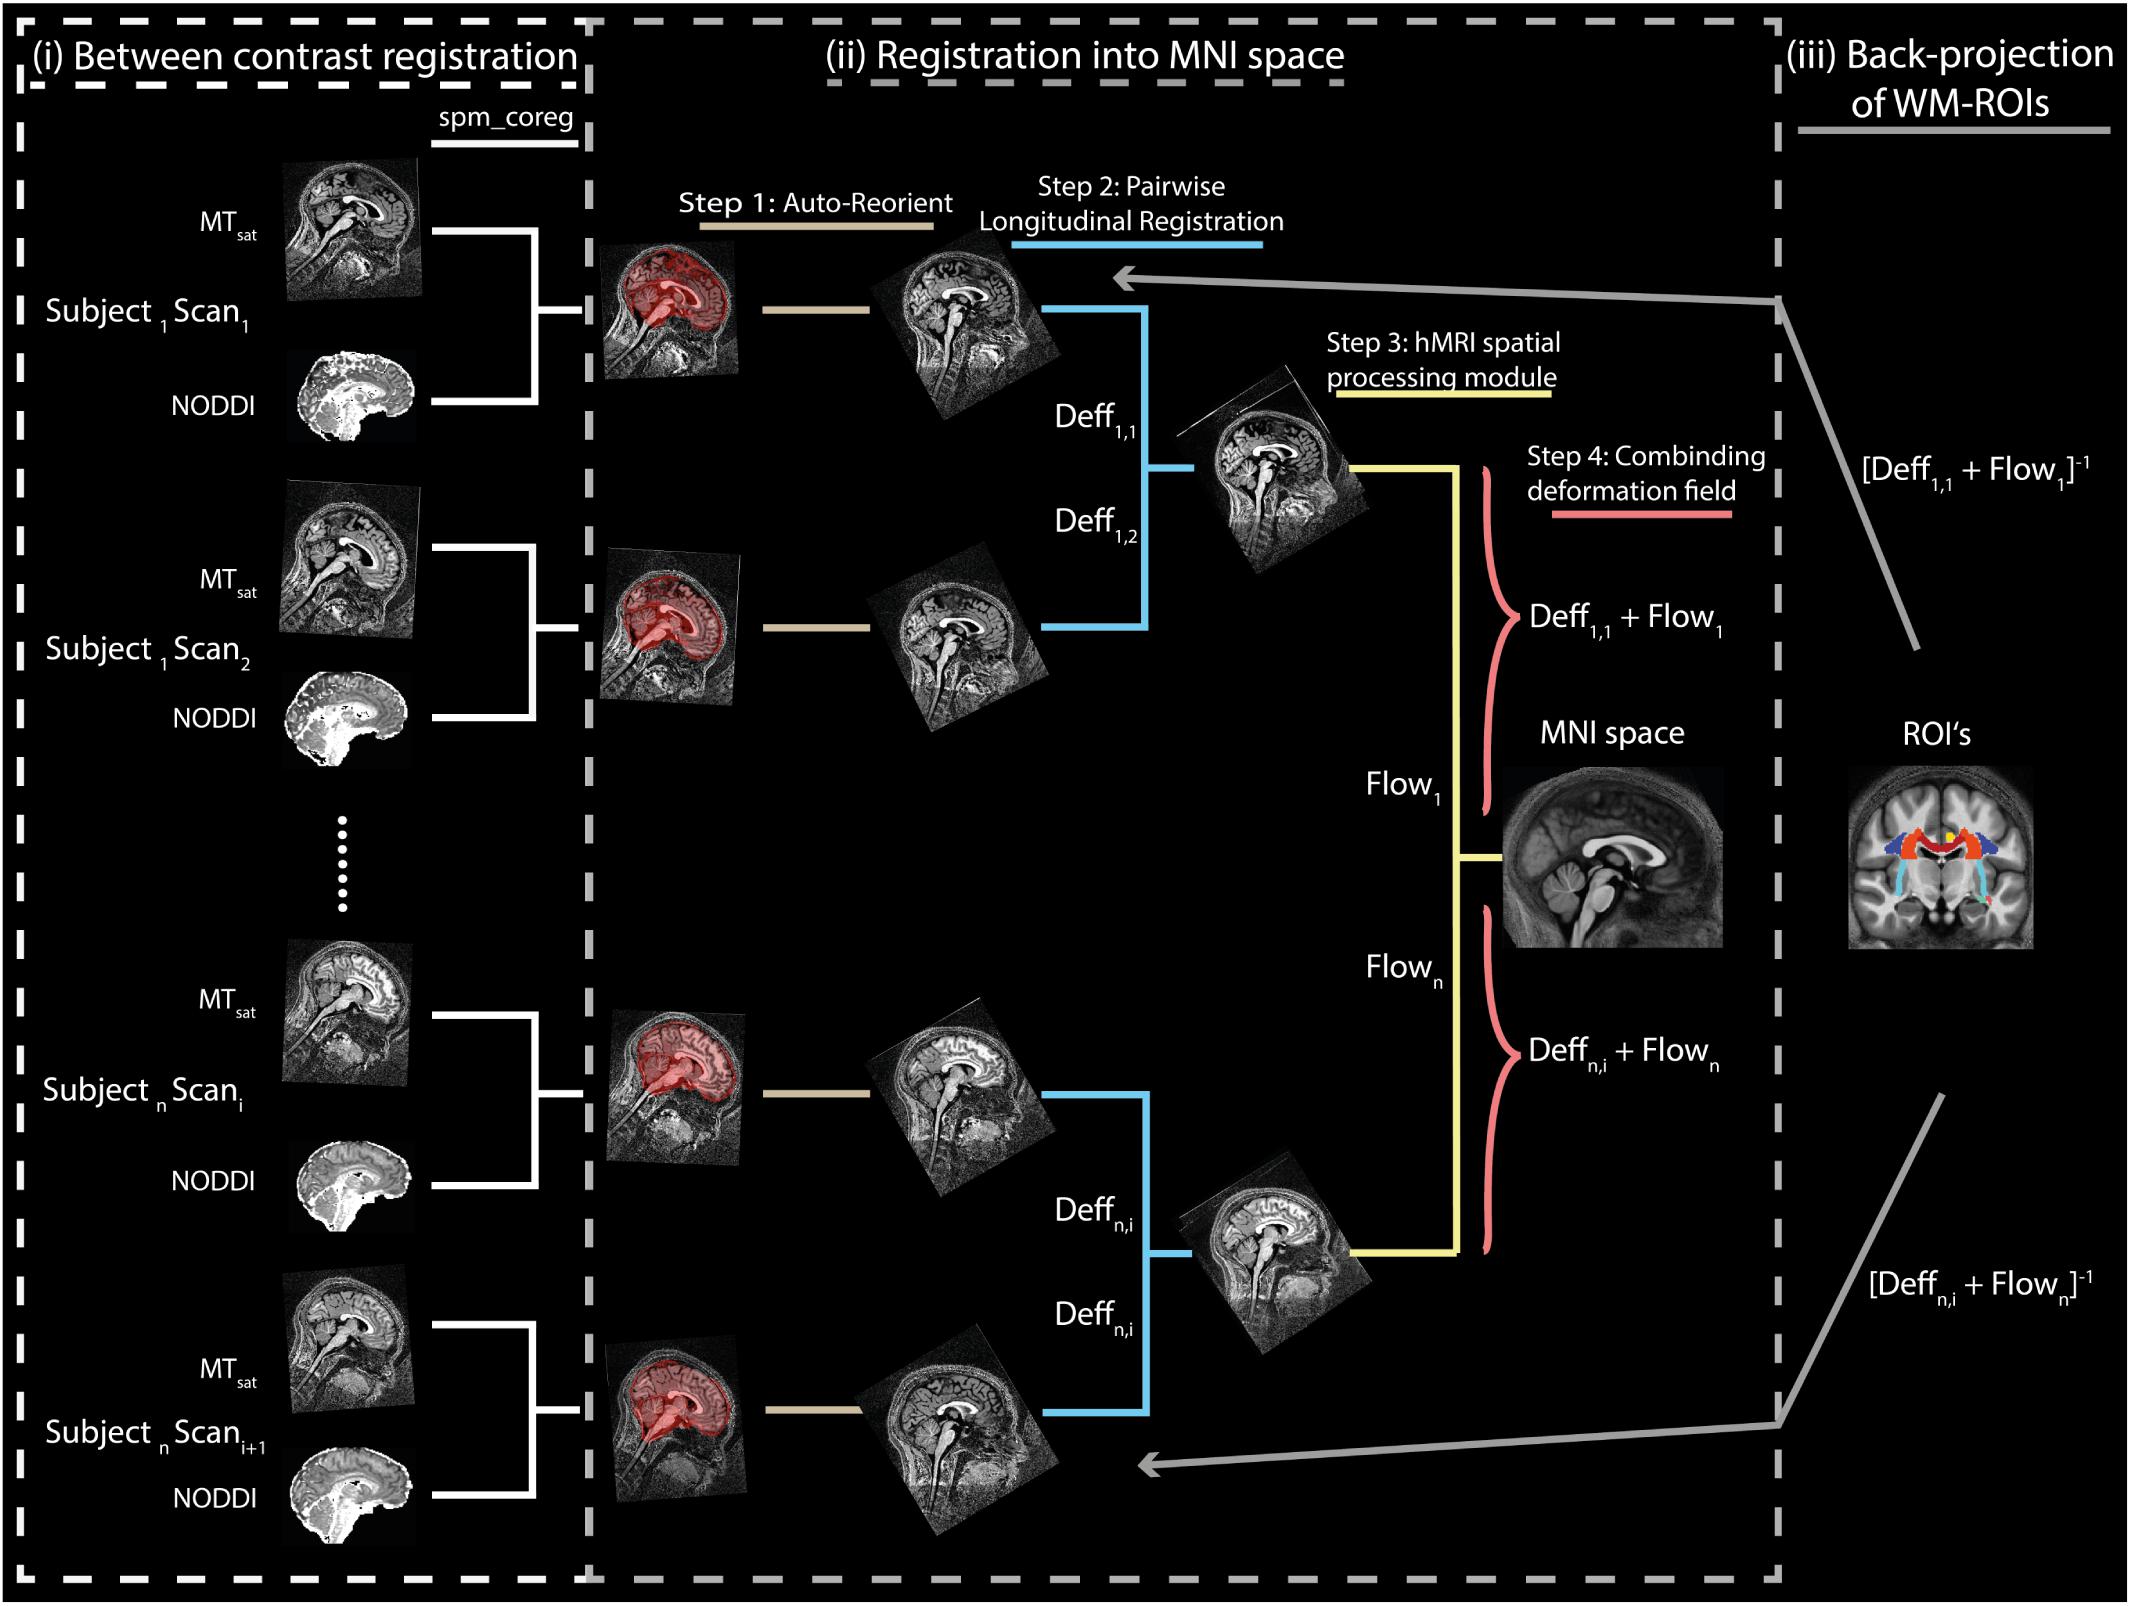
Figure 1. Illustration of the spatial alignment pipeline of the MTsat and NODDI maps. The pipeline consists of (i) co-registration between MTsat and NODDI maps (driven by ODI map), (ii) normalization into MNI space, and (iii) back-projection of ROIs into the native space. Note that each subject consists of two sets of images acquired in separate sessions. In the co-registration step (section “Co-registration”), the white matter (WM) tissue probability map (TPM) of the ODI was co-registered to the WM TMP of the MTsat in each subject and session using rigid-body registration (spm_coreg algorithm, SPM12). The resulting transformation was applied to all other NODDI maps as well. In the normalization step (section “Normalization”), MTsat maps were roughly aligned with the T1-weighted MNI template in each subject and session using the Auto-Reorient function. The realigned MTsat maps from both sessions were then registered to their mid-point average using the Pairwise Longitudinal Registration (SPM12). In each subject, the mid-point average MTsat map was normalized to the MNI space using the DARTEL-based (Ashburner, 2007) Spatial Processing module. Finally, all deformation fields were converted to a single deformation field and applied on the NODDI maps. In the last step (section “Region of Interest Selection”), the ROIs and the WM masks were back-projected into the native space using the inverse of the combined deformation field.
Normalization
Spatial normalization was performed in four steps. First, a rough alignment of the maps with the T1-weighted MNI template image was achieved using the Auto-Reorient function (hMRI toolbox) and this was applied on the NODDI maps as well. Second, both maps of each subject (corresponding to two sessions) were registered to the mid-point average using the Pairwise Longitudinal Registration (SPM12). Hereby, values below zero and above 10 were excluded to improve the registration. Third, the resulting mid-point average image was normalized to the MNI space using the DARTEL-based (Ashburner, 2007) Spatial Processing module (hMRI toolbox). Fourth, a combined deformation field was generated per subject and session, combining the deformation fields from steps 2 and 3.
Computation of MVFMR, AVFMR and gMR
In this section, our approach to estimating MVF and AVF from the measured MR parameters is introduced. The MR-based MVF (MVFMR) was assumed to be proportional to MTsat without intercept, following (Mohammadi and Callaghan, 2020):
The proportionality constant α was estimated from Equation (2) in a region where the histological MVF (MVFhist) was known. Due to the lack of own histological data, we used published histological data which contain the frequency distribution of inner-axon radius (r) and myelin sheath thickness (m) of 2,400 myelinated fibers in the medullary pyramids of a 71 years old human (see Table 1 in Graf von Keyserlingk and Schramm, 1984). The total volume (TV) of the sample is the sum of the total volume of myelinated axons (TAVm), unmyelinated axons (TAVu), myelin volume (TMV), and extra-cellular volume (TEV). TAVm was calculated as with i indexing the Nm myelinated axons only, and TMV was computed as . TAVu, while not reported in Graf von Keyserlingk and Schramm (1984), was found to be approximately 43% of TAVm for multiple mammals (Swadlow et al., 1980; LaMantia and Rakic, 1990; Olivares et al., 2001; Wang et al., 2008; Liewald et al., 2014). Note that the aforementioned papers typically reported the unmyelinated axons as 30% of the total volume of axons, which corresponds to 43% (= ) of TAVm. EVF was estimated to be 25%, according to Lehmenkühler et al. (1993), Nicholson and Hrabìtová (2017), Tønnesen et al. (2018). Finally, MVF was calculated as
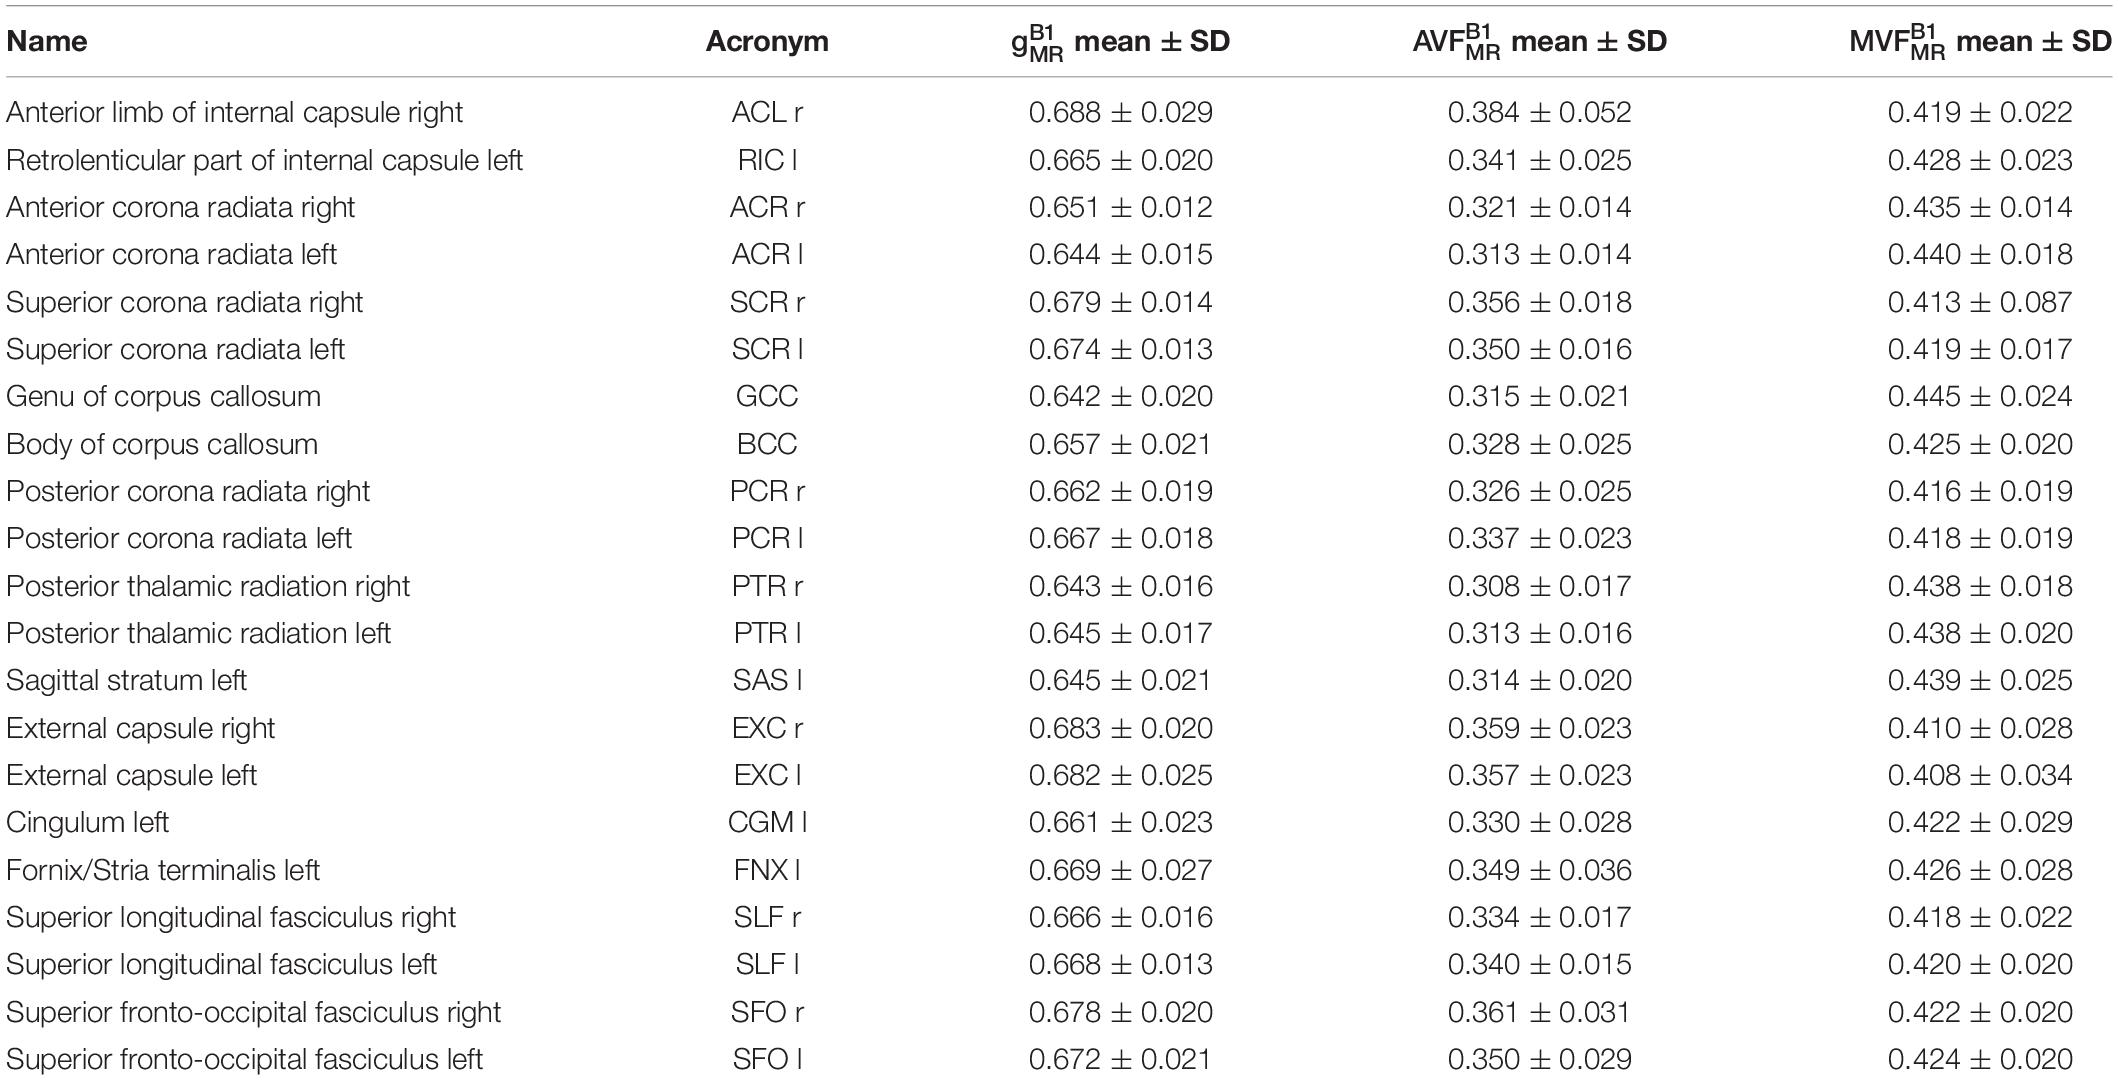
Table 1. Group-averaged mean and standard deviation (SD) of , , and in 21 high-SNR ROIs.
with j indexing all N fibers, yielding MVFhist ≈ 0.3623. Plugging this value into Equation (2) (assuming that MVFMR ≈ MVFhist) along with the group-average MTsat within the medullary pyramids (see Figure 2 for ROI definition) yielded an α of 0.2496 for , 0.2414 for , and 0.2884 for .
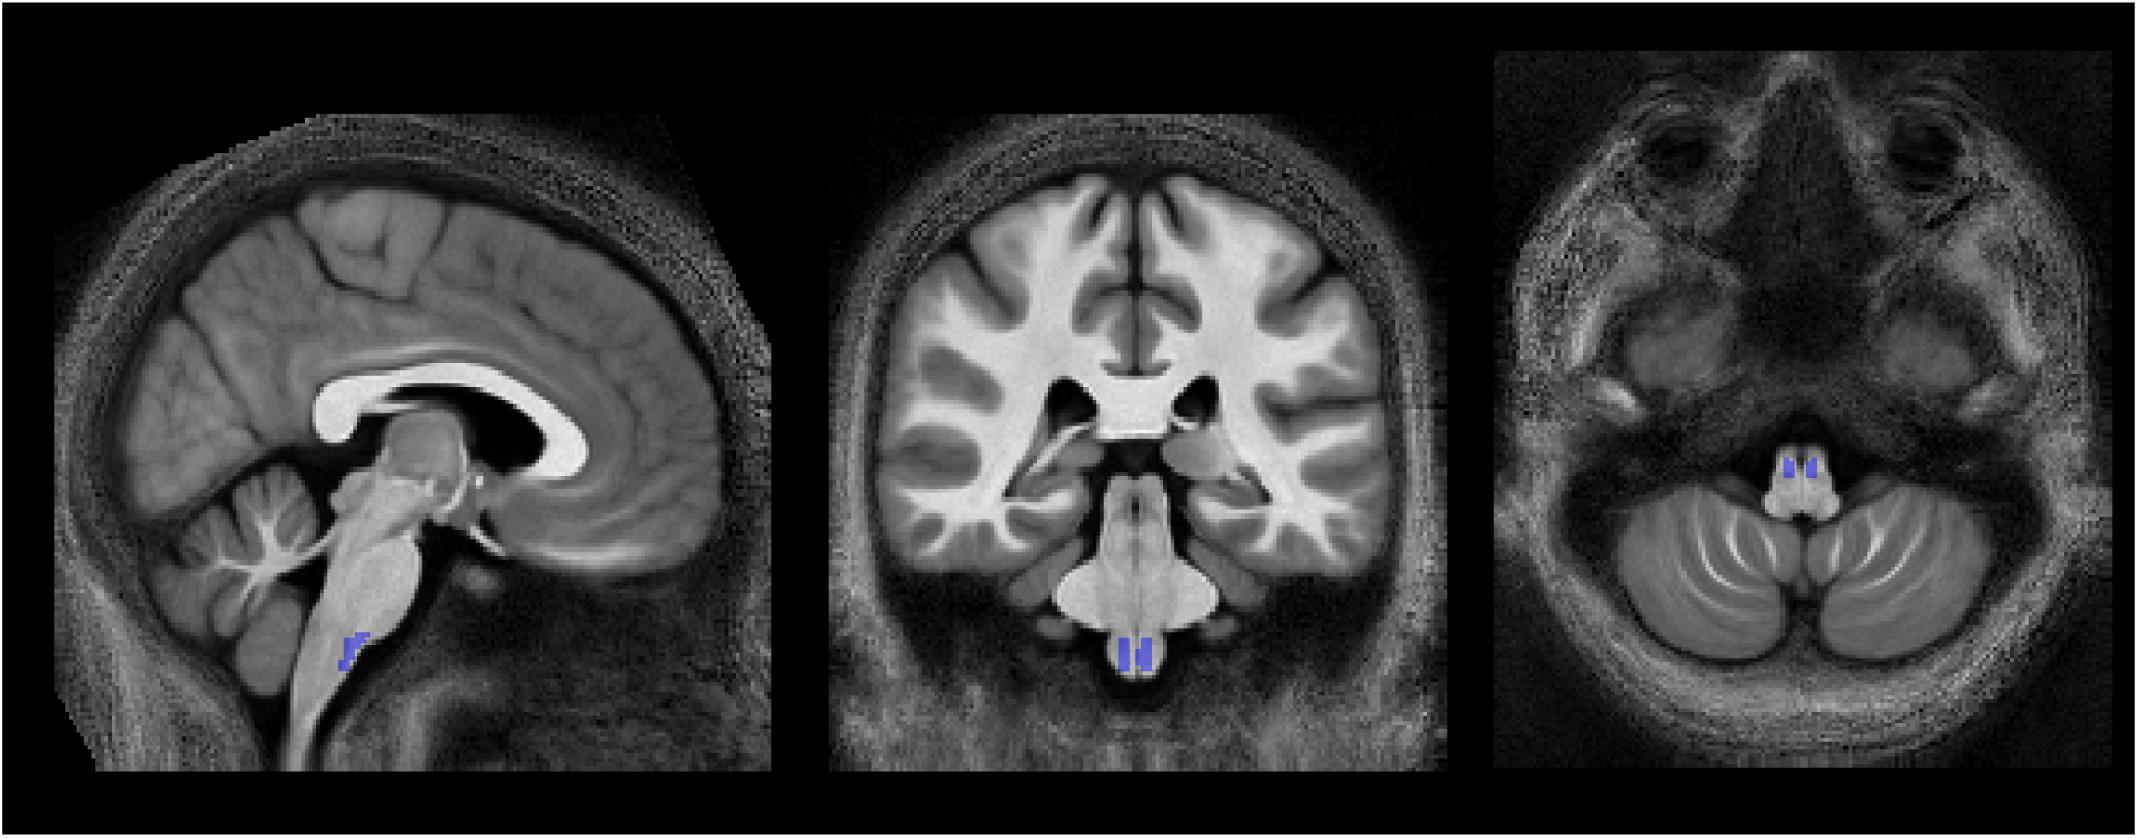
Figure 2. Location of the pyramidal tracts in the medulla oblongata ROI, overlaid on the group-averaged map, that was used to determine the calibration constant, converting MTsat into MVFMR (section “Computation of MVFMR, AVFMR, and gMR″). To create this ROI, the corticospinal tract ROI of the JHU-ICBM-DTI-81 atlas, which extends across the pons and medulla pyramids, was modified to cover only the medulla pyramids. Left-right position: X = 82; anterior-posterior position: Y = 77; superior-inferior position, Z = 30.
The MR-based AVF (AVFMR = (1−MVFMR)AWFMR) was calculated as
where AWF = (1−νiso)νicvf is the axonal water fraction estimated from the NODDI parameters (Stikov et al., 2015) and MVFMR = αMTsat. The MR g-ratio was then computed according to Stikov et al. (2011, 2015)
Note that three versions of MTsat, AVFMR, and gMR were generated according to notation in section “Data Processing”: (i) , , for no correction, (ii) , , and for B1+ reference measurement, and (iii) , , and for UNICORT B1+ correction.
Definition of White Matter Masks
As gMR and its constituents (MVFMR, AVFMR) are defined only in the WM, we restricted the analysis to the WM by creating binary WM masks (Mohammadi and Callaghan, 2020). WM tissue probability maps (WM-TPM) were created for each subject by segmenting AWF and using the hMRI toolbox, and taking their intersection according to Mohammadi and Callaghan (2020). In two subjects, the segmentation was of insufficient quality for segmentation and was replaced by the map. A group-specific binary WM mask (WMgroup) was generated by averaging all individual WM-TPMs in the MNI space and thresholding it at 0.95.
A so-called high-SNR WMgroup was also defined by taking the intersection of the WMgroup and a binary signal-to-noise ratio (SNR) map. Hereby, the latter was used to reduce the number of voxels with unrealistically high values of νicvf (νicvf≥0.999). In 6 of 25 subjects, an SNR map was created by dividing the mean b0 image by a single noise estimate in the native space and multiplied by the square root of the number of b0 images per DWI dataset (n = 12). The noise was estimated within a noise ROI outside the brain in 72 images (6 subjects, both timepoints and 6 b0 images each) using the ACID toolbox, with the values averaged to obtain a single noise estimate. The threshold for SNR maps to create binary SNR map was chosen such that it minimizes the ratio between the number of artifactual voxels where νicvf≥0.999 and the total number of voxels in the SNR mask (Figure 3B), yielding a value of 39. This was motivated by the observation that unrealistically high νicvf values typically occur in low-SNR areas (Figures 3Aii,iii). This threshold selection represents a trade-off between removing unrealistic voxels while retaining as many voxels as possible.
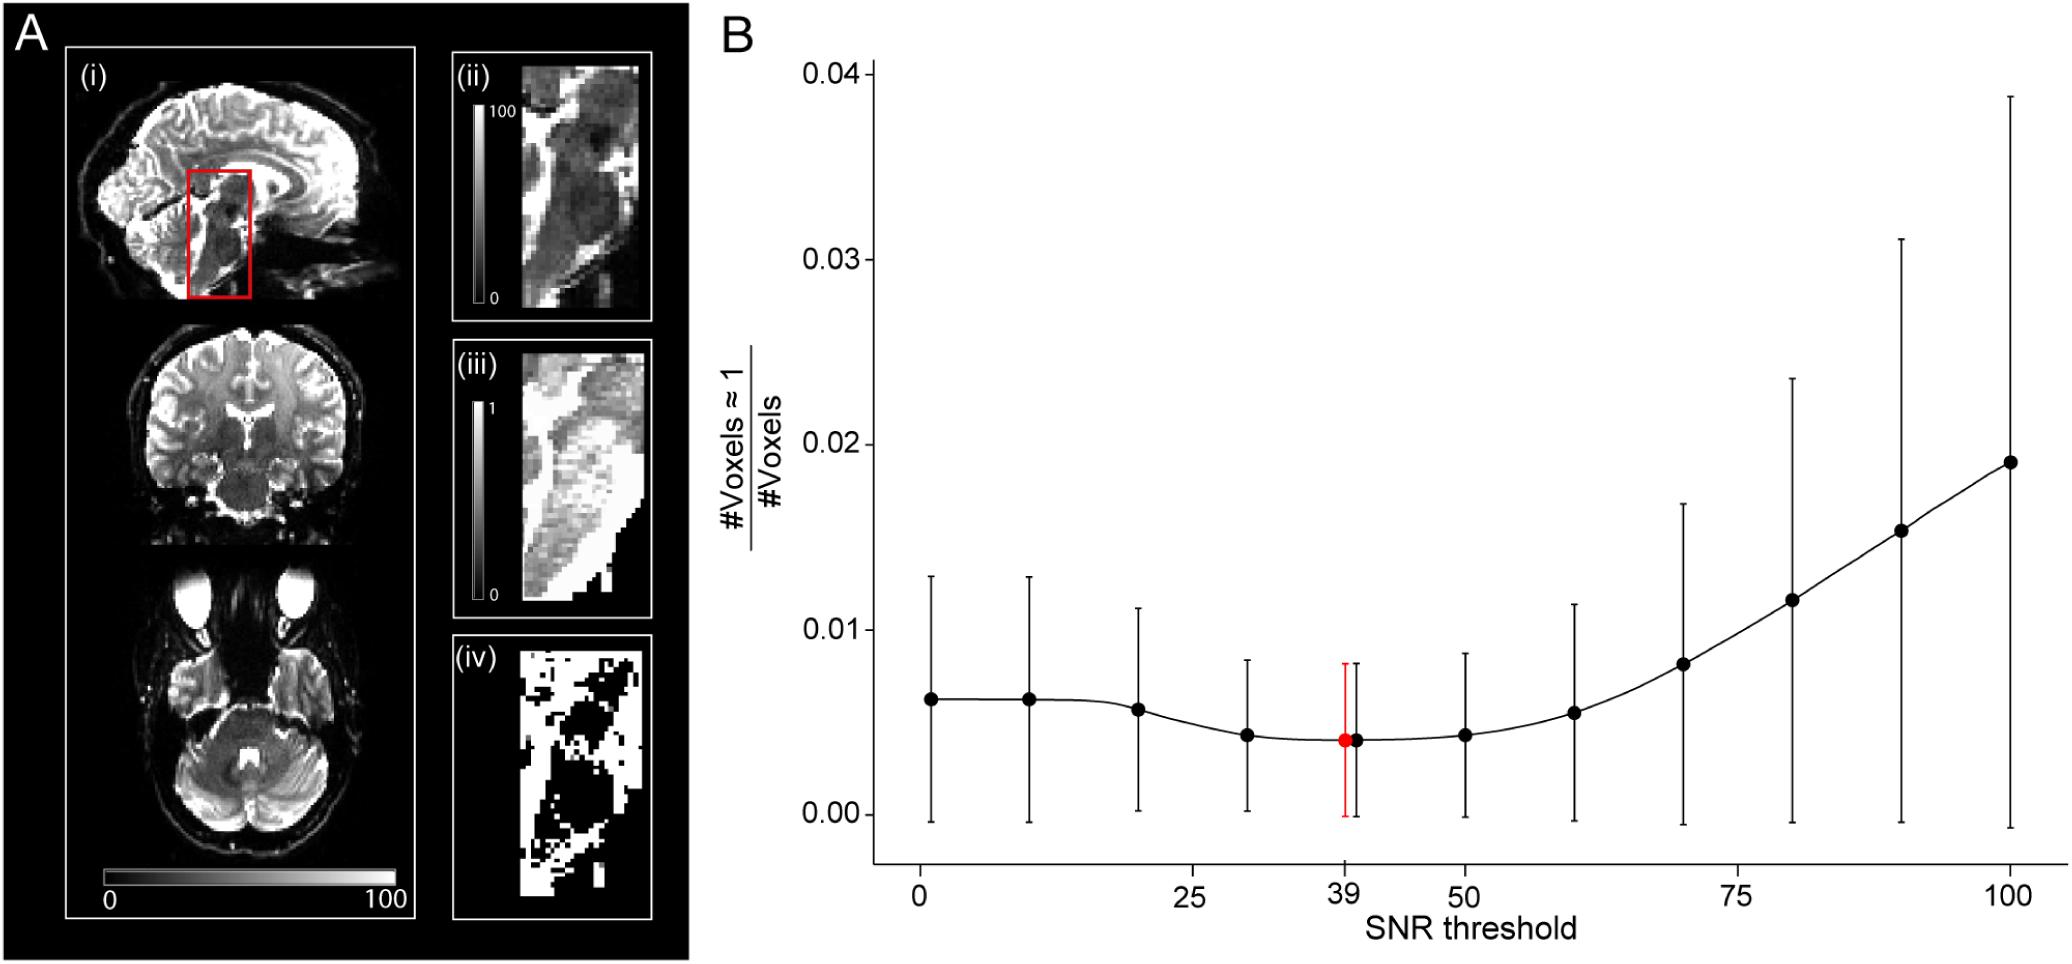
Figure 3. Relationship between signal-to-noise ratio (SNR) and unrealistically high νicvf values—here defined as νicvf ≥ 0.999. (A) Sagittal, coronal, and axial view of the whole-brain SNR map (i), with a zoom-in view of the brainstem (ii). The brainstem is characterized by low SNR due to the spatial characteristics of the receive coil array (ii) and high occurrence of unrealistically high νicvf (iii), also shown as a binary mask (iv). (B) Given the co-occurrence of low SNR and unrealistically high νicvf, a binary SNR mask was created to exclude low-SNR voxels. To determine the optimal threshold for the SNR mask, the ratio between the number of voxels with unrealistically high νicvf and the total number of voxels within the mask were plotted against the SNR threshold. The solid dots and error bars represent the group mean and group standard deviation of the ratio, respectively. The SNR value that yielded the minimum of this ratio was considered optimal (SNR = 39, shown in red).
Region of Interest Selection
For the region of interest (ROI) analysis, the JHU-ICBM-DTI-81 WM atlas (Hua et al., 2008) was transformed into the native space using the inverse of the combined deformation field. Two sets of ROIs were defined: (i) whole-WM ROIs and (ii) high-SNR ROIs, used for the main analysis. The whole-WM ROIs included those of the JHU-ICBM-DTI-81 WM atlas that were completely in WMgroup defined in 2.6, yielding 43 ROIs (out of 48, leaving out the column and body of the fornix, the left and right cingulum part in the vicinity to the hippocampus, and the left and right uncinate fasciculus). The high-SNR ROIs included only those whole-WM ROIs that overlapped with the high-SNR WMgroup to at least 95%, yielding 21 ROIs (Figure 4 and Table 2). For the analyses, group-averaged gMR, AVFMR, and MVFMR were calculated within the WMgroup. Note that averaging included both sessions of each subject for all analyses except for the analysis in section “Test-Retest Analysis of the Group-Averaged MR G-ratio, Axon, and Myelin Volume Fraction.”
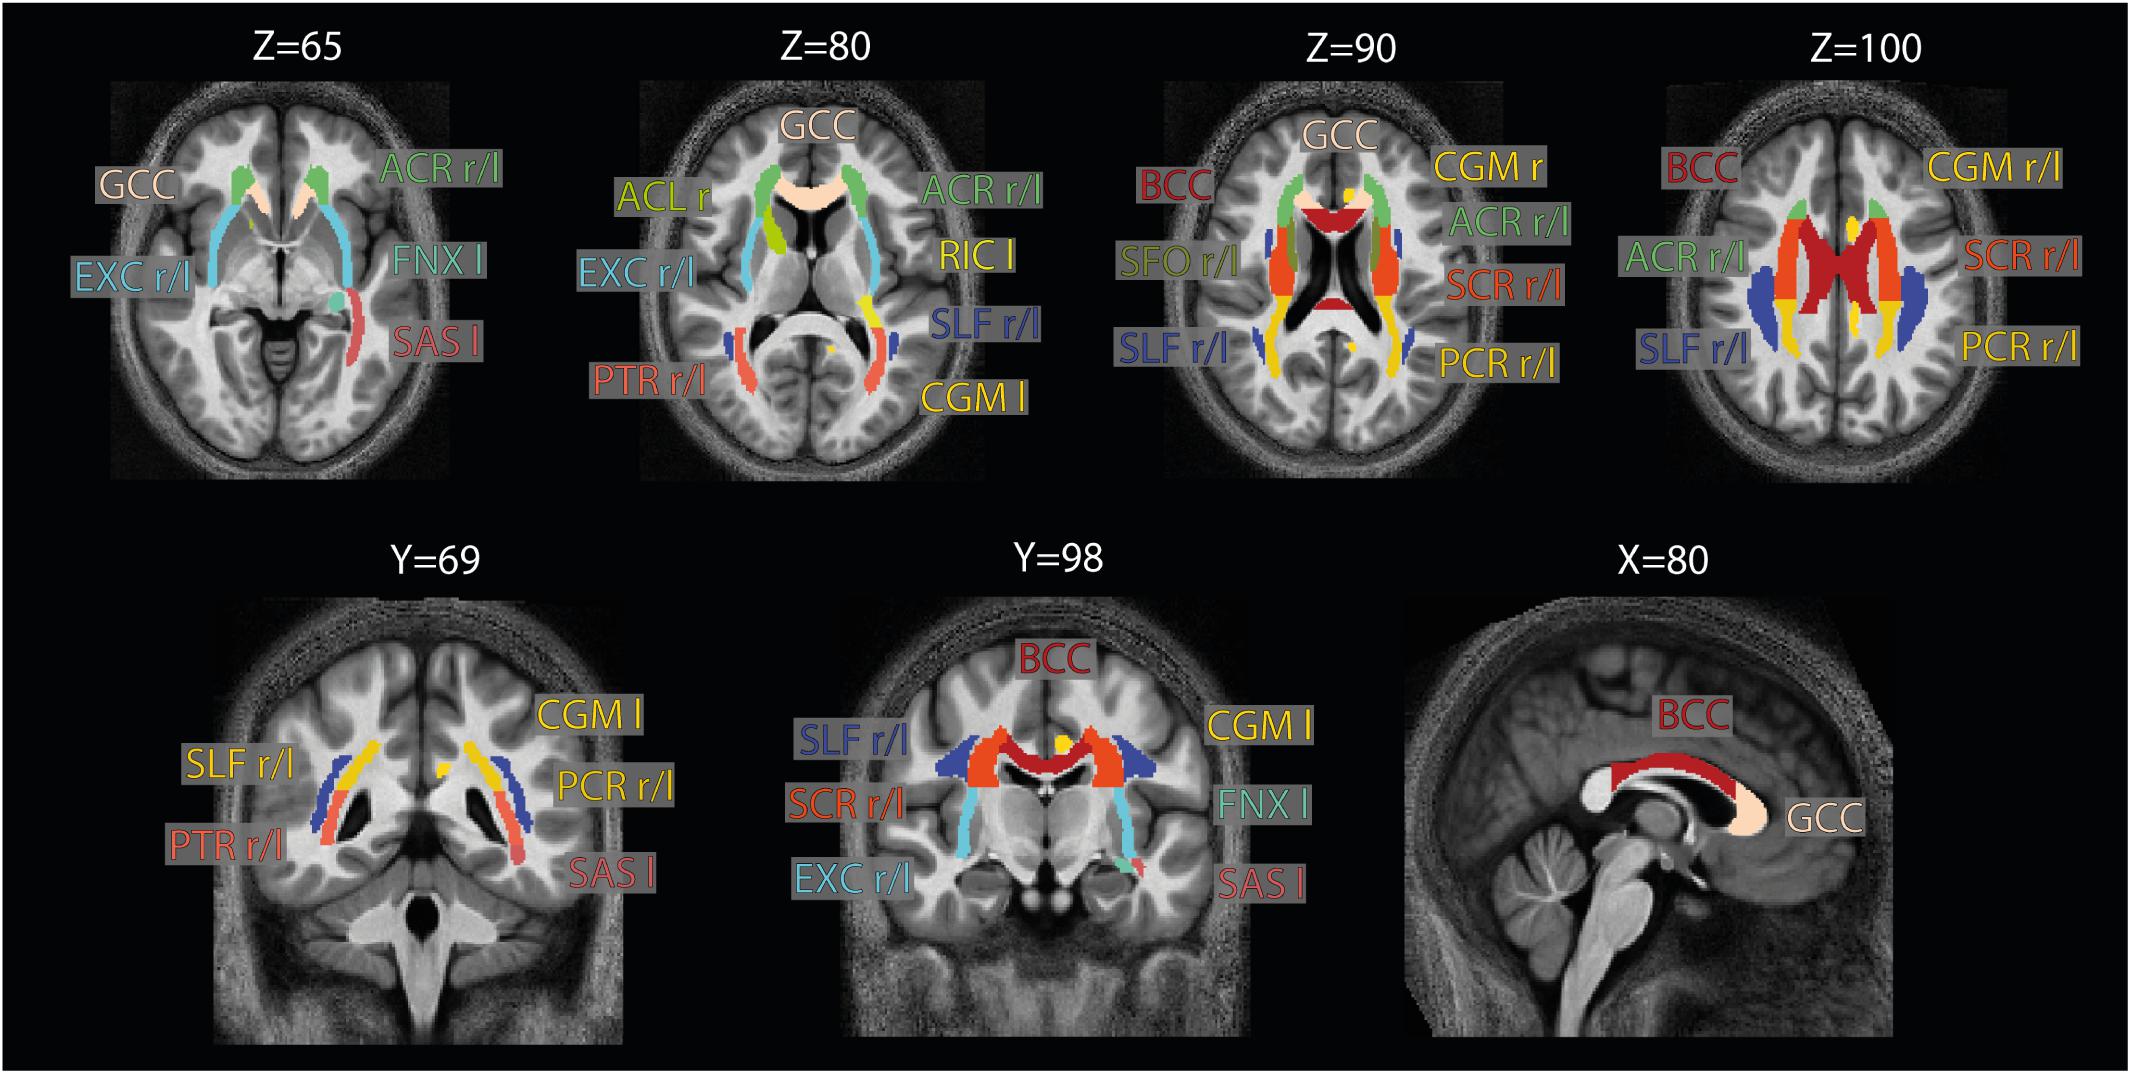
Figure 4. Location of the ROIs used for analysis. The 21 high-SNR ROIs (listed in Table 1) are part of the JHU-ICBM-DTI-81 WM atlas (Hua et al., 2008) and are displayed here on the group-averaged normalized image. Note that for ROI analysis, the ROIs were projected into the native space using the inverse of the combined deformation field.
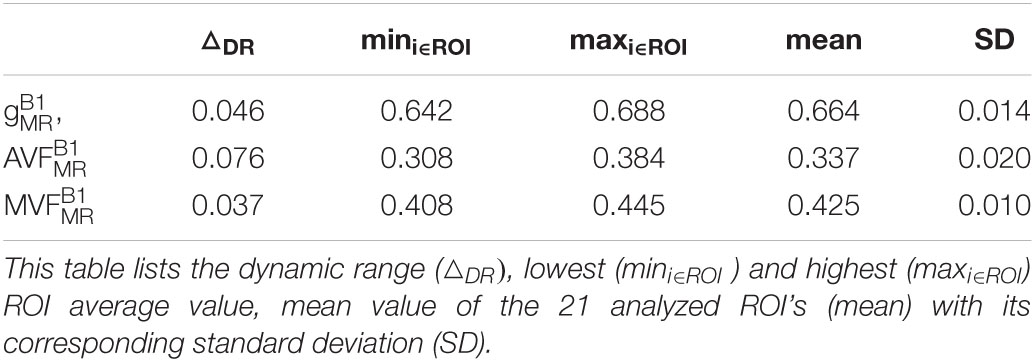
Table 2. Summary statistics of , , and .
Test-Retest Analysis of the Group-Averaged MR G-ratio, Axon, and Myelin Volume Fraction
The group-averaged of the first and second session were compared within the previously mentioned 21 high-SNR ROIs using Bland-Altman plots (Bland and Altman, 1986). In the Bland-Altmann plots, the differences in between the first () and second () session () were plotted against their means (), where i is the index of ROI i. Bias captures the offset (), while error () captures the variation between the first and second scan within the ith ROI. The computed and ϵretest were normalized by the dynamic range (△DR) of within the high-SNR ROIs, defined as , yielding the relative error () and relative bias (). The same procedure was also applied to and .
The distinction between bias and error is important, because while a potential bias can be retrospectively corrected, the error in the MR g-ratio method defines its sensitivity to detect differences between individuals, groups, or time points. To reliably capture these differences, the error must be significantly lower than the expected effect size.
Influence of B1+ Correction in the Group-Averaged MR G-ratio, Axon, and Myelin Volume Fraction
Bland-Altman analysis was used to compare gMR with and without B1+ correction. In particular, the difference in gMR between , when using the reference method B1+ correction, and , when using no (k = NO) or UNICORT (k = UN) B1+ correction: was plotted against their mean: , with i being the index of the 21 high-SNR ROIs. The bias and error associated with the lack of (or UNICORT) B1+ correction are defined as and , respectively.
The computed ϵB1 and were normalized by the dynamic range of within the high-SNR ROIs, yielding the relative error () and relative bias (). The same procedure was also applied to AVFMR and MVFMR, comparing them to their respective reference method and dynamic range. For MVFMR, the Bland-Altman analysis was additionally done using the whole-WM ROIs instead of the high-SNR ROIs (see section “Region of Interest Selection”) to assess the influence of including low-SNR voxels in the analysis.
Group Variability in MR G-ratio, Axon, and Myelin Volume Fraction
To assess group variability for each correction method, the coefficient-of-variation (CoV) across subjects and sessions was calculated for MVFMR, AVFMR, and gMR in the MNI space after applying tissue-weighted smoothing (Tabelow et al., 2019), yielding: , , and , where MR ∈ {gMR,AVFMR,andMVFMR}. For tissue-weighted smoothing, a full width at half maximum Gaussian smoothing kernel of 6 mm was used. Bland-Altman analysis (see section “Test-Retest Analysis of the Group-Averaged MR G-ratio, Axon, and Myelin Volume Fraction”) was used to compare and against based on the reference method, yielding bias () and error (ϵCoV) values. A higher variability across the brain is expected to increase whereas a higher local variability is expected to increase ϵ CoV.
Results
G-ratio, Myelin, and Axonal Volume Fraction Across the White Matter
Voxel-wise maps of group-averaged , , and in WM are shown in Figure 5. The group-averaged mean and standard deviation of , , and in 21 high-SNR ROIs are reported in Table 1 and Figure 6. The dynamic range (△DR), minimum and maximum values, and mean and standard deviation of , , and across ROIs are listed in Table 2. The largest and were found in the right anterior limb of the internal capsule (0.688 and 0.384, respectively), while the largest was in the genu of corpus callosum (0.445), where also the lowest (0.642) can be found. The lowest , and were found in the right posterior thalamic radiation ( = 0.308) and in the left external capsule ( = 0.408), respectively. The △DR was the smallest for (0.037), followed by (0.046) and (0.076).
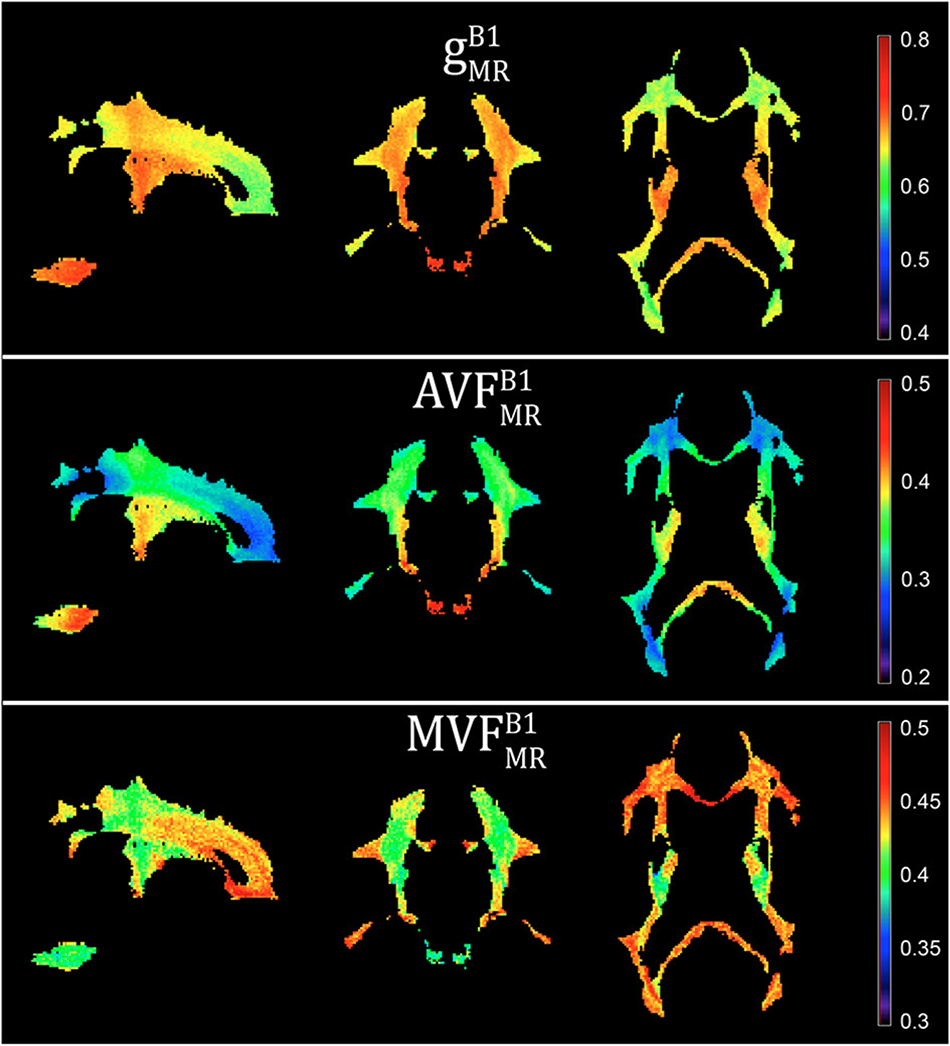
Figure 5. Voxel-wise maps of group-averaged gB1MR, AVFB1MR, and MVFB1MR, restricted to the group WM mask (cf. section “Definition of White Matter Masks”). Depicted are a single sagittal (x = 100), coronal (y = 91), and axial (z = 85) slice.
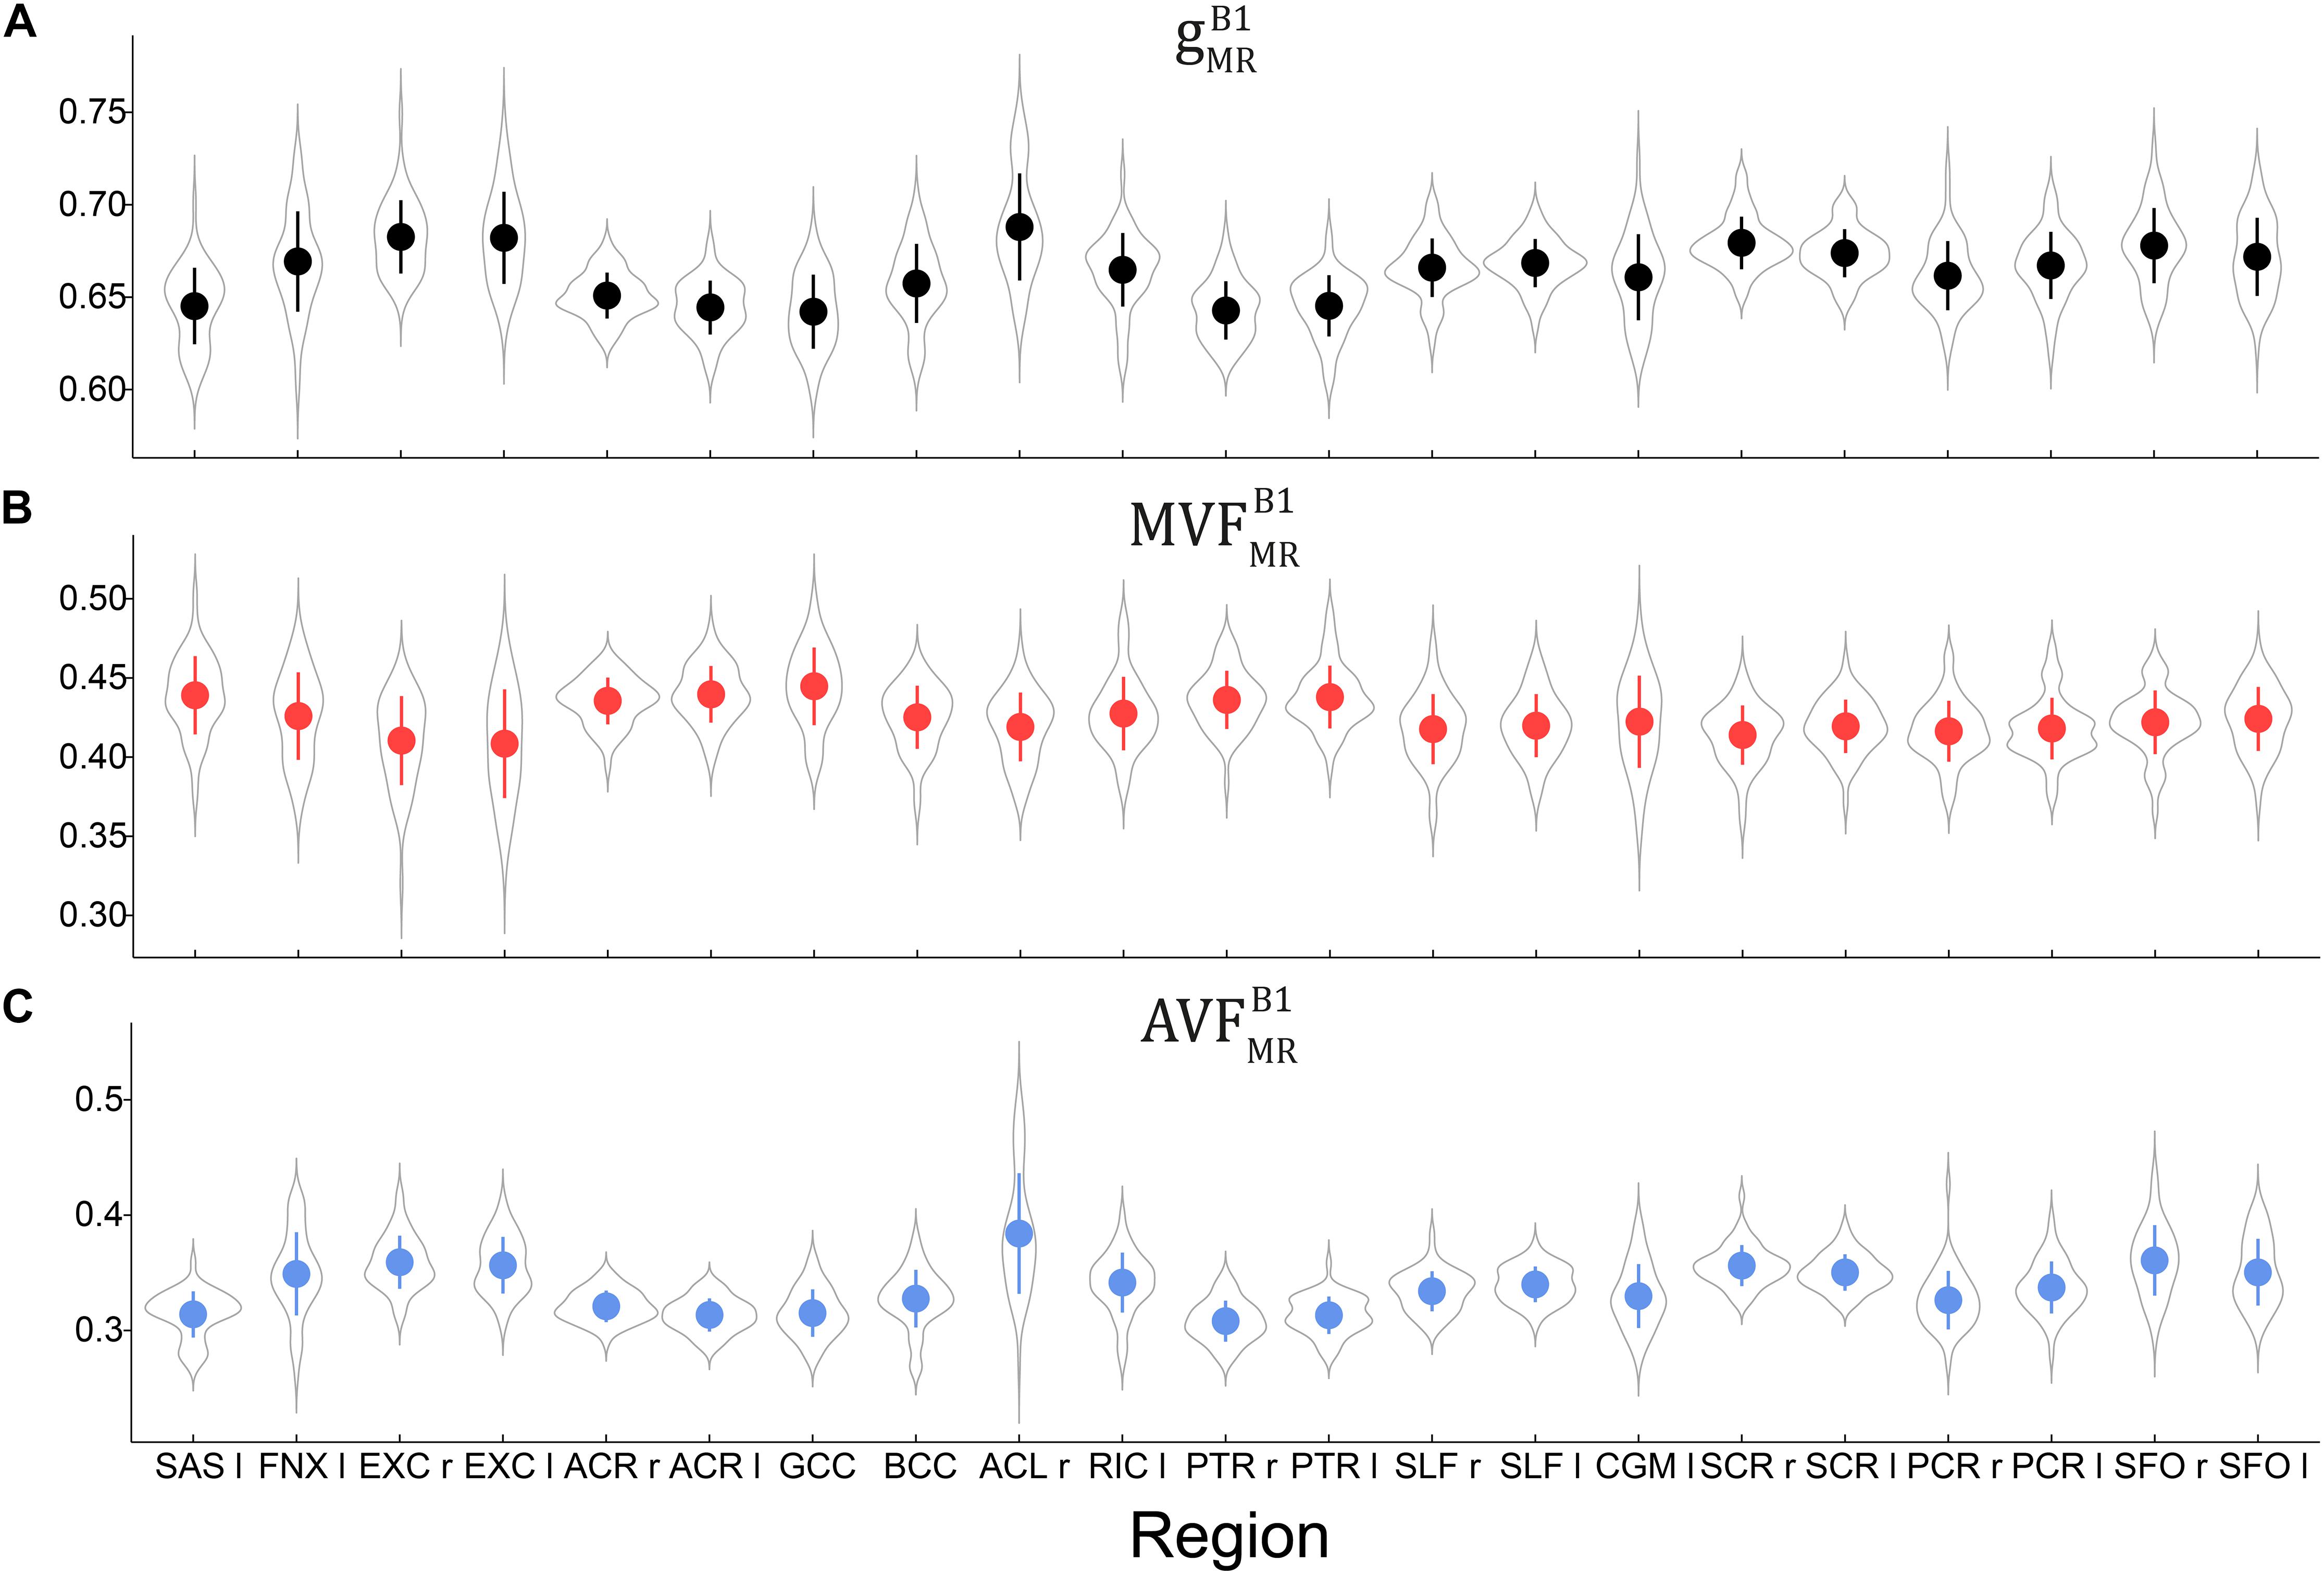
Figure 6. Violin plots representing the distribution of (A), (B), and (C) across the group and in 21 high-SNR ROIs listed in Table 1. The mean and standard deviation of the distribution are indicated by solid dot and whiskers, respectively.
Test-Retest Analysis of the Group-Averaged MR G-ratio, Axon, and Myelin Volume Fraction
The relative error () and bias () values of the test-retest analysis are summarized in Table 3 and shown as Bland-Altmann plots in Figure 7. The test-retest analysis revealed a below an absolute value of 8.4% for each metric (, , and ), where the showed the lowest with 0.79% (Figure 7 and Table 3). The was below 22.2% for each metric, where the showed the lowest with 20.5% (Figure 7 and Table 3).
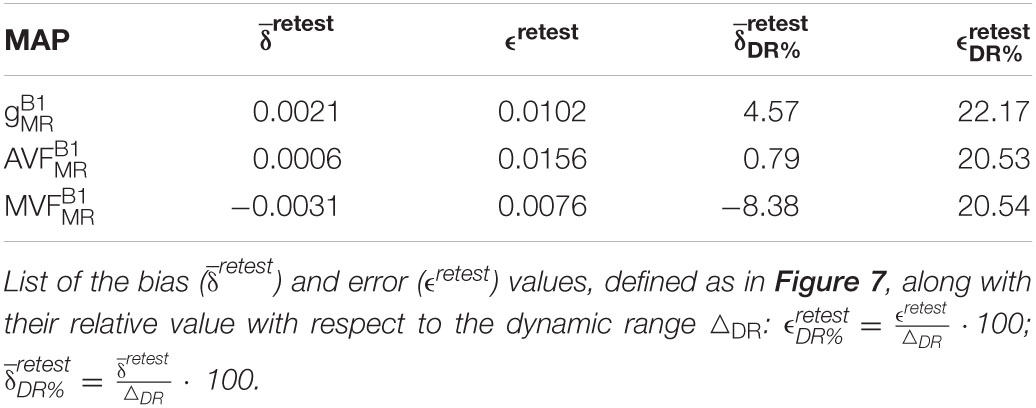
Table 3. Bias and error between scans, in , , and .
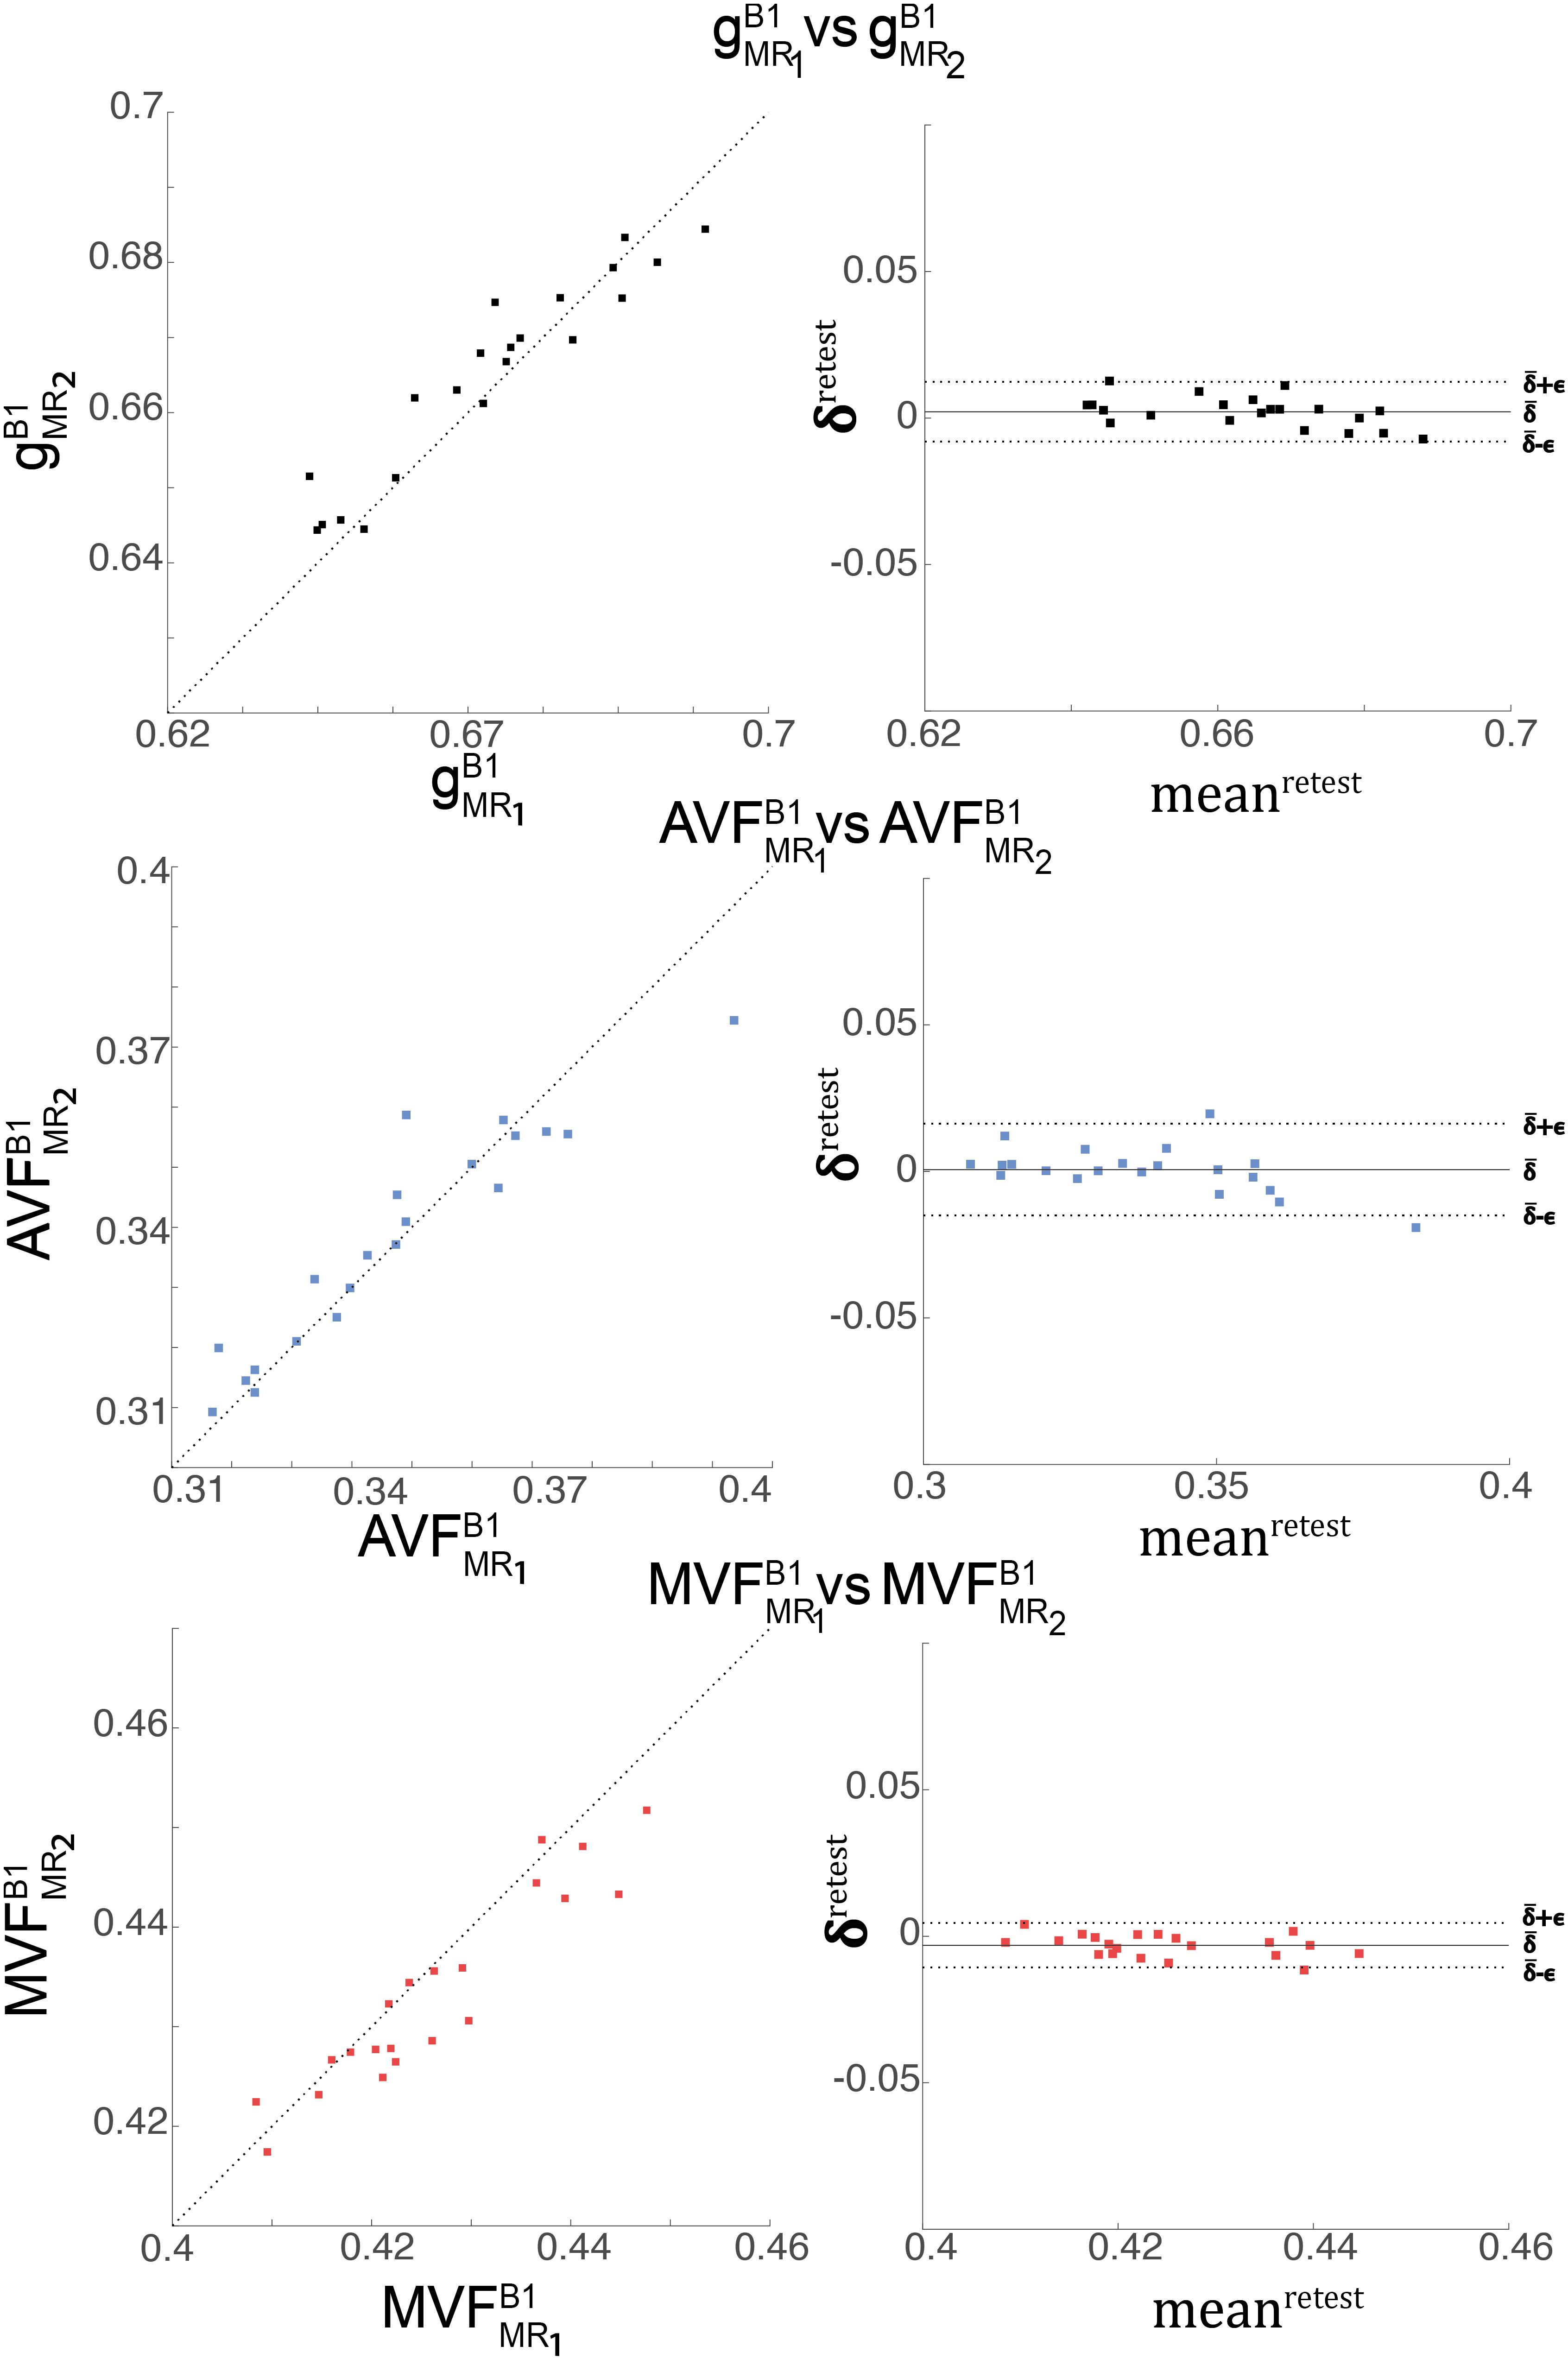
Figure 7. Depicted are scatter and Bland-Altman plots of (first row), (second row), and (third row) from two session across 21 WM regions (denoted high-SNR ROIs, see Figure 4). The Bland-Altman plot illustrates the differences between values obtained from the two sessions (e.g., vs. ; ) against their mean (e.g., , with i indexing the ith ROI). Each point in the scatter plot represents the group-averaged value in a single ROI. The bold black line represents the bias (), while the dashed line shows error () between the two sessions.
Influence of B1+ Correction on the Group-Averaged MR G-ratio, Axon, and Myelin Volume Fraction
The relative error () and bias () values of the B1+ correction analysis are summarized in Table 4 and shown as Bland-Altmann plots in Figures 8, 9. For gMR, compared to the no-correction case, UNICORT showed both lower (UNICORT vs. no correction: 10.9% vs. 37.0%) and (30.4% vs. −89.1%). For both AVFMR and MVFMR, UNICORT yielded lower (UNICORT vs. no correction; AVFMR: 5.3% vs. 15.8%; 16.2% vs. 59.5%) and lower (AVFMR: 14.5% vs. −40.8%; MVFMR: 48.6% vs. 143.2%). Altogether, the UNICORT correction reduced the bias and error in the MR g-ratio and its constituents by roughly a factor of three. The lower and associated with UNICORT was also reflected by the fact that values of , , and (Figure 8, lower panel) lie closer to the unit slope line than values of , , and (Figure 8, upper panel). When computing and of gMR in the whole-WM ROIs (see Supplementary Figure 1), was consistently lower for both the no-correction case (whole-WM ROIs vs. high-SNR ROIs: 36.5% vs. 143.2%) and UNICORT (13.1% vs. 48.6%), whereas was similar (no-correction: 52.8% vs. 59.5%; UNICORT: 24.0% vs. 16.2%).
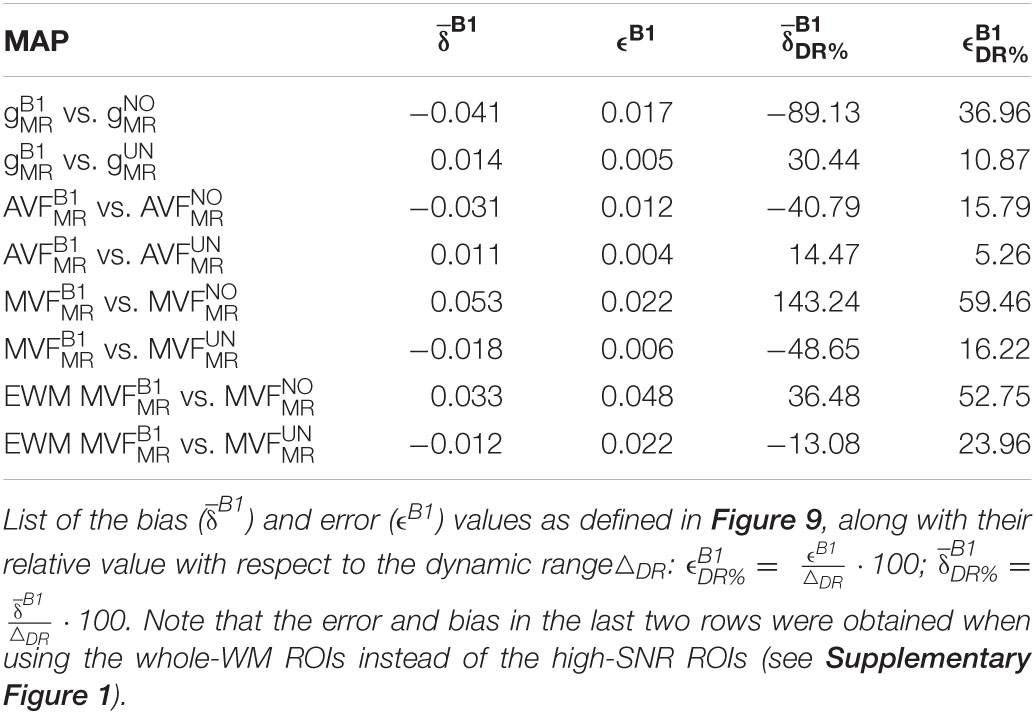
Table 4. Bias and error between methods, in gMR, AVFMR, and MVFMR.
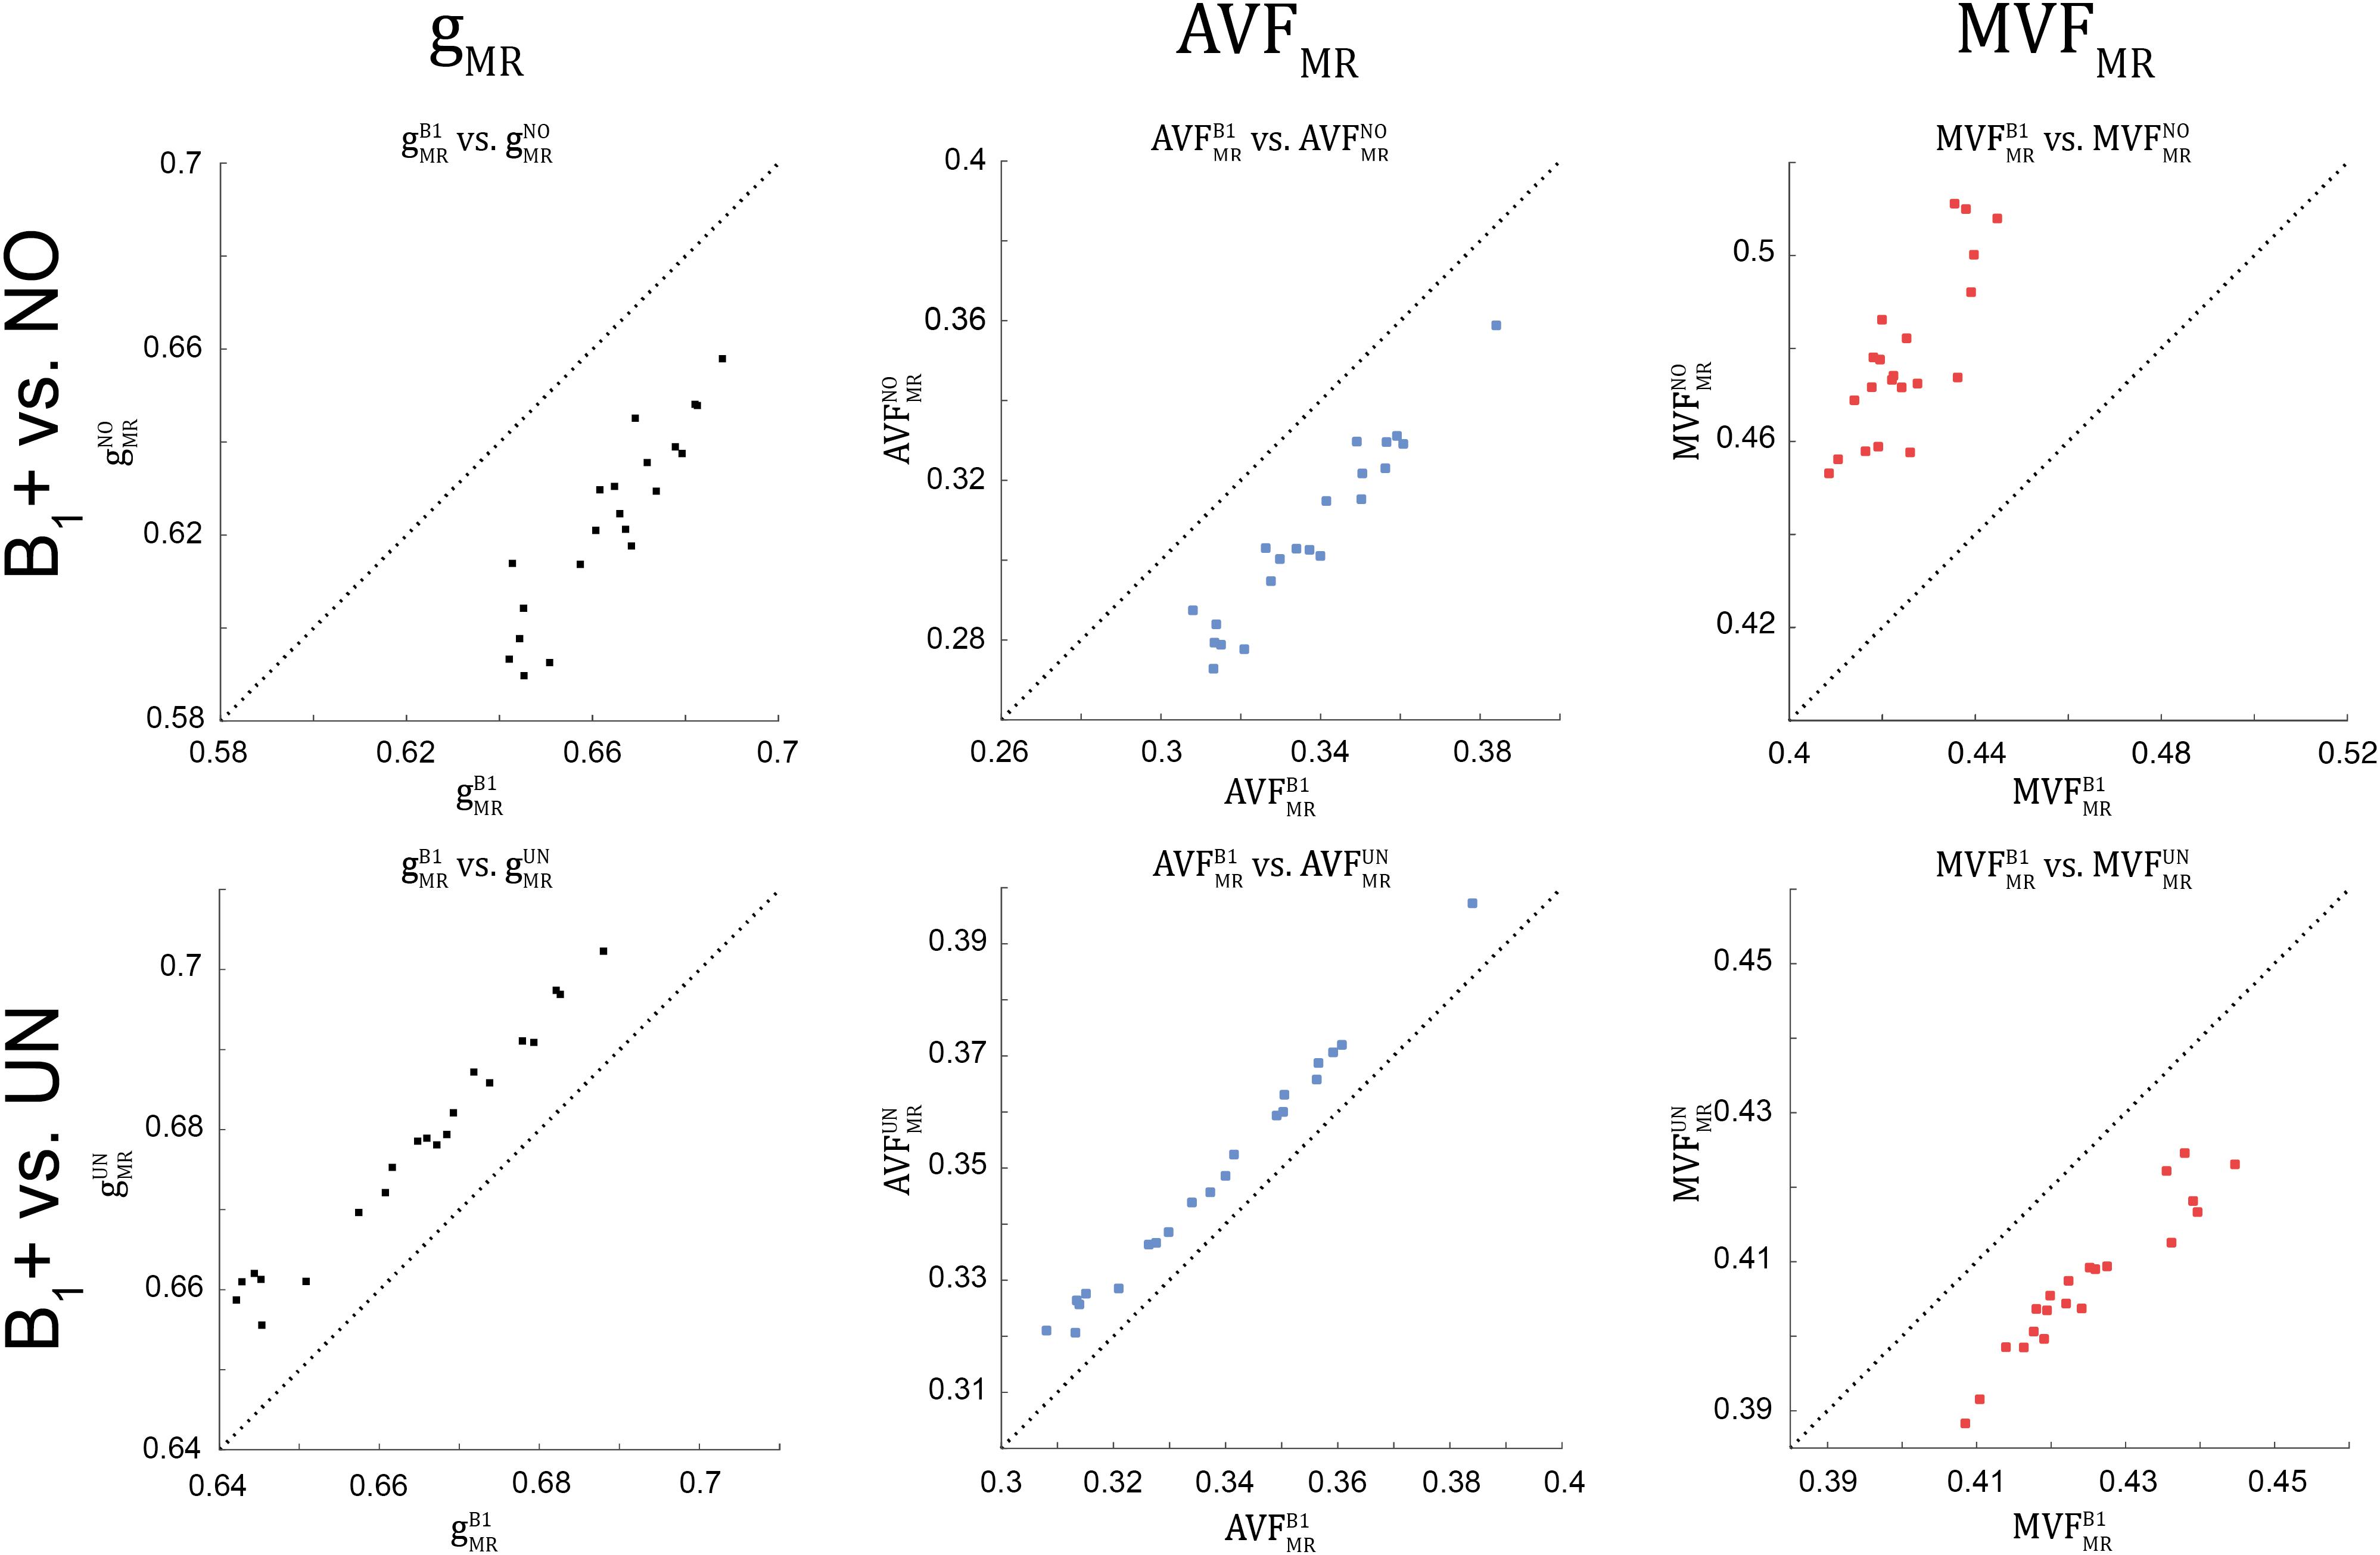
Figure 8. Scatter plots of gMR, AVFMR, and MVFMR, plotting values obtained without B1+ correction (superscript: NO, top row) and with UNICORT B1+ correction (superscript: UN, bottom row) against values obtained with the reference method, i.e., B1+ field map correction (superscript: B1). A dashed unit slope line is plotted for reference. Each point in the scatter plot represents the group-averaged value in a single ROI (see Figure 4 for the locations of the 21 high-SNR ROIs).
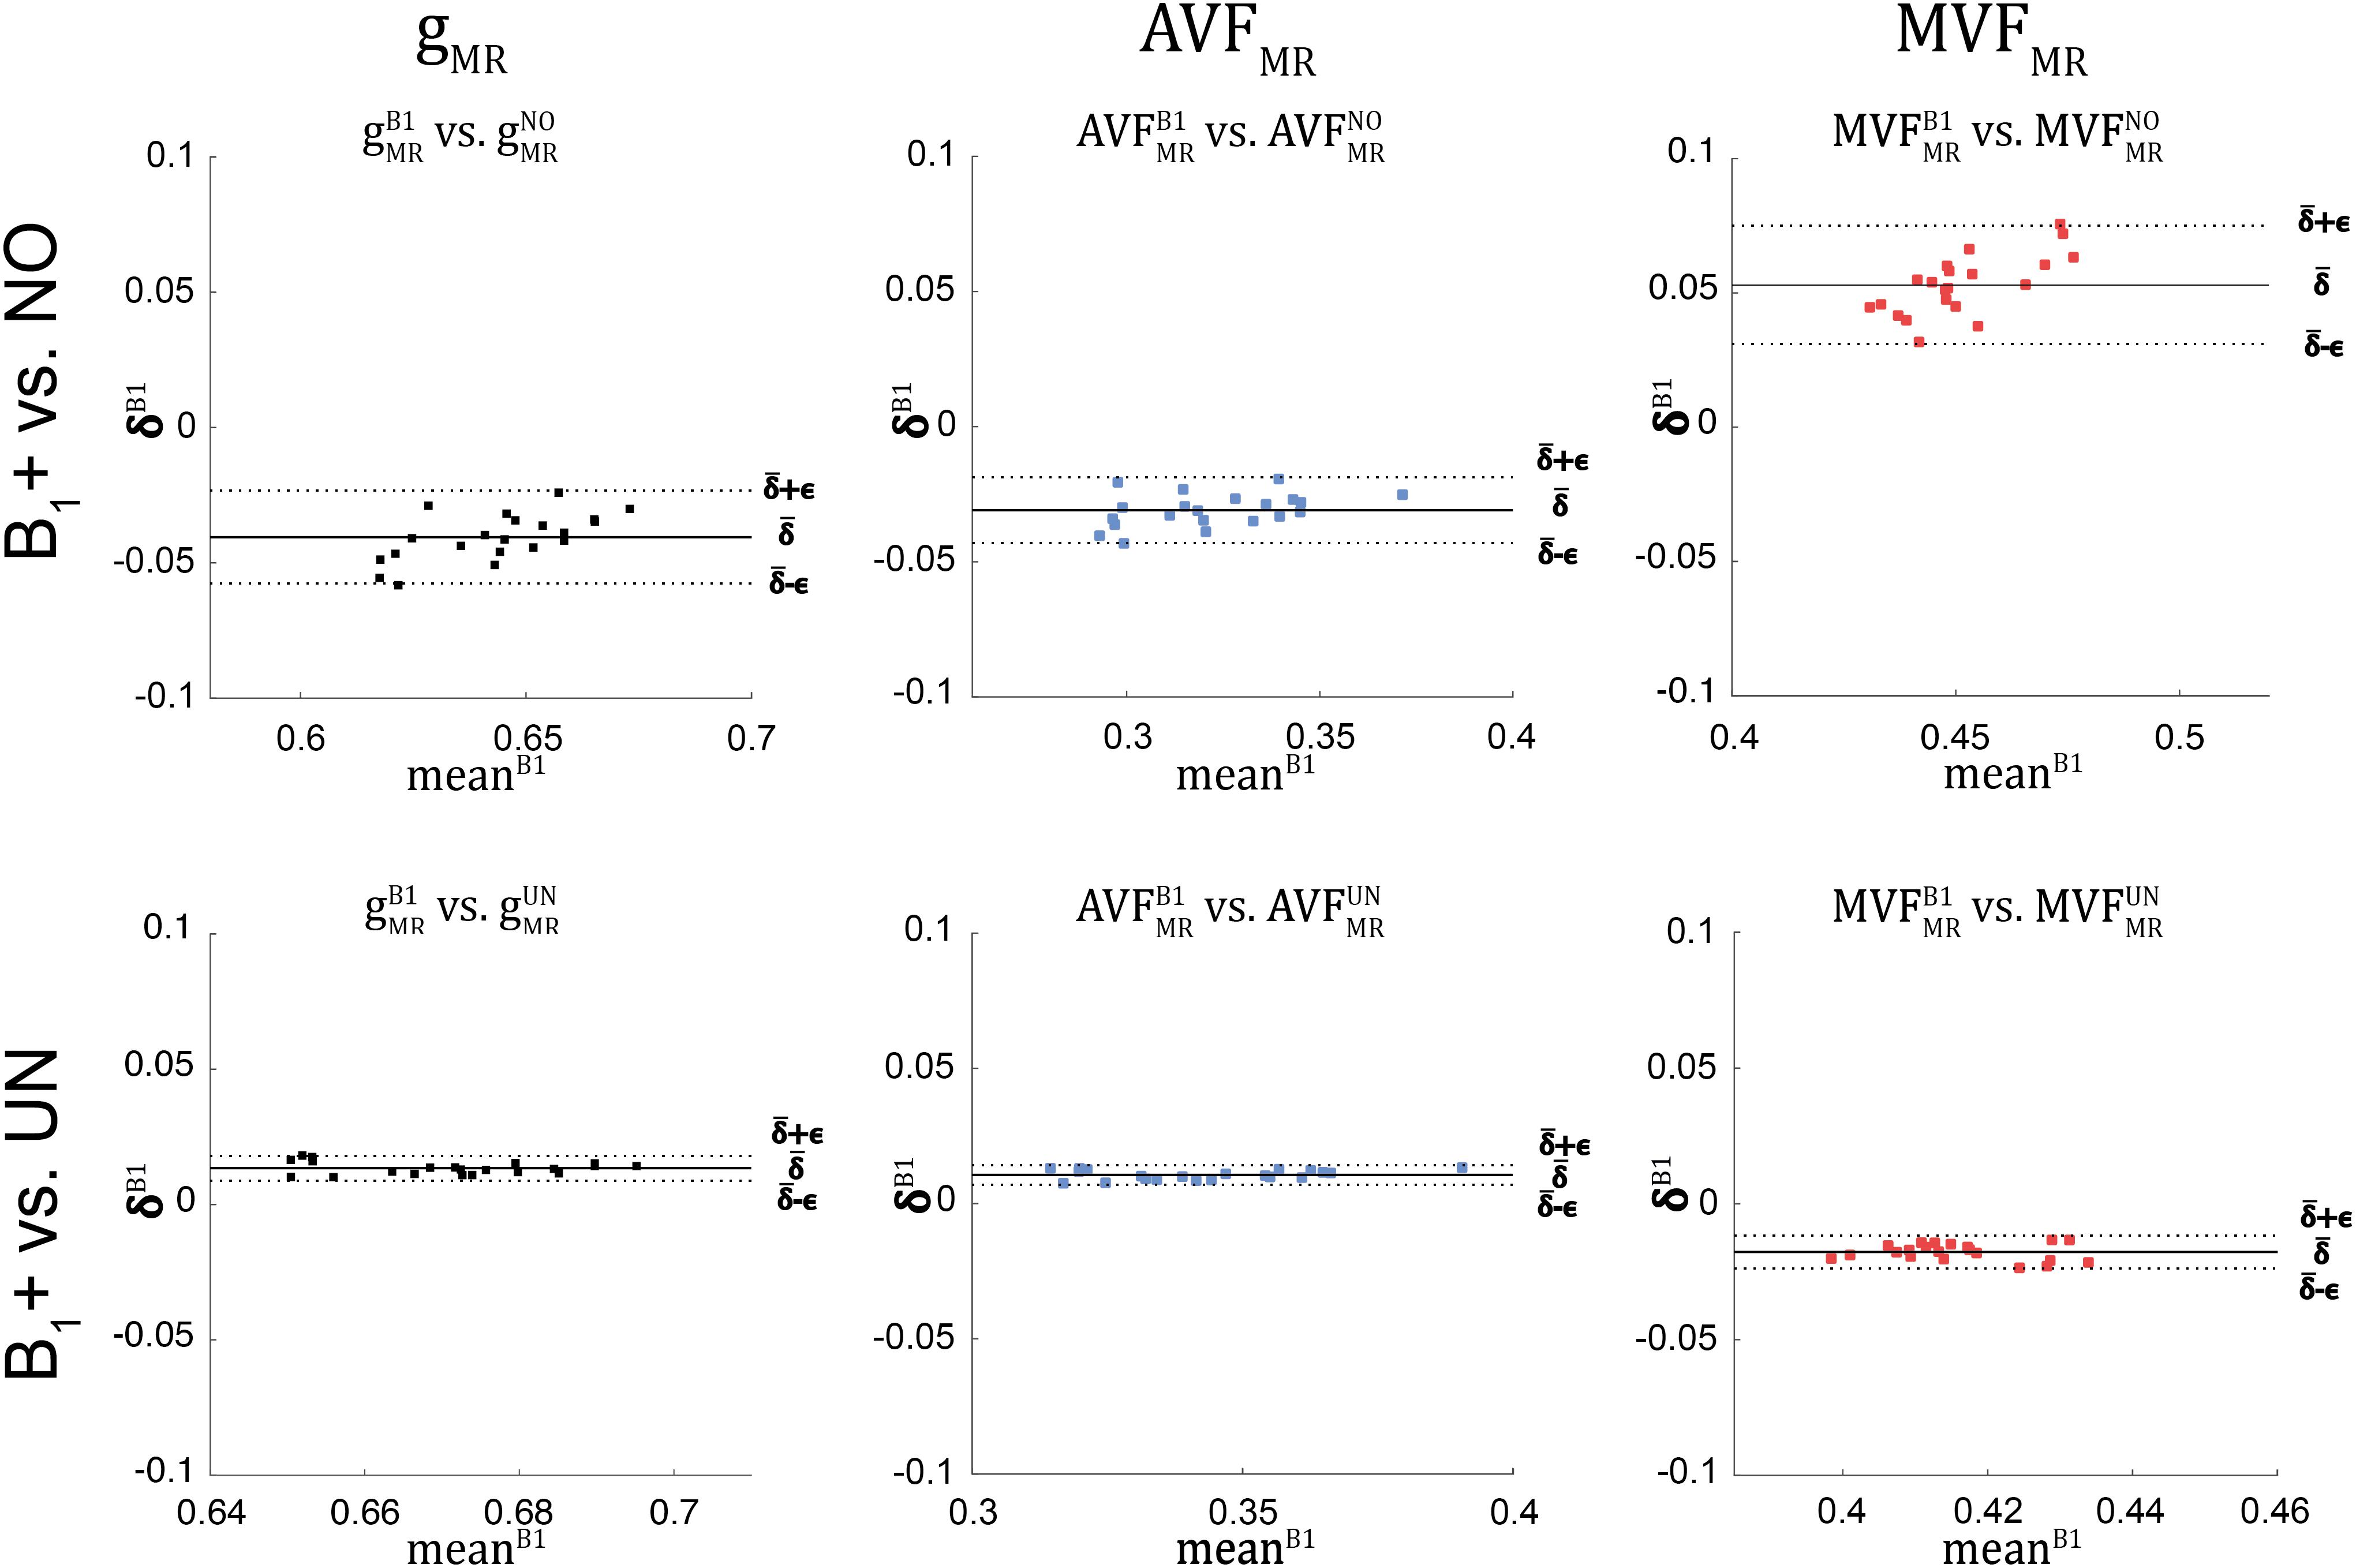
Figure 9. Bland-Altman plots of gMR, AVFMR, and MVFMR, comparing values obtained without B1+ correction (NO, top row) and with UNICORT B1+ correction (UN, bottom row) against values obtained by B1+ field map correction (superscript: B1). The Bland-Altman plot illustrates the differences between values obtained by two different methods (reference vs. tested method); e.g., against their mean (, with k = {UN, NO} and i indexing the ith ROI). Each point in the scatter plot represents the group-averaged value in a single ROI (see Figure 4 for the locations of the 21 high-SNR ROIs). The bold black line represents the bias (), while the dashed line shows error () between the reference and the tested method. Error and bias values averaged across all ROIs and subjects are listed in Table 5.
Group Variability in MR G-ratio, Axon, and Myelin Volume Fraction
gMR showed on average smaller CoV than AVFMR and MVFMR (Figure 10). In all maps, the CoV was the highest in the deep brain areas. The relative error () and bias () values of CoV with respect to the B1+ reference measurement are summarized in Table 5 and the error and bias are also displayed as Bland-Altman density plot in Figure 11. For gMR, compared to the no correction case, UNICORT showed similar ϵCoV (UNICORT vs. no correction: 0.6% vs. 0.6%) but lower (−0.1% vs. −0.4%). UNICORT yielded higher ϵCoV (UNICORT vs. no correction; 1.0% vs. 0.8%) and lower (−0.2% vs. −0.4%) for AVFMR, and higher ϵCoV (1.2% vs. 0.4%) and higher (−0.5% vs. −0.1%) for MVFMR. The lower of gMR and AVFMR associated with UNICORT reveals itself as a slight shift of the points toward the unit slope line in the scatter density plot (Figure 12).
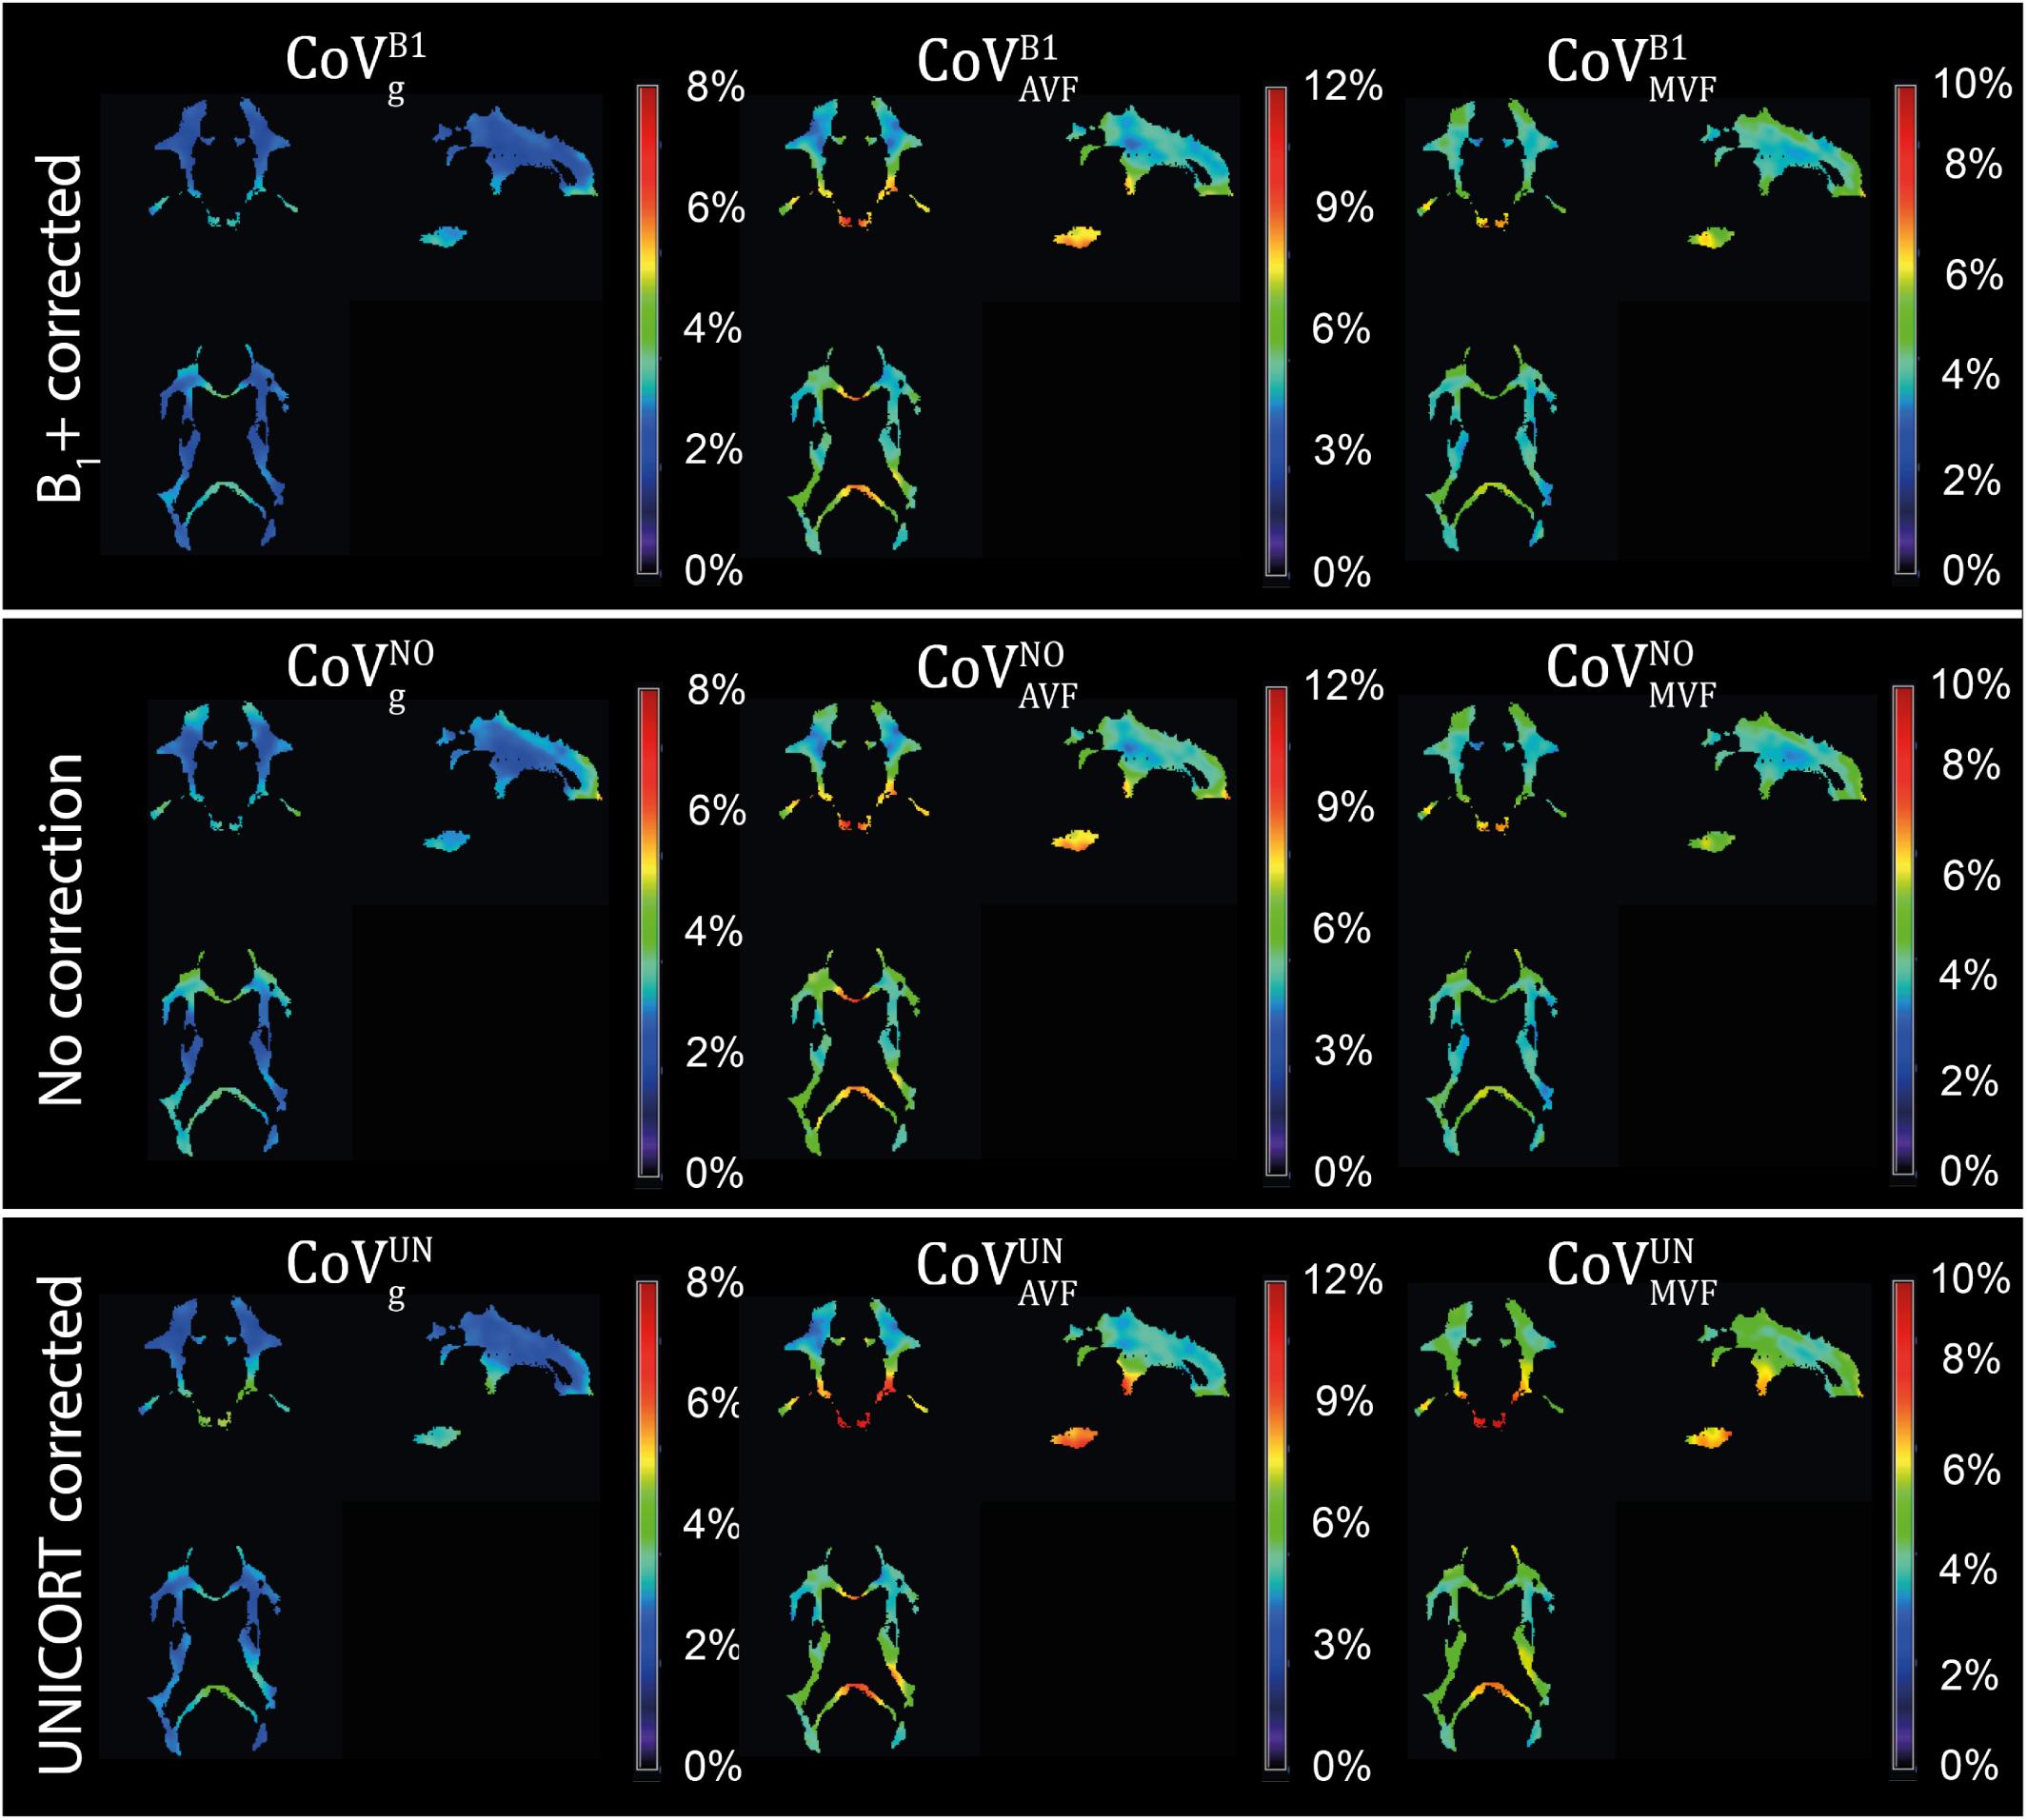
Figure 10. Coefficient of variation (CoV) maps of gMR, AVFMR, and MVFMR with B1+ correction (, , and ), no correction (, , and ), and UNICORT B1+ correction (, , and ). CoV maps, expressed in percentage, were computed as the voxel-wise ratio between the group mean and group standard deviation maps of the normalized gMR, AVFMR, or MVFMR. The voxel-wise computation of CoV is restricted to the group WM mask (cf. section “Definition of White Matter Masks”). Shown are a single coronal (y = 91), sagittal (x = 100), and axial (z = 85) slice.
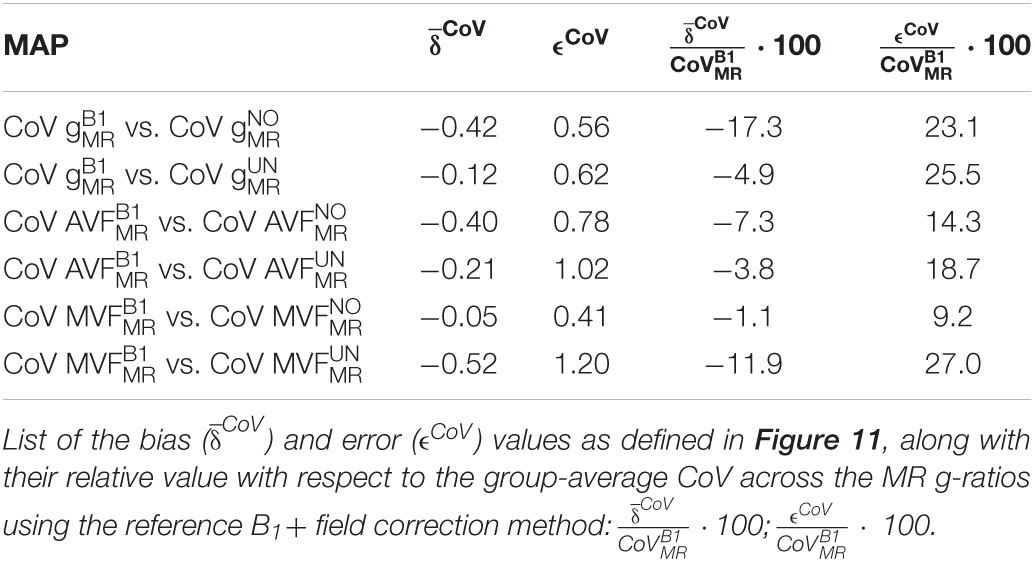
Table 5. Bias and error between methods, in the CoV of gMR, AVFMR, and MVFMR.
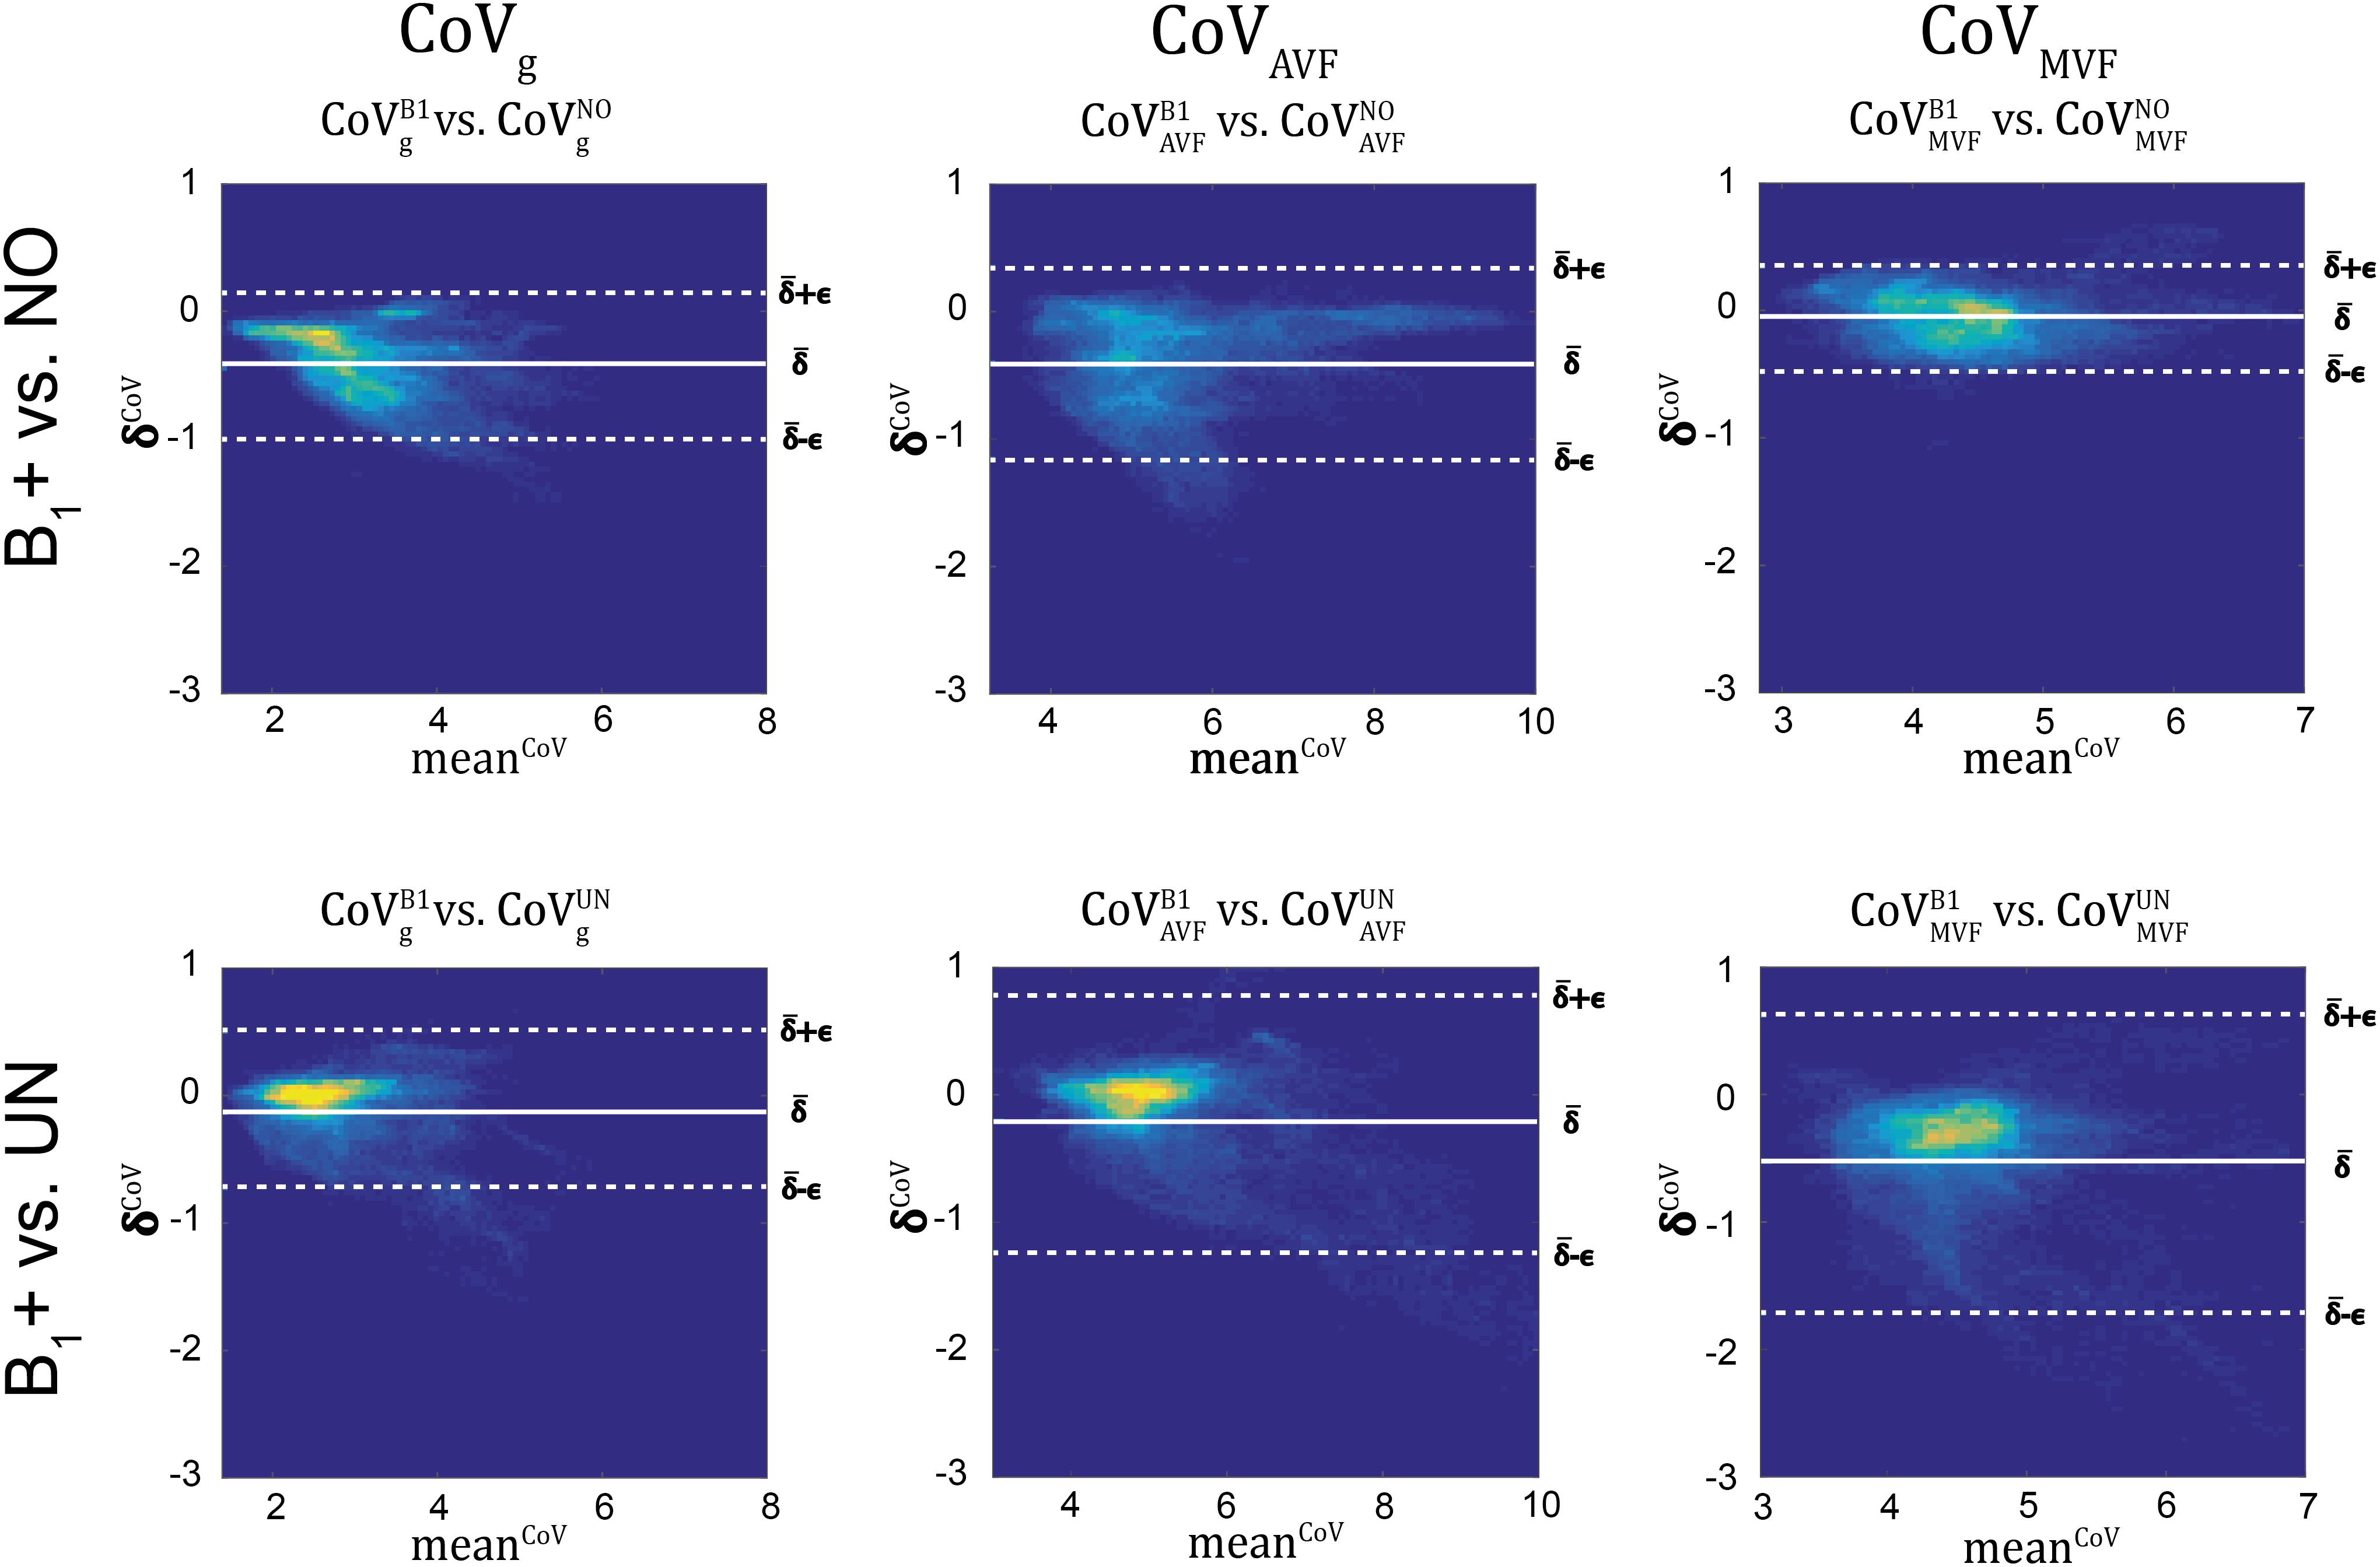
Figure 11. Bland-Altman density plots of CoVg, CoVAVF, and CoVMVF for no correction (NO, top row) and UNICORT B1+ correction (UN, bottom row) against the reference method (B1+) (yellow indicates high density and blue low). The Bland-Altman plot depicts the differences between the tested parameter maps and the reference method (e.g., ) against their mean (e.g., ) with k = {UN,NO} and i being the index of the ith region. The bold white line represents the bias (; N = number of voxels) and the dashed lines represent the error (]. The error and bias values are summarized in Table 5.
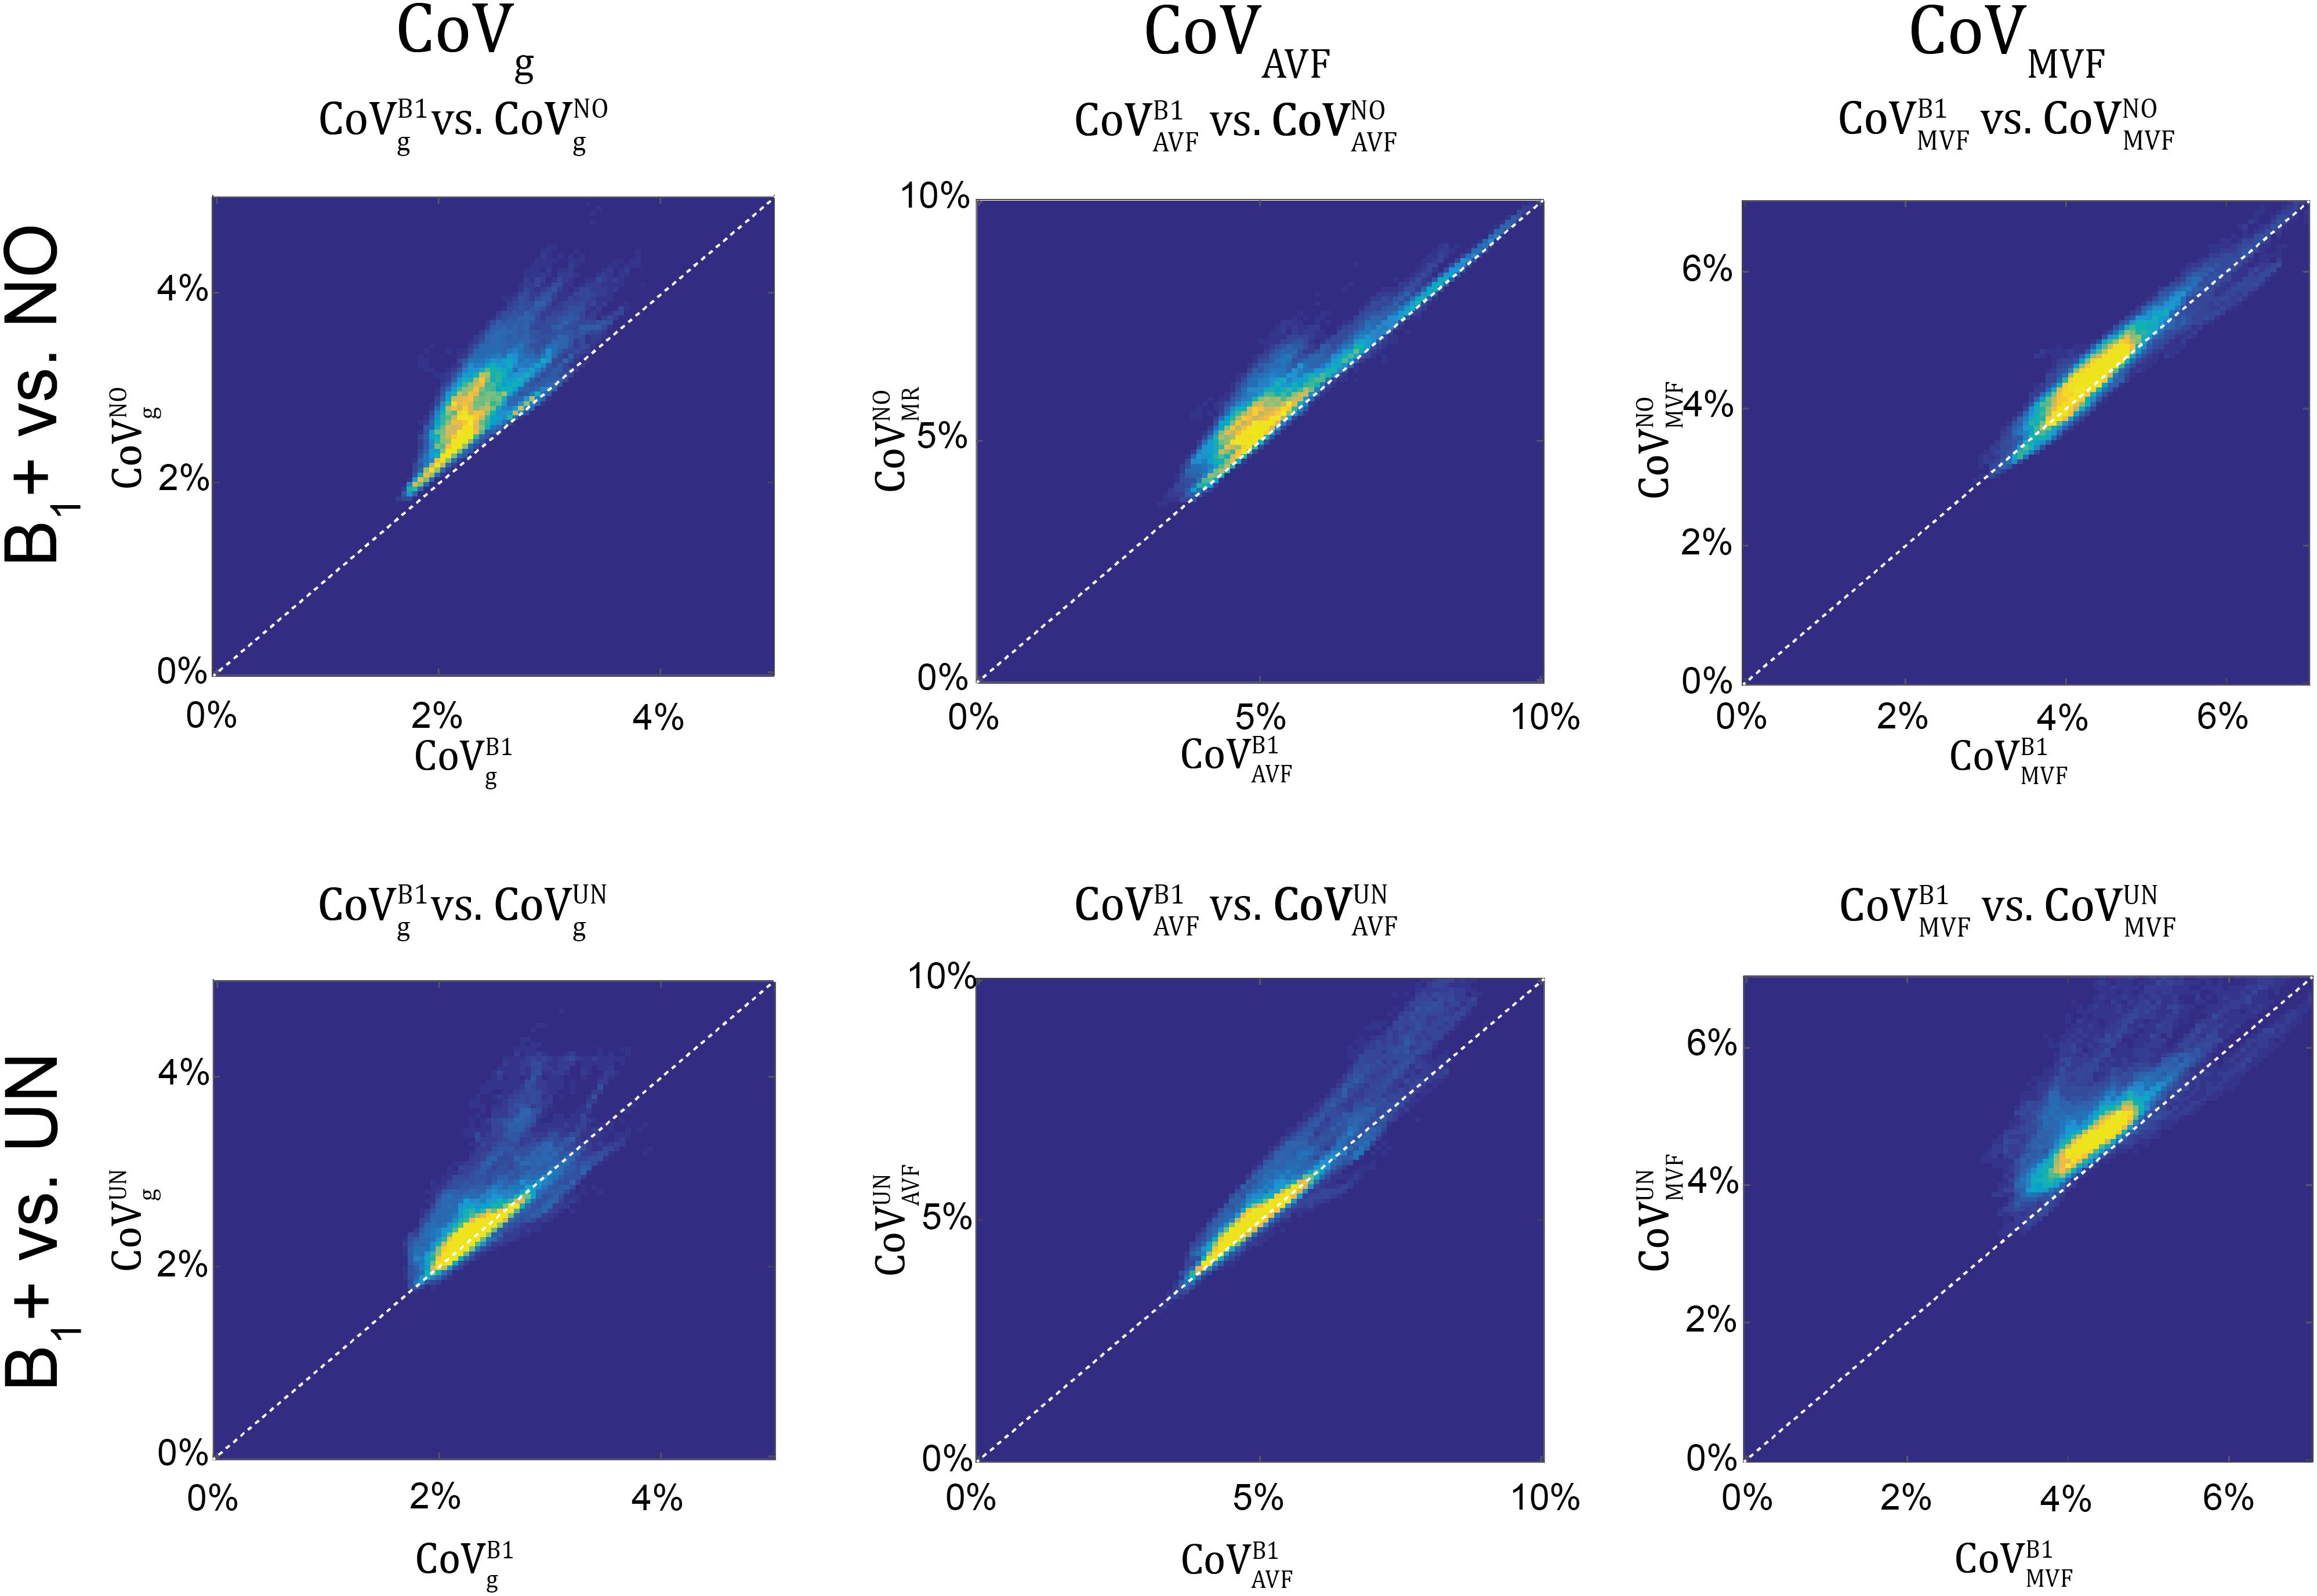
Figure 12. Scatter density plots of CoVg (left column), CoVAVF (middle column), and CoVMVF (right column), plotting values obtained with no correction (superscript: NO, top row) and with UNICORT B1+ correction (UN, bottom row) against values obtained by B1+ field map correction (superscript: B1). The unit slope line is plotted for orientation (dotted line). The dots in the scatter plots represent the WM voxels in the CoV maps in Figure 10 (yellow indicates high voxel density).
Discussion
In this study, we showed that omitting the correction of the magnetization transfer saturation map (MTsat) for residual B1 + effects introduces large error and bias in the MR g-ratio and the constituents (myelin and axon volume fractions, or in short MVFMR and AVFMR). We also demonstrated that this error and bias can be reduced by roughly a factor of three using the data-driven UNICORT B1+ correction (implemented in the hMRI toolbox, see text footnote 1) when a B1+ field measurement is unavailable.
The Effect of Omitting the B1+ Field Measurement
MTsat have been often used as a proxy for the MVFMR in g-ratio weighted imaging (Mohammadi et al., 2015; Campbell et al., 2018; Ellerbrock and Mohammadi, 2018; Hori et al., 2018; Kamagata et al., 2019), because they are directly linked to the macromolecular pool with an intrinsic correction for underlying longitudinal relaxation time and B1+ field inhomogeneities effects (Helms et al., 2008). Despite the latter intrinsic correction for B1+ field inhomogeneities, we found that the residual B1+ effects on MTsat map were still observable. In particular, the bias and error of the MR g-ratio (gMR) was about −89 and 37% higher, respectively, when omitting the B1+ correction. We found the same trend for MVFMR and AVFMR; while the error and bias were even larger for MVFMR when B1+ correction was omitted, it was smaller but still substantial for the AVFMR. We found that omitting B1 + leads to a substantially higher (more than 10-fold) bias in the MR g-ratio and its constituents when compared to a test-retest analysis of our data (Figure 7 and Table 3). Also, the error due to omitting the B1+ correction was twice as large as the error observed in the test retest analysis for the MR g-ratio and the MVF, whereas for AVF the errors were similar. We expect that the high error will be of particular relevance for group studies because it can be regarded as an error that evolves when replacing the reference method with the alternative method. For comparison, age-related changes assessed by g-ratio weighted imaging (Cercignani et al., 2017; Berman et al., 2018) have been reported to vary between 30 and 100% (in absolute values: gMR0.02–0.04 (Figure 5 in Cercignani et al., 2017). Consequently, the reported effect size of age-related changes would have become potentially undetectable if the B1+ field correction has been omitted in the study of Cercignani et al. (2017). The B1+ effect is particularly relevant for the MR g-ratio method by Cercignani et al. (2017) that combined quantitative MT (Gloor et al., 2008) with NODDI, because the qMT method does not possess an intrinsic correction for B1+ field inhomogeneities as opposed to the MTsat methods used here. Note that we reported, for better intuition, the bias and error relative to the dynamic range of the parameters across the investigated white matter (WM) ROIs (the dynamic range of gMR is △DR = 0.046; the absolute bias and error can be found in Table 4).
To reduce this source of bias and error, we propose a data-driven approach to correct for B1+ field inhomogeneities when no B1+ field measurement is available. To this end, we used UNICORT to estimate the B1+ field (Weiskopf et al., 2011). We found that using the UNICORT-estimated B1+ field to correct residual B1+ field inhomogeneities in MTsat reduces at the group level the bias and error in the MR g-ratio and its constituents by roughly a factor of three. However, the UNICORT estimated B1+ inhomogeneity can be erroneous with the error varying across subjects. To assess this variability, we estimated coefficient-of-variance (CoV) maps of gMR, AVFMR, and MVFMR for all three methods. In general, an increased CoV can be found at tissue boundaries (e.g., cerebral spinal fluid to WM) due to slight misregistration between the maps of axonal and myelin markers and/or imperfect normalization (Figure 10). Additionally, we found a strong increase in the bias and error of the CoV of MVF maps (increase in bias: 11% and in error: 18%) when UNICORT B1+ correction was used as compared to no correction. The CoV of gMR and AVFMR did not show a consistent trend: while the bias decreased, the error increased for both parameters. In other words, the UNICORT B1+ correction leads to higher accuracy in the g-ratio and its constituents but comes at the cost of a lower precision in MVF.
G-ratio, Myelin, and Axonal Volume Fraction Across the White Matter
Our and across the white matter were within the range of the reported values of previous studies (gMR: 0.64–0.76; AVFMR: 0.26–0.43 in (Cercignani et al., 2017; Berman et al., 2018). The range of was in the upper half of previously reported values (0.17–0.42 in Cercignani et al., 2017). Our slightly higher MVFMR values might be due to differences in the calibration approach: while we calculated the reference MVFREF from previously published ex-vivo histology data (Graf von Keyserlingk and Schramm, 1984), Cercignani et al. (2017), used a reference from previously published ex-vivo histology g-ratio data in the corpus callosum and Berman et al. (2018), did not perform any calibration assuming that macromolecular tissue volume and MVFMR are equal. An error in the calibration constant can lead to a bias in the MVF estimates which in turn leads to an error and bias in the MR g-ratio (Campbell et al., 2018).
Confounding Factors
As this study calculates the in-vivo MR g-ratio, there is no histological data available from the participants of this study, which could be used for calibration or as a gold standard reference. For calibration of MTsat to MVFMR, we estimated the histological MVF (MVFhist) from published ex-vivo data within the human medulla oblongata (Graf von Keyserlingk and Schramm, 1984). Since the reference MVFhist and the calibrated MTsat map were taken from different subjects, this might introduce a systematic bias in the MR g-ratio. However, since we found a relatively good agreement between our gMR, AVFMR, and MVFMR values with previously reported values obtained by a different calibration approach (Cercignani et al., 2017; Berman et al., 2018), we expect that it had a small effect on the results. Moreover, we focused on the effect of omitting B1+ correction, which will lead to additional inaccuracies in g-ratio weighted imaging, independent of the quality of the calibration.
Although, not reported in previous NODDI-based g-ratio mapping studies (Stikov et al., 2015; Cercignani et al., 2017; Jung et al., 2017; Mancini et al., 2017; Ellerbrock and Mohammadi, 2018; Hori et al., 2018), we found that the intra-cellular volume fraction (νicvf) determined with NODDI tends to be biased at small signal-to-noise ratios (SNR < 39), resulting in a ceiling effect, i.e., νicvf ≈ 1. To avoid a corresponding bias in gMR (and AVFMR), we restricted the analysis to regions with sufficiently high SNR (Figure 3). To investigate whether our findings generalize to low-SNR regions as well, we performed an additional Bland-Altman analysis of MVFMR in whole-WM ROIs. To this end, a larger set of ROIs was used covering the entire white matter. Although the bias was smaller for the whole-WM as compared to the high-SNR ROI analysis, we found the same trend: the error and bias were reduced when using UNICORT B1+ correction relative to no correction. Note that the smaller bias for the whole-WM analysis is most probably an artifact of the calibration procedure. Since the ROI used for calibration was not part of the high-SNR ROIs but was part of the whole-WM ROIs, we think it could have reduced the bias in the whole-WM ROI analysis as compared to the high-SNR analysis.
We note that the presented results were based on a customized B1+ mapping method (Lutti et al., 2010). Using vendor specific protocols for B1+ and MTsat mapping may influence the results (Leutritz et al., 2020). Moreover, the calibration factor in Equation (1) may have to be recalibrated for different MT-pulses.
Future studies should investigate the effect of B1+ correction on MR g-ratio mapping when using alternative biomarkers to estimate AVFMR and MVFMR (e.g., Ellerbrock and Mohammadi, 2018). Moreover, there are alternative B1+ mapping approaches available which might vary in precision (Lutti et al., 2010) and therefore can affect the MR g-ratio values. However, the differences in the precision of these methods are in the order of few percentage and thus much smaller than the effect of omitting the B1+ field or using the data-driven UNICORT B1+ estimate (Weiskopf et al., 2011).
Conclusion
In this study, we assessed the effect of B1+ correction on the accuracy of MR g-ratio as well as axonal and myelin volume fraction based on MTsat and NODDI. Our results demonstrate that B1+ correction via a measured B1+ field map is the method of choice. If the B1+ field map cannot be acquired, we propose the retrospective, data-driven UNICORT B1+ correction to estimate and correct for B1+ field inhomogeneities, which reduces the error and bias by a factor of three. UNICORT is implemented in the free and open-source hMRI toolbox (see text footnote 1).
Data Availability Statement
The datasets presented in this article are not readily available because the data that support the findings of this study are available on request from the corresponding author. The data have not been made freely available on the internet due to privacy or ethical restrictions. Requests to access the datasets should be directed to corresponding author.
Ethics Statement
The studies involving human participants were reviewed and approved by the Ärztekammer Hamburg. The patients/participants provided their written informed consent to participate in this study.
Author Contributions
SM and TE contributed to the conception and design of the study, performed statistical analysis and MRI processing, and wrote the first draft of the manuscript. All authors contributed substantially to revising the manuscript critically for intellectual content and have approved the submitted version.
Funding
This project was by the ERA-NET NEURON (hMRIofSCI), the Federal Ministry of Education and Research (BMBF; 01EW1711A and B), and the German Research Foundation (DFG Priority Program 2041 “Computational Connectomics,” (AL 1156/2-1;GE 2967/1-1; MO 2397/5-1; MO 2249/3–1), DFG Emmy Noether Stipend: MO 2397/4-1), and the Forschungszentrums Medizintechnik Hamburg (fmthh; grant 01fmthh2017). GH was supported by the Swedish Research Council (NT 2014-6193). PF was funded by a SNF Eccellenza Professorial Fellowship grant (PCEFP3_181362/1), and the European Union’s Horizon 2020 research, innovation programme (grant agreement no 634541). EB received funding from the European Structural and Investment Fund/European Regional Development Fund and the Belgian Walloon Government, project BIOMED-HUB (programme 2014–2020). Our gratitude extends also to Jürgen Finsterbusch for support on the MR side, to the University of Minnesota Centre for Magnetic Resonance Research for providing the image reconstruction algorithm for the simultaneous multislice acquisitions.
Conflict of Interest
The authors declare that the research was conducted in the absence of any commercial or financial relationships that could be construed as a potential conflict of interest.
Supplementary Material
The Supplementary Material for this article can be found online at: https://www.frontiersin.org/articles/10.3389/fnins.2021.674719/full#supplementary-material
Footnotes
References
André, E. D., Grinberg, F., Farrher, E. I, Maximov, I., Shah, N. J., Meyer, C., et al. (2014). Influence of noise correction on intra- and inter-subject variability of quantitative metrics in diffusion kurtosis imaging. PLoS One 9:e94531. doi: 10.1371/journal.pone.0094531
Ashburner, J. (2007). A fast diffeomorphic image registration algorithm. Neuroimage 38, 95–113. doi: 10.1016/j.neuroimage.2007.07.007
Berman, S., West, K. L., Does, M. D., Yeatman, J. D., and Mezer, A. A. (2018). Evaluating g-ratio weighted changes in the corpus callosum as a function of age and sex. Neuroimage 182, 304–313. doi: 10.1016/j.neuroimage.2017.06.076
Bland, J. M., and Altman, D. G. (1986). Statistical methods for assessing agreement between two methods of clinical measurement. Lancet 1, 307–310. doi: 10.1128/AAC.00483-18
Callaghan, M. F., Helms, G., Lutti, A., Mohammadi, S., and Weiskopf, N. (2015a). A general linear relaxometry model of R1 using imaging data. Magn. Reson. Med. 73, 1309–1314. doi: 10.1002/mrm.25210
Callaghan, M. F., Josephs, O., Herbst, M., Zaitsev, M., Todd, N., and Weiskopf, N. (2015b). An evaluation of prospective motion correction (PMC) for high resolution quantitative MRI. Front. Neurosci. 9:97. doi: 10.3389/fnins.2015.00097
Callaghan, M. F., Lutti, A., Ashburner, J., Balteau, E., Corbin, N., Draganski, B., et al. (2019). Example dataset for the hMRI toolbox. Data Brief 25:104132. doi: 10.1016/j.dib.2019.104132
Campbell, J. S. W., Leppert, I. R., Boudreau, M., Narayanan, S., Duval, T., Cohen-Adad, J., et al. (2018). Promise and pitfalls of g-ratio estimation with MRI. Neuroimage 182, 80–96. doi: 10.1016/j.neuroimage.2017.08.038
Cercignani, M., Giulietti, G., Dowell, N. G., Gabel, M., Broad, R., Leigh, P. N., et al. (2017). Characterizing axonal myelination within the healthy population: a tract-by-tract mapping of effects of age and gender on the fiber g-ratio. Neurobiol. Aging 49, 109–118. doi: 10.1016/j.neurobiolaging.2016.09.016
Ellerbrock, I., and Mohammadi, S. (2018). Four in vivo g -ratio-weighted imaging methods: comparability and repeatability at the group level. Hum. Brain Mapp. 39, 24–41. doi: 10.1002/hbm.23858
Feinberg, D. A., Moeller, S., Smith, S. M., Auerbach, E., Ramanna, S., Glasser, M. F., et al. (2010). Multiplexed echo planar imaging for sub-second whole brain FMRI and Fast Diffusion Imaging. Edited by Pedro Antonio Valdes-Sosa. PLoS One 5:e15710. doi: 10.1371/journal.pone.0015710
Gloor, M., Scheffler, K., and Bieri, O. (2008). Quantitative magnetization transfer imaging using balanced SSFP. Magn. Reson. Med. 60, 691–700. doi: 10.1002/mrm.21705
Graf von Keyserlingk, D., and Schramm, U. (1984). Diameter of axons and thickness of myelin sheaths of the pyramidal tract fibres in the adult human medullary pyramid. Anat. Anz. 157, 97–111. doi: 10.1097/PSY.0000000000000183
Helms, G. (2015). “Correction for residual effects of B1+ inhomogeniety on MT saturation in FLASH-based multi-parameter mapping of the brain,” in Proceedings of the International Society for Magnetic Resonance in Medicine Annual Meeting 2015, (Toronto: International Society for Magnetic Resonance in Medicine), 3360.
Helms, G., Dathe, H., Kallenberg, K., and Dechent, P. (2008). High–resolution maps of magnetization transfer with inherent correction for RF inhomogeneity and T 1 relaxation obtained from 3D FLASH MRI. Magn. Reson. Med. 60, 1396–1407. doi: 10.1002/mrm.21732
Helms, G., Weiskopf, N., and Lutti, A. (2021). Correction of FLASH-based MT saturation in human brain for residual bias of B1-inhomogeneity at 3T. arXiv [Preprint]. arXiv:210414878 [physics].
Hildebrand, C., and Hahn, R. (1978). Relation between myelin sheath thickness and axon size in spinal cord white matter of some vertebrate species. J. Neurol. Sci. 38, 421–434. doi: 10.1016/0022-510X(78)90147-8
Hori, M., Hagiwara, A., Fukunaga, I., Ueda, R., Kamiya, K., Suzuki, Y., et al. (2018). Application of quantitative microstructural MR imaging with atlas-based analysis for the spinal cord in cervical spondylotic myelopathy. Sci. Rep. 8, 1–8. doi: 10.1038/s41598-018-23527-8
Hua, K., Zhang, J., Wakana, S., Jiang, H., Li, X., Reich, D. S., et al. (2008). Tract probability maps in stereotaxic spaces: analyses of white matter anatomy and tract-specific quantification. Neuroimage 39, 336–347. doi: 10.1016/j.neuroimage.2007.07.053
Jung, W., Lee, J., Shin, H. G., Nam, Y., Zhang, H., Oh, S. H., et al. (2017). Whole brain g-ratio mapping using myelin water imaging (MWI) and neurite orientation dispersion and density imaging (NODDI). Neuroimage 19, 109–118. doi: 10.1016/j.neuroimage.2017.09.053
Kamagata, K., Zalesky, A., Yokoyama, K., Andica, C., Hagiwara, A., Shimoji, K., et al. (2019). MR g-ratio-weighted connectome analysis in patients with multiple sclerosis. Sci. Rep. 9:13522. doi: 10.1038/s41598-019-50025-2
LaMantia, A.-S., and Rakic, P. (1990). Cytological and quantitative characteristics of four cerebral commissures in the rhesus monkey. J. Comp. Neurol. 291, 520–537. doi: 10.1002/cne.902910404
Lehmenkühler, A., Syková, E., Svoboda, J., Zilles, K., and Nicholson, C. (1993). Extracellular space parameters in the rat neocortex and subcortical white matter during postnatal development determined by diffusion analysis. Neuroscience 55, 339–351. doi: 10.1016/0306-4522(93)90503-8
Leutritz, T., Seif, M., Helms, G., Samson, R. S., Curt, A., Freund, P., et al. (2020). Multiparameter mapping of relaxation (R1, R2∗), proton density and magnetization transfer saturation at 3 T: a multicenter dual-vendor reproducibility and repeatability study. Hum. Brain Mapp. 41, 4232–4247. doi: 10.1002/hbm.25122
Liewald, D., Miller, R., Logothetis, N., Wagner, H.-J., and Schüz, A. (2014). Distribution of axon diameters in cortical white matter: an electron-microscopic study on three human brains and a macaque. Biol. Cybern. 108, 541–557. doi: 10.1007/s00422-014-0626-2
Lutti, A., Hutton, C., Finsterbusch, J., Helms, G., and Weiskopf, N. (2010). Optimization and validation of methods for mapping of the radiofrequency transmit field at 3T. Magn. Reson. Med. 238, 229–238. doi: 10.1002/mrm.22421
Macdonald, J., and Ruthotto, L. (2018). Improved susceptibility artifact correction of echo-planar MRI using the alternating direction method of multipliers. J. Math. Imaging Vis. 60, 268–282. doi: 10.1007/s10851-017-0757-x
Mancini, M., Giulietti, G., Dowell, N., Spanò, B., Harrison, N., Bozzali, M., et al. (2017). Introducing axonal myelination in connectomics: a preliminary analysis of g-ratio distribution in healthy subjects. Neuroimage 182, 351–359. doi: 10.1016/j.neuroimage.2017.09.018
Moeller, S., Yacoub, E., Olman, C. A., Auerbach, E., Strupp, J., Harel, N., et al. (2010). Multiband multislice GE-EPI at 7 tesla, with 16-fold acceleration using partial parallel imaging with application to high spatial and temporal whole-brain FMRI. Magn. Reson. Med. 63, 1144–1153. doi: 10.1002/mrm.22361
Mohammadi, S., and Callaghan, M. F. (2020). Towards in vivo g-ratio mapping using MRI: unifying myelin and diffusion imaging. J. Neurosci. Methods 348:108990. doi: 10.1016/j.jneumeth.2020.108990
Mohammadi, S., Carey, D., Dick, F., Diedrichsen, J., Sereno, M. I., Reisert, M., et al. (2015). Whole-brain in-vivo measurements of the axonal g-ratio in a group of 37 healthy volunteers. Front. Neurosci. 9:441. doi: 10.3389/fnins.2015.00441
Mohammadi, S., Möller, H. E., Kugel, H., Müller, D. K., and Deppe, M. (2010). Correcting eddy current and motion effects by affine whole-brain registrations: evaluation of three-dimensional distortions and comparison with slicewise correction. Magn. Reson. Med. 64, 1047–1056. doi: 10.1002/mrm.22501
Mohammadi, S., Tabelow, K., Ruthotto, L., Feiweier, T., Polzehl, J., and Weiskopf, N. (2014). High-resolution diffusion kurtosis imaging at 3t enabled by advanced post-processing. Front. Neurosci. 8:427. doi: 10.3389/fnins.2014.00427
Nicholson, C., and Hrabìtová, S. (2017). Brain extracellular space: the final frontier of neuroscience. Biophys. J. 113, 2133–2142. doi: 10.1016/j.bpj.2017.06.052
Olivares, R., Montiel, J., and Aboitiz, F. (2001). Species differences and similarities in the fine structure of the mammalian corpus callosum. Brain Behav. Evol. 57, 98–105. doi: 10.1159/000047229
Reese, T. G., Heid, O., Weisskoff, R. M., and Wedeen, V. J. (2003). Reduction of eddy-current-induced distortion in diffusion MRI using a twice-refocused spin echo. Magn. Reson. Med. 49, 177–182. doi: 10.1002/mrm.10308
Ruthotto, L., Kugel, H., Olesch, J., Fischer, B., Modersitzki, J., Burger, M., et al. (2012). Diffeomorphic susceptibility artifact correction of diffusion-weighted magnetic resonance images. Phys. Med. Biol. 57, 5715–5731. doi: 10.1088/0031-9155/57/18/5715
Ruthotto, L., Mohammadi, S., Heck, C., Modersitzki, J., and Weiskopf, N. (2013). “Hyperelastic susceptibility artifact correction of DTI in SPM,” in Bildverarbeitung Für Die Medizin 2013, eds H. P. Meinzer, T. Deserno, H. Handels, and T. Tolxdorff (Berlin: Springer), 344–349. doi: 10.1007/978-3-642-36480-8_60
Sereno, M. I., Lutti, A., Weiskopf, N., and Dick, F. (2013). Mapping the human cortical surface by combining quantitative T1 with retinotopy. Cereb. Cortex 23, 2261–2268. doi: 10.1093/cercor/bhs213
Setsompop, K., Gagoski, B. A., Polimeni, J. R., Witzel, T., Wedeen, V. J., and Wald, L. L. (2012). Blipped-controlled aliasing in parallel imaging for simultaneous multislice echo planar imaging with reduced g-factor penalty. Magn. Reson. Med. 67, 1210–1224. doi: 10.1002/mrm.23097
Stikov, N., Campbell, J. S., Stroh, T., Lavelée, M., Frey, S., Novek, J., et al. (2015). In vivo histology of the myelin g-ratio with magnetic resonance imaging. Neuroimage 118, 397–405. doi: 10.1016/j.neuroimage.2015.05.023
Stikov, N., Perry, L. M., Mezer, A., Rykhlevskaia, E., Wandell, B. A., Pauly, J. M., et al. (2011). Bound pool fractions complement diffusion measures to describe white matter micro and macrostructure. Neuroimage 54, 1112–1121. doi: 10.1016/j.neuroimage.2010.08.068
Swadlow, H. A., Waxman, S. G., and Geschwind, N. (1980). Small-diameter nonmyelinated axons in the primate corpus callosum. Arch. Neurol. 37, 114–115. doi: 10.1001/archneur.1980.00500510072016
Tabelow, K., Balteau, E., Ashburner, J., Callaghan, M. F., Draganski, B., Helms, G., et al. (2019). hMRI – A toolbox for quantitative MRI in neuroscience and clinical research. Neuroimage 194, 191–210.
Tønnesen, J., Inavalli, V. V. G. K., and Nägerl, U. V. (2018). Super-resolution imaging of the extracellular space in living brain tissue. Cell 172, 1108–1121. doi: 10.1016/j.cell.2018.02.007
Wang, S. S., Shultz, J. R., Burish, M. J., Harrison, K. H., Hof, P. R., Towns, L. C., et al. (2008). Functional trade-offs in white matter axonal scaling. J. Neurosci. 28, 4047–4056. doi: 10.1523/JNEUROSCI.5559-05.2008
Weiskopf, N., Lutti, A., Helms, G., Novak, M., Ashburner, J., and Hutton, C. (2011). Unified segmentation based correction of R1 brain maps for RF transmit field inhomogeneities (UNICORT). Neuroimage 54, 2116–2124. doi: 10.1016/j.neuroimage.2010.10.023
Weiskopf, N., Suckling, J., Williams, G., Correia, M. M., Inkster, B., Tait, R., et al. (2013). Quantitative multi-parameter mapping of R1, PD(∗), MT, and R2(∗) at 3T: a multi-center validation. Front. Neurosci. 7:95. doi: 10.3389/fnins.2013.00095
West, K. L., Kelm, N. D., Carson, R. P., and Does, M. D. (2016). A revised model for estimating g-ratio from MRI. Neuroimage 125, 1155–1158. doi: 10.1016/j.neuroimage.2015.08.017
Xu, J., Moeller, S., Auerbach, E. J., Strupp, J., Smith, S. M., Feinberg, D. A., et al. (2013). Evaluation of slice accelerations using multiband echo planar imaging at 3T. Neuroimage 83, 991–1001. doi: 10.1016/j.neuroimage.2013.07.055
Yu, F., Fan, Q., Tian, Q., Ngamsombat, C., Machado, N., Bireley, J. D., et al. (2019). Imaging g-ratio in multiple sclerosis using high-gradient diffusion mri and macromolecular tissue volume. AJNR Am. J. Neuroradiol. 40, 1871–1877. doi: 10.3174/ajnr.A6283
Keywords: myelin volume fraction, axon volume fraction, radio-frequency transmit field inhomogeneities, B1+ correction, multi-parameter mapping, diffusion MRI, magnetization transfer saturation, MR g-ratio
Citation: Emmenegger TM, David G, Ashtarayeh M, Fritz FJ, Ellerbrock I, Helms G, Balteau E, Freund P and Mohammadi S (2021) The Influence of Radio-Frequency Transmit Field Inhomogeneities on the Accuracy of G-ratio Weighted Imaging. Front. Neurosci. 15:674719. doi: 10.3389/fnins.2021.674719
Received: 01 March 2021; Accepted: 01 June 2021;
Published: 05 July 2021.
Edited by:
Tim B. Dyrby, Technical University of Denmark, DenmarkReviewed by:
Viktor Vegh, The University of Queensland, AustraliaOlivier Commowick, Inria Rennes–Bretagne Atlantique Research Centre, France
Copyright © 2021 Emmenegger, David, Ashtarayeh, Fritz, Ellerbrock, Helms, Balteau, Freund and Mohammadi. This is an open-access article distributed under the terms of the Creative Commons Attribution License (CC BY). The use, distribution or reproduction in other forums is permitted, provided the original author(s) and the copyright owner(s) are credited and that the original publication in this journal is cited, in accordance with accepted academic practice. No use, distribution or reproduction is permitted which does not comply with these terms.
*Correspondence: Siawoosh Mohammadi, cy5tb2hhbW1hZGlAdWtlLmRl